

Abstract
Objective
White matter hyperintensities (WMHs) are linked to vascular risk factors and increase the risk of cognitive decline, dementia, and stroke. We here aimed to determine whether obesity contributes to regional WMHs using a whole‐brain approach in a well‐characterized population‐based cohort.
Methods
Waist‐to‐hip ratio (WHR), body mass index (BMI), systolic/diastolic blood pressure, hypertension, diabetes and smoking status, blood glucose and inflammatory markers, as well as distribution of WMH were assessed in 1,825 participants of the LIFE‐adult study (age, 20–82 years; BMI, 18.4–55.4 kg/m2) using high‐resolution 3‐Tesla magnetic resonance imaging. Voxel‐wise analyses tested if obesity predicts regional probability of WMH. Additionally, mediation effects of high‐sensitive C‐reactive protein and interleukin‐6 (IL6) measured in blood were related to obesity and WMH using linear regression and structural equation models.
Results
WHR related to higher WMH probability predominantly in the deep white matter, even after adjusting for effects of age, sex, and systolic blood pressure (mean ß = 0.0043 [0.0008 SE], 95% confidence interval, [0.00427, 0.0043]; threshold‐free cluster enhancement, family‐wise error‐corrected p < 0.05). Conversely, higher systolic blood pressure was associated with WMH in periventricular white matter regions. Mediation analyses indicated that both higher WHR and higher BMI contributed to increased deep‐to‐periventricular WMH ratio through elevated IL6.
Interpretation
Our results indicate an increased WMH burden selectively in the deep white matter in obese subjects with high visceral fat accumulation, independent of common obesity comorbidities such as hypertension. Mediation analyses proposed that visceral obesity contributes to deep white matter lesions through increases in proinflammatory cytokines, suggesting a pathomechanistic link. Longitudinal studies need to confirm this hypothesis. ANN NEUROL 2019;85:194–203.
White matter hyperintensities (WMH) are common lesions in the white matter that vary in configuration, extent, and signal intensity.1 They start to accumulate during the adult life span, with already 50% at age 40 showing WMH, rising to a 95% prevalence rate in those aged ≥60 years.2, 3 A major risk factor for WMH beyond older age is hypertension,4 in particular, higher systolic blood pressure.5 Moreover, WMH have been linked to smoking,6 type 2 diabetes,7 and recently also to obesity,8, 9 a growing challenge to public health in today's societies.10 Longitudinal cohort data indicate that WMH load is associated with higher risk of cognitive decline, dementia, and stroke.11, 12
Research over the past 30 years has reached consensus that most WMH are attributed to cerebral small‐vessel disease,13 referring to pathologies such as arteriosclerosis, amyloid angiopathy, and blood–brain barrier breakdown affecting small cerebral arteries, arterioles, venules, and capillaries.14 These vascular pathologies eventually lead to tissue damage that can impact brain function, histologically evident as (incomplete or complete) infarcts, demyelination, loss of oligodendrocytes, and/or axonal damage.15 The link between WMH and the well‐known risk factors, including obesity, however, is not completely understood. This issue is of highest relevance given that, so far, modification of vascular risk factors has shown only limited effects to slow the progression of WMH.16
Interestingly, variations in location and configuration of WMH may differentially relate to pathomechanisms and risk factors. Particularly, the distinction between patchy WMH around the ventricles (periventricular, pvWMH) versus more confluent WMH in the deep white matter (dWMH) may be of relevance.17 A recent study showed that dWMH and pvWMH differ not only in markers of tissue microstructure derived from diffusion weighted imaging, but also in correlated risk factors and cognitive effects.18 Also, alcohol intake and smoking were associated with higher WMH probability in selective regions according to a more fine‐graded spatial WMH analysis.19
However, spatial distributions of WMH on magnetic resonance imaging (MRI) have largely been neglected. Taking these spatial patterns into account could help to better understand the complex and presumably multifactorial pathomechanisms, especially considering less well‐defined risk factors, such as obesity. Notably, obesity and visceral fat especially contribute to systemic low‐grade inflammation through release of cytokines such as interleukin‐6 (IL6) and C‐reactive protein (CRP).20 Systemic inflammation has also been suggested to affect white matter,21 and circulating cytokines were related to increased WMH volume in several large cohorts.22, 23, 24 Thus, low‐grade inflammation could be an independent mechanism of obesity‐related white matter damage.
Here, we examined the topographical distribution of WMH in relation to obesity, measured using body mass index (BMI) and waist‐to‐hip ratio (WHR), and further important risk factors of WMH in a well‐characterized large cohort study (n = 1,825), using a voxel‐wise approach in addition to total lesion load and dWMH/pvWMH ratio. We hypothesized that distinct lesion patterns are associated with visceral obesity and other common risk factors. We further tested whether inflammatory factors mediate obesity‐associated effects on total and localized WMH volume.
Participants and Methods
Participants
Participants were drawn from the population‐based study of the Leipzig Research Centre for Civilization Diseases (LIFE).25 The Ethics Committee of the Medical Faculty of the University of Leipzig approved the study protocol, and all participants provided written informed consent. Briefly, participants underwent a 3‐Tesla (T) MRI head scan and an extensive battery of medical assessments. Of 2,637 participants with MRI, we selected a subsample of 1,825 participants after excluding participants with brain pathology attributed to stroke, multiple sclerosis, intracranial hemorrhage, or brain tumors. Furthermore, we excluded participants with missing information of risk factors or laboratory markers, and participants with failed MRI preprocessing. For a detailed overview of the selection process, see Figure 1.
Figure 1.
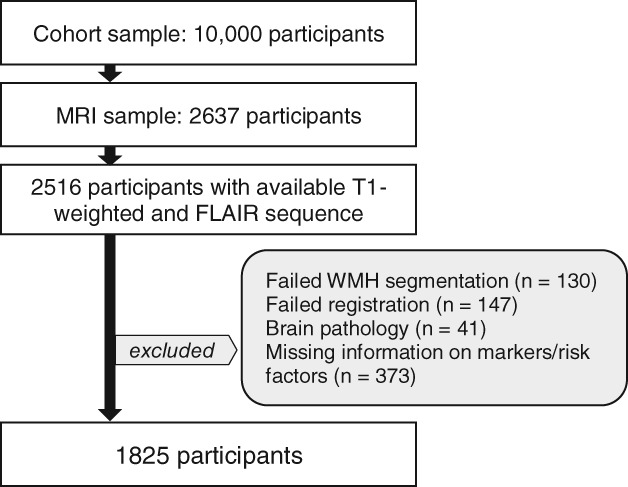
Flow chart visualizing the selection process of the MRI sample. MRI = magnetic resonance imaging, FLAIR = Fluid‐attenuated inversion recovery, WMH = white matter hyperintensities.
Cerebrovascular Risk Factors
All participants underwent anthropometric assessments. WHR was measured using an ergonomic circumference measuring tape (seca 201; seca, Hamburg, Germany) to the nearest 0.1 cm as continuous measure of obesity that reflects the proportion of abdominal fat. BMI was measured as mass(weight)‐height‐ratio (in kg/m2). Systolic and diastolic blood pressure (in mmHg) were measured in a seated position at rest and as the mean of the latter two of three consecutive measurements.26 The categorical diagnosis “hypertension” was defined as intake of antihypertensive medication or systolic blood pressure ≥ 140 mmHg or diastolic blood pressure ≥ 90 mmHg, the categorical diagnosis “diabetes" was defined either by self‐reported diagnosis or intake of antidiabetic medication, or in those with missing information by glycated hemoglobin A1c (HbA1c) ≥6.5%. Participants were characterized as nonsmokers, former smokers, and active smokers, assuming a linear effect, based on self‐report. All participants donated blood after fasting overnight and HbA1c (%), high‐sensitive CRP (in mg/dl), and IL6 (in ng/l) were measured according to standard procedures. Note that IL6 was not available in n = 453 because of technical problems.
MRI Data Acquisition
All MRI scans were performed at 3 T on a MAGNETOM Verio scanner (Siemens, Erlangen, Germany). The body coil was used for radiofrequency transmission, and a 32‐channel head coil was used for signal reception. T1‐weighted magnetization prepared rapid acquisition gradient echo (MPRAGE) and fluid‐attenuated inversion recovery (FLAIR) images were acquired as part of a standardized protocol: MPRAGE (flip angle = 9 degrees, relaxation time [TR] = 2,300 ms, inversion time [TI] = 900 ms, echo time [TE] = 2.98 ms, 1‐mm isotropic resolution, acquisition time [AT] = 5.10 minutes); FLAIR (TR = 5,000 ms, TI = 1,800 ms, TE = 395 ms, 1 × 0.49 × 0.49 mm resolution, AT = 7.02 minutes).
Automated Assessment of WMH
Before segmentation, all images were carefully checked by a radiologist for incidental findings. Participants with hemorrhagic infarctions, ischemic infarctions, or other neuroradiological incidental findings were excluded from the analysis. Lesion TOADS—a computer‐based WMH segmentation algorithm that was previously validated and adapted for population‐based data—automatically determined WMH volume on T1‐weighted MPRAGE and FLAIR images.27, 28 Binary WMH maps of all participants were nonlinearly coregistered to a standardized Montréal Neurological Institute (MNI) template (1‐mm isometric) by applying the transformation matrix obtained from coregistering the MPRAGE of the respective participant to the template with ANTS.29 This registration technique ensured a low amount of warping while aligning accurately the main morphological features of the brain (ventricles, white matter tracts, subcortex, and overall shape and size of the cerebral cortex). We afterward carefully inspected every standardized image. Participants were excluded for erroneous skull‐stripping, motion or inhomogeneity artifacts, misregistration of the T1‐weighted and FLAIR data, or incorrect warping onto the MNI template. For standard space lesion maps across participants, WMH maps were added to create a WMH frequency map with FSL.30
We followed the previously used standard of 10‐mm distance to the ventricular surface to segregate pvWMH and dWMH.31 Every voxel of WMH that was located within this border was classified as pvWMH and voxels outside that border were classified as dWMH. Regional WMH volume was calculated for the deep and periventricular white matter. Subsequently, the ratio of dWMH and pvWMH (dWMH/pvWMH) was calculated. A constant value 1 was added to every participant's regional dWMH volume because there were participants without lesions in the deep white matter.
Statistical Analysis
Obesity‐Related WMH Distribution
To test the association between obesity and WMH topography, we performed a whole‐brain voxel‐wise inference analysis based on a logistic regression approach. BMI or WHR were entered as a continuous predictor for WMH occurrence, adjusting for linear and quadratic effects of age and effects of sex. The voxel‐wise statistical model was generated using the GLM tool in FSL (https://www.fmrib.ox.ac.uk/fsl) with the probability of WMH in each voxel as dependent variable and BMI or WHR as independent variable. Age, age squared, sex, and an error term were entered as further independent variables of no interest into the model. Associations of further common risk factors, that is, systolic or diastolic blood pressure, hypertension, smoking, diabetes, and HbA1c with WMH were tested using similar models. Risk factors were considered as potential confounders for the associations between obesity and WMH and added as covariates in the above‐described model if showing significant effects on WMH occurrence.
Voxels without WMH in at least 5 participants were masked out to avoid overinterpretation of outliers or influential cases. For computational purposes, the standard space WMH mask for each participant was downsampled to 2 mm isovoxel. Nonparametric inference was tested based on random permutations using FSL randomize with 10,000 random permutations. Briefly, after regressing covariates of no interest from the WMH masks, in each permutation step, whole‐brain linear regression was calculated on a participant‐wise reordered set of residualized WMH masks and dependent variables of interest.32 Multiple comparisons were corrected across space using family‐wise error (FWE) based on permutation testing at a threshold‐free‐cluster enhancement (TFCE) level of p < 0.05.33 Mean contrast parameter estimates (mean ß) and mean standard errors (SEß) were extracted in clusters surviving the significance threshold, using the respective three‐dimensional statistical maps. Mean 95% confidence intervals (CI) were calculated using the formula CI = ß ± t[((1‐alpha)/2), (n‐df‐1)] * SEß.
Linear Regression Analysis
In exploratory linear regression models, we tested for the effects of obesity (operationalized by continuous measures BMI and WHR) on total WMH lesion volume and on regional distribution of WMH volume (ie, dWMH/pvWMH). Therefore, we entered total WMH volume or dWMH/pvWMH as dependent variable and BMI or WHR as predictor. In addition, we checked separately for associations with dWMH volume, pvWMH volume, and cardiovascular or inflammatory markers, that is, systolic and diastolic blood pressure, smoking, HbA1c, CRP, and IL6, entered as independent variables. Age, sex, and an error term were entered as independent variables of no interest into the regression models. Age squared was added as a further covariate to control for nonlinear effects of age in the models testing WMH volumes. Analyses were performed with R (http://www.R-project.org/). Total, deep, and periventricular WMH volumes were normalized to head size by total intracranial volume. Total WMH, dWMH, pvWMH, dWMH/pvWMH, CRP, and IL6 were log‐transformed. The models were checked for normal distribution of the residuals and homoscedasticity by visually checking the residuals plots, QQ‐Plots, and relation of fitted values over residuals. Significance was set at alpha = 0.05. As further measures of effect, we estimated the unique contribution of the predictors to R2 with semipartial correlation coefficients (sr2). Sr2 were calculated with Pearson's correlations of the dependent variable with the residuals of the predictor of interest after regressing age and sex.
Mediation Analysis
Subject to the condition that obesity would predict total WMH and/or dWMH/pvWMH ratio, simple mediation analyses were conducted to detect potential mediating effects of obesity‐related inflammatory markers. Therefore, ordinary least squares regression path analyses were computed using R with the “mediation” package34 for estimating total, direct, and indirect effects in a simple singular mediation model; analyses were corrected for the linear and quadratic effects of age as well as for sex (see Fig 2 for illustration). Effects were considered significant if a 99% bias‐corrected bootstrap CI of the path coefficients excluded zero, based on 10,000 bootstrap resamples. For the purpose of comparability of beta coefficients, variables were z‐scored.
Figure 2.
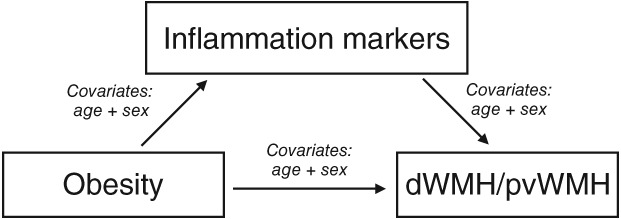
Illustration of the mediation analysis.
Data Availability
Whole‐brain statistical maps are available online at https://neurovault.org/collections/3516. LesionTOADS is distributed as a plugin to MIPAV software developed by NIH available at https://mipav.cit.nih.gov/.
Results
Descriptives
We included 1,825 participants with ages ranging from 20 to 82 years, of which 43.7% were women. Please see Table 1 for demographics, cardiovascular risk factors, and inflammatory biomarkers.
Table 1.
Descriptive Data of the Cohort (n = 1,825)
| Parameter | Mean or n | SD or % | Median | Min | Max |
|---|---|---|---|---|---|
| Women/men | 797/1,028 | 43.7/56.3 | |||
| Age, yr | 59.44 | 14.55 | 64.73 | 20.12 | 82.40 |
| BMI (in kg/m2) | 27.02 | 4.18 | 26.50 | 18.44 | 55.36 |
| WHR | 0.93 | 0.09 | 0.94 | 0.64 | 1.18 |
| Hypertension, yes/no | 781/1,044 | 42.8/57.2 | |||
| Diastolic BP, in mmHg | 75 | 9.59 | 75 | 44 | 120 |
| Systolic BP, in mmHg | 130 | 16.48 | 129 | 87 | 201 |
| Never/former/active smokers | 1,006/550/269 | 55.1/30.1/14.7 | |||
| HbA1c (in %) | 5.41 | 0.58 | 5.33 | 3.78 | 12.38 |
| Diabetes, yes/no | 181/1,644 | 9.9/90.1 | |||
| CRP, in mg/dl | 2.50 | 5.32 | 1.39 | 0.15 | 146.92 |
| IL6, in ng/l (n = 1,372) | 3.51 | 4.09 | 2.47 | 1.5 | 74.28 |
| WMH volume, in mm3 | 2,835 | 5,816.2 | 1,260 | 2 | 78,509 |
| dWMH volume, in mm3 | 1,151.28 | 3,483.7 | 365 | 0 | 54,688 |
| pvWMH volume, in mm3 | 2,287.86 | 3,409.24 | 1,206 | 2 | 35,253 |
| dWMH/pvWMH ratio | 0.42 | 0.42 | 0.31 | 0.01 | 4.53 |
BMI = body mass index; BP = blood pressure; CRP = high‐sensitive C‐reactive protein; HbA1c = glycated hemoglobin A1c; IL6 = interleukin‐6; SD = standard deviation; WHR = waist‐to‐hip ratio; WMH = white matter hyperintensity; dWMH = deep white matter hyperintensity; pvWMH = periventricular white matter hyperintensity.
Topographic Distribution of WMH
We found a distinct regional pattern where higher WHR was associated with a higher probability of WMH after adjusting for age and sex (voxel‐wise permutation testing, mean ß = 0.0044, mean SEß = 0.0008, 95% CI [0.00447, 0.00450], TFCE and FWE corrected p < 0.05; Fig 3). Accordingly, WMH in the deeper white matter were associated with higher WHR independent of age and sex. These effects remained stable when additionally controlling for differences in systolic blood pressure—a risk factor that was strongly associated with WMH probability in the periventricular white matter (mean ß = 0.0043, mean SEß = 0.0008, 95% CI [0.00427, 0.0043], TFCE and FWE corrected p < 0.05; Fig. 3). Also, though to a lesser degree, diastolic blood pressure, the diagnosis of hypertension, and smoking were significantly associated with a higher probability of WMH in periventricular regions after controlling for effects of age (data available at: https://neurovault.org/collections/3516). Controlling for hypertension, systolic and diastolic blood pressure, smoking, as well as age and sex in a comprehensive model, the effect of WHR on deep WMH probabilities was not attenuated (data not shown). Correcting for BMI also did not attenuate the association of WHR and deep WMH probabilities. We did not observe age‐ and sex‐independent effects of BMI, diabetes, or HbA1c on WMH topology.
Figure 3.
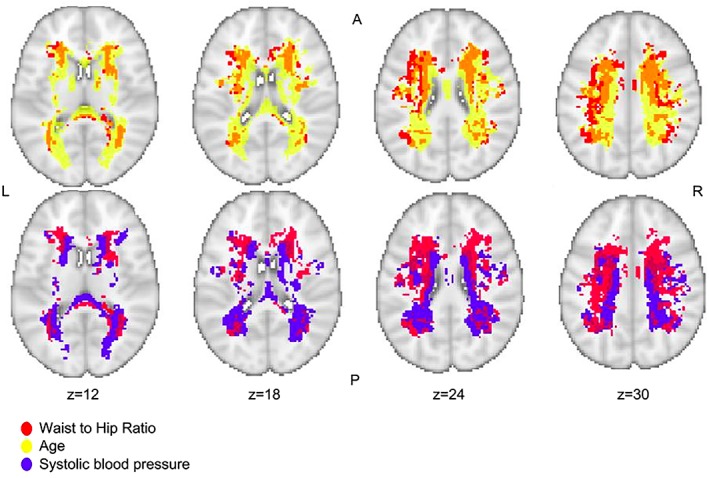
Relation between regional white matter hyperintensity probability and higher waist‐to‐hip ratio (linear, red), higher systolic blood pressure (linear, blue), and higher age (exponential, yellow; TFCE, p < 0.05, FWE corrected). This figure is layered on a T1‐weighted image (coordinates according to the MNI125 template); A = anterior; L = left; R = right; P = posterior; n = 1,825. FWE = family‐wise error; TFCE, threshold‐free cluster enhancement.
Periventricular Versus Deep WMH in Obesity
Our topographical analysis suggested that WHR predominantly related to WMH in the deep white matter. Accordingly, WHR significantly predicted dWMH/pvWMH in a linear regression model (standardized β = 1.01, 95% CI [0.32, 1.70], sr2 = 0.0042, p = 0.004; Table 2). Also, BMI was significantly associated with dWMH/pvWMH (standardized β = 0.06, 95% CI [0.002, 0.023], sr2 = 0.0028, p = 0.024). CRP and IL6 were significantly associated with dWMH/pvWMH as well (CRP: standardized β = 0.05, 95% CI [0.006, 0.098], sr2 = 0.0025, p = 0.03; IL6: standardized β = 0.07, 95% CI [0.029, 0.18], sr2 = 0.0053, p = 0.007). We found no significant association between dWMH/pvWMH and HbA1c, systolic or diastolic blood pressure, and smoking status (Table 2). Likewise, there was no evidence for an interaction effect of WHR with hypertension (p WHR*hypertension = 0.58), diabetes (p WHR*diabetes = 0.84), or smoking (p WHR*smoking = 0.65) on dWMH/pvWMH. However, total WMH volume was significantly predicted by BMI, WHR, systolic and diastolic blood pressure, HbA1c, smoking status, CRP, and IL6 after correcting for age and sex (see Table 2 for details). When analyzing dWMH and pvWMH volumes separately, results showed that both obesity measures predicted dWMH volume and, to a lesser degree, pvWMH volume in both unadjusted and adjusted models (Table 2). Note that dWMH and pvWMH were highly correlated (r = 0.84, 95% CI [0.82, 0.85], p < 0.001).
Table 2.
Effects of Obesity, Cardiovascular Risk Factors, and Inflammatory Markers on Global Markers of WMH Distribution, and Load, According to Linear Regression Models Controlled for Age and Sex
| dWMH/pvWMH | Total WMH Volume | ||||||
|---|---|---|---|---|---|---|---|
| n | βs; β, [95% CI] | p | sr2 | βs; β, [95% CI] | p | sr2 | |
| BMI | 1,825 | 0.056; 0.013 [0.002–0.023] | 0.018 | 0.0030 | 0.053; 0.013 [0.004–0.023] | 0.005 | 0.0024 |
| WHR | 1,825 | 0.097; 1.01 [0.32–1.70] | 0.004 | 0.0044 | 0.11; 1.32 [0.71–1.9] | <10 –4 | 0.0054 |
| Diastolic BP | 1,825 | 0.039; 0.004 [–0.001 to 0.008] | 0.095 | 0.0015 | 0.11; 0.012 [0.008–0.016] | <10 –7 | 0.0122 |
| Systolic BP | 1,825 | 0.023; 0.001 [–0.001 to 0.004] | 0.35 | 0.0005 | 0.14; 0.009 [0.006–0.011] | <10 –11 | 0.0179 |
| HbA1c | 1,825 | 0.026; 0.043 [–0.032 to 0.12] | 0.26 | 0.0007 | 0.04; 0.071 [0.004–0.14] | 0.038 | 0.0012 |
| Smoking | 1,825 | –0.037; –0.078 [–0.17 to 0.02] | 0.12 | 0.0005 | 0.061; 0.087 [0.035–0.14] | 0.001 | 0.0033 |
| CRP | 1,825 | 0.052; 0.052 [0.006–0.098] | 0.026 | 0.0026 | 0.043; 0.048 [0.008–0.089] | 0.019 | 0.0015 |
| IL6 | 1,372 | 0.074; 0.11 [0.029–0.18] | 0.007 | 0.0051 | 0.046; 0.078 [0.008–0.15] | 0.029 | 0.0017 |
| Deep WMH Volume | Periventricular WMH Volume | ||||||
| BMI | 1,825 | 0.065; 0.012 [0.004–0.019] | 0.003 | 0.0038 | 0.036; 0.007 [4 × 10⁻⁴ to 0.014] | 0.065 | 0.0012 |
| WHR | 1,825 | 0.12; 1.03 [0.53–1.53] | <10 –4 | 0.0069 | 0.092; 0.77 [0.32–1.23] | <10 –3 | 0.0038 |
| BMIa | 1,825 | 0.035; 0.006 [0.001–0.12] | 0.017 | 0.0007 | –0.006; –0.001 [–0.006 to 0.004] | 0.63 | <10–4 |
| WHRa | 1,825 | 0.80; 0.42 [0.76–0.83] | 0.018 | 0.0038 | 0.01; 0.086 [–0.23 to 0.4] | 0.60 | 0.0027 |
Statistical significant results are marked in bold.
Controlled additionally for periventricular WMH (in models with deep WMH as dependent variable) or for deep WMH (in models with periventricular WMH as dependent variable).
β = beta coefficient; βs = standardized coefficient; sr2 = semipartial correlation coefficient; BMI = body mass index; BP = blood pressure; CI = confidence interval; CRP = high‐sensitive C‐reactive protein; IL6 = interleukin‐6; WHR = waist‐to‐hip ratio.
Mediation Analysis
Next, we explored whether inflammatory markers mediated the obesity‐related increase of dWMH/pvWMH. For CRP, a mediation effect was not significant (see Table 3). In the subsample with available IL6 (n = 1,372), however, we observed a significant partial mediation effect for IL6 on obesity‐related effects on dWMH/pvWMH, indicating that higher WHR was associated with higher dWMH/pvWMH through increases in IL6, independent from age and sex (Table 3). The IL6 subsample did not differ significantly from the whole group with regard to distributions of WHR (p = 0.27), BMI (p = 0.99), age range (p = 0.96), sex (p = 0.32), dWMH/pvWMH (p = 0.53), as well as total WMH volume (p = 0.64), suggesting that the selection did not introduce bias. Note that when repeating the mediation model for CRP in the smaller subgroup (n = 1,372), results were similar to before, that is, not supporting a significant mediation effect for CRP (data not shown).
Table 3.
Mediation Analysis
| WHR | BMI | |||
|---|---|---|---|---|
| Mediation Model 1a (n = 1,825) | βs | 99% CI; p | βs | 99% CI; p |
| Obesity on CRP | 0.37 | [0.29–0.45]; <10 –15 | 0.33 | [0.27–0.39]; <10 –15 |
| CRP on dWMH/pvWMH | 0.05 | [–0.01 to 0.11]; 0.03 | 0.05 | [–0.01 to 0.11]; 0.03 |
| Mediated effect | 0.01 | [–0.009 to 0.036]; 0.12 | 0.01 | [–0.009 to 0.033]; 0.13 |
| Direct effect | 0.08 | [–0.007 to 0.18]; 0.02 | 0.04 | [–0.023 to 0.10]; 0.09 |
| Total effect | 0.10 | [0.009–0.19]; <0.01 | 0.05 | [–0.006 to 0.11]; 0.02 |
| Proportion mediated | 0.14 | [–0.018 to 29.7]; 0.12 | 0.23 | [–0.032 to 24.9]; 0.15 |
| WHR | BMI | |||
|---|---|---|---|---|
| Mediation Model 2a (n = 1,372) | βs | 99% CI; p | βs | 99% CI; p |
| Obesity on IL6 | 0.23 | [0.13–0.33]; <10 –8 | 0.18 | [0.11–0.25]; <10 –10 |
| IL6 on dWMH/pvWMH | 0.07 | [0.004–0.14]; 0.006 | 0.07 | [0.004–0.14]; 0.006 |
| Mediated effect | 0.01 | [0.0002–0.033]; 0.01 | 0.01 | [0.0002–0.026]; 0.01 |
| Direct effect | 0.09 | [–0.013 to 0.19]; 0.03 | 0.05 | [–0.014 to 0.12]; 0.04 |
| Total effect | 0.10 | [0.003–0.20]; 0.01 | 0.07 | [–0.001 to 0.13]; 0.01 |
| Proportion mediated | 0.14 | [0.14–700]; 0.02 | 0.17 | [0.036–15]; 0.02 |
Controlled age and sex as confounders.
βs = standardized beta coefficient; BMI = body mass index; CI = confidence interval; CRP = high‐sensitive C‐reactive protein; IL6 = interleukin‐6; WHR = waist‐to‐hip ratio;
Proportion mediated = the proportion of the total effect explained by the mediator;
10,000 bootstrap resamples.
Discussion
This study shows that visceral obesity, measured using WHR, is preferentially associated with lesions in the deep white matter derived by whole‐brain analysis of 3 T MRI in a well‐characterized, population‐based sample. Adjusting for potential confounding effects of other cardiovascular risk factors did not attenuate these results. A mediation analysis further suggests that visceral obesity contributes to a higher dWMH/pvWMH ratio through inflammatory processes, indexed by elevated IL6.
Obesity and Deep WMH
Using topographical analyses and linear regression models that adjusted for a potential confounding of age, sex differences, and (other) vascular risk factors, we find that WHR, as a reliable marker of visceral fat accumulation,35 predicts regional WMH occurrence. This finding confirms and extends recent work that described obesity, especially visceral adipose tissue measured using abdominal computer tomography, as an independent predictor of WMH and lacunar infarcts in two large samples of adults participating in a general health screening in Japan and South Korea (n > 5008; n > 2,0009). In addition, the current whole‐brain voxel‐wise analyses indicated that visceral obesity was preferentially associated with WMH in the deep white matter. Linear regression analyses further supported this effect, showing that WHR predicted dWMH/pvWMH ratio. Conversely, systolic blood pressure as the most established risk factor for cerebral small vessel disease4 was independently and strongly associated with WMH both in whole‐brain analyses and in linear regression models of total WMH. Interestingly, systolic blood pressure did not explain any variance in dWMH/pvWMH ratio, nor did any of the other cerebrovascular risk factors, except WHR and (to a lesser degree) BMI. Underlining the specificity of these results, we find that the associations between WHR and dWMH/pvWMH also remain significant after correcting for BMI. Thus, visceral obesity might specifically increase the risk of developing deep WMH, a hypothesis that now needs to be confirmed in longitudinal studies. Interestingly, the notion that blood pressure and obesity (defined by BMI) are differentially associated with periventricular and deep WMH has been suggested recently using dichotomous WMH markers in the Whitehall study comprising ~500 participants.18
Underlying Mechanisms
The exact pathological mechanisms that might cause an association of visceral obesity and dWMHs are unknown. It has been suggested that most dWMHs are attributed to cerebral small‐vessel disease, and the heterogeneous histological pattern with arteriolosclerosis, vacuolation, axonal degeneration, and tissue loss suggests various complex pathological processes.13, 36, 37, 38 Histopathological studies indicate that atherosclerosis and proliferation of smooth muscle cells in the vessel walls initially contribute to luminal narrowing and thickening of the walls.39 In parallel, increased permeability of the blood–brain barrier, which might be related to endothelial cell activation and activated monocytes or macrophages,40 can provoke perivascular enlargement and supply of plasma proteins, which then move into the vessel walls to again provoke thickening of vessel walls.39 Notably, the inflammatory response implicated in endothelium dysfunction could be further promoted by proinflammatory cytokines stemming from the periphery, as proposed by earlier studies linking systemic inflammation to total WMH load.24 For example, cumulative inflammation‐induced remodeling of the microvascular walls, such as fibrinogen deposition, might facilitate hypoperfusion over time.41 On the other hand, an increasing amount of chemokines, such as IL6, has been suggested to promote atherothrombosis.42
These latter mechanisms could have contributed to our results, given that visceral obesity is linked to higher circulating IL6 and high‐sensitivity CRP, indicating low‐grade systemic inflammation.20, 43 Interestingly, studies comparing subcutaneous with visceral adipose tissue not only revealed a higher association with inflammatory markers for visceral adipose tissue, but also correlated specifically central obesity (ie, a higher amount of visceral fat) with microstructural brain damage.9, 44 Our study supports these findings and indicates, by means of mediation path analyses, that visceral obesity increases the development of dWMHs through increases in inflammatory activity, indexed by circulating IL6. For CRP, we observed a similar tendency, which did not reach statistical significance. Noteworthy, the inflammatory marker, IL6, showed robustly stronger partial mediating effects despite the much smaller sample size. IL6 is in fact directly released by adipose tissue, whereas CRP is of hepatic origin.45 Furthermore, IL6 has been reported to have a primary role in immune activation, whereas CRP is released secondary to IL6.46 Studies have described IL6 as the central marker for inflammation leading to vascular damage, whereas CRP had weaker but additive effects.41 In sum, the above‐described mechanisms could lead to increased vascular permeability and stiffening, which results in hypoperfusion and hypoxia, and eventually tissue damage.
Whereas these hypotheses need to be confirmed in future studies, we can only speculate as to why this process would occur most dominantly in the deep white matter. Histopathological distinctions between dWMH and pvWMH that suggest different formation mechanisms are being discussed.37, 38 In contrast, one morphological difference between dWMH and pvWMH is the underlying vessel supply, and it has been argued that deep white matter areas, such as the centrum semiovale, fed by medullary arteries arising from the cortical branches of middle cerebral arteries, are more likely to be sensitive to small‐vessel disease and ischemia.47 In this scenario, a visceral obesity‐related boost of inflammatory activity might be especially harmful. However, others criticize the dichotomization of WMH and argue for a continuous pathology,38 and potential molecular pathways that link visceral obesity specifically to deep WMH need to be explored in future studies.
Independent of exact pathomechanisms, there is mounting evidence for obesity‐related structural changes in the white matter. A recent diffusion tensor imaging study observed microstructural differences, indicating a higher magnitude of water diffusion (higher mean diffusivity) in dWMH, possibly representing greater axonal and myelin damage than pvWMH.18 Considering white matter microstructure, we recently showed that lower fractional anisotropy, as a measure of directed diffusion, was related to visceral obesity in multiple white matter tracts throughout the brain using diffusion‐weighted imaging.48 Obesity‐related structural differences suggestive of demyelination and increased water content in the white matter were reported even in small sample sizes (n = 48) by means of quantitative multiparametric mapping.49, 50 The current study adds to these findings and implicates that visceral obesity might not only exert subtle effects on overall white matter microstructure, but also particularly induce manifest white matter lesions in the deep white matter.
Limitations and Future Implications
Our study has a number of limitations. Although a strength of this study is the large, population‐based sample, the data are cross‐sectional and thus causal inferences cannot be drawn. In addition, the a priori exclusion of participants with previous stroke or intracranial hemorrhage limits the generalizability of the results to populations without brain pathology. Plus, although we did not observe evidence toward a systematic difference in the effect of WHR on dWMH/pvWMH ratio between participants with or without cardiovascular risk factors, definite conclusions remain difficult based on the present sample, given that, typically, participants with recorded risk factors were more likely to be older amd showed higher WMH volume and higher proportions of body fat compared to those without. Future studies are needed to carefully rule out whether visceral obesity is similarly associated with deep WMH in different patient groups and how this affects (secondary) prevention strategies. Furthermore, an array of different factors might influence the formation of WMH, and because of its—with respect to pathophysiological formation—nonspecific appearance,15, 17, 51 more sophisticated measurements of WMH are needed to further dissect causal mechanisms. Also, the categorical distinction between dWMH and pvWMH has been criticized before as arbitrary and without definite anatomical correlate.31 Taking this into consideration, a topographical analysis of WMH as well as a categorical distinction between dWMH and pvWMH might be too simplistic to fully pay tribute to the complexity of these lesions. High‐end techniques, such as quantitative MRI and specific assessment of tissue properties with ultra‐high field MRI, could give valuable insights into the WMH pathology in vivo in the future.
Conclusion
Using sensitive high‐resolution population neuroimaging techniques, we find that visceral obesity is independently related to WMH preferentially in the deep white matter. These findings are of special relevance considering obesity‐related cognitive decline48, 52 and regional effects of WMH for cognitive functions.27 In addition, using path analyses, our study provides evidence for a causal link of visceral fat accumulation on the formation of deep white matter lesions through increases in proinflammatory cytokines. This shows that implementation of advanced imaging technologies can provide pathomechanistic insights on risk factors and origin of white matter lesions, a topic of high relevance given that postmortem studies are scarce and sometimes difficult to interpret because of methodological limitations.38 In sum, our findings underline that different cardiovascular risk factors beyond age independently affect WMH distribution, possibly by different pathophysiological formation mechanisms. Future longitudinal studies need to confirm these hypotheses.
Author Contributions
L.L., F.B., R.Z., P.L.B., A.V., A.V.W. contributed to the conception and design of the study; L.L., R.Z., F.B., S.H., S.K.M., S.P., P.L.B., M.L.S., and A.V.W. contributed to acquisition and analysis of data; and L.L., A.V., and A.V.W. contributed to manuscript drafting.
Potential Conflicts of Interest
Nothing to report.
Acknowledgment
This work is supported by grants of the European Union, the European Regional Development Fund, and the Free State of Saxony within the framework of the excellence initiative, and LIFE–Leipzig Research Center for Civilization Diseases, University of Leipzig (project numbers: 713‐241202, 14505/2470, 14575/2470), and by the German Research Foundation (CRC 1052 “Obesity mechanisms”, Project A1, Michael Stumvoll/Arno Villringer and WI 3342/3‐1 to Veronica Witte).
We thank all participants and the staff at the LIFE study center.
Contributor Information
Leonie Lampe, Email: lampe@cbs.mpg.de.
A. Veronica Witte, Email: witte@cbs.mpg.de.
References
- 1. Wardlaw JM, Smith EE, Biessels GJ, et al. Neuroimaging standards for research into small vessel disease and its contribution to ageing and neurodegeneration. Lancet Neurol 2013;12:822–838. [DOI] [PMC free article] [PubMed] [Google Scholar]
- 2. de Leeuw FE. Prevalence of cerebral white matter lesions in elderly people: a population based magnetic resonance imaging study. The Rotterdam Scan Study. J Neurol Neurosurg Psychiatry 2001;70:9–14. [DOI] [PMC free article] [PubMed] [Google Scholar]
- 3. Wen W, Sachdev PS, Li JJ, et al. White matter hyperintensities in the forties: their prevalence and topography in an epidemiological sample aged 44‐48. Hum Brain Mapp 2009;30:1155–1167. [DOI] [PMC free article] [PubMed] [Google Scholar]
- 4. Dufouil C, de Kersaint‐Gilly A, Besançon V, et al. Longitudinal study of blood pressure and white matter hyperintensities: the EVA MRI Cohort. Neurology 2001;56:921–926. [DOI] [PubMed] [Google Scholar]
- 5. Maillard P, Seshadri S, Beiser A, et al. Effects of systolic blood pressure on white‐matter integrity in young adults in the Framingham Heart Study: a cross‐sectional study. Lancet Neurol 2012;11:1039–1047. [DOI] [PMC free article] [PubMed] [Google Scholar]
- 6. Gons RAR, van Norden AGW, de Laat KF, et al. Cigarette smoking is associated with reduced microstructural integrity of cerebral white matter. Brain 2011;134(pt 7):2116–2124. [DOI] [PubMed] [Google Scholar]
- 7. van Harten B, Oosterman JM, van Loon BJ, et al. Brain lesions on MRI in elderly patients with type 2 diabetes mellitus. Eur Neurol 2006;57:70–74. [DOI] [PubMed] [Google Scholar]
- 8. Yamashiro K, Tanaka R, Tanaka Y, et al. Visceral fat accumulation is associated with cerebral small vessel disease. Eur J Neurol 2014;21:667–673. [DOI] [PubMed] [Google Scholar]
- 9. Kim KW, Seo H, Kwak MS, Kim D. Visceral obesity is associated with white matter hyperintensity and lacunar infarct. Int J Obes 2017;41:683–688. [DOI] [PubMed] [Google Scholar]
- 10. Upadhyay J, Farr O, Perakakis N, et al. Obesity as a disease. Med Clin North Am 2018;102:13–33. [DOI] [PubMed] [Google Scholar]
- 11. Boyle PA, Yu L, Fleischman DA, et al. White matter hyperintensities, incident mild cognitive impairment, and cognitive decline in old age. Ann Clin Transl Neurol 2016;3:791–800. [DOI] [PMC free article] [PubMed] [Google Scholar]
- 12. Debette S, Markus HS. The clinical importance of white matter hyperintensities on brain magnetic resonance imaging: systematic review and meta‐analysis. BMJ 2010;341:c3666. [DOI] [PMC free article] [PubMed] [Google Scholar]
- 13. Schmidt R, Schmidt H, Haybaeck J, et al. Heterogeneity in age‐related white matter changes. Acta Neuropathol 2011;122:171–185. [DOI] [PubMed] [Google Scholar]
- 14. Pantoni L. Cerebral small vessel disease: from pathogenesis and clinical characteristics to therapeutic challenges. Lancet Neurol 2010;9:689–701. [DOI] [PubMed] [Google Scholar]
- 15. Gouw AA, Seewann A, van der Flier WM, et al. Heterogeneity of small vessel disease: a systematic review of MRI and histopathology correlations. J Neurol Neurosurg Psychiatry 2011;82:126–135. [DOI] [PubMed] [Google Scholar]
- 16. Shi Y, Wardlaw JM. Update on cerebral small vessel disease: a dynamic whole‐brain disease. Stroke Vasc Neurol 2016;1:83–92. [DOI] [PMC free article] [PubMed] [Google Scholar]
- 17. Fazekas F, Kleinert R, Offenbacher H, et al. Pathologic correlates of incidental MRI white matter signal hyperintensities. Neurology 1993;43:1683–1689. [DOI] [PubMed] [Google Scholar]
- 18. Griffanti L, Jenkinson M, Suri S, et al. Classification and characterization of periventricular and deep white matter hyperintensities on MRI: a study in older adults. Neuroimage 2018;170:174–181. [DOI] [PubMed] [Google Scholar]
- 19. Rostrup E, Gouw AA, Vrenken H, et al. The spatial distribution of age‐related white matter changes as a function of vascular risk factors—results from the LADIS study. Neuroimage 2012;60:1597–1607. [DOI] [PubMed] [Google Scholar]
- 20. Monteiro R, Azevedo I. Chronic inflammation in obesity and the metabolic syndrome [Internet]. Mediators Inflamm 2010;2010:289645. [DOI] [PMC free article] [PubMed] [Google Scholar]
- 21. Novo AM, Batista S. Multiple sclerosis: implications of obesity in neuroinflammation. Adv Neurobiol 2017;19:191–210. [DOI] [PubMed] [Google Scholar]
- 22. Gu Y, Vorburger R, Scarmeas N, et al. Circulating inflammatory biomarkers in relation to brain structural measurements in a non‐demented elderly population. Brain Behav Immun 2017;65:150–160. [DOI] [PMC free article] [PubMed] [Google Scholar]
- 23. van Dijk EJ, Prins ND, Vermeer SE, et al. C‐reactive protein and cerebral small‐vessel disease: the Rotterdam Scan Study. Circulation 2005;112:900–905. [DOI] [PubMed] [Google Scholar]
- 24. Satizabal CL, Zhu YC, Mazoyer B, et al. Circulating IL‐6 and CRP are associated with MRI findings in the elderly: the 3C‐Dijon Study. Neurology 2012;78:720–727. [DOI] [PubMed] [Google Scholar]
- 25. Loeffler M, Engel C, Ahnert P, et al. The LIFE‐Adult‐Study: objectives and design of a population‐based cohort study with 10,000 deeply phenotyped adults in Germany. BMC Public Health 2015;15:691. [DOI] [PMC free article] [PubMed] [Google Scholar]
- 26. O'Brien E, Asmar R, Beilin L, et al. European Society of Hypertension recommendations for conventional, ambulatory and home blood pressure measurement. J Hypertens 2003;21:821–848. [DOI] [PubMed] [Google Scholar]
- 27. Lampe L, Kharabian‐Masouleh S, Kynast J, et al. Lesion location matters: the relationships between white matter hyperintensities on cognition in the healthy elderly. J Cereb Blood Flow Metab 2017;271678X17740501. [DOI] [PMC free article] [PubMed] [Google Scholar]
- 28. Shiee N, Bazin PL, Ozturk A, et al. A topology‐preserving approach to the segmentation of brain images with multiple sclerosis lesions. Neuroimage 2010;49:1524–1535. [DOI] [PMC free article] [PubMed] [Google Scholar]
- 29. Avants BB, Epstein CL, Grossman M, Gee JC. Symmetric diffeomorphic image registration with cross‐correlation: evaluating automated labeling of elderly and neurodegenerative brain. Med Image Anal 2008;12:26–41. [DOI] [PMC free article] [PubMed] [Google Scholar]
- 30. Jenkinson M, Beckmann CF, Behrens TE, et al. FSL. Neuroimage 2012;62:782–790. [DOI] [PubMed] [Google Scholar]
- 31. DeCarli C, Fletcher E, Ramey V, et al. Anatomical mapping of white matter hyperintensities (WMH): exploring the relationships between periventricular WMH, deep WMH, and total WMH burden. Stroke 2005;36:50–55. [DOI] [PMC free article] [PubMed] [Google Scholar]
- 32. Winkler AM, Ridgway GR, Webster MA, et al. Permutation inference for the general linear model. Neuroimage 2014;92:381–397. [DOI] [PMC free article] [PubMed] [Google Scholar]
- 33. Smith SM, Nichols TE. Threshold‐free cluster enhancement: addressing problems of smoothing, threshold dependence and localisation in cluster inference. Neuroimage 2009;44:83–98. [DOI] [PubMed] [Google Scholar]
- 34. Tingley D, Yamamoto T, Hirose K, et al. mediation: RPackage for Causal Mediation Analysis [Internet]. J Stat Softw 2014;59:1–38.26917999 [Google Scholar]
- 35. Dobbelsteyn CJ, Joffres MR, MacLean DR, Flowerdew G. A comparative evaluation of waist circumference, waist‐to‐hip ratio and body mass index as indicators of cardiovascular risk factors. The Canadian Heart Health Surveys. Int J Obes Relat Metab Disord 2001;25:652–661. [DOI] [PubMed] [Google Scholar]
- 36. Bolandzadeh N, Davis JC, Tam R, et al. The association between cognitive function and white matter lesion location in older adults: a systematic review. BMC Neurol 2012;12:126. [DOI] [PMC free article] [PubMed] [Google Scholar]
- 37. Kim KW, MacFall JR, Payne ME. Classification of white matter lesions on magnetic resonance imaging in elderly persons. Biol Psychiatry 2008;64:273–280. [DOI] [PMC free article] [PubMed] [Google Scholar]
- 38. Wardlaw JM, Valdés Hernández MC, Muñoz‐Maniega S. What are white matter hyperintensities made of? Relevance to vascular cognitive impairment. J Am Heart Assoc 2015;4:001140. [DOI] [PMC free article] [PubMed] [Google Scholar]
- 39. Munoz DG. Small vessel disease: neuropathology. Int Psychogeriatr 2003;15(suppl 1):67–69. [DOI] [PubMed] [Google Scholar]
- 40. Rouhl RP, Damoiseaux JG, Lodder J, et al. Vascular inflammation in cerebral small vessel disease. Neurobiol Aging 2012;33:1800–1806. [DOI] [PubMed] [Google Scholar]
- 41. Yudkin JS, Kumari M, Humphries SE, Mohamed‐Ali V. Inflammation, obesity, stress and coronary heart disease: is interleukin‐6 the link? Atherosclerosis 2000;148:209–214. [DOI] [PubMed] [Google Scholar]
- 42. Vallance P, Collier J, Bhagat K. Infection, inflammation, and infarction: does acute endothelial dysfunction provide a link? Lancet 1997;349:1391–1392. [DOI] [PubMed] [Google Scholar]
- 43. Santos A‐C, Lopes C, Guimarães JT, Barros H. Central obesity as a major determinant of increased high‐sensitivity C‐reactive protein in metabolic syndrome. Int J Obes 2005;29:1452–1456. [DOI] [PubMed] [Google Scholar]
- 44. Widya RL, Kroft LJM, Altmann‐Schneider I, et al. Visceral adipose tissue is associated with microstructural brain tissue damage. Obesity 2015;23:1092–1096. [DOI] [PubMed] [Google Scholar]
- 45. Fain JN. Release of interleukins and other inflammatory cytokines by human adipose tissue is enhanced in obesity and primarily due to the nonfat cells. Vitam Horm 2006;74:443–477. [DOI] [PubMed] [Google Scholar]
- 46. Kushner I, Jiang SL, Zhang D, et al. Do post‐transcriptional mechanisms participate in induction of C‐reactive protein and serum amyloid A by IL‐6 and IL‐1? Ann N Y Acad Sci 1995;762:102–107. [DOI] [PubMed] [Google Scholar]
- 47. Fernando MS, Simpson JE, Matthews F, et al. White matter lesions in an unselected cohort of the elderly. Stroke 2006;37:1391–1398. [DOI] [PubMed] [Google Scholar]
- 48. Zhang R, Beyer F, Lampe L, et al. White matter microstructural variability mediates the relation between obesity and cognition in healthy adults. Neuroimage 2018;172:239–249. [DOI] [PubMed] [Google Scholar]
- 49. Kullmann S, Callaghan MF, Heni M, et al. Specific white matter tissue microstructure changes associated with obesity. Neuroimage 2016;125:36–44. [DOI] [PMC free article] [PubMed] [Google Scholar]
- 50. Kullmann S, Schweizer F, Veit R, et al. Compromised white matter integrity in obesity. Obes Rev 2015;16:273–281. [DOI] [PubMed] [Google Scholar]
- 51. Fazekas F, Kleinert R, Offenbacher H, et al. The morphologic correlate of incidental punctate white matter hyperintensities on MR images. AJNR Am J Neuroradiol 1991;12:915–921. [PMC free article] [PubMed] [Google Scholar]
- 52. Emmerzaal TL, Kiliaan AJ, Gustafson DR. 2003–2013: a decade of body mass index, Alzheimer's disease, and dementia. J Alzheimers Dis 2015;43:739–755. [DOI] [PubMed] [Google Scholar]
Associated Data
This section collects any data citations, data availability statements, or supplementary materials included in this article.
Data Availability Statement
Whole‐brain statistical maps are available online at https://neurovault.org/collections/3516. LesionTOADS is distributed as a plugin to MIPAV software developed by NIH available at https://mipav.cit.nih.gov/.