Abstract
Since the BRAIN Initiative and Human Brain Project began, a few efforts have been made to address the computational challenges of neuroscience Big Data. The promises of these two projects were to model the complex interaction of brain and behavior and to understand and diagnose brain diseases by collecting and analyzing large quanitites of data. Archiving, analyzing, and sharing the growing neuroimaging datasets posed major challenges. New computational methods and technologies have emerged in the domain of Big Data but have not been fully adapted for use in neuroimaging. In this work, we introduce the current challenges of neuroimaging in a big data context. We review our efforts toward creating a data management system to organize the large-scale fMRI datasets, and present our novel algorithms/methods for the distributed fMRI data processing that employs Hadoop and Spark. Finally, we demonstrate the significant performance gains of our algorithms/methods to perform distributed dictionary learning.
Index Terms—: fMRI, big data analytics, distributed computing, apache-spark, machine learning
1. Introduction
AFTER the success of the Human Genome Project (HGP) [1], [2], [3] to map 3 billion nucleotides representing human inheritance, the US Brain Research Through Advancing Innovative Neurotechnologies (BRAIN) [4] Initiative, European Union Human Brain Project (HBP) [5] launched in 2013 and China Brain Project (soon to be announced) were initiated to reflect the aspiration and investment in neuroscience research for understanding the human brain structure and function, especially to treat many brain disorders.
The sheer complexity of the brain has forced the neuroscience community and specifically the neuroimaging experts to transit from the smaller brain datasets to the extent far less manageable. The cutting-edge technologies in the biomedical imaging field, as well as the new techniques in digitizing, all lead to collect further information from the structural organization and functional neuron activities in the brain [6].
Understanding the relationship between functional neural activity, structural organization of brain regions, and subsequent behavior became the main goals of neuroscience. These goals are only achievable by analyzing covariance in large scale studies [6]. Aligned with these goals, discovery-based approaches have been employed to empower the investigation of brain-behavioral relation-ships. These goals are not reachable but through large-scale datasets. The possible challenges of holding and analyzing this much data have been one of the main topics of the annual meetings of the Organization for Human Brain Mapping (OHBM) since 2012.
Certainly, Human Connectome Project (HCP) with more than 1200 healthy subjects is a perfect example of these large datasets [7], [8]. HCP was awarded more about $40 million in 2010 to develop advanced neuroimaging methods and to recruit a large number of individuals to map brain regions and their connectomes [9, 10]. The main goal is to understand the human brain better and eventually to treat the neurological and psychiatric disorders. The other examples can be 1000 functional connectomes [11] and openfMRI project [12]. These efforts clearly draw a portrait clarifying the emphasis of neuroscience community to employ new techniques to deal with neuroimaging bigdata.
As a few studies have shown [13], [3], the arrival of big data in neuroscience demands a cultural shift from isolated single efforts applying limited methods over small dataset to a more horizontal efforts to cover a wider range of problems, using larger datasets and more comprehensive techniques. This transition, however, will require the community to address certain challenges [13]. A few of these challenges are as follows.
Handling more comprehensive datasets demands sophisticated techniques and substantial resources that necessitate close collaboration among laboratories. In recent years, numerous articles have stressed the importance of data sharing, particularly neuroscience MRI data [11], [12], [14], [15], [16]. They mostly indicate that adoption of new data sharing tools along with close collaboration among researchers will benefit researchers methodologically, financially, and ethically, fully allowing researchers to exploit the sizeable quantities of information generated across laboratories.
Techniques for studying the neural activities and the brain structure are varied, consisting of strategies to represent a vast range of temporal and spatial resolutions [13]. Each of these methods is limited to a specific resolution and only applicable to a portion of the brain studies. These techniques can be as fast as 0.0001s for patch clamping and as accurate as electron microscopy with ~0.0001mm accuracy, to electroencephalography and fMRI with lower spatial and temporal resolutions. Each of these techniques carries its own set of vocabulary and metadata, and thus different standardizations are needed. This complexity makes the cross-pipelines harder to automate, as multidimensional problems involving multiple modalities and techniques are required to reach an appropriate level of scientific certainty.
Among various neuroimaging methods, functional magnetic resonance imaging, fMRI, has been widely used to assess functional activity patterns in the brain [17], [18], [19], [20]. Since the early 1990s [21], [22], when fMRI came to dominate the brain mapping research, more than 42,000 papers have been published according to PubMed which indicates the significant interest of scientists to use this modality to understand brain functions. Researchers have vastly used both Task-based (tfMRI) and Resting-state (rfMRI) fMRI techniques for functional brain mapping. [23], [24], [25], [26], [27], [28], [29], [30]. From a total of 12 available shared neuroimaging datasets at 2014, 8 of those contained rfMRI and four of them tfMRI scans [15]. This demonstrates the fundamental role of fMRI as a tool for discovery, shedding light on the unexplored functional brain activities.
Given the popularity and the importance of fMRI to map functional brain networks, tremendous efforts have been devoted to the establishment of fMRI neuroinformatics systems through which users can easily employ comprehensive statistical and computational approaches for fMRI analysis [31], [32], [33], [34], [35], [36]. These systems are expected to host large-scale datasets and to provide a modular independent platform to run wide-ranging complex algorithms and processes in which tasks can be run in a distributed or parallel fashion.
Storing, analyzing, visualizing, and sharing large datasets need intensive computational and storage resources that more traditional methods could not deliver. Therefore, experts in computer science have developed dedicated tools in recent years to address these shortcomings.
We fit the current computational challenges for neuroimaging bigdata in 6 categories and then explain how researchers have addressed each correspondingly. We then discuss our solutions, developed at the Cortical Architecture Imaging and Discovery Laboratory, or CAID, located at the University of Georgia, and its collaborators.
Data management system is the core requirement to both organize and present data to the researchers. The Extensible Neuroimaging Archive Toolkit, XNAT [37] is one of the best examples, designed particularly to host and manage neuroimaging data in which supports the standard input formats such as DICOM and covers a broad range of metadata standards. A hierarchical Extensible Markup Language (XML) schema provides a framework in which users can define their own types of inference, depend on the imported data, and easily import the experiments’ descriptors through both web interface and command environment. XNAT is an active project, and the modified version of this toolkit serves as the basis of Human Connectome Project Database [38]. The open-source availability and the RESTful application programming interface allow communication between package components via the web, making XNAT a unique solution for neuroimaging data management system.
Data Processing Pipeline is another essential element of neuroimaging bigdata analysis where end-to-end processing workflows are specified, and users can manage workflow parameters and execution. There exist a few of neuroimaging pipelining solutions, including LONI [39], [40] with a graphical user interface, Nypype [41] a Python-based pipelining tool, and XNAT, an XML-based solution with grid computing capability.
Computing platform is the critical requirement for bigdata analysis. For example, preprocessing fMRI data takes roughly 5 minutes per subject using an 8-core machine with 16 gigabytes memory dedicated to this task. Preprocessing compromises skull removal, motion correction, slice time correction, and spatial smoothing as well as global drift removal [30]. Applying this step over hundreds of subjects will take hours to days using a single machine. Therefore, running computationally-intensive tasks in parallel is essential to reduce the overall computational time from days and months to hours and minutes; high-performance computing (HPC) is a very common solution. With the use of CPU and GPU-based clusters, substantial speedups can be achieved with no need of modifying the existing software tools. Incorporating GPUs and CPUs in parallel processing has recently become a popular topic among researchers to study [42], [43], [44], [45]. Amazon Elastic Compute Cloud (EC2) is one of the most successful instances in providing scalable computing capacity on-demand.
Cloud storage and cloud computing are inseparable parts of bigdata analysis. High-speed access to the stored data is essential in cloud computing due to the constant read and write flow among computing nodes. Amazon Simple Storage System, or S3, is an efficient choice of cloud storage with instant access to the data from EC2 computing nodes. The read and write speed and fault tolerance, as well as pricing, make S3 a competitive choice for researchers.
Data Visualization is an imperative entity of bigdata: making complex results understandable and interpretable by a human, and dynamic visualization is to improve the insight gained from data. A well-designed pipeline should generate graphics that represent the rich variety of date in neuroimaging, including time series, regions of interest, networks, and connectomes. There exist several tools and libraries that in combination with statistical and analytical frameworks generate data-related graphics. However, it is hard for general users to implement and apply and in results, more efforts are needed to create customized tools for neuroscience experts that can be easily applied in the existent pipelines. As Freeman in [46] suggests, visualizing the results with an interactive environment is far valuable than a static image representing only a portion of information especially when we are interacting with large datasets with rich data.
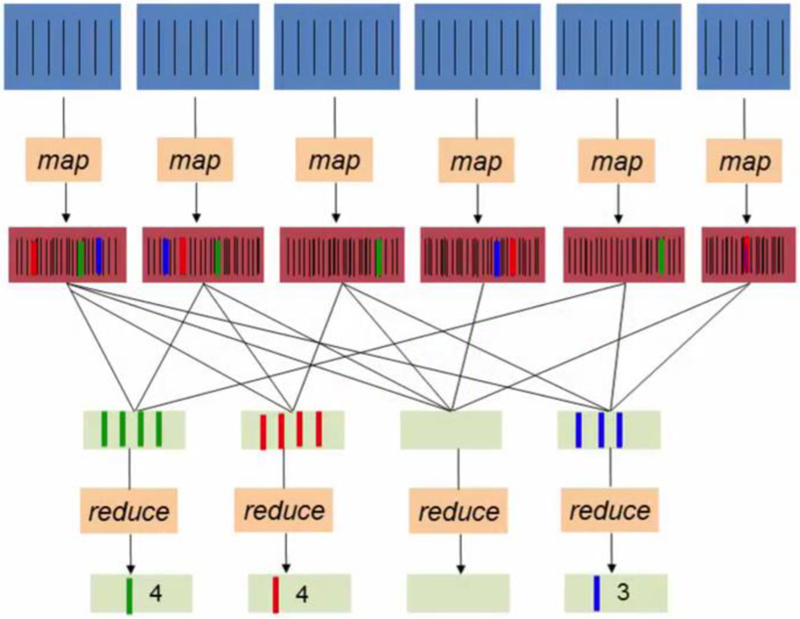
Processing engines enable researchers and programmers to load and analyze data in a distributed fashion and to create new methods to handle sophisticated analytics processes faster and with ease of use. As we discussed earlier, dealing only with a portion of datasets is ideal only at the testing stage, but in benchmark analysis, a more substantial portion of datasets is necessary. In 2003 and 2004, the Google file system and MapReduce were introduced, respectively, to the world as a simplified abstraction for parallel manipulation of massive datasets [47]. The main idea of MapReduce is to store data in a distributed file system located in a cluster environment and then use individual nodes to do the computation. This way, data is accessible from all the nodes and only the subsequent aggregation steps of the computation will be transferred to the master node. The whole workflow works in two stages: map and reduce. At first, a function will apply to partitions of the data in parallel, and then an associative operator will aggregate the results across partitions. Fig. 1 shows an example of word count problem solved by MapReduce.
Fig. 1.
Illustration of the mapReduce model applied to counting words problem. A potentially large list of words is processed into key-value pair records of form (word, 1) in parallel during the Map step. During the Reduce step, records with the same key (word) will be combined and an associative operator computes a sum for each word.
Although MapReduce is widely used by researchers and programmers to model variety of computationally intensive tasks and machine learning methods [48], due to some data modeling constraints, it is not considered an all-purpose big data tool. MapReduce loads the data into the memory from the hard disk and returns the results at every round of analysis that causes a substantial amount of disk I/O and queries especially for iterative machine learning algorithms in neuroimaging. It is also hard to represent complex series of computations given pipelining in neuroimaging.
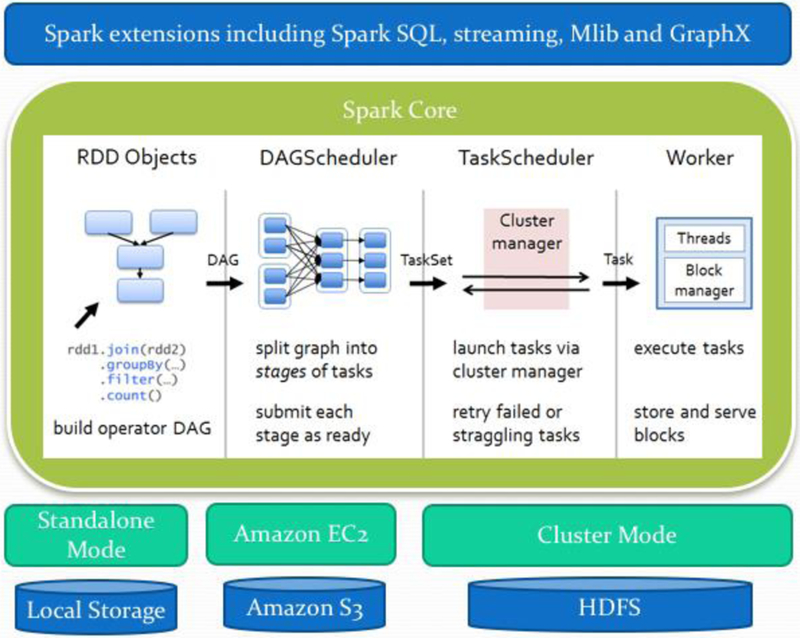
In 2009, the Spark framework [49] was developed at the University of Berkeley AMPlab. This framework addresses deficiencies of MapReduce by introducing resilient distributed datasets (RDD) abstract which the operations are performed in the memory. Spark compiles the action lineages of operations into efficient tasks, which are executed on the Spark engine. Spark’s scheduler will execute the duties across the whole cluster. Spark minimizes the repetition of data loading by caching data in memory which is crucial in complex processes. Also, Spark supports multiple programming languages, including Java, Python, Scala, and R. Fig. 2 shows the general Spark workflow and how it operates tasks in different stages. Spark uses Hadoop filesystem as a core distributed file system (HDFS) but networking file systems (NFS) can also be used if it runs on an HPC cluster. Apache Spark is the single most active Apache project. The new version 2.0 is promised to repair the performance leaks already found in the earlier version of 1.5 and 1.6. While Spark has considerable traction in industry and academia, Apache Flink [50], developed originally as Stratosphere in 2014, is another new distributed processing engine with similar goals but an entirely new architecture. Flink offers a full compilation of execution plans, optimizing the operations performed and minimizing repeated computations and network accesses. However, this project is still under development, having only reached version 1.0 in recent months.
Fig. 2.
Illustration of the spark stack with its components. Spark offers a functional programming API to manipulate Resilient Distributed Datasets (RDDs). RDDs represent a collection of items distributed across many compute nodes that can be manipulated in parallel. Spark Core is a computational engine responsible for scheduling, distribution and monitoring applications which consists of many computational tasks across worker machine(s) on a computation machine/cluster.
Developing a comprehensive fMRI neuroinformatics platform named ΉAFNI-Enabled Large-scale Platform for the Neuroimaging Informatics’ (HELPNI) [51] (http://bd.hafni.cs.uga.edu/helpni) was our first step toward bigdata. This platform was built on the version 1.6 of XNAT (will soon upgrade to version 1.7). HELPNI particularly was designed to apply our framework for the sparse representation of whole brain fMRI signals termed, ‘holistic atlases of functional networks and interactions’ (HAFNI) [52]. This goal was achieved by aggregating fMRI signals into an over-complete dictionary matrix and a corresponding coefficient matrix through an efficient online dictionary learning algorithm [53], [54]. The time series of each over-completed dictionary represents the temporal activity of a brain network, and its corresponding reference weight vector stands for the spatial map of every network. HAFNI is recognized as an efficient method for inferring a comprehensive collection of concurrent functional networks in the human brain. [52]
Dictionary learning and sparse coding have been the center of attention of researchers in a variety of disciplines [56], [57], [58], [64], [65]. These are unsupervised learning algorithms that attempt to learn a concise, high-level representation of unlabeled data. Sparse dictionary learning can be applied to a variety of problems including signal, image, video and audio processing as well as unsupervised clustering [66]. Image denoising, compression, and fusion are of the widely used applications of these algorithms. The superior performance of dictionary learning in decomposing the meaningful and comprehensive functional networks from various types of fMRI signals is also not an exception [52], [55]. HAFNI framework and R1DL algorithm [59] are our in-house dictionary learning solutions for decomposing functional brain networks, as well as similar applications in discussed areas. The premise of dictionary learning is to reduce millions of rows of fMRI signals to a smaller representation of coefficient matrices and dictionary matrices. Understanding the functional connectomics and defining it as a standard requires group-wise and eventually population-wise studies. Group-wise fMRI needs combining subjects and analyzing them as one unit expecting to process gigabytes of data and even terabytes in population-wise studies. To address this issue of scale, we devolved a novel distributed rank-1 dictionary learning (D-r1 DL) model, leveraging the power of distributed computing to handle large-scale fMRI big data. We initially presented this model at the KDD 2016, and here we present an extended version of it [59]. It is expected that the new D-r1 DL algorithm and methodology could be widely applicable to many other domains of applications that entail sparse representation of big data.
We have used spark version 1.6 at our previous project to implement R1DL algorithm in a distributed fashion. We also used our own data management platform (HELPNI) customized for fMRI, where data will be stored and a variety of analyses can be scheduled through its pipelining and scheduling tools. Based on the choice of user and analysis requirements, data will be transferred to either a local virtual cluster, the Georgia Advanced Computing Resource Center (GACRC) or an Amazon EC2 cluster for further analyses.
At the next section we will first briefly discuss the general scheme of HELPNI, and then we will explain how D-r1DL algorithm work. Moreover, at the experimental result, we will focus on the efficiency of this method in comparison with the previous methods. We will demonstrate a computational architecture which is capable of dealing with the fast-growing demands of neuroimaging community.
2. Method and Implementation
2.1. Overview of HELPNI
We developed HELPNI first to store and visualize large-scale multi-modal neuroimages datasets. The second goal is to facilitate running and controlling complicated neuroimaging multi-stage processes with a secure, user-friendly web interface. The third goal is to give researchers parallel and distribute computing accessibility while they implement their own analytical and visualization tools via HELPNI. This way we have provided a neuroinformatics tool that can conduct the variety and volume complexities of neuroimaging big data. It means that large datasets with diverse neuroimaging standards can be easily imported to the system. Moreover, newly implemented methods could leverage from the parallel processing capabilities of such a system.
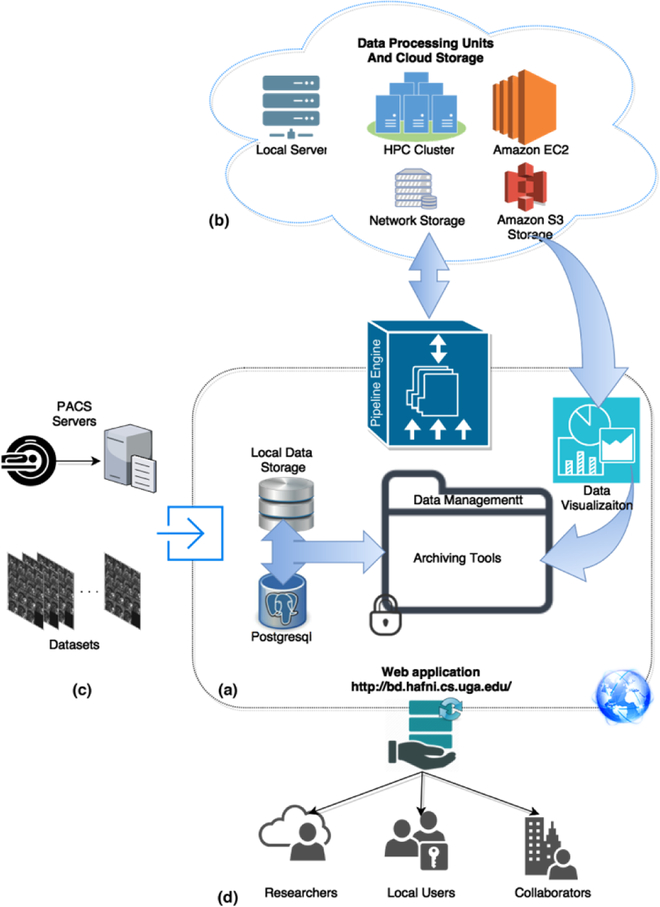
The main five components of HELPNI are: data storage, data management tools, pipelining engine, user interface and data sharing tools. The web interface is built on the Apache Tomcat version 6.0 using WAR build process. RESTful application programming interface enables the data management through standard GET, PUSH, GIVE and DELETE commands. HELPNI runs over JAVA language, where it uses Maven to install and update the webapps, and it uses Jakarta turbine to generate reports and to manage web application. This platform uses XML schema from which data types are defined and users can also extend these definitions. The XML schema enables the Pipelining at HELPNI to understand the parameters and application resources through a Java parser and in result to properly run a workflow consist of multiple applications and procedures. Fig. 3 shows how different components are connected and interact with each other.
Fig. 3.
Illustration of the HELPNI diagram and components. (a) shows the core part of HELPNI. This part consists of web application, file archiving, pipeline scheduler, local data storage, database and data visualization tools. All the external components interact with HELPNI core to transfer data. (b) demonstrates the data processing and cloud storage architecture of the platform. Based on the analysis procedure, user can define how the pipeline descriptor interacts with the computation machines. This includes Amazon EC2 linked to the S3 storage, GACRC high performance computing cluster and its networking file storage and our local server with 2 virtual machines. (c) shows different way of importing data to the platform. Platform can either feed from datasets or it can obtain the information directly from PACS server. (d) Illustrates the data sharing capacity of system from which researchers can interact with the system and access the raw, preprocessed or fully processed fMRI data. They can also implement their own Pipeline with obtaining special access to the system.
We implemented HAFNI pipeline to automate the whole processes of fMRI data registration and online dictionary learning (ODL) and to reduce the processing time of running these tasks over extensive datasets. We used the 1000 FC project with more than 1200 rfMTI images as a test bed to examine the performance of HELPNI in a standard environment with an eight-core Intel CPU and 32 GB of RAM machine. Running the HAFNI pipeline over the 1288 subjects of 1000FC took ~214 hours (9 days) consist of an average of 5 min/subj for the preprocessing step and 5 min/subj for the ODL at the HAFNI framework. The results were the meaningful functional brain networks for each subject.
Since then, we concentrated on developing and extending the data storage, data management, and also data processing aspects of HELPNI. The primary goal was to add a distributed file system as well as empowering the computational platform with parallel processing feature. The rest of this section will follow such a goal.
2.2. Extending HELPNI for parallel processing
Both local hard drives and cloud storage are integrated into the system, as we use Amazon Simple Storage Solution (S3) as permanent data storage for larger datasets. Data are securely accessible from the web application with a Postgresql database to respond to data queries. Users either can upload the data to the system manually from the web-based Java uploader, or can use the script uploading method. However, the latter method allows users to upload a vast number of images after defining the appropriate data schema. Another under-development feature is that users can obtain DICOM images directly from PACS machines located at other laboratories.
HELPNI platform controls the data flow and working schedule from preparing data to the processing units. One advantage of the proposed neuroinformatics platform is flexibility and modularity of the processing units. Researchers, depend on the algorithmic structure of the analysis, can choose the available computational nodes that will process the chain of tasks. Platform controls 3 data processing units: an in-house cluster (8 cores, 16 GB memory) deployed on the same machine as the platform exists; a remote high-performance computing cluster (a GACRC cluster with 48 cores and 128 GB of memory, gacrc.uga.edu); and the cloud-based Amazon EC2 cluster. Fig. 3 shows an overview of the neuroinformatics system, through which stored fMRI data in centralized storage will be sent to processing units, and the results will be visualized through dynamically-generated web pages.
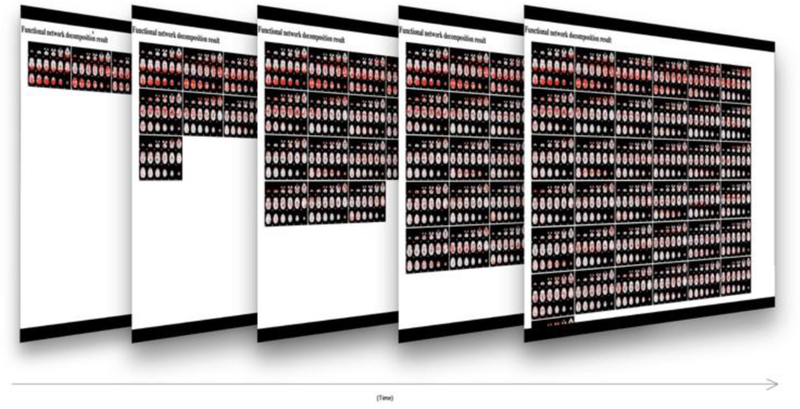
The preparation of fMRI data includes preprocessing and the conversion of the 4D fMRI images to a 2D data matrix. Model parameters are also set during the preparation: either automatically extracted from the data (e.g., the number of columns and rows of input matrix) or defined by user specification (e.g., sparseness constraint r). While the data are being processed, an online visualization tool will simultaneously generate the reports of the statistics and visualizations of the decomposed functional networks. Fig. 4 shows an overview of real-time visualization of discovered networks. Then the results will be uploaded to the Apache server, accessible via web browsers for visualizing and sharing. The PDF version of all reports, as well as an interactive web page, will be available in every subjects’ profile page. This demonstration will make the future comparison and studies much easier. Also, all the results will remain in the system directory linked to the subjects’ profile. Doing so will help collaborators’ future studies be done easier and more efficient because they can access raw data as well as any prior study results instantly. For example, the standard fMRI preprocessing can be done once, and all the future analysis can easily leverage from the one time preprocessed data.
Fig. 4.
The generated networks as being computed will appear on a dynamically-generated result screen linked to the report webpage.
2.3. Algorithm of rank-1 matrix decomposition with sparse constraint
The rank-1 dictionary learning (r1DL) algorithm [59] decomposes the input matrix S (of dimension T×P) by iteratively estimating the basis vector u (T×1 vector with unit length) and the loading coefficient vector v (P×1 vector). The algorithm is an extreme case of the general dictionary learning framework [60] as the input is approximated by a rank-1 matrix (spanned by two vectors). With the l-0 sparseness constraint, the following energy function L(u, v) will be minimized:
| (1) |
Thus the total number of non-zero elements in v should be smaller than or equal to the given sparsity constraint parameter r which is empirically determined based on the context of the application. The algorithm alternates updating u (randomly initialized before the first iteration) and v until the convergence of u:
| (2) |
One dictionary basis [u, v] can be estimated after the convergence of Eq. 2. Since the value of the energy function in Eq. 1 decreases at each iteration in Eq. 2, the objective function is guaranteed to converge. For estimating the next dictionary (up to the dictionary size K), the input matrix S will be deflated to its residual R.
| (3) |
2.4. Algorithm of rank-1 matrix decomposition with sparse constraint
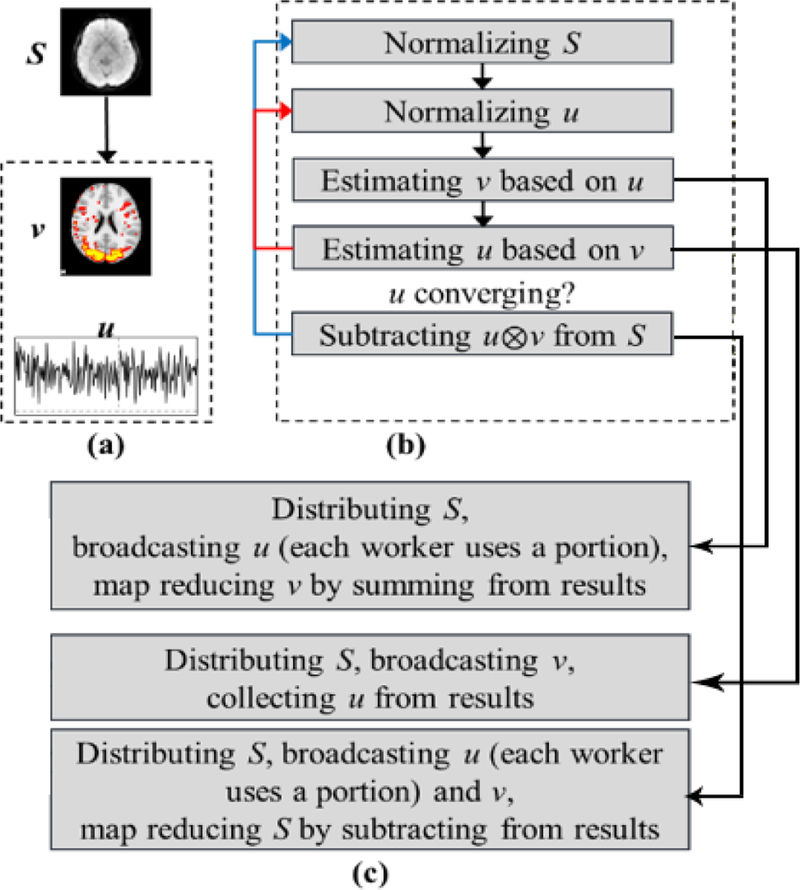
To utilize computational power and memory capacity across many machines to address the big data problem, we implemented the distributed r1DL algorithm on Spark, which we refer to as the distributed rank-1 dictionary learning (D-r1 DL) framework as illustrated in Fig. 5. Using Spark’s Resilient Distributed Dataset (RDD) abstraction from [61], D-r1DL can potentially deal with large-scale imaging data whose size exceeds the memory capacity of the working machine. Spark addresses such out-of-core operations by loading only specific partitions of the whole input matrix S into the memory of each node. The learning of dictionary bases [u, v] is performed in parallel at each node (i.e., machine), and are then broadcasted across all nodes during the update. Specifically, the matrix multiplication operations described in Eq. 2 and the deflation operation defined in Eq. 3 were implemented by their corresponding distributed primitives in Spark:
During the vector-matrix multiplication, each node will use its portion of the updated u vector, then estimate the v vector based on the multiplication of its partition of S and the vector u. The resulting partial v vectors from all the nodes will be then reduced by the summation operation.
During the matrix-vector multiplication, each node will use the updated v vector and its partition of the S matrix to estimate a single corresponding element of the u vector. The resulting u vector is assembled from the results of each node.
During the matrix deflation operation, both u and v learned from Eq. 2 will be broadcasted. Each node estimates a portion of the outer product between corresponding elements of u vector with the whole v vector. Each partition of the S matrix is deflated using the corresponding partial product of u and v.
Fig. 5.
Illustration of the D-r1DL framework. (a) Running example showing the input data S (one volume from the 4-D volumetric matrix), learned vector v (3-D volumetric matrix as a vector) and vector u (time series). (b) Algorithmic pipeline of r1DL. Red arrow shows the updating loop for learning each [u, v], blue arrow shows the updating loop for deflation of S and learning next dictionary. (c) Parallelization steps for the three operations from (b).
3. Experimental Results
3.1. Model performance on a relatively large-scale dataset
We applied the D-r1DL model on the publicly available dataset from Human Connectome Project [7] for validating its effectiveness in discovering functional networks from large-scale fMRI dataset. The acquisition parameters of the fMRI are as follows: 90×104 matrix, 220mm FOV, 72 slices, TR=0.72s, TE=33.1ms, flip angle=52°, BW=2290 Hz/Px, 2.0mm isotropic voxels. Data preprocessing followed the protocols detailed in [62], including motion correction, spatial smoothing, temporal pre-whitening, slice time correction, and global drift removal. The tfMRI data was then registered to the standard MNI152 2mm space using FSL FLIRT to enable group-wise analysis. The final individual tfMRI signal matrix used as model input contains 223,945 number of voxels (defined on the grey matter) and varying temporal length based on task design. In this work, tfMRI datasets from 68 subjects during Emotion Processing task were used, with the time length of 176 volumes which matches the aim of the proposed framework for population-level fMRI bigdata analysis.
Afterward, we aggregated the 68 individual fMRI data during Emotion task into one big, group-wise matrix with the dimension of 176×15,228,260 (~20 GB as a text file). Using the parameter setting of K=100 (i.e., decomposing 100 functional networks) and r=0.07 (i.e., 7% of the total number of grey matter voxels across all subjects can have non-zero value), we obtained the 100 group-wise functional networks. The analysis was performed on the high-performance computing cluster and took around 10 hours to finish. The temporal patterns of the group-wise functional networks are defined in the D matrix. The spatial patterns were distributed across each individual’s space (223,945 voxels) in the z matrix. To obtain a volumetric image, we averaged the loading coefficient value on each voxel across all individuals.
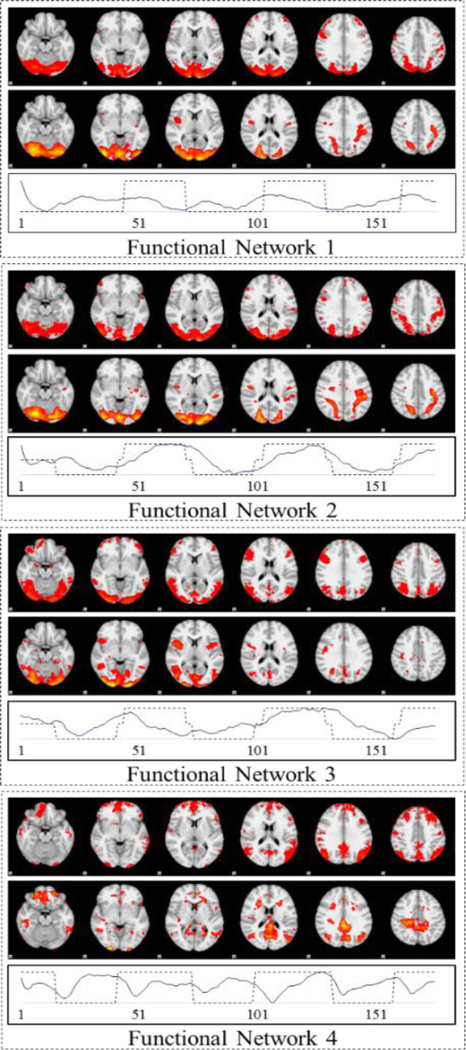
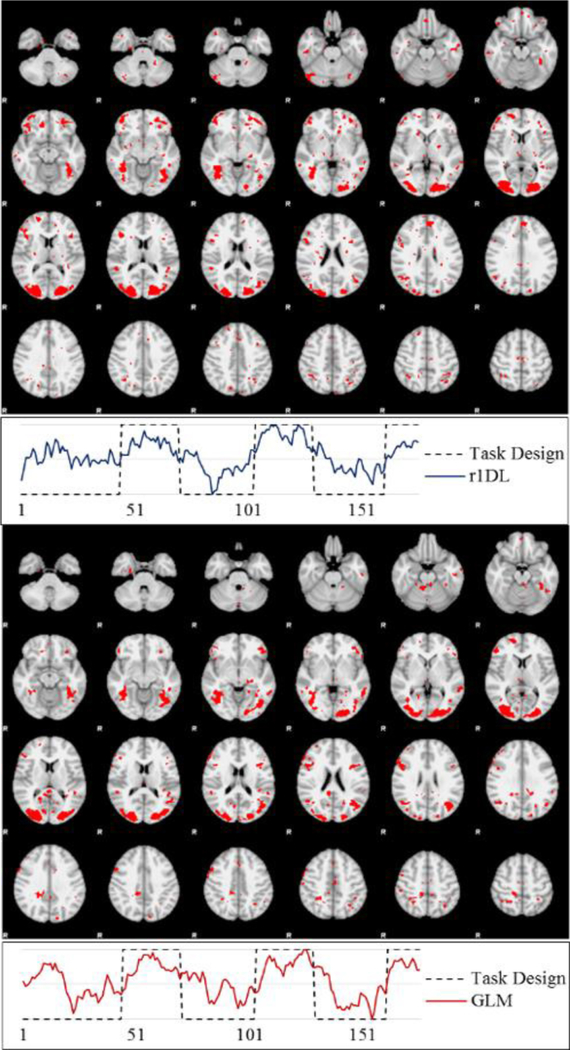
For validation purposes, we compared the decomposed group-wise functional networks with the group-wise activation detection results obtained by model-driven General Linear Model (GLM). The basic rationale of such comparison is that the activation detection results characterize the intrinsic and basic temporal/spatial patterns as a response to external stimuli and should therefore also be revealed by data-driven matrix decomposition-based methods such as D-r1DL. In order to identify the correspondence between the 100 functional networks decomposed by D-r1DL and the GLM results, we calculated Pearson’s correlation between the temporal patterns (in the D matrix) of the functional networks and the hemodynamic response function (HRF)-convolved task designs of Emotion Processing task and selected the result with the highest correlation. The group-wise functional network obtained by D-r1DL and the corresponding GLM results are shown in Fig. 6. We also calculated the spatial overlapping rate SOR between the spatial patterns of the results from D-r1 DL (P1) and group-wise GLM (P2) to measure their similarity quantitatively:
| (4) |
where operator |·| counts the total number of voxels with non-zero values in the given spatial pattern. The rate ranges from 0 (no voxels overlapping) to 1 (exact the same pattern GLM result). The SOR values of the four pairs of correspondent results between D-r1DL and GLM are 0.72, 0.75, 0.67 and 0.65, respectively.
Fig. 6.
Spatial maps of the four pairs of group-wise functional networks obtained by r1DL (upper) and GLM (lower) from Emotion dataset. The temporal pattern of the functional networks are shown below the spatial patterns.
3.2. Model application with sampling strategy
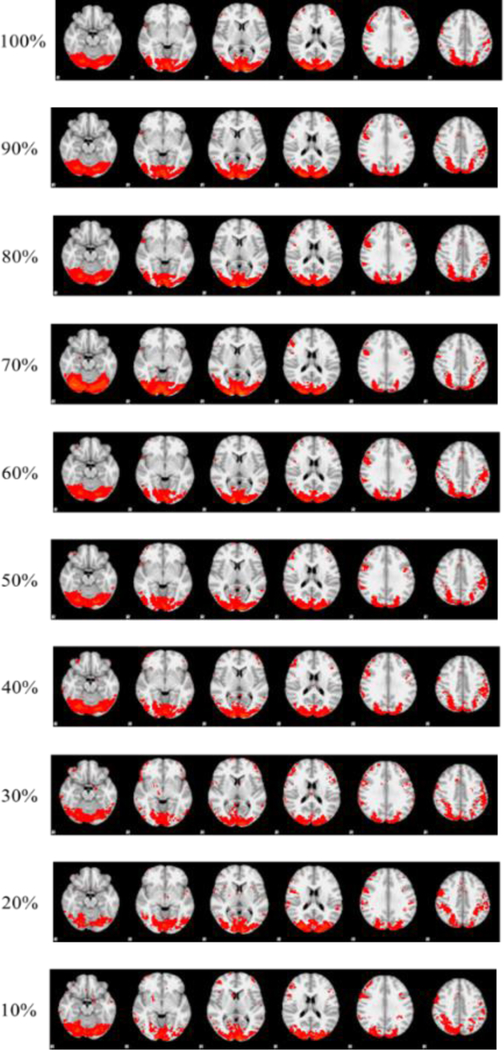
In addition to the analysis on the whole group-wise tfMRI dataset, we also uniformly sampled the 176×15,228,260 input matrix into 10%~90% of its size (e.g. 10% sampled data is a 176×1,522,826 matrix). The main rationale for the sampling study is to further accelerate initial investigations into the effectiveness of the dictionary bases learned by D-r1DL. In such circumstances, the sampling strategy could offer an approximation of the detailed and accurate functional networks learned from the original data [67]. By applying D-r1DL on the nine sampled datasets, the corresponding sets of functional networks were obtained. One example functional network showing the correspondence between the ten sets of results is visualized in Fig. 7. Notably, our prior experiments using online dictionary learning and stochastic coordinate coding showed that dictionary learning algorithms have excellent performance of reconstructing original fMRI signals [52, 55, 68]. In the future, we will perform extensive comparisons of D-r1DL with these dictionary learning algorithms regarding their reconstruction performances, once all of them are implemented via the Spark framework.
Fig. 7.
Visualization of the spatial patterns of a sample functional networks learned from group-wise aggregated fMRI data with different sampling rates.
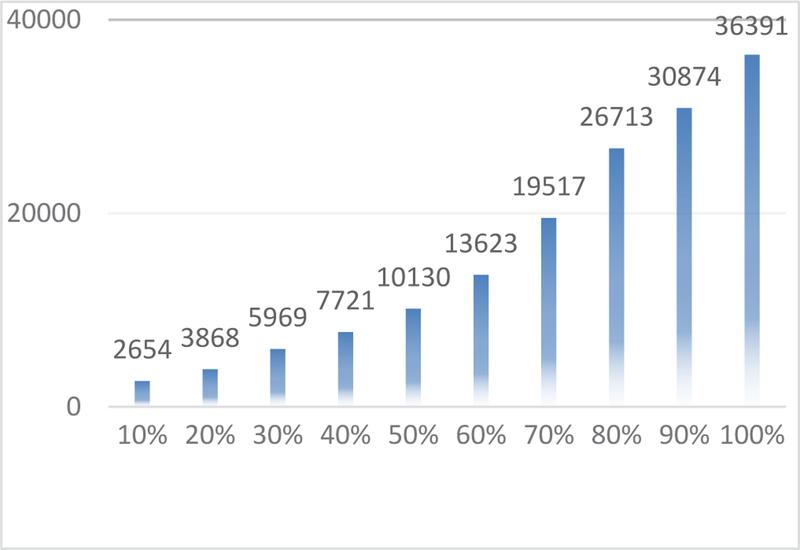
It was observed that the spatial patterns of the corresponding functional networks learned from the same dataset with different sampling rates are mostly the same (with overlapping rate>0.85), excepting some minor differences in the details. The time costs for the group-wise analysis on uniformly-sampled datasets are summarized in Fig. 8. The time cost follows a quadratic function with the sampling rate (R2=0.994). Thus, while analyzing the original 20 GB dataset took around 10 hours to finish, the time cost is approximately 1 hour using the 20% sampled data. Further comparison of other sampling methods has already done by Ge Bao et al [67] where they have concluded that signal sampling can speed up to ten times while representing the whole brain’s signals very well with high accuracy.
Fig. 8.
Time cost (measured in seconds) for decomposing 100 functional networks from group-wise aggregated fMRI data with different sampling rates. The original dataset has the sampling rate of 100% (rightmost).
3.3. Performance boost relative to other dictionary learning algorithms
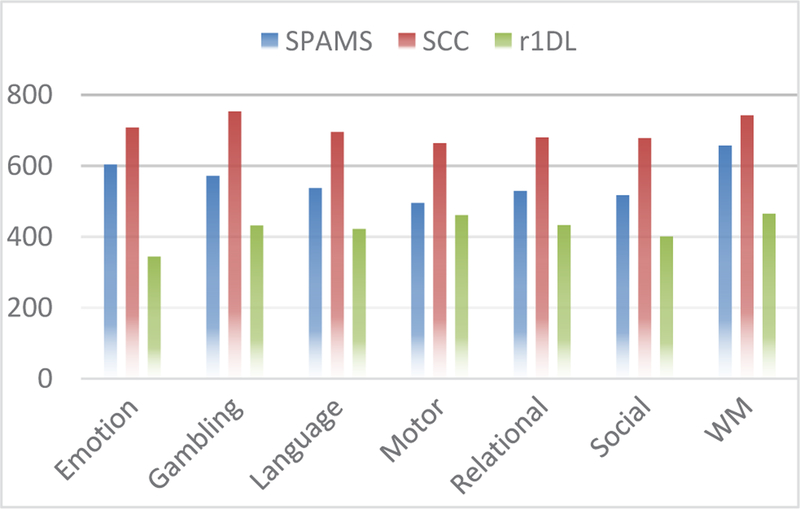
The advantages of the proposed D-r1DL algorithm are predicated on its smaller memory footprint and robust learning mechanism (no need to set learning rate); even without parallelization, the algorithm should have similar or faster running speed compared with other dictionary learning methods, as Spark intrinsically performs out-of-core computations whether these are distributed over multiple machines or run in parallel on a single machine. We compare D-r1DL with two other dictionary learning algorithms: the online dictionary learning framework implemented in SPAMS [54] and the stochastic coordinate coding (SCC) algorithm introduced in [6]. We applied these two methods on the same HCP Q1 dataset and computed performance statistics compared to D-r1 DL. We ran these algorithms using the same in-house server. The performance comparison is shown in Fig. 9 (averaged across all 68 subjects over the HCP task fMRI (tfMRI) dataset). From the comparison, it can be seen that D-r1DL outperformed the other two methods in all the seven tfMRI datasets.
Fig. 9.
Average time cost (measured in seconds) for functional network decomposition from individual tfMRI data during 7 tasks across 68 subjects, using the three dictionary learning methods.
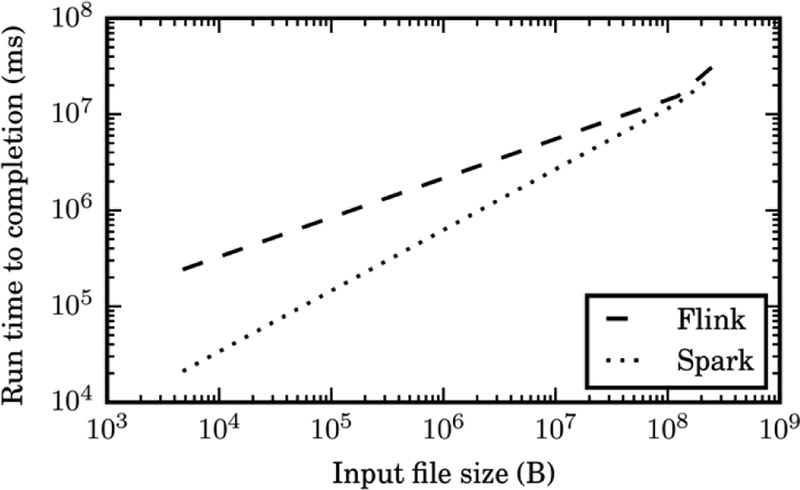
To benchmark the D-r1DL efficiency on the running time, we designed an experiment using two popular parallel processing platforms of Spark and Flink. We set up a virtual cluster of three nodes, each with four virtual CPUs, 8192 MB RAM, and 30 GB disk storage. As we examined both platforms using varying of input matrixes, the preliminary testing shows that Flink Dr1DL could offer performance gains over Spark Dr1DL for large data. Fig. 11 illustrates the performance gain of Flink as the input data growth. We are leading another experiment with a bigger cluster to test the impact of larger datasets on this.
Fig. 11.
Run time comparison of D-r1DL using Flink and Spark wih varying input data sizes.
3.4. Real-time user feedback
We tested the performance of D-r1DL on the HLPNI as introduced in section 2.3 for individual-level analysis. Using individual fMRI matrix (with dimensions 176×223,945) as input and the same parameter setting as for group-wise analysis (K=100, r=0.07), the combined time cost for decomposing one network, generating network visualizations, and reporting web pages averaged around 4 seconds on our in-house server. Such a time cost is short enough for real-time visualizations on the decomposition results, thereby providing a useful feedback mechanism for the users. One sample result from the individual-level analysis and the comparison with GLM activation detection results is shown in Fig. 10.
Fig. 10.
Spatial maps and temporal variation patterns of the functional networks decomposed by D-r1DL (left) and GLM (right) on the tfMRI data during Emotion Processing task from a randomly-selected subject.
4. Conclusion and Discussion
The neuroscience has entered into the bigdata era just as other leading sciences. This arrival though requires a cultural shift among the community from enormous isolated efforts applying a single technique to the smaller problems in laboratories toward more horizontal approaches researchers integrate data collected using a variety of techniques to solve bigger problems addressing the central questions of how the brain functionally and structurally connected. We have categorized the current computational efforts of neuroscience experts for in dealing with the bigdata challenges in 6 groups of data management, data visualization, Cloud storage, computing platforms, processing pipelines and processing engines.
In this work, we introduced our endeavors to address each of the above categories, notably for fMRI data types. We introduced HELPNI as an efficient neuroinformatics platform for data storage, processing pipelines, and data visualization. We used our HAFNI method to represent the fMRI data through a dictionary learning algorithm, and then we developed and implemented the D-r1 DL framework on Spark for distributed functional network analysis on large-scale neuroimaging data. We tested its performance on both the individual and group-wise fMRI data from HCP Q1 release dataset and demonstrated the results through an online visualization tool. The results show that the framework can meet the desired scalability and reproducibility requirements for fMRI bigdata analysis and serve as a useful tool for the community. The framework and the neuroinformatics system are both online as a web service for public usage and testing. Currently, we are working on applying the same algorithm using the Apache Flink framework on larger data. While Spark is vastly superior to Hadoop MapReduce for highly iterative computations, Flink possesses a few domain-specific advantages over Spark that yields additional performance gains for D-r1DL. We are also working on a general solution for fRMI signals to combine deep learning techniques with parallel processing engines to exhibit a new processing method for fMRI signals.
Acknowledgment:
This work was supported by National Institutes of Health (DA033393, AG042599) and National Science Foundation (IIS-1149260, CBET-1302089, and BCS-1439051). Milad Makkie and Xiang Li have contributed equally to this work. Tianming Liu is the corresponding author of this work; phone: (706) 542-3478; tianming.liu@gmail.com.
Contributor Information
Milad Makkie, Department of Computer Science, University of Georgia, Athens, GA 30602..
Xiang Li, Clincial Data Science Center, Massachusetts General Hospital, Harvard Medical School, Boston, MA, 02114..
Shannon Quinn, Department of Computer Science, University of Georgia, Athens, GA 30602..
Binbin Lin, Department of Computational Medicine and Bioinformatics, University of Michigan, Ann Arbor, Ml 48109..
Jieping Ye, Department of Computational Medicine and Bioinformatics, University of Michigan, Ann Arbor, Ml 48109..
Geoffrey Mon, Department of Computer Science, University of Georgia, Athens, GA 30602..
Tianming Liu, Department of Computer Science, University of Georgia, Athens, GA 30602..
References
- [1].Kaye J, Heeney C, Hawkins N, De Vries J, & Boddington P (2009). Data sharing in genomics—re-shaping scientific practice. Nature Reviews Genetics, 10(5), 331–335. [DOI] [PMC free article] [PubMed] [Google Scholar]
- [2].Milham MP (2012). Open neuroscience solutions for the connectome-wide association era. Neuron, 73(2), 214–218. [DOI] [PubMed] [Google Scholar]
- [3].Leonelli S (2014). Data interpretation in the digital age. Perspectives on Science, 22(3), 397–417. [DOI] [PMC free article] [PubMed] [Google Scholar]
- [4].“Brain Initiative,” 2014. [Online]. Available: https://www.braininitia-tive.nih.gov. [Google Scholar]
- [5].“Human Brian Project,” 2013. [Online]. Available: https://www.human-brainproject.eu. [Google Scholar]
- [6].Choudhury S, Fishman JR, McGowan ML, & Juengst ET (2014). Big data, open science and the brain: lessons learned from genomics. Frontiers in human neuroscience, 8, 239. [DOI] [PMC free article] [PubMed] [Google Scholar]
- [7].Van Essen DC, Smith SM, Barch DM, Behrens TE, Yacoub E, Ugurbil K, & WU-Minn HCP Consortium. (2013). The WU-Minn human connectome project: an overview. Neuroimage, 80, 62–79. [DOI] [PMC free article] [PubMed] [Google Scholar]
- [8].Smith SM, Beckmann CF, Andersson J, Auerbach EJ, Bijsterbosch J, Douaud G, … & Kelly M (2013). Resting-state fMRI in the human connectome project. Neuroimage, 80, 144–168. [DOI] [PMC free article] [PubMed] [Google Scholar]
- [9].Behrens TE, & Sporns O (2012). Human connectomics. Current opinion in neurobiology, 22(1), 144–153. [DOI] [PMC free article] [PubMed] [Google Scholar]
- [10].Jbabdi S, Sotiropoulos SN, Haber SN, Van Essen DC, & Behrens TE (2015). Measuring macroscopic brain connections in vivo. Nature neuroscience, 18(11), 1546–1555. [DOI] [PubMed] [Google Scholar]
- [11].Mennes M, Biswal BB, Castellanos FX, & Milham MP (2013). Making data sharing work: the FCP/INDI experience. Neuroimage, 82, 683–691. [DOI] [PMC free article] [PubMed] [Google Scholar]
- [12].Poldrack RA, Barch DM, Mitchell J, Wager T, Wagner AD, Devlin JT, … & Milham M (2013). Toward open sharing of task-based fMRI data: the OpenfMRI project. Frontiers in neuroinformatics, 7, 12. [DOI] [PMC free article] [PubMed] [Google Scholar]
- [13].Sejnowski TJ, Churchland PS, & Movshon JA (2014). Putting big data to good use in neuroscience. Nature neuroscience, 17(11), 1440–1441. [DOI] [PMC free article] [PubMed] [Google Scholar]
- [14].Ferguson AR, Nielson JL, Cragin MH, Bandrowski AE, & Martone ME (2014). Big data from small data: data-sharing in the’long tail’of neuroscience. Nature neuroscience, 17(11), 1442–1447. [DOI] [PMC free article] [PubMed] [Google Scholar]
- [15].Poldrack RA, & Gorgolewski KJ (2014). Making big data open: data sharing in neuroimaging. Nature neuroscience, 17(11), 1510–1517. [DOI] [PubMed] [Google Scholar]
- [16].Van Horn JD, & Toga AW (2014). Human neuroimaging as a “Big Data” science. Brain imaging and behavior, 8(2), 323–331. [DOI] [PMC free article] [PubMed] [Google Scholar]
- [17].Abolghasemi V, Ferdowsi S, & Sanei S (2015). Fast and incoherent dictionary learning algorithms with application to fMRI. Signal, Image and Video Processing, 9(1), 147–158. [Google Scholar]
- [18].Ardekani BA, & Kanno I (1998). Statistical methods for detecting activated regions in functional MRI of the brain. Magnetic Resonance Imaging, 16(10), 1217–1225. [DOI] [PubMed] [Google Scholar]
- [19].Andersen AH, Gash DM, & Avison MJ (1999). Principal component analysis of the dynamic response measured by fMRI: a generalized linear systems framework. Magnetic Resonance Imaging, 17(6), 795–815. [DOI] [PubMed] [Google Scholar]
- [20].Bandettini PA, Jesmanowicz A, Wong EC, & Hyde JS (1993). Processing strategies for time-course data sets in functional MRI of the human brain. Magnetic resonance in medicine, 30(2), 161–173. [DOI] [PubMed] [Google Scholar]
- [21].Ogawa S, Tank DW, Menon R, Ellermann JM, Kim SG, Merkle H, & Ugurbil K (1992). Intrinsic signal changes accompanying sensory stimulation: functional brain mapping with magnetic resonance imaging. Proceedings of the National Academy of Sciences, 89(13), 5951–5955. [DOI] [PMC free article] [PubMed] [Google Scholar]
- [22].Logothetis NK (2008). What we can do and what we cannot do with fMRI. Nature, 453(7197), 869–878. [DOI] [PubMed] [Google Scholar]
- [23].Biswal BB, Kylen JV, & Hyde JS (1997). Simultaneous assessment of flow and BOLD signals in resting-state functional connectivity maps. NMR in Biomedicine, 10(45), 165–170. [DOI] [PubMed] [Google Scholar]
- [24].Heeger DJ, & Ress D (2002). What does fMRI tell us about neuronal activity?. Nature Reviews Neuroscience, 3(2), 142–151. [DOI] [PubMed] [Google Scholar]
- [25].Fox MD, & Raichle ME (2007). Spontaneous fluctuations in brain activity observed with functional magnetic resonance imaging. Nature Reviews Neuroscience, 8(9), 700–711. [DOI] [PubMed] [Google Scholar]
- [26].Logothetis NK (2008). What we can do and what we cannot do with fMRI. Nature, 453(7197), 869–878. [DOI] [PubMed] [Google Scholar]
- [27].Friston K (2009). Causal modelling and brain connectivity in functional magnetic resonance imaging. PLoS biol, 7(2), e1000033. [DOI] [PMC free article] [PubMed] [Google Scholar]
- [28].Biswal BB, Mennes M, Zuo XN, Gohel S, Kelly C, Smith SM, … & Dogonowski AM (2010). Toward discovery science of human brain function. Proceedings of the National Academy of Sciences, 107(10), 4734–4739. [DOI] [PMC free article] [PubMed] [Google Scholar]
- [29].Biswal BB (2012). Resting state fMRI: a personal history. Neuroimage, 62(2), 938–944. [DOI] [PubMed] [Google Scholar]
- [30].Smith SM, Beckmann CF, Andersson J, Auerbach EJ, Bijsterbosch J, Douaud G, … & Kelly M (2013). Resting-state fMRI in the human connectome project. Neuroimage, 80, 144–168. [DOI] [PMC free article] [PubMed] [Google Scholar]
- [31].Aguirre GK (2012). FIASCO, VoxBo, and MEDx: behind the code. Neuroimage, 62(2), 765–767. [DOI] [PubMed] [Google Scholar]
- [32].Smith SM, Jenkinson M, Woolrich MW, Beckmann CF, Behrens TE, Johansen-Berg H, … & Niazy RK (2004). Advances in functional and structural MR image analysis and implementation as FSL. Neuroimage, 23, S208–S219. [DOI] [PubMed] [Google Scholar]
- [33].Woolrich MW, Jbabdi S, Patenaude B, Chappell M, Makni S, Behrens T, … & Smith SM (2009). Bayesian analysis of neuroimaging data in FSL. Neuroimage, 45(1), S173–S186. [DOI] [PubMed] [Google Scholar]
- [34].Friston KJ (2003). Statistical parametric mapping In Neuroscience Databases (pp. 237–250). Springer; US. [Google Scholar]
- [35].Cox RW (1996). AFNI: software for analysis and visualization of functional magnetic resonance neuroimages. Computers and Biomedical research, 29(3), 162–173. [DOI] [PubMed] [Google Scholar]
- [36].Fox PT, & Lancaster JL (2002). Mapping context and content: the Brain-Map model. Nature Reviews Neuroscience, 3(4), 319–321. [DOI] [PubMed] [Google Scholar]
- [37].Marcus DS, Olsen TR, Ramaratnam M, & Buckner RL (2007). The extensible neuroimaging archive toolkit. Neuroinformatics, 5(1), 11–33. [DOI] [PubMed] [Google Scholar]
- [38].Marcus DS, Harms MP, Snyder AZ, Jenkinson M, Wilson JA, Glasser MF, … & Hodge M (2013). Human Connectome Project informatics: quality control, database services, and data visualization. Neuroimage, 80, 202–219. [DOI] [PMC free article] [PubMed] [Google Scholar]
- [39].Rex DE, Ma JQ, & Toga AW (2003). The LONI pipeline processing environment. Neuroimage, 19(3), 1033–1048. [DOI] [PubMed] [Google Scholar]
- [40].Dinov I, Lozev K, Petrosyan P, Liu Z, Eggert P, Pierce J, … & Magsipoc R (2010). Neuroimaging study designs, computational analyses and data provenance using the LONI pipeline. PloS one, 5(9), e13070. [DOI] [PMC free article] [PubMed] [Google Scholar]
- [41].Gorgolewski K, Burns CD, Madison C, Clark D, Halchenko YO, Waskom ML, & Ghosh SS (2011). Nipype: a flexible, lightweight and extensible neuroimaging data processing framework in python. Frontiers in neuroinformatics, 5, 13. [DOI] [PMC free article] [PubMed] [Google Scholar]
- [42].Moritz P, Nishihara R, Stoica I, & Jordan MI (2015). SparkNet: Training Deep Networks in Spark. arXiv preprint arXiv:1511.06051. [Google Scholar]
- [43].Abadi M, Barham P, Chen J, Chen Z, Davis A, Dean J, … & Kudlur M (2016). TensorFlow: A system for large-scale machine learning. arXiv pre-print arXiv:1605.08695. [Google Scholar]
- [44].Xing EP, Ho Q, Xie P, & Dai W (2015). Strategies and Principles of Distributed Machine Learning on Big Data. arXiv preprint arXiv:1512.09295. [Google Scholar]
- [45].Kim H, Park J, Jang J, & Yoon S (2016). DeepSpark: Spark-Based Deep Learning Supporting Asynchronous Updates and Caffe Compatibility. arXiv preprint arXiv:1602.08191. [Google Scholar]
- [46].Freeman J (2015). Open source tools for large-scale neuroscience. Current opinion in neurobiology, 32, 156–163. [DOI] [PubMed] [Google Scholar]
- [47].Dean J, & Ghemawat S (2008). MapReduce: sim plified data processing on large clusters. Communications of the ACM, 51(1), 107–113. [Google Scholar]
- [48].Chu C, Kim SK, Lin YA, Yu Y, Bradski G, Ng AY, & Olukotun K (2007). Map-reduce for machine learning on multicore. Advances in neural information processing systems, 19, 281. [Google Scholar]
- [49].Zaharia M, Chowdhury M, Franklin MJ, Shenker S, & Stoica I (2010). Spark: cluster computing with working sets. HotCloud, 10, 10–10. [Google Scholar]
- [50].“Apache Spark,” 2014. [Online]. Available: http://flink.apache.org [Google Scholar]
- [51].Makkie M, Zhao S, Jiang X, Lv J, Zhao Y, Ge B, … & Liu T (2015). HAFNI-enabled largescale platform for neuroimaging informatics (HELPNI). Brain informatics, 2(4), 225–238. [DOI] [PMC free article] [PubMed] [Google Scholar]
- [52].Lv J, Jiang X, Li X, Zhu D, Zhang S, Zhao S, … & Ye J (2015). Holisticatlases of functional networks and interactions reveal reciprocal organizational architecture of cortical function. IEEE Transactions on Biomedical Engineering, 62(4), 1120–1131. [DOI] [PubMed] [Google Scholar]
- [53].Wright J, Yang AY, Ganesh A, Sastry SS, & Ma Y (2009). Robust face recognition via sparse representation. IEEE transactions on pattern analysis and machine intelligence, 31(2), 210–227. [DOI] [PubMed] [Google Scholar]
- [54].Mairal J, Bach F, Ponce J, & Sapiro G (2010). Online learning for matrix factorization and sparse coding. Journal of Machine Learning Research, 11(Jan), 19–60. [Google Scholar]
- [55].Lv J, Lin B, Li Q, Zhang W, Zhao Y, Jiang X, Guo L, Han J, Hu X, Guo C and Ye J, 2017. Task fMRI data analysis based on supervised stochastic coordinate coding. Medical image analysis, 38, pp.1–16. [DOI] [PMC free article] [PubMed] [Google Scholar]
- [56].Liu BD, Wang YX, Zhang YJ, & Shen B (2013). Learning dictionary on manifolds for image classification. Pattern Recognition, 46(7), 1879-1890. [Google Scholar]
- [57].Elad M, & Aharon M (2006). Image denoising via sparse and redundant representations over learned dictionaries. IEEE Transactions on Image processing, 15(12), 3736–3745. [DOI] [PubMed] [Google Scholar]
- [58].Ravishankar S, & Bresler Y (2011). MR image reconstruction from highly undersampled k-space data by dictionary learning. IEEE transactions on medical imaging, 30(5), 1028–1041. [DOI] [PubMed] [Google Scholar]
- [59].Li X, Makkie M, Lin B, Fazli MS, Davidson I, Ye J, … & Quinn S (2016). Scalable Fast Rank-1 Dictionary Learning for fMRI Big Data Analysis. ACM KDD. [Google Scholar]
- [60].Lee H, Battle A, Raina R, & Ng AY (2007). Efficient sparse coding algorithms. In Advances in neural information processing systems (pp. 801–808). [Google Scholar]
- [61].Zaharia M, Chowdhury M, Das T, Dave A, Ma J, McCauley M, … & Stoica I (2012, April). Resilient distributed datasets: A fault-tolerant abstraction for in-memory cluster computing In Proceedings of the 9th USENIX conference on Networked Systems Design and Implementation (pp. 2–2). USENIX Association. [Google Scholar]
- [62].Barch DM, Burgess GC, Harms MP, Petersen SE, Schlaggar BL, Corbetta M, … & Nolan D (2013). Function in the human connectome: task-fMRI and individual differences in behavior. Neuroimage, 80, 169–189. [DOI] [PMC free article] [PubMed] [Google Scholar]
- [63].Lin B, Li Q, Sun Q, Lai M-J, Davidson I, Fan W, and Ye J, 2014. Stochastic Coordinate Coding and Its Application for Drosophila Gene Expression Pattern Annotation. arXiv preprint arXiv:1407.8147 [Google Scholar]
- [64].Zhu Y, & Lucey S (2015). Convolutional sparse coding for trajectory reconstruction. IEEE transactions on pattern analysis and machine intelligence, 37(3), 529–540. [DOI] [PubMed] [Google Scholar]
- [65].Lee H, Raina R, Teichman A, & Ng AY (2009, July). Exponential Family Sparse Coding with Application to Self-taught Learning. In IJCAI (Vol. 9, pp. 1113–1119). [Google Scholar]
- [66].Lee H (2010). Unsupervised feature learning via sparse hierarchical representations Stanford University. [Google Scholar]
- [67].Ge B, Makkie M, Wang J, Zhao S, Jiang X, Li X, Lv J, Zhang S, Zhang W, Han J and Guo L, 2016. Signal sampling for efficient sparse representation of resting state FMRI data. Brain imaging and behavior, 10(4), pp.1206–1222. [DOI] [PMC free article] [PubMed] [Google Scholar]
- [68].Lv Jinglei, Lin Binbin, Li Qingyang, Zhang Wei, Zhao Yu, Jiang Xi, Guo Lei, Han Junwei, Hu Xintao, Guo Christine, Ye Jieping, Liu Tianming, Task FMRI Data Analysis Based on Supervised Stochastic Coordinate Coding, Medical Image Analysis, 2016. [DOI] [PMC free article] [PubMed] [Google Scholar]


