

Abstract
Objective
To assess the composition of gut microbiota in Italian and Dutch patients with juvenile idiopathic arthritis (JIA) at baseline, with inactive disease, and with persistent activity compared to healthy controls.
Methods
In a multicenter, prospective, observational cohort study, fecal samples were collected at baseline from 78 Italian and 21 Dutch treatment‐naive JIA patients with <6 months of disease duration and compared to 107 geographically matched samples from healthy children. Forty‐four follow‐up samples from patients with inactive disease and 25 follow‐up samples from patients with persistent activity were analyzed. Gut microbiota composition was determined by 16S ribosomal RNA–based metagenomics. Alpha‐ and β‐diversity were computed, and log ratios of relative abundance were compared between patients and healthy controls using random forest models and logistic regression.
Results
Baseline samples from Italian patients showed reduced richness compared to healthy controls (P < 0.001). Random forest models distinguished between Italian patient baseline samples and healthy controls and suggested differences between Dutch patient samples and healthy controls (areas under the curve >0.99 and 0.71, respectively). The operational taxonomic units (OTUs) of Erysipelotrichaceae (increased in patients), Allobaculum (decreased in patients), and Faecalibacterium prausnitzii (increased in patients) showed different relative abundance in Italian patient baseline samples compared to controls after controlling for multiple comparisons. Some OTUs differed between Dutch patient samples and healthy controls, but no evidence remained after controlling for multiple comparisons. No differences were found in paired analysis between Italian patient baseline and inactive disease samples.
Conclusion
Our findings show evidence for dysbiosis in JIA patients. Only patient/control status, age, and geographic origin appear to be drivers of the microbiota profiles, regardless of disease activity stage, inflammation, and markers of autoimmunity.
Introduction
The human body is host to myriad nonpathogenic microorganisms, the so‐called microbiota. Many factors contribute to its composition, among which are modes of delivery, diet, and drug use 1. The interaction between host and microbiota is complex and not yet fully elucidated. What is known is that microbiota play a role in host defense against pathogens and provide the host with nutrients and vitamins 1, 2.
Recent studies have demonstrated alterations in the composition of gut microbiota in patients with autoimmune disorders such as rheumatoid arthritis and type 1 diabetes mellitus 1, 3, 4, 5, 6, 7, 8. These alterations of the microbial profile induce a dysbiotic state of the microbiota that also affects functional activities of the gut 5, 9. It is still unclear if there is any causal relationship underlying the association between dysbiosis and autoimmune disorders. However, various observations in germ‐free mice are compatible with such a pathogenic role of gut dysbiosis 1, 10, 11.
Preliminary observations have suggested the presence of dysbiosis also in pediatric patients with juvenile idiopathic arthritis (JIA) 12, 13, 14, 15. JIA is defined as any arthritis of unknown etiology, lasting for more than 6 weeks, with an onset before age 16 years 16. The study findings in JIA are interesting because of the hypothesized pathogenic role of the gut microbiota and potential therapeutic ramifications. However, these findings of microbiota in JIA were inconclusive, as the studies were small and cross‐sectional, with some including patients with longstanding disease treated with disease‐modifying antirheumatic drugs (DMARDs). The differences between patients with active and those with inactive disease have only been explored within small groups. Also, the statistical analyses used in these studies can lead to a marked increase, up to 68%, of the false discovery rate (FDR) 17.
Therefore, the hypothesis of whether there is dysbiosis in JIA patients needs to be explored further. We addressed the aforementioned issues in a large, multicenter longitudinal study of the gut microbiota composition in a well‐defined cohort of JIA patients at baseline and during inactive disease compared to healthy children.
Patients and Methods
We conducted a multicenter, observational, prospective cohort study in Italy (Istituto Giannina Gaslini and Ospedale Pediatrico Bambino Gesù [OPBG]) and The Netherlands (Wilhelmina Children's Hospital). All consecutive patients were enrolled who presented between October 2013 and December 2015 with new‐onset JIA according to the International League Against Rheumatism criteria 18 and with <6 months of disease duration since the first symptoms. Patients with systemic JIA and patients treated previously with DMARDs, intraarticular steroid injections, or systemic steroids were excluded. No patients were excluded for recent antibiotic exposure. Patients were included at the time of diagnosis and followed up every 6 months for 24 months. Collected clinical data included patient demographics, JIA category, a full joint count, the Juvenile Arthritis Disease Activity Score in 71 joints (JADAS‐71) 19, physician's global assessment of disease activity, parent's or patient's global assessment of well‐being, the presence of active uveitis, antinuclear antibody (ANA) positivity, rheumatoid factor positivity, erythrocyte sedimentation rate, C‐reactive protein level, and the use of nonsteroidal antiinflammatory drugs (NSAIDs). At the follow‐up visits, data were collected regarding treatment and disease activity status, defined according to the American College of Rheumatology (ACR) provisional criteria for inactive disease 20.
The study was approved by the local ethics committees and was conducted in accordance with the Principles of Good Clinical Practice and the Declaration of Helsinki. Written informed consent was obtained from all participants.
Fecal samples
Fecal samples were collected at baseline and during follow‐up in cases of inactive disease (defined according to the ACR provisional criteria), persistent activity (i.e., no achievement of inactive disease), or disease flare (defined as the return of any symptom of disease activity after a period of inactive disease). We attempted to obtain samples as soon as inactive disease or disease flare was noted. Details of sample collection and analysis are specified in the Supplementary Methods, available on the Arthritis & Rheumatology web site at http://onlinelibrary.wiley.com/doi/10.1002/art.40827/abstract.
At the time of fecal sample collection, patient information was collected regarding diet; previous antibiotic, prebiotic, and probiotic use; and gastrointestinal infections and diagnosis of inflammatory bowel disorder. Also, fecal samples from healthy children, geographically matched with the patient baseline samples, were collected.
Italian healthy children were recruited at primary and secondary schools, from among the children of health workers and researchers at OPBG, or through collaboration with primary pediatricians who enlisted children at regular check‐ups. The inclusion criteria for Italian healthy controls were absence of chronic diseases, absence of gastrointestinal infections, no antibiotic and preprobiotic intake in the 2 months prior to sample collection, and an omnivorous diet. Samples from Dutch healthy controls were collected at primary and secondary schools in the vicinity of the hospital.
Statistical analysis
To assess the overall differences in microbial community structure between patient groups and healthy controls, we calculated measures of α‐diversity with the Chao1 and Shannon indices using the “alpha_rarefaction.py” script of the QIIME software on the entire operational taxonomic unit (OTU) matrix 21. The Chao1 index summarizes microbial diversity (richness) per sample, accounting for rare species that might have been missed due to undersampling. The Shannon index is a measure of entropy, taking into account species richness and evenness in the sample. These indices were compared between patients and controls in linear regression models using age, sex, and geography as covariates. Moreover, to estimate the dissimilarity of microbial communities among groups, measures of β‐diversity were calculated on the entire OTU matrix by unweighted UniFrac 22 using the scripts “beta_diversity_through_plots.py” and “compare_categories.py” of the QIIME software 21. Beta‐diversity measures were compared across groups using principal coordinates analysis (PCoA) and permutational multivariate analysis of variance (PERMANOVA). PCoA is a technique to visualize distances (dissimilarities) between samples in a lower‐dimensional space. PERMANOVA compares groups and assesses whether the centroids or dispersion of points are similar between 2 groups, basing its significance test on random permutation of the points in the groups. Measures of β‐diversity, as opposed to α‐diversity, take into account the distance of OTUs along the phylogenetic tree.
After α‐ and β‐diversity analyses, OTUs present in <20% of the samples were removed from the analysis 12, 23, 24, 25, 26. Since microbiota data are expressed as relative abundances of the OTUs, the sum of which equals 100% for each sample, they cannot be analyzed using standard statistical techniques 17, 27, 28. Rather, the analysis should be based on log ratios of the individual parts with the geometric mean of the sample, according to the framework of compositional data analysis 27, 28. This analysis was performed using the package “compositions” in R statistical software. Since it is impossible to take the logarithm of zero, zeros were imputed by means of robust imputation using the package “robCompositions,” as specified in the literature 29, 30. Next, the log ratio–transformed OTU relative abundances were analyzed using principal components analysis (PCA), showing differences between Italian and Dutch patient samples, but not between Roman and Genovese patient samples (see Supplementary Figure 1, available on the Arthritis & Rheumatology web site at http://onlinelibrary.wiley.com/doi/10.1002/art.40827/abstract). Therefore, samples from Italian and Dutch patients were analyzed separately. Likewise, baseline, inactive disease, and persistent activity samples were analyzed separately. A random forest classification model was utilized to classify Italian patient samples taken at baseline and control samples, using the microbiota composition, age, and sex as covariates. To this end, the data were split at random into 70% for model training and 30% for model testing. The best model was selected in the training set, using 10‐fold cross‐validation repeated 10 times. This model was then applied to the test set to assess its performance. The same procedure was used for the Dutch samples.
Differences in the log ratio–transformed relative abundances of all OTUs between baseline samples and healthy controls, inactive disease samples and healthy controls, and persistent activity samples and healthy controls were assessed with logistic regression, using age and sex as covariates and patient/control status as a dependent variable. A separate model was fitted for each of the OTUs and each of the disease states. As mentioned above, Italian patients and healthy controls were analyzed separately from Dutch patients and healthy controls. The FDR was controlled by the Benjamini‐Hochberg procedure (an FDR threshold of 0.05 was considered significant).
Finally, associations between the gut microbiota compositions and various clinical variables were explored using PCA, principal components regression, K‐means clustering, and the Kruskal‐Wallis test. Statistical analysis was carried out using R Statistics, version 3.3.2.
Results
A total of 169 patients were initially included. Fecal samples were collected at baseline from 99 patients (78 Italian and 21 Dutch). Samples from the remaining patients were not collected due to difficulties collecting or shipping the samples. There were no differences between patients who provided a sample and patients who did not provide a sample (all variables in Table 1 were compared; data not shown). Baseline characteristics of the analyzed patients are shown in Table 1 and reflect characteristics common to a population with recent‐onset JIA. The majority of participants were female and most had oligoarticular JIA. Disease activity at baseline was moderate‐to‐high according to the JADAS‐71 19, 31. Corresponding to clinical observations, the age at disease onset was higher in Dutch patients when compared to Italian patients.
Table 1.
Clinical features of the patients and healthy controls at baselinea
| Italian | Dutch | |||
|---|---|---|---|---|
| Patients (n = 78) | Controls (n = 79) | Patients (n = 21) | Controls (n = 28) | |
| Female sex | 61 (78.2) | 38 (48.1) | 16 (76.2) | 20 (71.4) |
| Age, median (IQR) years | 3.9 (2.3–6.7) | 8 (5–11) | 8.5 (4.8–11.7) | 8.0 (4.8–11.2) |
| JIA category at onset | ||||
| Oligoarticular | 47 (60.3) | – | 14 (66.7) | – |
| Polyarticular RF positive | 2 (2.6) | – | 0 (0) | – |
| Polyarticular RF negative | 24 (30.8) | – | 4 (19.0) | – |
| Enthesitis‐related | 0 (0) | – | 2 (9.5) | – |
| Psoriatic | 3 (3.8) | – | 1 (4.8) | – |
| Undifferentiated | 2 (2.6) | – | 0 (0) | – |
| Number of active joints, median (IQR) | 3 (1–5) | – | 2 (1–4) | – |
| PhGA, median (IQR) | 6 (4–8) | – | 2.0 (1.5–3.0) | – |
| PGA, median (IQR) | 3.1 (1.0–5.2) | – | 5.7 (2.0–8.1) | – |
| JADAS‐71, median (IQR) | 13.2 (8.6–19.0) | – | 9.5 (6.6–13.5) | – |
| ESR, median (IQR) mm/hour | 23 (14–43) | – | 11 (6–31) | – |
| ANA | 51 (65.4) | – | 8 (38.1) | – |
| RF | 2 (2.6) | – | 0 (0) | – |
| NSAIDs | 62 (79.5) | – | 17 (81.0) | – |
| Antibiotics | 13 (16.7) | 0 (0) | 0 (0) | 0 (0) |
| Prebiotics | 14 (17.9) | 0 (0) | 8 (38.1) | 9 (32.1) |
| Probiotics | 14 (17.9) | 0 (0) | 0 (0) | 3 (10.7) |
| GI infections | 11 (14.1) | 0 (0) | 3 (14.3) | 1 (3.6) |
| GI disordersb | 6 (7.7) | 0 (0) | 2 (9.5) | 0 (0) |
Except where indicated otherwise, values are the number (%). IQR = interquartile range; JIA = juvenile idiopathic arthritis; RF = rheumatoid factor; PhGA = physician's global assessment of disease activity; PGA = parent's global assessment of disease activity; JADAS‐71 = Juvenile Arthritis Disease Activity Score in 71 joints; ESR = erythrocyte sedimentation rate; ANA = antinuclear antibody; NSAIDs = nonsteroidal antiinflammatory drugs.
Gastrointestinal (GI) disorders were constipation (n = 3), celiac disease (n = 2), milk and egg allergy (n = 1), abdominal bloating (n = 1), and irritable bowel syndrome and lactose intolerance (n = 1).
The baseline samples were matched with 107 samples from healthy children (Table 1). Furthermore, 44 patients contributed at least 1 sample obtained during inactive disease (39 Italian and 5 Dutch) (see Supplementary Table 1, available on the Arthritis & Rheumatology web site at http://onlinelibrary.wiley.com/doi/10.1002/art.40827/abstract). These samples were collected at a median time of 1 year after diagnosis (range 0.3–2.0 years).
Persistent activity or flare samples were collected from 25 patients (24 Italian and 1 Dutch) (see Supplementary Table 2, available at http://onlinelibrary.wiley.com/doi/10.1002/art.40827/abstract) at a median of 0.5 years after diagnosis (range 0.1–1.1 years). After data filtering, a total of 998,583 sequence reads of 16S ribosomal RNA gene amplicons were obtained with an average of 3,210 reads per sample and an average length of 487 basepairs, calculated after primer removal. In all samples collectively, 321 different OTUs were discovered. After removal of those OTUs present in <20% of the samples, 57 remained for analysis (see Supplementary Table 3, available at http://onlinelibrary.wiley.com/doi/10.1002/art.40827/abstract). All raw 454 sequencing reads and the associated metadata are available at NCBI: Bioprojects: PRJNA379123 and PRJNA280490 (http://www.ncbi.nlm.nih.gov/bioproject/?term=).
Baseline samples
With age, sex, and geography as covariates, linear regression models showed strong evidence for a reduced richness, as indicated by a lower Chao1 index score, in baseline samples from Italian patients as compared to healthy controls (β = −158 [95% confidence interval (95% CI) −219, −97], P < 0.001). There was weak evidence that Dutch baseline samples had an increased richness (β = 76 [95% CI 8, 145], P = 0.03). In both the Italian and Dutch groups, the results remained the same regardless of whether age was introduced as a continuous variable or a categorical variable. Moreover, the results did not change when administration of antibiotics, prebiotics, or probiotics, or the presence of gastrointestinal disturbances were adjusted for as potential confounders simultaneously. Dutch female controls showed lower richness than the other control groups (Figure 1A). There was no evidence of differences in the Shannon index scores. β‐diversity differed between baseline samples from Italian patients and healthy controls (P = 0.001) (Figure 1B), as well as between baseline samples from Dutch patients and healthy controls (P = 0.013) (Figure 1C).
Figure 1.
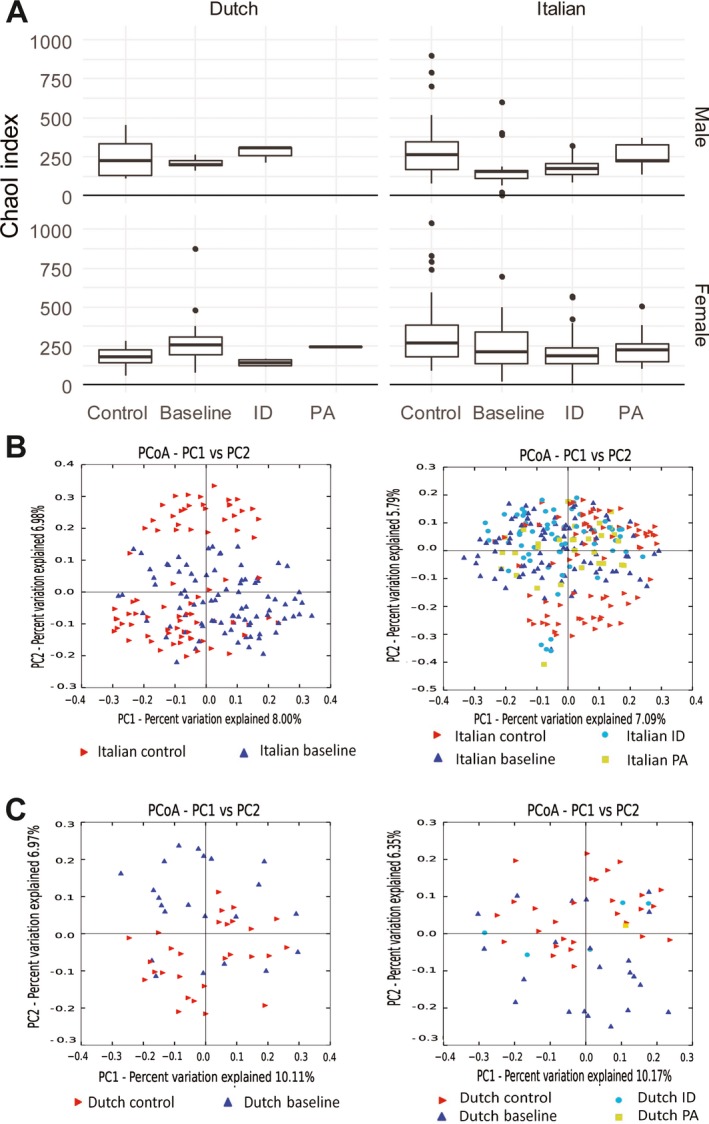
Plots of ɑ‐ and β‐diversity. A, Box plots of the Chao1 index of microbial diversity (α‐diversity) in samples from Italian subjects (n = 58 male and 99 female) and Dutch subjects (n = 13 male and 36 female). Distributions of median indices in healthy controls, baseline samples, inactive disease (ID), and persistent activity (PA) are shown. Linear regression models of the Chao1 index with age, sex, and geography as covariates show evidence of reduced richness in baseline samples, inactive disease, and persistent activity as compared to healthy controls, except for samples from Dutch patients at baseline. Data are shown as box plots, where lines inside the boxes represent the median. Each box represents the 25th to 75th percentiles. Lines outside the boxes show the highest and lowest observations still within 1.5 times the interquartile range removed from the upper and lower quartile, respectively. Circles indicate outliers. B and C, Principal coordinates analysis (PCoA) of measures of β‐diversity, calculated by unweighted UniFrac in samples from Italian subjects (n = 157) (B) and Dutch subjects (n = 49) (C). Patients at baseline and controls (left), and baseline, inactive disease, persistent activity, and healthy controls (right) are shown. Permutational multivariate analysis of variance shows evidence of pairwise differences between all subgroups, except for persistent activity versus inactive disease samples. PC = principal component.
The random forest classification algorithm separated Italian patients at baseline from healthy controls almost perfectly, with receiver operating characteristic (ROC) curve analysis showing the area under the curve (AUC) as >0.99 in both training and test data. This was mainly due to the OTUs Allobaculum, Erysipelotrichaceae, Propionibacterium acnes, and Barnesiellaceae.
In the comparison of Italian patient samples at baseline and healthy controls, Erysipelotrichaceae, Faecalibacterium prausnitzii, Parabacteroides, Enterococcus, and Ruminococcaceae were increased, whereas Allobaculum, Gemellaceae, P acnes, and Turicibacter were less abundant, in patients compared to healthy controls (FDR‐corrected P < 0.05). Table 2 shows OTUs with crude P values of <0.05 (see Supplementary Table 4 for full list, available at http://onlinelibrary.wiley.com/doi/10.1002/art.40827/abstract). Figure 2 shows the relative abundances of the 4 OTUs with the strongest evidence of differences between patients and healthy controls.
Table 2.
Differences in relative abundance between Italian patient baseline samples and healthy controls by separate logistic regressions
| OTUa | Relative abundance in patients | Crude P | Adjusted P b |
|---|---|---|---|
| Erysipelotrichaceae | Increased | <0.001 | <0.001 |
| Allobaculum | Decreased | <0.001 | <0.001 |
| Faecalibacterium prausnitzii | Increased | <0.001 | 0.009 |
| Gemellaceae | Decreased | 0.001 | 0.016 |
| Propionibacterium acnes | Decreased | 0.002 | 0.016 |
| Parabacteroides | Increased | 0.002 | 0.016 |
| Enterococcus | Decreased | 0.003 | 0.025 |
| Turicibacter | Decreased | 0.004 | 0.025 |
| Ruminococcaceae | Increased | 0.005 | 0.033 |
| Phascolarctobacterium | Increased | 0.012 | 0.07 |
| Blautia | Decreased | 0.017 | 0.09 |
| Barnesiellaceae | Decreased | 0.026 | 0.12 |
| Dorea | Increased | 0.037 | 0.16 |
Selected list of operational taxonomic units (OTUs) with crude P values of < 0.05. The full list can be accessed in Supplementary Table 4, available on the Arthritis & Rheumatology web site at http://onlinelibrary.wiley.com/doi/10.1002/art.40827/abstract.
False discovery rate control using the Benjamini‐Hochberg procedure.
Figure 2.
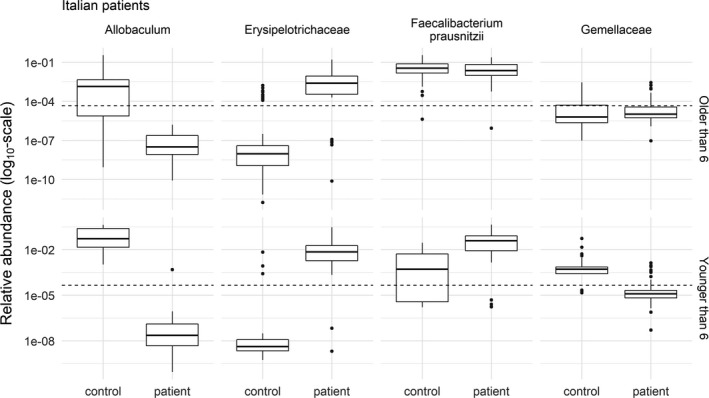
Relative abundance of the 4 operational taxonomic units with the strongest evidence of differences between Italian patient baseline samples (n = 78) and healthy controls (n = 79). The age of the subjects confounded the relationship between patient/control status and the relative abundance. Therefore, the plots were divided into patients older (top) and younger (bottom) than the median age of 6 years. The relative abundances are shown, and the analysis was performed on the log ratio of the relative abundances. The broken lines show the limit of detection at a relative abundance of 4.5 × 10⁻⁵. Relative abundances below the broken line were not observed, but were the results of imputation. Note the log10 transformation of the y‐axis. Data are shown as box plots, where the lines inside the boxes represent the median. Each box represent the 25th to 75th percentiles. Lines outside the boxes show the highest and lowest observations still within 1.5 times the interquartile range removed from the upper and lower quartile, respectively. Circles indicate outliers.
Baseline samples from Dutch patients were separated well from healthy control samples by the random forest algorithm in the training set (AUC ROC >0.99). The most important OTUs for this separation were Eggerthella lenta, Rikenellaceae, Coprobacillus, and Mogibacteriaceae. In the test data set (n = 14), the AUC ROC was 0.71 (95% CI 0.41, >0.99). Various OTUs showed a difference in relative abundance in logistic regression models, but no evidence of differences was maintained after FDR correction (Figure 3) (also see Supplementary Table 5, available at http://onlinelibrary.wiley.com/doi/10.1002/art.40827/abstract).
Figure 3.
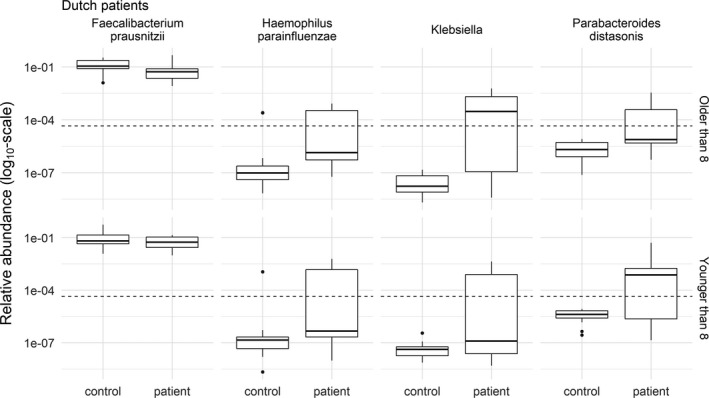
Relative abundance of the 4 operational taxonomic units with the strongest evidence of differences between Dutch patient baseline samples (n = 21) and healthy controls (n = 28). The age of the subjects confounded the relationship between patient/control status and the relative abundance. Therefore, the plots were divided into patients older (top) and younger (bottom) than the median age of 8 years. No evidence of differences was maintained after false discovery rate control by the Benjamini‐Hochberg procedure. The relative abundances are shown, and the analysis was performed on the log ratio of the relative abundances. The broken lines show the limit of detection at a relative abundance of 4.5 × 10⁻⁵. Relative abundances below the broken line were not observed, but were the results of imputation. Note the log10 transformation of the y‐axis. Data are shown as box plots, where the lines inside the boxes represent the median. Each box represents the 25th and 75th percentiles. Lines outside the boxes show the highest and lowest observations still within 1.5 times the interquartile range removed from the upper and lower quartile, respectively. Circles indicate outliers.
Inactive disease samples
There was strong evidence of reduced richness, as shown by a lower Chao1 index score, in samples from patients with inactive disease versus healthy controls using a linear regression model with age, sex, and geography as covariates (β −141 [95% CI −202, −81], P < 0.001) (Figure 1A). There was no evidence of differences in the Shannon index score. The analysis of β‐diversity showed evidence of differences between samples from patients with inactive disease and healthy controls (P = 0.001), as well as between samples from patients with inactive disease and baseline samples (P = 0.035) (Figure 1).
Various OTUs in Italian patient inactive disease samples were differently abundant compared to control samples (see Supplementary Table 6, available at http://onlinelibrary.wiley.com/doi/10.1002/art.40827/abstract). Figure 4 shows the regression coefficients and false coverage rate–corrected CIs in comparison with those obtained in the analysis of baseline samples. Erysipelotrichaceae and F prausnitzii were increased in both baseline and inactive disease samples compared to healthy controls, whereas Allobaculum and P acnes were decreased. Enterococcus, Gemellaceae, Parabacteroides, Ruminococcaceae, and Turicibacter showed differences at baseline, but not in inactive disease, whereas Bacteroides caccae, Barnesiellaceae, and Dorea showed differences in inactive disease samples, but not at baseline. A paired analysis of selected OTUs was performed in 24 Italian patients who contributed a sample at baseline and a follow‐up sample during inactive disease, showing no differences between baseline and inactive disease (see Supplementary Figure 2, available at http://onlinelibrary.wiley.com/doi/10.1002/art.40827/abstract). However, ɑ‐diversity was lower in inactive disease in this subset of patients (P = 0.007 by Wilcoxon's signed rank test) (see Supplementary Figure 3, available at http://onlinelibrary.wiley.com/doi/10.1002/art.40827/abstract). No evidence for differences between samples from Dutch patients with inactive disease and healthy controls was found (see Supplementary Table 7, available at http://onlinelibrary.wiley.com/doi/10.1002/art.40827/abstract).
Figure 4.
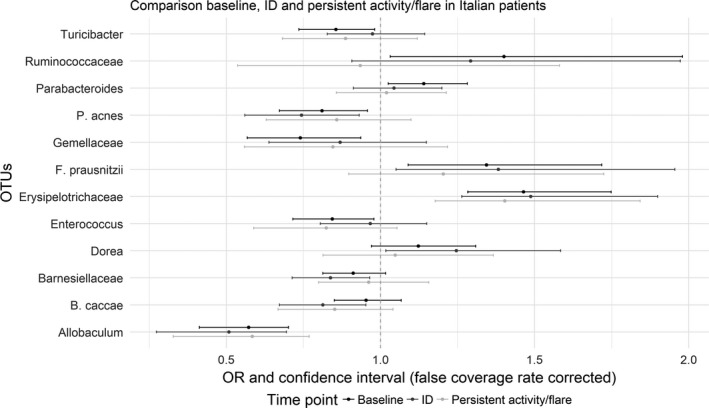
Comparison of the differences in relative abundance in Italian patients between baseline patient samples and healthy controls (black), inactive disease (ID) samples and healthy controls (dark gray), and persistent activity samples and healthy controls (light gray). Values are the regression coefficients (odds ratio [OR]) and false coverage rate–corrected confidence intervals for the depicted operational taxonomic units (OTUs), obtained in a separate multivariable logistic regression analysis for each OTU, with age and sex as covariates and patient/control status as dependent variable. Only OTUs with an adjusted P value of <0.05 for at least 1 of the baseline, the inactive disease, or the persistent activity analyses are shown. Regression coefficients and confidence intervals to the left of the vertical broken line (at x = 1) denote decreased relative abundance in patients; values to the right of the broken line denote increased relative abundance in patients.
Persistent disease activity samples
Analysis of α‐diversity showed decreased richness in samples from patients with persistent disease activity compared to healthy controls according to the Chao1 index (P = 0.004) (Figure 1). There was no evidence of differences according to the Shannon index. Analysis of β‐diversity showed evidence of differences between samples from patients with persistent activity and healthy controls (P = 0.001). There was weak evidence of differences between samples from patients with persistent activity and baseline samples (P = 0.02), and very weak evidence of differences between samples from patients with persistent activity and samples from those with inactive disease (P = 0.07) (Figure 1).
Results of the logistic regressions comparing samples from Italian patients with persistent activity and samples from healthy controls are reported in Supplementary Table 8 (available at http://onlinelibrary.wiley.com/doi/10.1002/art.40827/abstract). Evidence of differences was found for Allobaculum and Erysipelotrichaceae only. Figure 4 compares the results with those obtained in the baseline and inactive disease analyses.
Clinical features
Principal components regression showed strong evidence that the microbiota composition differed with age (association with the first and fifth principal components [P < 0.001 for both]) (see Supplementary Table 9, available at http://onlinelibrary.wiley.com/doi/10.1002/art.40827/abstract). A weak association was found with the presence of uveitis at baseline. Differently abundant OTUs were Blautia (P = 0.003), Coriobacteriaceae (P = 0.009), Coprococcus (P = 0.03), and Lachnospiraceae (P = 0.04) (all P values unadjusted; no differences remained after FDR correction). However, only 7 patients had uveitis at baseline. No or weak associations were found with sex, JIA subtype, physician's global assessment of disease activity, number of active joints, ANA positivity, use of NSAIDs, use of prebiotics, or prior gastrointestinal infections (Table 1 shows gastrointestinal disorders in the cohort) (also see Supplementary Table 9, available at http://onlinelibrary.wiley.com/doi/10.1002/art.40827/abstract).
Sensitivity analyses
The administration of antibiotics or probiotics in the month prior to sample collection was associated with the gut microbiota composition (see Supplementary Table 9). Therefore, the abovementioned analysis of Italian JIA patients at baseline was repeated after the exclusion of subjects who had taken either antibiotics or probiotics (sensitivity analysis A), and showed no substantial differences. Likewise, a sensitivity analysis was performed after excluding patients with a gastrointestinal disorder (sensitivity analysis B), and showed no substantial differences. To explore potential confounding even further, we selected all samples within the same age range from among Italian patients at baseline and healthy controls (age range 2–15 years), simultaneously excluding those who took antibiotics, prebiotics or probiotics, or who experienced gastrointestinal disorders (sensitivity analysis C), and this analysis showed no substantial differences (see Supplementary Tables 10–13, available at http://onlinelibrary.wiley.com/doi/10.1002/art.40827/abstract). A further analysis was performed calculating log ratios using simple multiplicative replacement of zeros in the data 29 instead of robust imputation, without major differences (data not shown). Finally, for completeness, a comparison of all OTUs (including those present in <20% of samples) between Italian patients at baseline and healthy controls was performed; the results are reported in Supplementary Table 3 (available at http://onlinelibrary.wiley.com/doi/10.1002/art.40827/abstract).
Discussion
This is the first study of microbiota composition in a prospective inception cohort of JIA patients, taking into account JIA disease activity state 12, 14, 15. The results of our study support the hypothesis that the composition of microbiota is different in JIA patients compared to healthy children. In our study, evidence was found that microbiota richness, in terms of rare OTUs as measured by the Chao1 index, was reduced in JIA patients compared to healthy controls, at baseline, during inactive disease, and during persistent disease activity, especially in Italian subjects. Dutch female patients showed an increased richness compared to Dutch female healthy controls, who had a decreased richness compared to all other control groups (Figure 1A). Measures of β‐diversity were different in all subgroups of patient samples compared to healthy controls, demonstrating the variability of microbial communities between groups. Differences in gut microbiota composition were observed between JIA patients at baseline and healthy children, both when classifying samples using the random forest algorithm (AUCs in test data >0.99 for Italian samples and 0.71 for Dutch samples, despite the Dutch samples not reaching traditional levels of significance in test data) and when analyzing the OTUs individually. Most notably, Erysipelotrichaceae and F prausnitzii were increased, while Allobaculum was decreased, in samples from Italian patients (Table 2 and Figure 4). Dutch patient samples were dissimilar to Italian patient samples, confirming the prior belief that the gut microbiota composition differs between these populations, due potentially to diet and other environmental factors. However, it could not be ruled out that the observed differences were due to different sample collection procedures used in the Italian and Dutch cohorts.
Few OTUs were differently abundant between controls and patients across all disease activity states. Nonetheless, when comparing baseline samples with paired inactive disease samples, no differences in relative abundance were found (Supplementary Figure 2, available at http://onlinelibrary.wiley.com/doi/10.1002/art.40827/abstract). This finding may indicate that the gut microbiota profile is specific to the individuals with JIA, rather than disease activity status. However, it should be taken into account that JIA is very heterogeneous clinically, and different diseases may be underlying the clinical symptoms. Therefore, this conclusion is still preliminary. Finally, the results also indicated a strong relationship of the microbiota composition with age, as found previously 32, 33.
In light of these results, we ask whether the microbiota composition is involved in the pathogenesis of JIA. Observations compatible with a pathogenic role of microbiota include a reduced number of Th17‐ and FoxP3‐positive regulatory T cells in germ‐free mice 1, 2, 10, 11. Administration of stools from healthy mice to these germ‐free mice led to a reconstitution of Th17 numbers 34, suggesting that microbiota influence the development of the immune system. Conversely, inoculation of fecal samples from rheumatoid arthritis patients into mice led to an increase of Th17 cells and development of severe arthritis 3. These cell populations are of critical importance in immune homeostasis and play a key role in the pathogenesis of autoimmune diseases, including JIA 2, 35. Additionally, in a cohort of patients with the enthesitis‐related arthritis (ERA) subtype of JIA compared to healthy controls, differences in community structure were predicted to decrease metabolic functions. In the same cohort, a lower diversity of ions and underrepresentation of the tryptophan metabolic pathway was observed in patients 36. Tryptophan metabolites can lead to the production of proinflammatory cytokines, thus potentially linking the gut microbiota with inflammation 36. In another cohort of ERA patients, predicted functions of the gut microbiota were related to cell motility and chemotaxis 12. Furthermore, the risk of developing autoimmune disorders was increased following the use of antibiotics in early childhood. This risk was dependent on the number, dose, and timing of the antibiotic prescriptions 37, 38. Our finding of a weak association with uveitis is consistent with the previous finding in mouse models that activation of retina‐specific T cells was dependent on gut commensal microbiota 39.
Fecal microbiota transplantation has led to promising, though varying, results for inflammatory bowel disorders 40, 41, 42, 43, and an exploratory analysis in JIA patients showed that exclusive enteral feeding had an antiinflammatory effect 44. Finally, our finding of reduced diversity in inactive disease samples compared to baseline samples (see Supplementary Figure 3, available at http://onlinelibrary.wiley.com/doi/10.1002/art.40827/abstract) supports the idea that reduced microbiota diversity is not a consequence of inflammation. Nevertheless, these are preliminary findings, and a causal pathway has yet to be demonstrated.
The OTUs Erysipelotrichaceae, F prausnitzii, and Allobaculum have been associated previously with human disease. Erysipelotrichaceae appears to be highly immunogenic 45, 46 and can potentially overgrow in the gut after treatment with broad‐spectrum antibiotics 47. F prausnitzii was identified to have antiinflammatory properties, and a decreased abundance of this microorganism in the gut has been associated with Crohn's disease 48 and JIA 12, 14. Yet in our study it was increased in Italian patients at baseline. However, previous studies examined ERA only, whereas our cohort contained a majority of patients with oligoarticular and polyarticular disease. Furthermore, previous studies did not use compositional data analysis when comparing OTUs between groups. Finally, the balance among different subspecies of F prausnitzii can result in changes in short‐chain fatty acid production; therefore, a fine‐level characterization of F prausnitzii strains is important to better understand their real function in the microbiome 49. Such a fine‐level characterization was not available in our study. Another possibility is that F prausnitzii was increased as an effect, rather than a cause, of inflammation. Allobaculum is associated with obesity. Several studies have demonstrated that its abundance was lower in the gut of obese mice 50, 51 and increased in weight‐reduced mice 52. Furthermore, Allobaculum was positively correlated with plasma high‐density lipoprotein concentrations in hamsters 53 and negatively correlated with leptin concentration 52.
Our study has several strengths. We studied a large cohort of treatment‐naive JIA patients compared to healthy controls. Patients were followed up longitudinally, allowing for the comparison of microbiota between various disease activity states. Finally, we used compositional data analysis to assess data expressed as proportions of a whole, such as microbiota relative abundances 27, 28. Failure to do so can lead to an increased FDR, up to 68% 17.
Despite this being the largest study of gut microbiota composition in JIA patients, one limitation is the relatively small number of Dutch patient inactive disease and persistent disease activity samples, as well as the number of paired samples, which re‐emphasizes the need for replication in future cohorts. Moreover, age and potentially sex should be matched more closely between patients and controls to allow for a better comparison. Finally, future studies should examine the mechanistic implications of gut dysbiosis in JIA.
In conclusion, our results support the hypothesis of gut dysbiosis in JIA patients in terms of richness and compositional deviation from healthy subjects. Clearly, future investigations should be aimed at replicating these results in other populations, elucidating the potential causal role of gut microbiota in the pathogenesis of JIA, and investigating the interaction among genetics, microbiota, and environmental factors in the development of JIA.
Author Contributions
All authors were involved in drafting the article or revising it critically for important intellectual content, and all authors approved the final version to be submitted for publication. Dr. van Dijkhuizen had full access to all of the data in the study and takes responsibility for the integrity of the data and the accuracy of the data analysis.
Study conception and design
Van Dijkhuizen, Del Chierico, Malattia, Magni‐Manzoni, Vastert, Dallapiccola, Prakken, Martini, De Benedetti, Putignani.
Acquisition of data
Van Dijkhuizen, Del Chierico, Pires Marafon, ter Haar, Putignani.
Analysis and interpretation of data
Van Dijkhuizen, Del Chierico, Malattia, Russo, Putignani.
Supporting information
Supported by the European Commission's Seventh Framework Programme (Information Communication Technologies Programme 600932).
No potential conflicts of interest relevant to this article were reported.
References
- 1. Cho I, Blaser MJ. The human microbiome: at the interface of health and disease. Nat Rev Genet 2012;13:260–70. [DOI] [PMC free article] [PubMed] [Google Scholar]
- 2. Verwoerd A, ter Haar NM, de Rook S, Vastert SJ, Bogaert D. The human microbiome and juvenile idiopathic arthritis. Pediatr Rheumatol Online J 2016;14:55. [DOI] [PMC free article] [PubMed] [Google Scholar]
- 3. Maeda Y, Kurakawa T, Umemoto E, Motooka D, Ito Y, Gotoh K, et al. Dysbiosis contributes to arthritis development via activation of autoreactive T cells in the intestine. Arthritis Rheumatol 2016;68:2646–61. [DOI] [PubMed] [Google Scholar]
- 4. Scher JU, Sczesnak A, Longman RS, Segata N, Ubeda C, Bielski C, et al. Expansion of intestinal Prevotella copri correlates with enhanced susceptibility to arthritis. Elife 2013;2:e01202. [DOI] [PMC free article] [PubMed] [Google Scholar]
- 5. Zhang X, Zhang D, Jia H, Feng Q, Wang D, Liang D, et al. The oral and gut microbiomes are perturbed in rheumatoid arthritis and partly normalized after treatment. Nat Med 2015;21:895–905. [DOI] [PubMed] [Google Scholar]
- 6. Giongo A, Gano KA, Crabb DB, Mukherjee N, Novelo LL, Casella G, et al. Toward defining the autoimmune microbiome for type 1 diabetes. ISME J 2011;5:82–91. [DOI] [PMC free article] [PubMed] [Google Scholar]
- 7. Missaghi B, Barkema HW, Madsen KL, Ghosh S. Perturbation of the human microbiome as a contributor to inflammatory bowel disease. Pathogens 2014;3:510–27. [DOI] [PMC free article] [PubMed] [Google Scholar]
- 8. Vaahtovuo J, Munukka E, Korkeamaki M, Luukkainen R, Toivanen P. Fecal microbiota in early rheumatoid arthritis. J Rheumatol 2008;35:1500–5. [PubMed] [Google Scholar]
- 9. Scher JU, Ubeda C, Artacho A, Attur M, Isaac S, Reddy SM, et al. Decreased bacterial diversity characterizes the altered gut microbiota in patients with psoriatic arthritis, resembling dysbiosis in inflammatory bowel disease. Arthritis Rheumatol 2015;67:128–39. [DOI] [PMC free article] [PubMed] [Google Scholar]
- 10. Kamada N, Seo SU, Chen GY, Nunez G. Role of the gut microbiota in immunity and inflammatory disease. Nat Rev Immunol 2013;13:321–35. [DOI] [PubMed] [Google Scholar]
- 11. Wu HJ, Ivanov II, Darce J, Hattori K, Shima T, Umesaki Y, et al. Gut‐residing segmented filamentous bacteria drive autoimmune arthritis via T helper 17 cells. Immunity 2010;32:815–27. [DOI] [PMC free article] [PubMed] [Google Scholar]
- 12. Di Paola M, Cavalieri D, Albanese D, Sordo M, Pindo M, Donati C, et al. Alteration of fecal microbiota profiles in juvenile idiopathic arthritis: associations with HLA‐B27 allele and disease status. Front Microbiol 2016;7:1703. [DOI] [PMC free article] [PubMed] [Google Scholar]
- 13. Hissink Muller PC, Westedt PM, Budding AE, Allaart CF, Brinkman DM, Kuijpers TW, et al. PReS‐FINAL‐2160: intestinal microbiome in polyarticular juvenile idiopathic arthritis: a pilot study. Pedatr Rheumatol Online J 2013;11 Suppl 2:P172. [Google Scholar]
- 14. Stoll ML, Kumar R, Morrow CD, Lefkowitz EJ, Cui X, Genin A, et al. Altered microbiota associated with abnormal humoral immune responses to commensal organisms in enthesitis‐related arthritis. Arthritis Res Ther 2014;16:486. [DOI] [PMC free article] [PubMed] [Google Scholar]
- 15. Tejesvi MV, Arvonen M, Kangas SM, Keskitalo PL, Pirttila AM, Karttunen TJ, et al. Faecal microbiome in new‐onset juvenile idiopathic arthritis. Eur J Clin Microbiol Infect Dis 2016;35:363–70. [DOI] [PubMed] [Google Scholar]
- 16. Ravelli A, Martini A. Juvenile idiopathic arthritis. Lancet 2007;369:767–78. [DOI] [PubMed] [Google Scholar]
- 17. Mandal S, van Treuren W, White RA, Eggesbo M, Knight R, Peddada SD. Analysis of composition of microbiomes: a novel method for studying microbial composition. Microb Ecol Health Dis 2015;26:27663. [DOI] [PMC free article] [PubMed] [Google Scholar]
- 18. Petty RE, Southwood TR, Manners P, Baum J, Glass DN, Goldenberg J, et al. International League of Associations for Rheumatology classification of juvenile idiopathic arthritis: second revision, Edmonton, 2001. J Rheumatol 2004;31:390–2. [PubMed] [Google Scholar]
- 19. Consolaro A, Ruperto N, Bazso A, Pistorio A, Magni‐Manzoni S, Filocamo G, et al. Development and validation of a composite disease activity score for juvenile idiopathic arthritis. Arthritis Rheum 2009;61:658–66. [DOI] [PubMed] [Google Scholar]
- 20. Wallace CA, Giannini EH, Huang B, Itert L, Ruperto N, for the Childhood Arthritis Rheumatology Research Alliance (CARRA), the Pediatric Rheumatology Collaborative Study Group (PRCSG), and the Paediatric Rheumatology International Trials Organisation . American College of Rheumatology provisional criteria for defining clinical inactive disease in select categories of juvenile idiopathic arthritis. Arthritis Care Res (Hoboken) 2011;63:929–36. [DOI] [PubMed] [Google Scholar]
- 21. De Filippis F, La Storia A, Villani F, Ercolini D. Exploring the sources of bacterial spoilers in beefsteaks by culture‐independent high‐throughput sequencing. PLoS One 2013;8:e70222. [DOI] [PMC free article] [PubMed] [Google Scholar]
- 22. Caporaso JG, Kuczynski J, Stombaugh J, Bittinger K, Bushman FD, Costello EK, et al. QIIME allows analysis of high‐throughput community sequencing data. Nat Methods 2010;7:335–6. [DOI] [PMC free article] [PubMed] [Google Scholar]
- 23. Silverman JD, Washburne AD, Mukherjee S, David LA. A phylogenetic transform enhances analysis of compositional microbiota data. Elife 2017;6:e21887. [DOI] [PMC free article] [PubMed] [Google Scholar]
- 24. Fodor AA, DeSantis TZ, Wylie KM, Badger JH, Ye Y, Hepburn T, et al. The “most wanted” taxa from the human microbiome for whole genome sequencing. PLoS One 2012;7:e41294. [DOI] [PMC free article] [PubMed] [Google Scholar]
- 25. De Filippo C, Di Paola M, Ramazzotti M, Albanese D, Pieraccini G, Banci E, et al. Diet, environments, and gut microbiota: a preliminary investigation in children living in rural and urban Burkina Faso and Italy. Front Microbiol 2017;8:1979. [DOI] [PMC free article] [PubMed] [Google Scholar]
- 26. Strati F, Cavalieri D, Albanese D, De Felice C, Donati C, Hayek J, et al. New evidences on the altered gut microbiota in autism spectrum disorders. Microbiome 2017;5:24. [DOI] [PMC free article] [PubMed] [Google Scholar]
- 27. Aitchison J. The statistical analysis of compositional data. London: Chapman & Hall; 1986. [Google Scholar]
- 28. Gloor GB, Wu JR, Pawlowsky‐Glahn V, Egozcue JJ. It's all relative: analyzing microbiome data as compositions. Ann Epidemiol 2016;26:322–9. [DOI] [PubMed] [Google Scholar]
- 29. Martín‐Fernández JA, Barceló‐Vidal C, Pawlowsky‐Glahn V. Dealing with zeros and missing values in compositional data sets using nonparametric imputation. Math Geol 2003;35:253–78. [Google Scholar]
- 30. Palarea‐Albaladejo J, Martín‐Fernández JA. A modified EM alr‐algorithm for replacing rounded zeros in compositional data sets. Comput Geosci 2008;34:902–17. [Google Scholar]
- 31. Consolaro A, Ruperto N, Bracciolini G, Frisina A, Gallo MC, Pistorio A, et al. Defining criteria for high disease activity in juvenile idiopathic arthritis based on the juvenile arthritis disease activity score. Ann Rheum Dis 2014;73:1380–3. [DOI] [PubMed] [Google Scholar]
- 32. Odamaki T, Kato K, Sugahara H, Hashikura N, Takahashi S, Xiao JZ, et al. Age‐related changes in gut microbiota composition from newborn to centenarian: a cross‐sectional study. BMC Microbiol 2016;16:90. [DOI] [PMC free article] [PubMed] [Google Scholar]
- 33. Rodríguez JM, Murphy K, Stanton C, Ross RP, Kober OI, Juge N, et al. The composition of the gut microbiota throughout life, with an emphasis on early life. Microb Ecol Health Dis 2015;26:26050. [DOI] [PMC free article] [PubMed] [Google Scholar]
- 34. Ivanov II, Frutos RL, Manel N, Yoshinaga K, Rifkin DB, Sartor RB, et al. Specific microbiota direct the differentiation of IL‐17‐producing T‐helper cells in the mucosa of the small intestine. Cell Host Microbe 2008;4:337–49. [DOI] [PMC free article] [PubMed] [Google Scholar]
- 35. Prakken B, Albani S, Martini A. Juvenile idiopathic arthritis. Lancet 2011;377:2138–49. [DOI] [PubMed] [Google Scholar]
- 36. Stoll ML, Kumar R, Lefkowitz EJ, Cron RQ, Morrow CD, Barnes S. Fecal metabolomics in pediatric spondyloarthritis implicate decreased metabolic diversity and altered tryptophan metabolism as pathogenic factors. Genes Immun 2016;17:400–5. [DOI] [PMC free article] [PubMed] [Google Scholar]
- 37. Arvonen M, Virta LJ, Pokka T, Kroger L, Vahasalo P. Repeated exposure to antibiotics in infancy: a predisposing factor for juvenile idiopathic arthritis or a sign of this group's greater susceptibility to infections? J Rheumatol 2015;42:521–6. [DOI] [PubMed] [Google Scholar]
- 38. Horton DB, Scott FI, Haynes K, Putt ME, Rose CD, Lewis JD, et al. Antibiotic exposure and juvenile idiopathic arthritis: a case‐control study. Pediatrics 2015;136:e333–43. [DOI] [PMC free article] [PubMed] [Google Scholar]
- 39. Horai R, Zarate‐Blades CR, Dillenburg‐Pilla P, Chen J, Kielczewski JL, Silver PB, et al. Microbiota‐dependent activation of an autoreactive T cell receptor provokes autoimmunity in an immunologically privileged site. Immunity 2015;43:343–53. [DOI] [PMC free article] [PubMed] [Google Scholar]
- 40. Mattner J, Schmidt F, Siegmund B. Faecal microbiota transplantation: a clinical view. Int J Med Microbiol 2016;306:310–5. [DOI] [PubMed] [Google Scholar]
- 41. Moayyedi P, Surette MG, Kim PT, Libertucci J, Wolfe M, Onischi C, et al. Fecal microbiota transplantation induces remission in patients with active ulcerative colitis in a randomized controlled trial. Gastroenterology 2015;149:102–9. [DOI] [PubMed] [Google Scholar]
- 42. Rossen NG, Fuentes S, van der Spek MJ, Tijssen JG, Hartman JH, Duflou A, et al. Findings from a randomized controlled trial of fecal transplantation for patients with ulcerative colitis. Gastroenterology 2015;149:110–8. [DOI] [PubMed] [Google Scholar]
- 43. Vermeire S, Joossens M, Verbeke K, Wang J, Machiels K, Sabino J, et al. Donor species richness determines faecal microbiota transplantation success in inflammatory bowel disease. J Crohns Colitis 2016;10:387–94. [DOI] [PMC free article] [PubMed] [Google Scholar]
- 44. Berntson L, Hedlund‐Treutiger I, Alving K. Anti‐inflammatory effect of exclusive enteral nutrition in patients with juvenile idiopathic arthritis. Clin Exp Rheumatol 2016;34:941–5. [PubMed] [Google Scholar]
- 45. Dinh DM, Volpe GE, Duffalo C, Bhalchandra S, Tai AK, Kane AV, et al. Intestinal microbiota, microbial translocation, and systemic inflammation in chronic HIV infection. J Infect Dis 2015;211:19–27. [DOI] [PMC free article] [PubMed] [Google Scholar]
- 46. Palm NW, de Zoete MR, Cullen TW, Barry NA, Stefanowski J, Hao L, et al. Immunoglobulin A coating identifies colitogenic bacteria in inflammatory bowel disease. Cell 2014;158:1000–10. [DOI] [PMC free article] [PubMed] [Google Scholar]
- 47. Zhao Y, Wu J, Li JV, Zhou NY, Tang H, Wang Y. Gut microbiota composition modifies fecal metabolic profiles in mice. J Proteome Res 2013;12:2987–99. [DOI] [PubMed] [Google Scholar]
- 48. Sokol H, Pigneur B, Watterlot L, Lakhdari O, Bermudez‐Humaran LG, Gratadoux JJ, et al. Faecalibacterium prausnitzii is an anti‐inflammatory commensal bacterium identified by gut microbiota analysis of Crohn disease patients. Proc Natl Acad Sci U S A 2008;105:16731–6. [DOI] [PMC free article] [PubMed] [Google Scholar]
- 49. Song H, Yoo Y, Hwang J, Na YC, Kim HS. Faecalibacterium prausnitzii subspecies‐level dysbiosis in the human gut microbiome underlying atopic dermatitis. J Allergy Clin Immunol 2016;137:852–60. [DOI] [PubMed] [Google Scholar]
- 50. Cani PD, Bibiloni R, Knauf C, Waget A, Neyrinck AM, Delzenne NM, et al. Changes in gut microbiota control metabolic endotoxemia‐induced inflammation in high‐fat diet‐induced obesity and diabetes in mice. Diabetes 2008;57:1470–81. [DOI] [PubMed] [Google Scholar]
- 51. Fleissner CK, Huebel N, Abd El‐Bary MM, Loh G, Klaus S, Blaut M. Absence of intestinal microbiota does not protect mice from diet‐induced obesity. Br J Nutr 2010;104:919–29. [DOI] [PubMed] [Google Scholar]
- 52. Ravussin Y, Koren O, Spor A, LeDuc C, Gutman R, Stombaugh J, et al. Responses of gut microbiota to diet composition and weight loss in lean and obese mice. Obesity (Silver Spring) 2012;20:738–47. [DOI] [PMC free article] [PubMed] [Google Scholar]
- 53. Martinez I, Wallace G, Zhang C, Legge R, Benson AK, Carr TP, et al. Diet‐induced metabolic improvements in a hamster model of hypercholesterolemia are strongly linked to alterations of the gut microbiota. Appl Environ Microbiol 2009;75:4175–84. [DOI] [PMC free article] [PubMed] [Google Scholar]
Associated Data
This section collects any data citations, data availability statements, or supplementary materials included in this article.
Supplementary Materials