

Supplemental Digital Content is available in the text.
Keywords: China, Japan, mortality, sodium, stroke
Abstract
Background and Purpose—
The aim of this study is to assess the long-term trends in stroke mortality attributable to high sodium intake in China and Japan during the period 1990 to 2016.
Methods—
The mortality data were obtained from the GBD study (Global Burden of Disease) 2016 and were analyzed using an age-period-cohort method.
Results—
The age-standardized mortality rates showed declining trends for high sodium intake-related stroke mortality. The overall net drifts per year were −3.1% for Chinese men and −5.0% for Chinese women; and −4.6% for Japanese men and −5.7% for Japanese women. The local drift values were below zero in all age groups for both sexes in both countries, and all local drift values of female participants were below their counterparts of male participants. The longitudinal age curves of high sodium intake-attributable stroke mortality increased rapidly for both sexes in China, whereas those of Japanese were slowly rising. The period and cohort rate ratios were found to have similar downward patterns for both sexes in both countries, with a quicker decline for women than for men (significantly with P<0.05 for all).
Conclusions—
The age-standardized mortality rates, the period effect and the cohort effect of stroke mortality attributable to high sodium intake in China and Japan have been declining in both sexes and all age groups from 1990 to 2016. Consequently, sodium-reduction strategies are of low cost and effective for the prevention of stroke. It is necessary to educate the nation with the correct knowledge on healthy diet and techniques to reduce salt consumption.
In East Asia (eg, Japan and China), the mortality rates for stroke were higher than in Western countries (eg, United Kingdom and United States)1 and represented the first and fourth leading cause of death in China2 and Japan,3 respectively. The age-standardized mortality rates (ASMRs) per 100 000 Japanese in the age group of 35 to 74 years were 385 for men and 225 for women in 1970 but were reduced to 79 for men and 41 for women in 1994 to 1998. The decline rates for stroke were 80% and 82% for Japanese men and women, respectively.1 In China, however, the mortality rates from stroke were still excessively high for both men and women in 1994 to 1998; and the ASMRs per 100 000 Chinese aged 35 to 74 years were 230 for men and 151 for women.1 Moreover, despite the general declination of stroke mortality rate in China, it temporarily rebounded after 2006 and increased from 102.44 per 100 000 to 125.56 (a 26.6% increase) in the urban population between 2003 and 2013.4,5 Therefore, it is still important to identify the controllable risk factors targeted by preventive strategies and health-care management that lead to a larger decrease in stroke mortality trends in Japan compared with China.
Several epidemiological studies concluded that high sodium intake was positively associated with risk of stroke.3,6–9 An average increase of 86 mmol/d of sodium intake (equivalent to ≈5 g of salt) was associated with a statistically significant 23% increase in stroke risk in a meta-analysis of prospective studies.9 Other studies also showed that sodium reduction could decrease the risk of stroke via decreasing the blood pressure and body fluid volume.10,11 Salt intake that met the recommended maximum intake in the Dutch population was associated with a 5.8% decrease of stroke incidence.11
The World Health Organization recommends <5 grams of salt per day (g/d; equivalent to 2 g of sodium daily) for average daily intake for adults,12–14 whereas the salt intake level is usually between 9 and 12 g in many countries.15,16 Excessive sodium intake in 2010 caused 1.65 million deaths worldwide.17 In Japan, the mean salt intake was markedly high in the 1950s to 1960s.10,18 For example, the salt intake of residents in the Tohoku District (1950s) was 25 to 30 g/d.10 In China, the INTERSALT (International Study on Salt and Blood Pressure) showed that the dietary salt intake in Tianjin was 15 g/d in 1988.19
None of the existing studies on stroke mortality attributable to high sodium intake had explored differences between age-groups and all of them lacked comprehensive analyses of the possible reasons underlying the long-term trends. Therefore, we aimed to focus on the comparison of stroke mortality attributable to high sodium intake in China and Japan during the period between 1990 and 2016. We analyzed the independent effects of chronological age, time period, and birth cohort and the temporal trends by an age-period-cohort model (APC) with an intrinsic estimator algorithm, using data from the GBD study (Global Burden of Disease) 2016.
Methods
GBD Study 2016
The GBD 2016 is a large international cooperation project directed by the Institute for Health Metrics and Evaluation and is the world’s most comprehensive data of surveys, censuses, vital statistics, and other health-related data. The data can be used, shared, modified, or built on via the Open Data Commons Attribution License.20 Data are available at the GBD Data Tool repository and can be accessed at http://ghdx.healthdata.org/gbd-results-tool. The study provides a comprehensive estimation of risk-specific mortality rates for 84 risk factors of death (including behavioral, metabolic, environmental, and occupational risks) and internally consistent estimates of age- and sex-specific mortality rates for 264 causes of death on the national, regional, and global scales from 1990 to 2016.21,22 In the GBD 2016, data on stroke mortality were collected from the Disease Surveillance Points, the Maternal and Child Surveillance System, and the Chinese Center for Disease Control and Prevention Cause of Death Reporting System in China, and from the Social Health Insurance System in Japan.23,24 Stroke morbidity and mortality were diagnosed and defined based on the World Health Organization clinical criteria and the International Statistical Classification of Diseases, Ninth and Tenth revisions and Related Health Problems.25 In the GBD data, high sodium intake was defined as 24-hour urinary sodium >5 g/d. The estimation of attributable burden was based on 4 key components: the metric of burden being assessed (such as a number of deaths), the exposure levels for a risk factor, the relative risk of a given outcome because of exposure, and the counterfactual level of risk factor exposure. Estimates of high sodium intake-attributable stroke mortality were equal to the total number of stroke deaths multiplied by the population attributable fraction for the risk-outcome pair for a given age, sex, location, and year. The population attributable fraction represents the proportion of stroke deaths that would be reduced in a given year if the exposure to high sodium intake in the past were reduced to the counterfactual level of the theoretical minimum risk exposure level (=24-hour urinary sodium between 1 and 5 g/d).26 The sex-specific temporal trends of high sodium intake-attributable stroke mortality rates for males and females in China and Japan, one of 84 risk factors in the GBD 2016 data, were age-standardized by the GBD 2013 global age-standard population in each country.7
Statistical Analyses
Mortality rates represent not only death risks experienced by the population in a particular year but also the accumulation of health risks since birth. An ordinary statistical analysis could not accurately assess these death/health risks.27,28 Therefore, an APC framework was used to evaluate the contributions of age, period, and cohort effects on high sodium intake-attributable stroke mortality. The age effect represents the social and biological processes of aging.21 The period effect reflects events and changes over time affecting high sodium intake-attributable stroke mortality in all age groups (eg, preventive measures, new medical procedures, or modifications to certification practices). The cohort effect is related to the differences in high sodium intake-attributable stroke mortality between each generation of individual groups because of risk factors and environmental exposures shared by each generation.29–32
Using APC analysis, the following functions were estimated33: (1) The net drift; the overall log-linear trend by calendar period and birth cohort that indicates the overall annual percentage change. (2) The local drifts; the log-linear trend by calendar period and birth cohort for each age group that indicates annual percentage changes for each age group. (3) The longitudinal age curves which show the fitted longitudinal age-specific rates in the reference cohort adjusted for period deviations. (4) The cohort (or period) rate ratios (RR) which represent the cohort (or period) relative risk adjusted for age and nonlinear period (or cohort) effects in a cohort (or period) versus the reference one.
To estimate the age, period, and cohort effects, the age-specific stroke mortality attributable to high sodium intake was recoded into consecutive 5-year periods from 1990 to 2016 and successive 5-year age groups from 25 to 29 years to 75 to 79 years. Since high sodium intake-attributable stroke mortality is rare below the age of 25 years, and all individuals aged 80 years or older were recorded as one age group in the GBD database, participants aged <25 or ≥80 years were excluded from the analyses.
To address the problem of identification of the model parameters (perfect collinearity of the age, period, and cohort variables), the intrinsic estimator method was used to conduct the APC analyses.29
Estimable parameters were obtained using the APC Web Tool (Biostatistics Branch, National Cancer Institute, Bethesda, MD; https://analysistools.nci.nih.gov/apc/).33 The central age group, period, and birth cohort were defined as the reference in all analyses.28 Wald χ2 tests were adopted to test for significance of the estimable functions. To assess the statistical significance of the slopes for the period/cohort RRs, general linear models were used to evaluate the interaction terms between sex and calendar year/birth cohort. SAS Version 9.4 software (SAS Institute Inc, Cary, NC) was used to conduct the statistical analyses. All statistical tests were 2-tailed and P<0.05 were regarded as significant.
Results
Our study included 2 585 783 Chinese stroke cases (1 540 016 men and 1 045 767 women) and 105 201 Japanese stroke cases (66 820 men and 38 381 women) aged 25 to 79 years from 1990 through 2016. The ASMRs of high sodium intake-attributable stroke mortality for both sexes in China were higher than those in Japan (P for difference <0.05 for all time points). The decreasing trends of the ASMRs for high sodium intake-attributable stroke mortality by sex in China and Japan are shown in Figure 1. The ASMRs per 100 000 declined from 106.6 in 1990 to 47.8 in 2016 for men and from 79.7 to 24.8 for women in China and from 30.8 to 9.1 for Japanese men and from 18.4 to 3.6 for Japanese women.
Figure 1.
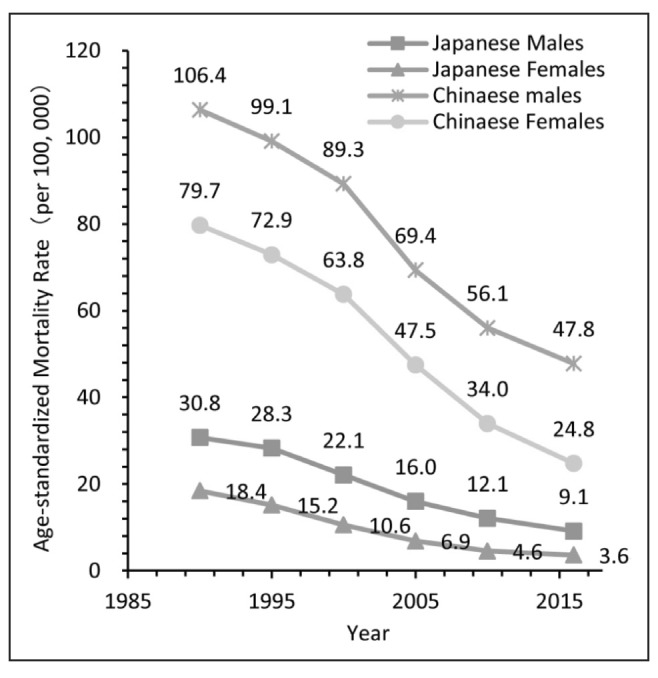
Trends of the age-standardized mortality rates (ASMRs) per 100 000 population for high sodium intake-attributable stroke mortality by sex in China and Japan, 1990–2016. Standardized to the GBD 2013 (Global Burden of Disease Study 2013) global age-standard population.
Figures 2 and 3 show the net drifts and local drifts for high sodium intake-attributable stroke mortality in China and Japan, respectively. From 1990 through 2016, the overall net drifts per year were −3.1% (95% CI, −3.3% to −2.9%) for Chinese men and −5.0% (95% CI, −5.2% to −4.8%) for Chinese women and −4.6% (95% CI, −4.9% to −4.3%) for Japanese men and −5.7% (95% CI, −6.1% to −5.3%) for Japanese women (P<0.01 for all). Although the local drift values were below zero in all age groups for both sexes and both countries, the curves of local drifts for high sodium intake-attributable stroke mortality across the age groups for both sexes in Japan showed downward trends, especially for Japanese women (from −4.7% for the age group 25–29 years to −8.1% for women aged 75–79 years). However, those for Chinese women indicated upward trends (from −5.3% for women aged 25–29 years to −4.3% for women aged 75–79 years). All local drift values of female participants were below their counterparts of male participants.
Figure 2.
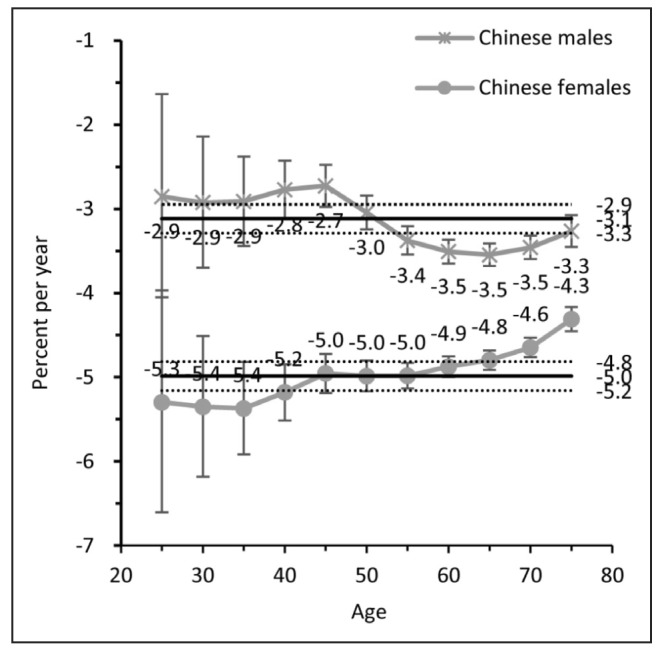
Local drift with net drift values for high sodium intake-attributable stroke mortality in China. Age group-specific annual percent change (local drift) with the overall annual percent change (net drift) in high sodium intake-attributable stroke mortality rate. Net drift values are depicted as solid lines with dashed lines representing their 95% CIs. Error bars represent the 95% CIs for the local drift values.
Figure 3.
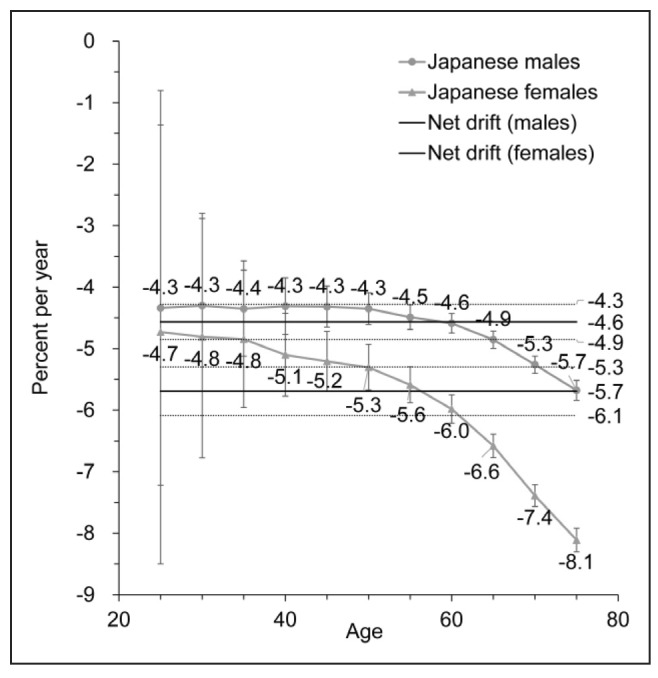
Local drift with net drift values for high sodium intake-attributable stroke mortality in Japan. Age group-specific annual percent change (local drift) with the overall annual percent change (net drift) in high sodium intake-attributable stroke mortality rate. Net drift values are depicted as solid lines with dashed lines representing their 95% CIs. Error bars represent the 95% CIs for the local drift values.
The longitudinal age curves of high sodium intake-attributable stroke mortality by sex and country are illustrated in Figure 4. In the same birth cohort, high sodium intake-attributable stroke mortality rates per 100 000 increased rapidly to peak at the life stage of 75 to 79 years old for both sexes in China; rates climbed from 3.0 in men aged 25 to 29 years to 232.5 in the age group of 75 to 79 years, and from 3.4 to 121.7 for Chinese women in the respective age groups. However, those for Japanese men were slowly rising from 0.8 in the age group of 25 to 29 years to 40.2 in men aged 75 to 79 years and from 0.6 to 13.3 for Japanese women in the respective age groups.
Figure 4.
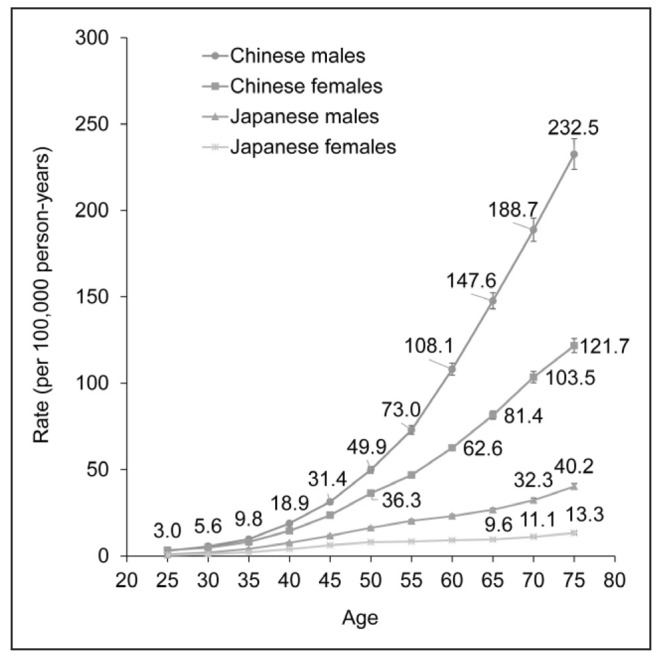
Longitudinal age curves of high sodium intake-attributable stroke mortality in China and Japan. Fitted longitudinal age-specific rates of high sodium intake-attributable stroke mortality (per 100 000 person-years). Error bars represent the 95% CIs for the longitudinal age curve values.
The estimated period and cohort RRs by sex and country were shown in Figures 5 and 6. The period RRs all followed downward patterns for both sexes and in both countries, with quicker declination for women than for men during the whole period. However, high sodium intake-attributable stroke mortality risk of Chinese was lower than that of Japanese before the year 2000; then opposite findings emerged afterward. Similarly, the cohort RRs were also found to show monotonic decreasing patterns for both sexes in both countries in all successive cohorts, especially for Japanese females. The cohort RRs declined from 3.3 in 1915 to 0.3 in 1990 for Chinese men and from 4.9 to 0.1 for Chinese women and from 6.7 to 0.2 for Japanese men and from 14.3 to 0.1 for Japanese women. In addition, based on the specific results of Wald tests (Table I in the online-only Data Supplement), the cohort and period RRs were statistically significant for both sexes in both countries (P<0.001 for all) and so were the net and local drifts.
Figure 5.
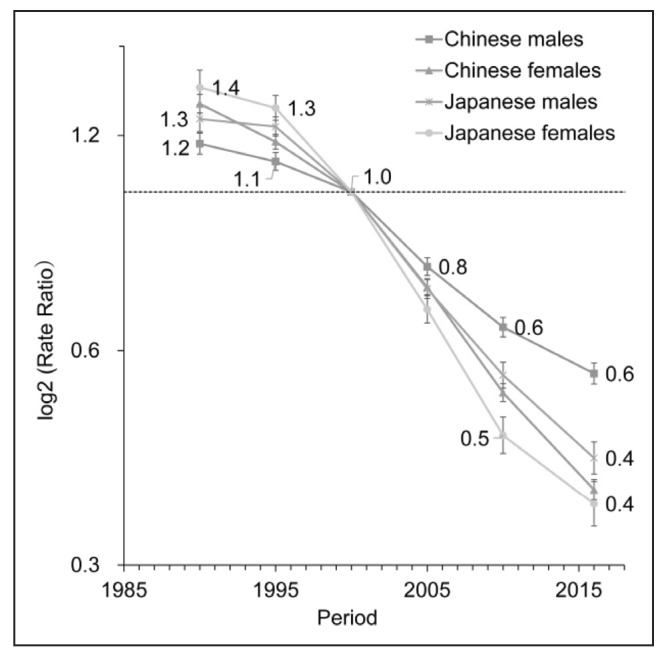
Period relative risks (RRs) of high sodium intake-attributable stroke mortality rate by sex in China and Japan. The relative risk of each period compared with the reference one (year 2000) adjusted for age and nonlinear cohort effects. Error bars represent the 95% CIs for the period relative risks.
Figure 6.
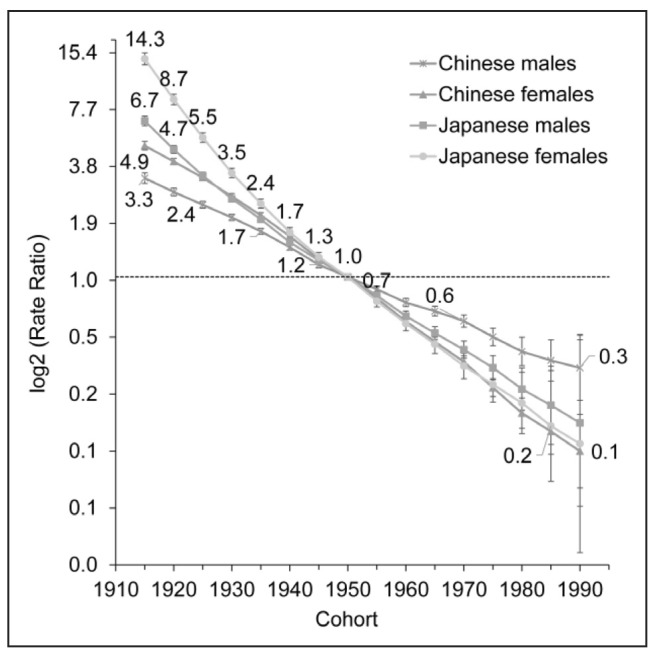
Cohort relative risks (RRs) of high sodium intake-attributable stroke mortality rate by sex in China and Japan. The relative risk of each cohort compared with the reference one (cohort 1950) adjusted for age and nonlinear period effects. Error bars represent the 95% CIs for the cohort relative risks.
Discussion
A clear downward trend of the ASMRs was observed for stroke mortality attributable to high sodium intake among Chinese and Japanese during the period 1990 to 2016. The curves of the net and local drifts were all below zero in all age groups of both sexes in both countries. We also found that the longitudinal age curves of high sodium intake-attributable stroke mortality for both sexes increased rapidly in China but slowly in Japan. The period RRs—indicating a decline in high sodium intake-attributable stroke mortality in all age groups regardless of age and birth cohort effects—and the cohort RRs—indicating a more substantial reduction in stroke mortality among younger generations regardless of the age and period effects—were found to have similar downward patterns for both sexes in both countries, with more quickly declining trends for women than for men.
High sodium intake was associated with an increased risk of stroke mortality in both countries.34,35 Suggested mechanisms include (1) Persistent hypertension which occurs when dietary sodium intake is too high to be adequately excreted.36 Also, the normal circadian rhythm of blood pressure follows the pattern of dipping from day to night; thus, elevated blood pressure due to high sodium intake is most likely to start during sleep.37 Then, nocturnal hypertension can increase the risk of stroke mortality.37,38 (2) Another possible mechanism is the salt-mediated vascular oxidative stress resulting in vascular injury and, eventually, stroke.39
The daily sodium intake in Japan and China was the highest in the world and started to decrease gradually from 25 to 30 g in 196010 to 10.0 g in 201540 in Japan and from 15 g in 198819 to 4.7 g in 200941 in China. Therefore, the ASMRs for high sodium intake-attributable stroke mortality showed decreasing trends from 1990 to 2015 in both Japan and China.
In the current study, the curves of local drifts for high sodium intake-attributable stroke mortality showed a more substantial yearly decline for older than younger participants, except for Chinese women. According to a study of 24-hour urinary sodium excretion in adults aged 18 to 69 years, the mean salt intake (13.7 g/d) among younger Chinese women aged 40 to 49 years was slightly higher than that (12.6 g/d) among older Chinese women aged 60 to 69 years.42 Whereas the mean salt intake for Japanese women in the same respective age categories was 9.5 g/d for the age group of 40 to 49 years and 10.4 g/d for the age group of 60 to 69 years.40
Japanese were reported to have a higher smoking prevalence among men,40 higher salt intake,10 and higher mean systolic blood pressure40 than Chinese.19,43,44 Therefore, in general, they were at higher risk for stroke than Chinese. After the year 2000, however, several strategies have been applied in Japan to control for the high stroke mortality, including the reduction of salt intake. A study on the trends in sodium intake among Japanese men and women from 1995 to 2016, using data from the National Health and Nutrition Surveys, reported the highest annual decrease in salt consumption, 3.7%, around the year 2000 (from 1999 to 2002). However, it also showed 2 significant breaks in the declining trend: only a 1.1% reduction in salt intake was observed from 1995 to 1999 and 1.2% from 2002 to 2016.45 This might partly explain the findings of the current study, indicating that the period and cohort effects of high sodium intake-attributable stroke mortality were higher in Japan than in China before the year 2000 and for cohorts born before 1945, but this trend reversed afterward.
Age is the most important demographic risk factor for stroke.2 In an APC analysis in Japan, stroke mortality showed a dose-response pattern with increasing age.46 Also, another APC analysis in China found that >70% of stroke mortality happened in Chinese aged ≥65 years and >80% of that occurred in Chinese aged ≥60 years.2
Sex differences were also reported in both sodium intake levels and the effects of high salt consumption on the risk of stroke mortality. Urinary sodium excretion was higher in Northern Chinese men (247 mmol/d) than in women (218 mmol/d).47 Similar findings were found in Japan; 211 mmol/d in Japanese men versus 186 mmol/d in Japanese women.1 In the Japanese cohort study of Takayama, the significantly increased risk of stroke mortality across tertiles of sodium intake was evident among men, whereas the increased risk among women did not reach statistical significance.48 Our findings showed that the decline in high sodium intake-attributable stroke mortality was faster in women than in men.
This is the first study to show the temporal trends of stroke mortality attributable to high sodium intake, to analyze the effects of APC, and to focus on a comprehensive comparison between China and Japan. Data of the GBD 2016 have provided internally consistent estimates of age- and sex-specific all-cause and cause-specific mortality, which had sufficient quality to reduce the possibility of misclassification of outcomes. However, there are several limitations to this study. First, because the GBD data were generated by systematic reviewing and synthesizing of published and unpublished data, sodium intake in some data was not directly measured and may have substantial potential residual confounding. However, the GBD data estimated high sodium intake distribution for the year, sex, age group, and relative risks per unit of exposure and was a more comprehensive system of risk analysis than any previous global or national analysis which could assess the changes in high sodium burden.49 Second, because the period and age intervals should be fixed and equal in the APC tool, people aged ≥80 years could not be analyzed in this study because they were recorded as one group only in the GBD database. However, some studies confirmed that the stroke mortality rate among those aged ≥80 years is decreasing in a similar pattern.2,50 Third, we did not analyze the data for those aged 0 to 25 years because stroke mortality attributable to high sodium intake was negligible in this group. Fourth, we could not analyze the chronological age, time period, and birth cohort of ischemic stroke and hemorrhagic stroke by the APC model, because of a lack of Japanese stroke subtype data. Finally, ecological fallacy might occur, similarly to other APC analyses, because the interpretation of the study results on population level might not hold on the individual level. Therefore, further research is necessary to confirm the findings based on individual-level studies.
In summary, the ASMRs, period effects and cohort effects of stroke mortality attributable to high sodium intake in China and Japan have been declining in both sexes and all age groups from 1990 to 2016. Consequently, sodium-reduction strategies are of low cost and effective for the prevention of stroke. It is necessary to educate the nation with the correct knowledge on diet and techniques to reduce salt consumption.
Acknowledgments
The data set supporting the conclusions of this article is available in the GBD (Global Burden of Disease) Data Tool repository (http://ghdx.healthdata.org/gbd-results-tool). This study used publicly available deidentified data accessed from the Global Burden of Disease Study 2016 repository. Therefore, for the secondary analysis, ethical approval, and statement from an ethics committee or institutional review board were not required.
Sources of Funding
This study was supported by the National Natural Science Foundation of China (No. 81773552 and 71661167007), the National Key Research and Development Program of China (No. 2018YFC1315302 and 2017YFC 1200502), and the China Scholarship Council (CSC file No. 201506270087).
Disclosures
None.
Supplementary Material
Footnotes
The online-only Data Supplement is available with this article at https://www.ahajournals.org/doi/suppl/10.1161/STROKEAHA.118.024617.
References
- 1.Zhou BF, Stamler J, Dennis B, Moag-Stahlberg A, Okuda N, Robertson C, et al. INTERMAP Research Group. Nutrient intakes of middle-aged men and women in China, Japan, United Kingdom, and United States in the late 1990s: the INTERMAP study. J Hum Hypertens. 2003;17:623–630. doi: 10.1038/sj.jhh.1001605. doi: 10.1038/sj.jhh.1001605. [DOI] [PMC free article] [PubMed] [Google Scholar]
- 2.Wang Z, Hu S, Sang S, Luo L, Yu C. Age-period-cohort analysis of stroke mortality in China: data from the Global Burden of Disease Study 2013. Stroke. 2017;48:271–275. doi: 10.1161/STROKEAHA.116.015031. doi: 10.1161/STROKEAHA.116.015031. [DOI] [PubMed] [Google Scholar]
- 3.Japan Preventive Association of Life-Style Related Disease 2017 [cited October 13, 2016] http://www.seikatsusyukanbyo.com/statistics/2016/009225.php. Accessed January 8, 2019.
- 4.Sun H, Zou X, Liu L. Epidemiological factors of stroke: a survey of the current status in China. J Stroke. 2013;15:109–114. doi: 10.5853/jos.2013.15.2.109. doi: 10.5853/jos.2013.15.2.109. [DOI] [PMC free article] [PubMed] [Google Scholar]
- 5.Spence JD. Diet for stroke prevention. Stroke Vasc Neurol. 2018;3:44–50. doi: 10.1136/svn-2017-000130. doi: 10.1136/svn-2017-000130. [DOI] [PMC free article] [PubMed] [Google Scholar]
- 6.Goldstein LB, Bushnell CD, Adams RJ, Appel LJ, Braun LT, Chaturvedi S, et al. American Heart Association Stroke Council; Council on Cardiovascular Nursing; Council on Epidemiology and Prevention; Council for High Blood Pressure Research, Council on Peripheral Vascular Disease, and Interdisciplinary Council on Quality of Care and Outcomes Research. Guidelines for the primary prevention of stroke: a guideline for healthcare professionals from the American Heart Association/American Stroke Association. Stroke. 2011;42:517–584. doi: 10.1161/STR.0b013e3181fcb238. doi: 10.1161/STR.0b013e3181fcb238. [DOI] [PubMed] [Google Scholar]
- 7.O’Donnell MJ, Yusuf S, Mente A, Gao P, Mann JF, Teo K, et al. Urinary sodium and potassium excretion and risk of cardiovascular events. JAMA. 2011;306:2229–2238. doi: 10.1001/jama.2011.1729. doi: 10.1001/jama.2011.1729. [DOI] [PubMed] [Google Scholar]
- 8.Larsson SC. Dietary fats and other nutrients on stroke. Curr Opin Lipidol. 2013;24:41–48. doi: 10.1097/MOL.0b013e3283592eea. doi: 10.1097/MOL.0b013e3283592eea. [DOI] [PubMed] [Google Scholar]
- 9.Strazzullo P, D’Elia L, Kandala NB, Cappuccio FP. Salt intake, stroke, and cardiovascular disease: meta-analysis of prospective studies. BMJ. 2009;339:b4567. doi: 10.1136/bmj.b4567. doi: 10.1136/bmj.b4567. [DOI] [PMC free article] [PubMed] [Google Scholar]
- 10.Ando K, Kawarazaki H, Miura K, Matsuura H, Watanabe Y, Yoshita K, et al. [Scientific statement] Report of the Salt Reduction Committee of the Japanese Society of Hypertension(1) Role of salt in hypertension and cardiovascular diseases. Hypertens Res. 2013;36:1009–1019. doi: 10.1038/hr.2013.102. doi: 10.1038/hr.2013.102. [DOI] [PubMed] [Google Scholar]
- 11.Hendriksen MA, Hoogenveen RT, Hoekstra J, Geleijnse JM, Boshuizen HC, van Raaij JM. Potential effect of salt reduction in processed foods on health. Am J Clin Nutr. 2014;99:446–453. doi: 10.3945/ajcn.113.062018. doi: 10.3945/ajcn.113.062018. [DOI] [PubMed] [Google Scholar]
- 12.World Health Organization. Guideline: Sodium Intake for Adults and Children. Geneva, Switzerland: World Health Organization; 2012. https://apps.who.int/iris/bitstream/handle/10665/77985/9789241504836_eng.pdf?sequence=1. Accessed January 11, 2019. [PubMed] [Google Scholar]
- 13.World Health Organization. Diet, nutrition and the prevention of chronic disease. Report of a Joint WHO/FAO Expert Consultation. WHO. 2003 https://apps.who.int/iris/bitstream/handle/10665/42665/WHO_TRS_916.pdf?sequence=1. Accessed January 11, 2019. [Google Scholar]
- 14.Brown IJ, Tzoulaki I, Candeias V, Elliott P. Salt intakes around the world: implications for public health. Int J Epidemiol. 2009;38:791–813. doi: 10.1093/ije/dyp139. doi: 10.1093/ije/dyp139. [DOI] [PubMed] [Google Scholar]
- 15.James WP, Ralph A, Sanchez-Castillo CP. The dominance of salt in manufactured food in the sodium intake of affluent societies. Lancet. 1987;1:426–429. doi: 10.1016/s0140-6736(87)90127-9. [DOI] [PubMed] [Google Scholar]
- 16.Mattes RD, Donnelly D. Relative contributions of dietary sodium sources. J Am Coll Nutr. 1991;10:383–393. doi: 10.1080/07315724.1991.10718167. [DOI] [PubMed] [Google Scholar]
- 17.Dahl LK, Love RA. Evidence for relationship between sodium (chloride) intake and human essential hypertension. AMA Arch Intern Med. 1954;94:525–531. doi: 10.1001/archinte.1954.00250040017003. [DOI] [PubMed] [Google Scholar]
- 18.Bibbins-Domingo K, Chertow GM, Coxson PG, Moran A, Lightwood JM, Pletcher MJ, et al. Projected effect of dietary salt reductions on future cardiovascular disease. N Engl J Med. 2010;362:590–599. doi: 10.1056/NEJMoa0907355. doi: 10.1056/NEJMoa0907355. [DOI] [PMC free article] [PubMed] [Google Scholar]
- 19.Intersalt: an international study of electrolyte excretion and blood pressure: results for 24 hour urinary sodium and potassium excretion. INTERSALT Cooperative Research Group. BMJ. 1988;297:319–328. doi: 10.1136/bmj.297.6644.319. [DOI] [PMC free article] [PubMed] [Google Scholar]
- 20.The World Health Data. Global Health Data Exchange. http://ghdx.healthdata.org/. Accessed January 10, 2019.
- 21.GBD 2016 Causes of Death Collaborators. Global, regional, and national age-sex specific mortality for 264 causes of death, 1980–2016: a systematic analysis for the Global Burden of Disease Study 2016. Lancet. 2017;390:1151–1210. doi: 10.1016/S0140-6736(17)32152-9. doi: 10.1016/S0140-6736(17)32152-9. [DOI] [PMC free article] [PubMed] [Google Scholar]
- 22.Gakidou E, Afshin A, Abajobir AA, Abate KH, Abbafati C, Abbas KM, et al. Global, regional, and national comparative risk assessment of 84 behavioural, environmental and occupational, and metabolic risks or clusters of risks, 1990–2016: a systematic analysis for the Global Burden of Disease Study 2016. Lancet. 2017;390:1345–1422. doi: 10.1016/S0140-6736(17)32366-8. [DOI] [PMC free article] [PubMed] [Google Scholar]
- 23.Zhou M, Wang H, Zhu J, Chen W, Wang L, Liu S, et al. Cause-specific mortality for 240 causes in China during 1990-2013: a systematic subnational analysis for the Global Burden of Disease Study 2013. Lancet. 2016;387:251–272. doi: 10.1016/S0140-6736(15)00551-6. doi: 10.1016/S0140-6736(15)00551-6. [DOI] [PubMed] [Google Scholar]
- 24.Nomura S, Sakamoto H, Glenn S, Tsugawa Y, Abe SK, Rahman MM, et al. Population health and regional variations of disease burden in Japan, 1990-2015: a systematic subnational analysis for the Global Burden of Disease Study 2015. Lancet. 2017;390:1521–1538. doi: 10.1016/S0140-6736(17)31544-1. doi: 10.1016/S0140-6736(17)31544-1. [DOI] [PMC free article] [PubMed] [Google Scholar]
- 25.Feigin VL, Krishnamurthi RV, Parmar P, Norrving B, Mensah GA, Bennett DA, et al. GBD 2013 Writing Group; GBD 2013 Stroke Panel Experts Group. Update on the Global Burden of ischemic and hemorrhagic stroke in 1990-2013: the GBD 2013 Study. Neuroepidemiology. 2015;45:161–176. doi: 10.1159/000441085. doi: 10.1159/000441085. [DOI] [PMC free article] [PubMed] [Google Scholar]
- 26.GBD 2016 Risk Factors Collaborators. Global, regional, and national comparative risk assessment of 84 behavioural, environmental and occupational, and metabolic risks or clusters of risks, 1990–2016: a systematic analysis for the Global Burden of Disease Study 2016. Lancet. 2017;390:1345–1422. doi: 10.1016/S0140-6736(17)32366-8. doi: 10.1016/S0140-6736(17)32366-8. [DOI] [PMC free article] [PubMed] [Google Scholar]
- 27.Wang J, Bai Z, Wang Z, Yu C. Comparison of secular trends in cervical cancer mortality in China and the United States: an age-period-cohort analysis. Int J Environ Res Public Health. 2016;13:E1148. doi: 10.3390/ijerph13111148. [DOI] [PMC free article] [PubMed] [Google Scholar]
- 28.Wang P, Xu C, Yu C. Age-period-cohort analysis on the cancer mortality in rural China: 1990–2010. Int J Equity Health. 2014;13:1. doi: 10.1186/1475-9276-13-1. doi: 10.1186/1475-9276-13-1. [DOI] [PMC free article] [PubMed] [Google Scholar]
- 29.Yang Y, Land KC. Age-Period-Cohort Analysis: New Models, Methods, and Empirical Applications. Boca Raton, FL: CRC Press; 2013. https://www.taylorfrancis.com/books/9781466507531. Accessed January 12, 2019. [Google Scholar]
- 30.Tango T, Kurashina S. Age, period and cohort analysis of trends in mortality from major diseases in Japan, 1955 to 1979: peculiarity of the cohort born in the early Showa Era. Stat Med. 1987;6:709–726. doi: 10.1002/sim.4780060608. [DOI] [PubMed] [Google Scholar]
- 31.Medrano MJ, López-Abente G, Barrado MJ, Pollán M, Almazán J. Effect of age, birth cohort, and period of death on cerebrovascular mortality in Spain, 1952 through 1991. Stroke. 1997;28:40–44. doi: 10.1161/01.str.28.1.40. [DOI] [PubMed] [Google Scholar]
- 32.Peltonen M, Asplund K. Age-period-cohort effects on stroke mortality in Sweden 1969-1993 and forecasts up to the year 2003. Stroke. 1996;27:1981–1985. doi: 10.1161/01.str.27.11.1981. [DOI] [PubMed] [Google Scholar]
- 33.Rosenberg PS, Check DP, Anderson WF. A web tool for age-period-cohort analysis of cancer incidence and mortality rates. Cancer Epidemiol Biomarkers Prev. 2014;23:2296–2302. doi: 10.1158/1055-9965.EPI-14-0300. doi: 10.1158/1055-9965.EPI-14-0300. [DOI] [PMC free article] [PubMed] [Google Scholar]
- 34.Umesawa M, Iso H, Date C, Yamamoto A, Toyoshima H, Watanabe Y, et al. JACC Study Group. Relations between dietary sodium and potassium intakes and mortality from cardiovascular disease: the Japan Collaborative Cohort Study for Evaluation of Cancer Risks. Am J Clin Nutr. 2008;88:195–202. doi: 10.1093/ajcn/88.1.195. doi: 10.1093/ajcn/88.1.195. [DOI] [PubMed] [Google Scholar]
- 35.Li XY, Cai XL, Bian PD, Hu LR. High salt intake and stroke: meta-analysis of the epidemiologic evidence. CNS Neurosci Ther. 2012;18:691–701. doi: 10.1111/j.1755-5949.2012.00355.x. doi: 10.1111/j.1755-5949.2012.00355.x. [DOI] [PMC free article] [PubMed] [Google Scholar]
- 36.Guyton AC. Blood pressure control–special role of the kidneys and body fluids. Science. 1991;252:1813–1816. doi: 10.1126/science.2063193. [DOI] [PubMed] [Google Scholar]
- 37.Wang J, Li Y. Characteristics of hypertension in Chinese and their relevance for the choice of antihypertensive drugs. Diabetes Metab Res Rev. 2012;28(suppl 2):67–72. doi: 10.1002/dmrr.2356. doi: 10.1002/dmrr.2356. [DOI] [PubMed] [Google Scholar]
- 38.Boggia J, Li Y, Thijs L, Hansen TW, Kikuya M, Björklund-Bodegård K, et al. International Database on Ambulatory blood pressure monitoring in relation to Cardiovascular Outcomes (IDACO); Investigators. Prognostic accuracy of day versus night ambulatory blood pressure: a cohort study. Lancet. 2007;370:1219–1229. doi: 10.1016/S0140-6736(07)61538-4. doi: 10.1016/S0140-6736(07)61538-4. [DOI] [PubMed] [Google Scholar]
- 39.Frisoli TM, Schmieder RE, Grodzicki T, Messerli FH. Salt and hypertension: is salt dietary reduction worth the effort? Am J Med. 2012;125:433–439. doi: 10.1016/j.amjmed.2011.10.023. doi: 10.1016/j.amjmed.2011.10.023. [DOI] [PubMed] [Google Scholar]
- 40.Ministry of Health, Labour and Welfare. National Health and Nutrition Examination Survey. http://www.nibiohn.go.jp/eiken/kenkounippon21/eiyouchousa/index.html. Accessed January 3, 2019.
- 41.Du S, Neiman A, Batis C, Wang H, Zhang B, Zhang J, et al. Understanding the patterns and trends of sodium intake, potassium intake, and sodium to potassium ratio and their effect on hypertension in China. Am J Clin Nutr. 2014;99:334–343. doi: 10.3945/ajcn.113.059121. doi: 10.3945/ajcn.113.059121. [DOI] [PMC free article] [PubMed] [Google Scholar]
- 42.Zhang JY, Yan LX, Tang JL, Ma JX, Guo XL, Zhao WH, et al. Estimating daily salt intake based on 24 h urinary sodium excretion in adults aged 18-69 years in Shandong, China. BMJ Open. 2014;4:e005089. doi: 10.1136/bmjopen-2014-005089. doi: 10.1136/bmjopen-2014-005089. [DOI] [PMC free article] [PubMed] [Google Scholar]
- 43.China cigarette net. How many smokers are in China? [cited 4 January, 2018]. https://www.cnxiangyan.com/article/3504.html. Accessed January 4, 2019.
- 44.Zhou M, Offer A, Yang G, Smith M, Hui G, Whitlock G, et al. Body mass index, blood pressure, and mortality from stroke: a nationally representative prospective study of 212,000 Chinese men. Stroke. 2008;39:753–759. doi: 10.1161/STROKEAHA.107.495374. doi: 10.1161/STROKEAHA.107.495374. [DOI] [PubMed] [Google Scholar]
- 45.Saito A, Imai S, Htun NC, Okada E, Yoshita K, Yoshiike N, et al. The trends in total energy, macronutrients and sodium intake among Japanese: findings from the 1995-2016 National Health and Nutrition Survey. Br J Nutr. 2018;120:424–434. doi: 10.1017/S0007114518001162. doi: 10.1017/S0007114518001162. [DOI] [PubMed] [Google Scholar]
- 46.Ma E, Takahashi H, Mizuno A, Okada M, Yamagishi K, Iso H. Stratified age- period-cohort analysis of stroke mortality in Japan, 1960 to 2000. J Stroke Cerebrovasc Dis. 2007;16:91–102. doi: 10.1016/j.jstrokecerebrovasdis.2006.11.006. doi: 10.1016/j.jstrokecerebrovasdis.2006.11.006. [DOI] [PubMed] [Google Scholar]
- 47.Wang JG, Liu L, Zagato L, Xie J, Fagard R, Jin K, et al. Blood pressure in relation to three candidate genes in a Chinese population. J Hypertens. 2004;22:937–944. doi: 10.1097/00004872-200405000-00015. [DOI] [PubMed] [Google Scholar]
- 48.Nagata C, Takatsuka N, Shimizu N, Shimizu H. Sodium intake and risk of death from stroke in Japanese men and women. Stroke. 2004;35:1543–1547. doi: 10.1161/01.STR.0000130425.50441.b0. doi: 10.1161/01.STR.0000130425.50441.b0. [DOI] [PubMed] [Google Scholar]
- 49.Lim SS, Vos T, Flaxman AD, Danaei G, Shibuya K, Adair-Rohani H, et al. A comparative risk assessment of burden of disease and injury attributable to 67 risk factors and risk factor clusters in 21 regions, 1990–2010: a systematic analysis for the Global Burden of Disease Study 2010. Lancet. 2012;380:2224–2260. doi: 10.1016/S0140-6736(12)61766-8. doi: 10.1016/S0140-6736(12)61766–8. [DOI] [PMC free article] [PubMed] [Google Scholar]
- 50.Holford TR. The estimation of age, period and cohort effects for vital rates. Biometrics. 1983;39:311–324. [PubMed] [Google Scholar]