

Abstract
Background
Ageing, chronic diseases, prolonged inactivity, and inadequate nutrition pose a severe threat to skeletal muscle health and function. To date, experimental evidence suggests that ageing‐related subclinical inflammation could be an important causative factor in sarcopenia. Although inflammatory signalling has been implicated in the pathogenesis of experimental animal models of sarcopenia, few studies have surveyed the clinical association between circulating factors and muscle mass in patients before and after lifestyle interventions. In this study, we evaluated whether proinflammatory cytokines are associated with the onset of sarcopenia, which circulating factors are associated with the severity of sarcopenia, and how these factors change after lifestyle interventions in sarcopenic elderly persons.
Methods
A total of 56 elderly subjects (age ≥ 60 years) with sarcopenia and 56 elderly non‐sarcopenic subjects, who met entry criteria and had given informed consent, were selected from the Peking Union Medical College Hospital multicentre prospective longitudinal sarcopenia study for testing relevant circulating factors. Thirty‐two elderly subjects from the sarcopenic cohort completed a 12 week intensive lifestyle intervention programme with whey supplements (30 g/day) and a personalized resistance training regimen. The levels of proinflammatory cytokines and metabolic hormones, pre‐intensive and post‐intensive lifestyle interventions, were measured.
Results
The sarcopenic group was significantly older (72.05 ± 6.54 years; P < 0.001), more likely to be inactive and female (57.1% of all sarcopenic patients), and had a higher prevalence of type 2 diabetes (16% higher risk). Compared with non‐sarcopenic subjects, serum interleukin (IL)‐6, IL‐18, tumour necrosis factor‐α (TNF‐α), TNF‐like weak inducer of apoptosis (TWEAK), and leptin were significantly higher, while insulin growth factor 1, insulin, and adiponectin were significantly lower in sarcopenic patients (all P < 0.05). Logistic regression analyses revealed that high levels of TNF‐α (>11.15 pg/mL) and TWEAK (>1276.48 pg/mL) were associated with a 7.6‐fold and 14.3‐fold increased risk of sarcopenia, respectively. After adjustment for confounding variables, high levels of TWEAK were still associated with a 13.4‐fold increased risk of sarcopenia. Intensive lifestyle interventions led to significant improvements in sarcopenic patients' muscle mass and serum profiles of TWEAK, TNF‐α, IL‐18, insulin, and adiponectin (all P < 0.05).
Conclusions
High levels of the inflammatory cytokines TWEAK and TNF‐α are associated with an increased risk of sarcopenia, while the metabolic hormones insulin growth factor 1, insulin, and adiponectin are associated with a decreased risk of sarcopenia in our Chinese patient cohort. Intensive lifestyle interventions could significantly improve muscle mass, reduce inflammation, and restore metabolic hormone levels in sarcopenic patients. This trial was registered at clinicaltrials.gov as NCT02873676.
Keywords: Sarcopenia, Inflammation, Lifestyle interventions, Proinflammatory cytokines, Metabolic hormones, Elderly
Introduction
Skeletal muscle is a multifunctional tissue. Besides performing contractions to facilitate various physical motions necessary for daily life, skeletal muscles also activate multiple signalling pathways in response to circulating factors to regulate whole body metabolism and maintain general physiological homeostasis.1 However, threats such as ageing, chronic diseases, inflammation, prolonged inactivity, and inadequate nutrition can lead to progressive loss of skeletal muscle mass and function.2 In particular, persistent inflammation and increased levels of inflammatory cytokines have been strongly implicated in the ageing‐related loss of skeletal muscle mass, that is, sarcopenia. Multiple mechanisms have been proposed, such as the activation of proteolytic systems, the inhibition of the anabolic effects of various growth factors, and the suppression of skeletal muscle regeneration.3 Many of these mechanisms function downstream of inflammatory signalling.4
Sarcopenia is an ageing‐related syndrome characterized by decreased skeletal muscle mass, lower muscle strength, and/or physical performance. Hence, it is also associated with functional impairment and disability. Its aetiology and mechanisms are complex and multifactorial.5 To date, substantial evidence indicates that ageing‐related chronic low‐grade inflammation could be an important causative factor in sarcopenia.6 Both cross‐sectional and longitudinal studies have shown that the loss of total appendicular skeletal muscle and poor physical function, in both men and women, were associated with high levels of proinflammatory cytokines such as interleukin (IL)‐6, tumour necrosis factor‐α (TNF‐α), and acute phase protein C‐reactive protein (CRP).7, 8, 9, 10 However, most of the extant studies had focused on IL‐6, TNF‐α, and CRP and had neglected the role of other circulating factors, such as TNF‐like weak inducer of apoptosis (TWEAK), IL‐18, leptin, insulin growth factor 1 (IGF1), insulin, and adiponectin. Furthermore, experimental animal studies have demonstrated that TWEAK is involved in mouse sarcopenia.11 Other studies also found that IL‐18 could be associated with type II muscle atrophy.12, 13
Given that the relationships between inflammation and sarcopenia are still unclear in humans, the purpose of this study is to evaluate (i) whether high levels of proinflammatory cytokines are associated with the onset of sarcopenia in patients; (ii) which circulating factors are associated with the severity of sarcopenia; and (iii) how these circulating factors change upon lifestyle interventions through diet and exercise in sarcopenic elderly people.
Materials and methods
Subjects
Study subjects for this study were selected from the Peking Union Medical College Hospital (PUMC Hospital) multicentre prospective longitudinal sarcopenia study (PPLSS), an ongoing nationwide interdisciplinary cross‐sectional, cohort, and intervention study on evaluating changes in muscle mass, muscle strength, and clinical outcomes among sarcopenic elderly persons in China. The cohort population was recruited between September 2015 and October 2017, from hospitals, communities, and nursing facilities in three medical centres of Beijing, Tianjin, and Shijiazhuang. The PPLSS protocol was approved by the Human Ethics Committee of the PUMC Hospital (No. HS889), and all participants gave written informed consent. This trial was registered at clinicaltrials.gov as NCT02873676.
Before baseline examination, each subject had completed medical screening for vital signs, body composition analysis, and cognitive function evaluation. Anyone with evidence of heart, kidney, or liver disease, communicable disease, walking disability, or any other disease that might influence the results of the study was excluded. The subject selected had to have independent physical ability, assessed with the activities of daily living score, and normal cognitive function or only mild cognitive disturbance as defined by a Mini‐Mental State Examination >20.14 All subjects admitted into the sarcopenic cohort were eligible persons who were aged ≥ 60 years, had a relative skeletal muscle mass index that passed the Asian Working Group for Sarcopenia (AWGS) cut‐off points of 7.0 kg/m2 for men and 5.4 kg/m2 for women, and had grip strength or walking speed that passed the AWGS cut‐off point.15
Body composition, handgrip strength, and physical function
Body composition, including body weight, free‐fat mass, fat mass, muscle mass, fat distribution, and muscle distribution, was measured by multi‐frequency bioelectrical impedance analysis (H‐Key350, Beijing Seehigher Technology Co., Ltd.) during the basal examination for all subjects, and dual‐X ray absorptiometry (site models included GE Lunar Prodigy Advance; GE Lunar Prodigy Pro or Primo; Hologic, Inc, Bedford, MA; version 8.8) was also used for the sarcopenic cohort population. The in vivo coefficients of variations were 0.89% and 0.48% for whole body fat (fat mass) and free‐fat mass, respectively. The relative skeletal muscle mass index was calculated by dividing the sum of total appendicular skeletal muscle mass in kilograms by height in metres squared.16 Height was measured to the nearest 0.1 cm on a precision scale with inelastic tapeline, without shoes, and with the use of a standardized technique.17
Handgrip strength was measured by using an electronic hand dynamometer (CAMRY MODEL EH101, HaNDCReW, Guangdong, China). Two consecutive measures of grip strength in both hands were recorded to the nearest kilogram, with the participant placed in an upright position and the arm of the measured hand parallel to the body. Maximum grip strength was calculated by taking the average of the highest measurement from both hands.
Gait speed was measured by timing the participants' ability to walk 4 m at a normal pace.18 Each participant performed the gait speed assessment twice, with the faster of the two times used as the representative score. A score of ≤0.8 m/s (5.0 s for 4 m) was used to identify participants with low gait speed.5 Furthermore, the International Physical Activity Questionnaire was used to evaluate the level of physical activity level for all participants.19
Blood collection and analysis protocol
Blood samples taken from the antecubital vein were collected in Vacutainers Tubes (5 mL Z Serum Sep Clot Activator, REF 456234, Greiner Bio‐one). Participants were informed to take water but not food overnight, before blood sampling in the morning. Samples were centrifuged (3000 r.p.m. using centrifuge J6‐MC by Beckman), and the serum was stored at −80 °C. All samples were analysed using the same reagent lot.
Inflammatory markers and hormone measurements
The serum levels of circulating factors, including high‐sensitivity CRP (HsCRP), IL‐6, IL‐18, TWEAK, TNF‐α, leptin, IGF1, insulin, adiponectin, and fibroblast growth factor‐21 (FGF21) were assessed. IL‐6, TNF‐α, and HsCRP were measured using a sandwich immunoassay based on chemiluminescence, the analyser Liaison XL, (Siemens Immulite 1000; AU5800, Beckman Coulter, USA for usCRP), and fasting glucose levels were tested using the glucose oxidase method at the Department of Clinical Laboratory (PUMC Hospital, China). IL‐18, TWEAK, IGF1, insulin, leptin, and adiponectin were measured using ELISA Quantikine and Duset HS Immunoassay Kit (R&D Systems, Minneapolis, MN, USA), and FGF21 was measured using ELISA Quantikine Immunoassay Kit (Abcam, Cambridge, MA, USA). Serum samples and assay standards were all analysed in quadruplicate and analysed double‐blind with ELISA kits according to the manufacturer's instructions. The inter‐assay coefficients of variations were 7.5–8.1%, 6.9–7.5%, 3.5–5.4%, 5.8–6.9%, 7.0–11.7%, 7.2%, and less than 10.0% for IGF1, insulin, leptin, adiponectin, IL‐18, FGF21, and TWEAK, respectively. Results were expressed as milligrams/litre (mg/L, HsCRP), picograms/millilitre (pg/mL; IL‐6, IL‐18, TWEAK, TNF‐α, and FGF21), microgram/mL (μg/mL, adiponectin), nanogram/millilitre (ng/mL, leptin and IGF1), and picomole/L (pmol/L, insulin). All values were measured in quadruplicate, with averages being used in statistical analyses.
Interventions
After the baseline examination, elderly subjects with sarcopenia accepted a 12 week intensive lifestyle intervention programme, which consisted of intensive nutritional intervention and personalized designed resistance exercise.
The nutritional interventions contained (i) total energy: 30 Kcal/kg/day; (ii) total protein: 1.5 g/kg/day with 75% of high quality protein; (iii) protein supplement: 30 g of whey protein (Lacprodan HYDRO Power, Aral food Ingredients Group P/S, Denmark) per serving, combined with 3.84 g total leucine, 2.55 g fat, 0.9 g lactose, and a mixture of vitamins, minerals, and dietary fibres. The protein supplement formula was reconstituted with 150–200 mL water and consumed once daily with breakfast and once after resistance training. Subjects were provided dietary education and instructions on methods to increase and maintain their habitual protein intake at a minimum of 1.5 g/kg/day and at least 25–30 g of protein per meal. The 24 h diet recall method was used to record the dietary intake for 3 days consecutively including two weekdays and one weekend. Dietitians in our research team used standard software to estimate the average daily energy and protein intake based on the Database of Chinese Food Composition to ensure the intensive nutritional targets were reached.
The resistance training programme, designed by our sports physician based on the Otago Exercise Program,20 included 5 min of warm‐up, 20 min of muscle strength training, and 5 min of slow walking. The resistance training was performed three times a week and recorded in their logs. Resistance training (20 min) involved a dumbbell and sandbags as weights for the major muscles of the upper and lower limbs. Meanwhile, all participants were required to walk outdoors and get exposure to sunshine three times a week. Relevant education booklets and exercise CDs were given to all participants. Subjects were contacted monthly to check on whether they had read and watched the study materials, and how well they had complied with the suggested diet and exercise protocols.
Follow‐up measurements were done every 2 weeks during intervention, consisting of face‐to‐face interviews for three times and telephone interviews for six times. The face‐to‐face interview was followed by a medical interview, muscle mass was assessed with bioelectrical impedance analysis and dual‐X ray absorptiometry for the final face‐to‐face interviews, and muscle strength and physical function were evaluated with handgrip dynamometer and timer respectively at the hospital or health care centre. Blood samples were collected during pre‐intervention and post‐intervention.
Statistical analysis
Data were analysed using the statistical software EPIDATA 3.0 by two investigators. Analyses were performed by using SAS21.0.1 (SAS Institute, Cary, NC, USA). Continuous variables were summarized as means ± standard deviation or medians (25th, 75th percentiles), and categorical variables were summarized as counts and percentages. Characteristics of participants and their blood levels of circulating factors were compared using the chi square test, Fisher's exact test, Student's t‐test, and Mann–Whitney U test, where appropriate. All the circulating factor data were initially changed into five‐category histograms in order to present the frequency distributions of circulating factors in the three European Working Group on Sarcopenia in Older People (EWGSOP) subgroups of subjects (healthy, pre‐sarcopenic, and sarcopenic). The P values for the frequency distributions were calculated using Fisher's exact test. Non‐parametric analysis of variance (Kruskal–Wallis H test) was also performed to account for skewed distributions.
Multivariate logistic regression was performed to investigate the association between serum circulating factor levels and the risk of sarcopenia. Most of the circulating factors were categorized into two levels based on the median, while IGF1 and adiponectin levels were subdivided into three levels based on the upper and lower quartiles, to obtain the appropriate likelihood statistical power. The lowest level was regarded as the reference group. In the first model, results were not adjusted for any variable. In the second model, results were additionally adjusted for age, gender, levels of physical activity, and diabetes status. Correlations between serum levels of all inflammatory cytokines, leptin, FGF21, adiponectin, insulin, and IGF1 vs. limb extremities' muscle mass and muscle strength were calculated by Pearson's or Spearman's correlation, where appropriate. Differences were considered significant at P < 0.05. Pearson's or Spearman's correlation analysis was also performed to identify cross interactions among the circulating factors. For these associations, the significance cut‐off was set at 0.1.
For sample size calculations, we took limb extremities' muscle mass as the outcome index and used the mean and standard deviation values in Shahar et al.,21 with a fixed power of 80% and an α level of 5% for the main variable. This gave a sample size of 32 subjects for each group.
Results
Participant characteristics
The flowchart of participants in the study was shown in Figure 1. In total, 3015 participants were registered in PPLSS during the data collection between September 2015 and October 2017, from three medical centres in Beijing, Tianjin, and Shijiazhuang. Of the 2911 participants who finished the baseline examination and body composition analysis, 906 participants were older than 60 years, of which 188 elderly persons (age ≥ 60 years) were diagnosed with sarcopenia based on the AWGS and the EWGSOP diagnostic pathway and cut‐off points, and 68 of these sarcopenic participants were enrolled into the sarcopenic cohort based on the inclusion and exclusion criteria. Finally, blood samples were collected from 56 elderly sarcopenic patients and 56 elderly non‐sarcopenic subjects. Thirty‐two sarcopenic participants received the 12 week intensive lifestyle intervention programme and completed the medical visits for circulating factor measurements.
Figure 1.
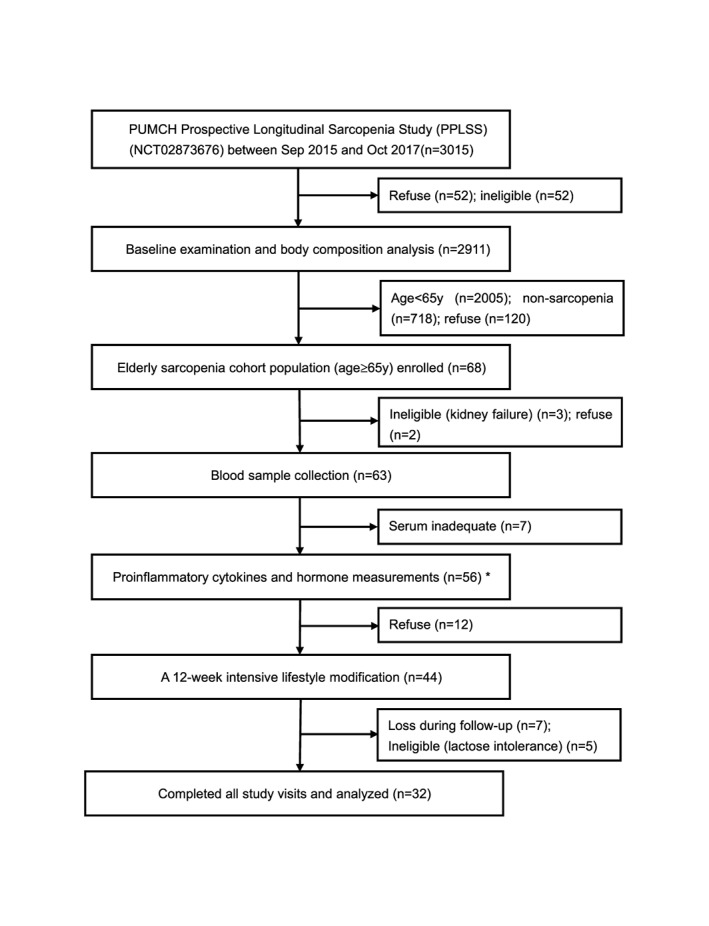
Flowchart for participants' information and blood sampling in the study. Study samples for this study were enrolled from the Peking Union Medical College Hospital (PUMCH) prospective longitudinal sarcopenia study (PPLSS). All sample selection was based on the defined inclusion and exclusion criteria at every step.
Univariate analysis revealed several baseline characteristics that were different between sarcopenic and non‐sarcopenic elderly subjects (Table 1). The sarcopenic group was significantly (P < 0.05) older, and significantly enriched for inactive, female, and diabetic subjects. They also had a lower body mass index, lower muscle mass, and lower initial grip strength, as expected of sarcopenic patients. Comparing their circulating factor levels with non‐sarcopenic subjects, sarcopenic subjects' IL‐6 (P = 0.006), IL‐18, TNF‐α, TWEAK, and leptin were all significantly higher, while their levels of adiponectin, IGF1, and insulin (P = 0.027) were all significantly lower (except for IL‐6 and insulin, all P < 0.001). Levels of HsCRP trended higher in sarcopenic subjects (P = 0.067), while levels of FGF21 trended lower in sarcopenic subjects (P = 0.150).
Table 1.
Univariate analysis of baseline characteristics in elderly sarcopenic vs. non‐sarcopenic subjectsa
| Characteristics | Sarcopenic subjects | Non‐sarcopenic subjects | P value |
|---|---|---|---|
| N | 56 | 56 | — |
| Age, year | 72.05 ± 6.54 | 65.24 ± 4.05 | <0.001 * |
| Gender, F: M, n | 32:24† | 30:26 | 0.028 |
| Education level, n (%) | |||
| Bachelor degree or above | 2 (3.57) | 3 (5.36) | 0.118 |
| Graduate | 22 (39.29) | 10 (17.86) | |
| High or secondary school | 29 (51.79) | 38 (67.86) | |
| Primary school | 3 (5.36) | 3 (5.36) | |
| Living situation, n (%) | |||
| Together | 50 (89.29) | 52 (92.86) | 0.743** |
| Alone | 6 (10.71) | 4 (7.14) | |
| Smoking, n (%) | |||
| Never | 49 (87.50) | 40 (71.43) | 0.170 |
| Former | 3 (5.36) | 8 (14.29) | |
| Current | 4 (7.14) | 6 (10.71) | |
| Alcoholic drinks, n (%) | |||
| Never | 45 (80.36) | 39 (69.64) | 0.342** |
| Former | 1 (1.79) | 4 (7.14) | |
| Current | 10 (17.86) | 11 (19.64) | |
| Protein intake, g/day | |||
| Total protein | 46.74 ± 14.23 | 50.46 ± 16.94 | 0.266 |
| Animal protein | 19.71 ± 8.49 | 21.06 ± 9.57 | 0.474 |
| Vegetable protein | 27.06 ± 10.52 | 29.30 ± 11.74 | 0.334 |
| Physical activityb, n (%) | |||
| High | 5 (8.93) | 6 (10.71) | 0.012 |
| Moderate | 36 (64.29) | 44 (78.57) | |
| Light | 15 (26.79) | 3 (5.36) | |
| Cognitive impairedc, n (%) | 3 (5.36) | 1 (1.79) | 0.637 |
| Diabetes mellitus, n (%) | 9 (16.07) | 2 (3.57) | 0.031 |
| Cancer, n (%) | 4 (7.14) | 0 (0) | 0.136 |
| Body mass index, kg/m2 | 21.44 ± 3.09 | 24.69 ± 3.02 | <0.001 * |
| Muscle mass, kg | 36.50 ± 6.42 | 43.91 ± 6.99 | <0.001 * |
| Relative skeletal muscle index, kg/m2 | 5.78 ± 0.78 | 7.04 ± 0.85 | <0.001 * |
| Grip strength, kg | 23.20 ± 7.34 | 29.53 ± 8.93 | <0.001 * |
| Gait speed, m/s | 1.28 ± 0.68 | 1.15 ± 0.40 | 0.818 |
| IL‐6, pg/mL | 2.8 (2.0–6.1) | 2(2.0–2.8) | 0.006 |
| IL‐18, pg/mL | 893.61 ± 833.29 | 403.62 ± 250.89 | <0.001 |
| TNF‐α, pg/mL | 29.11 ± 22.67 | 11.87 ± 10.56 | <0.001 |
| TWEAK, pg/mL | 1794.06 ± 639.13 | 1107.86 ± 303.65 | <0.001 * |
| HsCRP, mg/L | 0.95(0.36–1.56) | 1.19(0.54–2.45) | 0.067 |
| Adiponectin, μg/mL | 3.53(1.63–7.39) | 7.26(3.11–13.47) | <0.001 |
| Leptin, ng/mL | 11.62(6.23–25.49) | 4.66(2.71–8.46) | <0.001 |
| IGF1, ng/mL | 62.13 ± 22.52 | 82.86 ± 32.84 | <0.001 * |
| Insulin, pmol/L | 22.19 ± 17.36 | 31.26 ± 24.31 | 0.027 * |
| FGF21, pg/ml | 49.99 (46.4, 61.2) | 58.00 (50.1, 68.9) | 0.150 |
FGF21, fibroblast growth factor‐21; HsCRP, high‐sensitivity C‐reactive protein; IGF1, insulin‐like growth factor 1; IL, interleukin; TNF‐α, tumour necrosis factor α; TWEAK, tumour necrosis factor‐like weak inducer of apoptosis.
Data are represented as mean ± SD, median (25–75th percentiles), or n (%). Other categorical variables were compared by chi square test, while other continuous variables were compared by Mann–Whitney U test.
International Physical Activity Questionnaire was used to evaluate activity level in all elder subjects.
Mini‐Mental State Examination was used to evaluate cognitive function in all elder subjects.
P values were calculated by Student's t‐test.
P values were calculated by Fisher's exact test.
Subjects were then further subdivided into three subgroups: sarcopenic, pre‐sarcopenic, and non‐sarcopenic subjects, according to EWGSOP classification criteria. Each of the circulating factors' ranges were further subdivided into five equal categories, to form a frequency distribution for preliminary analysis (Figure 2). Non‐sarcopenic subjects tended to manifest lower TWEAK levels, in the first two categories of TWEAK levels, while pre‐sarcopenic and sarcopenic subjects tended to manifest high TWEAK levels in the third to fifth categories. This non‐uniform distribution was statistically significant (P < 0.001). Other proinflammatory factors such as IL‐18 (P = 0.003) and IL‐6 (P = 0.055) also presented significantly non‐uniform distributions, but HsCRP and TNF‐α did not, likely because the five‐category histogram failed to fit the skewed distributions of these two proinflammatory factors (Figure 2). Analyses of several metabolic hormones showed that sarcopenic and pre‐sarcopenic subjects tended to manifest lower levels of adiponectin (P = 0.050), IGF1 (P < 0.001), insulin (P = 0.205), and FGF21 (P = 0.640, Supporting Information, Figure S1). In contrast, leptin's distribution was more similar to the proinflammatory cytokines (P = 0.013).
Figure 2.
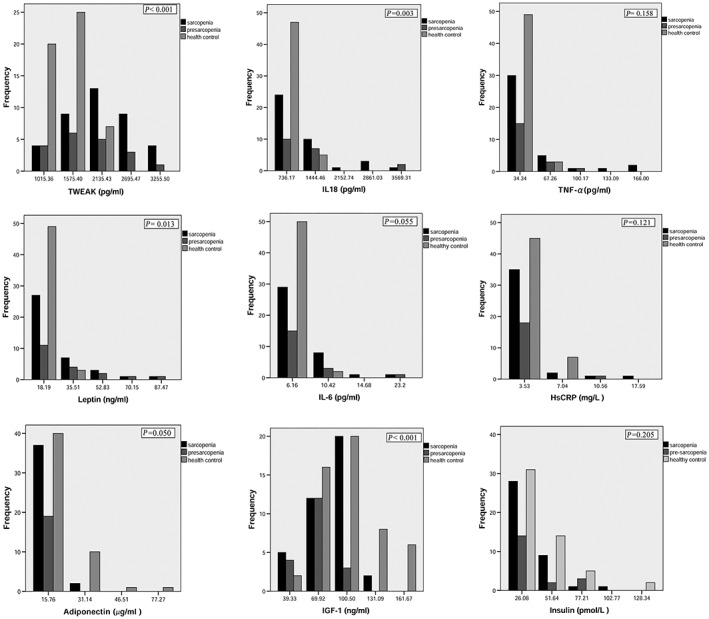
The frequency distributions of circulating factors among three EWGSOP subtypes of subjects. The sarcopenic subjects were subdivided based on the EWGSOP criteria. All the circulating factors' data were changed into five‐category histograms, by dividing their ranges into five equal parts, in order to present their frequency distributions. There were no samples for the fourth frequency interval for three circulating factors (IL6, HsCRP, and adiponectin), so only four categories were presented for their histograms. HsCRP, high‐sensitivity C‐reactive protein; IGF1, insulin‐like growth factor 1; IL, interleukin; TNF‐α, tumour necrosis factor α; TWEAK, tumour necrosis factor‐like weak inducer of apoptosis. The graphs were created by SPSS.
To account for skewed distributions, we also performed non‐parametric analysis of variance (Kruskal–Wallis H test) on the three EWGSOP subgroups of patients for each circulating factor (Supporting Information, Table S1). Our analyses revealed that, except for IGF1, pre‐sarcopenic subjects are not significantly different from sarcopenic subjects in their circulating factor profiles. All proinflammatory cytokines were significantly higher in both subtypes of sarcopenic subjects compared with healthy controls, except for IL‐6. HsCRP was just not significantly higher in any subtype of sarcopenic subjects. For the metabolic hormones, leptin was significantly higher only in sarcopenic subjects, whereas IGF1 and adiponectin were significantly lower in both pre‐sarcopenic and sarcopenic subjects (Supporting Information, Table S1). Insulin and FGF21 were both not significantly different among any subtype of subjects.
Taken together, our statistical analyses revealed that the pre‐sarcopenic and sarcopenic subjects presented very similar circulating factor profiles. In particularly, pre‐sarcopenic subjects already display significantly higher levels of certain proinflammatory cytokines and significantly lower levels of certain metabolic hormones, compared with healthy control subjects. This raises the possibility that changes in the proinflammatory cytokines and certain metabolic hormones might precede the onset of sarcopenia and that at least some of them might play a causative role in the early stages of sarcopenia pathogenesis.
Association between circulating factors and the severity of sarcopenia
We postulated that the circulating factors that play a causative role in the early pathogenesis of sarcopenia should also show the strongest associations with sarcopenia severity, as measured by skeletal muscle mass and strength. Among the proinflammatory cytokines, a statistically significant and negative correlation was found between TWEAK levels and the limb extremities' muscle mass (r = −0.372, P < 0.001). A similar negative correlation was observed between leptin levels and both the limb extremities' muscle mass (r = −0.248, P = 0.009) and muscle strength (r = −0.261, P = 0.006). In contrast, a significantly positive correlation was observed between IGF1 levels and both the limb extremities' muscle mass (r = 0.360, P < 0.001) and muscle strength (r = 0.362, P < 0.001) (Figure 3). The other circulating factors failed to show any significant associations with muscle mass or muscle strength in our patient cohort, although FGF21 did show a weak association with limb extremities' muscle mass (r = 0.342, P = 0.042), but not muscle strength (Supporting Information, Figure S2).
Figure 3.
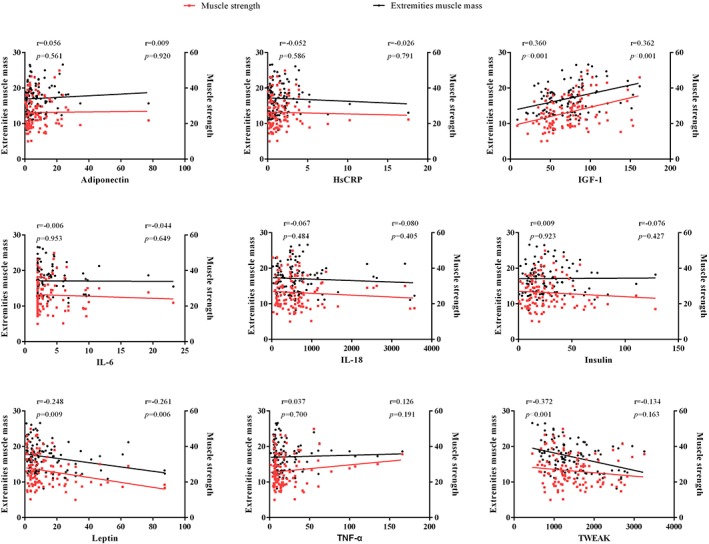
Correlation analysis of circulating factor levels vs. limb extremities' muscle mass and muscle strength across all subjects. Correlation value r is adjusted for age, gender, and body mass index. HsCRP, high‐sensitivity C‐reactive protein; IGF1, insulin‐like growth factor 1; IL, interleukin; TNF‐α, tumour necrosis factor α; TWEAK, tumour necrosis factor‐like weak inducer of apoptosis. The graphs were created by photograph.
We also assessed whether the circulating factors were associated with the risk for sarcopenia. Multivariate logistic regression model analyses showed that higher levels of the proinflammatory cytokines TNF‐α and TWEAK were positively and significantly associated with an increased risk for sarcopenia. In contrast, higher levels of adiponectin, insulin, and IGF1 (>87.46 ng/mL) were associated with a decreased risk for sarcopenia (Table 2). In fact, higher levels of TNF‐α (>11.15 pg/mL) and TWEAK (>1276.48 pg/mL) were associated with 7.6‐fold and 14.3‐fold increased risk of sarcopenia (both P < 0.01), compared with lower levels of TNF‐α [odds ratio = 7.59, 95% confidence interval (CI) (1.760, 32.762)] and TWEAK [odds ratio = 14.35, 95% CI (3.597, 57.243)] levels, respectively. When we accounted for confounding factors such as age, gender, physical activity, and diabetes status in a second regression model, we found that TWEAK, leptin, insulin, and adiponectin were still independently associated with the risk of sarcopenia (Table 2 ). In fact, after adjusting for confounding variables, TWEAK was still associated with 13.4‐fold increased risk of sarcopenia [95% CI (2.107, 85.357)], strongly suggesting that TWEAK is implicated in the mechanism of sarcopenia progression. In addition, age is also associated with 1.53‐fold increased risk of sarcopenia [95% CI (1.185, 1.965)], consistent with our understanding of the demographics and epidemiology of sarcopenia.
Table 2.
Multivariate logistic regression analysis of circulating factor levels vs. sarcopenia riska
| Parameter | N | Model 1b | Model 2c | ||
|---|---|---|---|---|---|
| B (SE) | P value | B (SE) | P value | ||
| IL‐6, pg/mL | |||||
| <2.25 | 56 | Reference | Reference | ||
| >2.25 | 56 | 0.16 (0.68) | 0.811 | 0.38 (0.93) | 0.681 |
| IL‐18, pg/mL | |||||
| <511.15 | 56 | Reference | Reference | ||
| >511.15 | 56 | 0.57 (0.67) | 0.398 | 0.23 (0.87) | 0.795 |
| TNF‐α, pg/mL | |||||
| <11.15 | 56 | Reference | Reference | ||
| >11.5 | 56 | 2.03 (0.75) | 0.007 | 1.66 (0.92) | 0.071 |
| TWEAK, pg/mL | |||||
| <1276.48 | 56 | Reference | Reference | ||
| >1276.48 | 56 | 2.66 (0.71) | <0.001 | 2.60 (0.94) | 0.006 |
| Leptin, ng/mL | |||||
| <11.62 | 56 | Reference | Reference | ||
| >11.62 | 56 | 0.76 (0.62) | 0.224 | 1.77 (0.89) | 0.047 |
| Adiponectin, μg/mL | |||||
| <2.07 | 27 | Reference | Reference | ||
| 2.07–9.86 | 56 | −2.03 (0.84) | 0.015 | −3.20 (1.15) | 0.006 |
| >9.86 | 28 | −3.58 (1.15) | 0.002 | −3.23 (1.32) | 0.015 |
| IGF1, ng/mL | |||||
| <50.10 | 27 | Reference | Reference | ||
| 50.10–87.46 | 56 | −0.96 (0.73) | 0.188 | −1.08 (0.97) | 0.262 |
| >87.46 | 28 | −1.73 (0.88) | 0.048 | −1.34 (1.19) | 0.262 |
| Insulin, pmol/L | |||||
| <21.41 | 56 | Reference | Reference | ||
| >21.41 | 56 | −1.59 (0.67) | 0.017 | −3.30 (1.13) | 0.003 |
B, regression coefficient; HsCRP, high‐sensitivity C‐reactive protein; IGF1, insulin‐like growth factor 1; IL, interleukin; SE, standard error; TNF‐α, tumour necrosis factor α; TWEAK, tumour necrosis factor‐like weak inducer of apoptosis.
HsCRP and FGF21 were omitted from the multivariate logistic regression model because they showed no significant changes in the univariate analysis.
Logistic regression model 1: not adjusted for any variable.
Logistic regression model 2: adjusted for age, gender, the level of physical activity, and diabetes status, according to the differences in baseline characteristics between sarcopenic and healthy controls.
Cross interactions between the proinflammatory cytokines and metabolic hormones
To test if the circulating factors show any cross interactions among themselves, we also tested for associations between each circulating factor. Among the proinflammatory cytokines and metabolic hormones, a weak but significant interaction was observed between IL‐6 and IL‐18 (r = 0.275, P = 0.040), HsCRP (r = 0.467, P < 0.001), and TNF‐α (r = 0.298, P = 0.026), all of which are related to inflammation. A weak but significant interaction was also observed between the proinflammatory TNF‐α and IL‐18 (r = 0.265, P = 0.049). Given these findings, an emerging model is that the proinflammatory cytokines work together to promote sarcopenia progression. Surprisingly, weak interactions that trended towards significance were also observed between the proinflammatory IL‐18 and the anabolic IGF1 (r = 0.256, P = 0.057), between IGF1 and HsCRP (r = −0.247, P = 0.066), and between the hormones adiponectin and insulin (r = −0.229, P = 0.090) (Table 3). These counter‐intuitive interactions suggest that complex feedback loops and compensatory responses are in play for these circulating factors in the elderly human body. Further studies will be required to understand the reasons underlying these counter‐intuitive interactions. In contrast, interactions between other circulating factor pairs were not statistically significant.
Table 3.
Cross interactions between proinflammatory cytokines and metabolic hormones
| IL‐6 | IL‐18 | Adiponectin | HsCRP | Leptin | TWEAK | IGF1 | TNF‐α | Insulin | FGF21 | |
|---|---|---|---|---|---|---|---|---|---|---|
| IL‐6 (pg/mL), r | 1.000 | 0.275 | 0.016 | 0.467 | 0.193 | −0.153 | 0.020 | 0.298 | −0.083 | −0.021 |
| P value * | 0.040 | 0.907 | <0.001 | 0.155 | 0.261 | 0.884 | 0.026 | 0.541 | 0.923 | |
| IL‐18 (pg/mL), r | 0.275 | 1.000 | 0.075 | −0.023 | 0.183 | −0.103 | 0.256 | 0.265 | −0.019 | 0.339 |
| P value | 0.040 | 0.583 | 0.866 | 0.178 | 0.449 | 0.057 | 0.049 | 0.890 | 0.123 | |
| Adiponectin (μg/mL), r | 0.016 | 0.075 | 1.000 | 0.048 | −0.216 | 0.148 | 0.048 | −0.149 | −0.229 | 0.085 |
| P value | 0.907 | 0.583 | 0.727 | 0.110 | 0.276 | 0.726 | 0.274 | 0.090 | 0.707 | |
| HsCRP (mg/L), r | 0.467 | −0.023 | 0.048 | 1.000 | −0.092 | −0.089 | −0.247 | 0.044 | 0.053 | −0.191 |
| P value | <0.001 | 0.866 | 0.727 | 0.501 | 0.513 | 0.066 | 0.748 | 0.697 | 0.395 | |
| Leptin (ng/mL), r | 0.193 | 0.183 | −0.216 | −0.092 | 1.000 | 0.087 | 0.121 | −0.072 | 0.214 | 0.139 |
| P value | 0.155 | 0.178 | 0.110 | 0.501 | 0.526 | 0.373 | 0.599 | 0.113 | 0.537 | |
| TWEAK (pg/mL), r | −0.153 | −0.103 | 0.148 | −0.089 | 0.087 | 1.000 | 0.155 | −0.009 | 0.089 | −0.021 |
| P value | 0.261 | 0.449 | 0.276 | 0.513 | 0.526 | 0.253 | 0.948 | 0.512 | 0.925 | |
| IGF1, ng/mL | 0.020 | 0.256 | 0.048 | −0.247 | 0.121 | 0.155 | 1.000 | −0.046 | 0.133 | 0.186 |
| P value | 0.884 | 0.057 | 0.726 | 0.066 | 0.373 | 0.253 | 0.736 | 0.328 | 0.406 | |
| TNF‐α (pg/mL), r | 0.298 | 0.265 | −0.149 | 0.044 | −0.072 | −0.009 | −0.046 | 1.000 | −0.160 | 0.330 |
| P value | 0.026 | 0.049 | 0.274 | 0.748 | 0.599 | 0.948 | 0.736 | 0.238 | 0.134 | |
| Insulin (pmol/L), r | −0.083 | −0.019 | −0.229 | 0.053 | 0.214 | 0.089 | 0.133 | −0.160 | 1.000 | −0.311 |
| P value | 0.541 | 0.890 | 0.090 | 0.697 | 0.113 | 0.512 | 0.328 | 0.238 | 0.160 | |
| FGF21 (pg/mL), r | −0.021 | 0.339 | 0.085 | −0.191 | 0.139 | −0.021 | 0.186 | 0.330 | −0.311 | 1.000 |
| P value | 0.923 | 0.123 | 0.707 | 0.395 | 0.537 | 0.925 | 0.406 | 0.134 | 0.160 |
FGF21, fibrolast growth factor 21; HsCRP, high‐sensitivity C‐reactive protein; IGF1, insulin‐like growth factor 1; IL, interleukin; TNF‐α, tumour necrosis factor α; TWEAK, tumour necrosis factor‐like weak inducer of apoptosis.
P value < 0.1 was considered to be statistically significant;Pearson's or Spearman's correlation r was performed using pre‐intervention measurements.
Changes in circulating factors after intensive lifestyle interventions in human subjects
Thirty‐two participants who completed the 12 week intensive lifestyle intervention programme demonstrated small but significant improvements in muscle mass (Figure 4A), and also a trend towards increased muscle strength (Figure 4B). Gait speed showed a small but insignificant drop (Figure 4C), and the high variance in our gait speed data suggested that this functional measure is not as reliable for our patient cohort. Comparing pre‐intervention and post‐intervention, there were significant changes in TWEAK, TNF‐α, IL‐18, adiponectin, and insulin (Table 4). In particular, the proinflammatory cytokines TWEAK (P < 0.001), TNF‐α (P < 0.001), and IL‐18 (P = 0.017) significantly decreased post‐intervention and were nearly restored back to normal healthy levels (Figure 4D and F).
Figure 4.
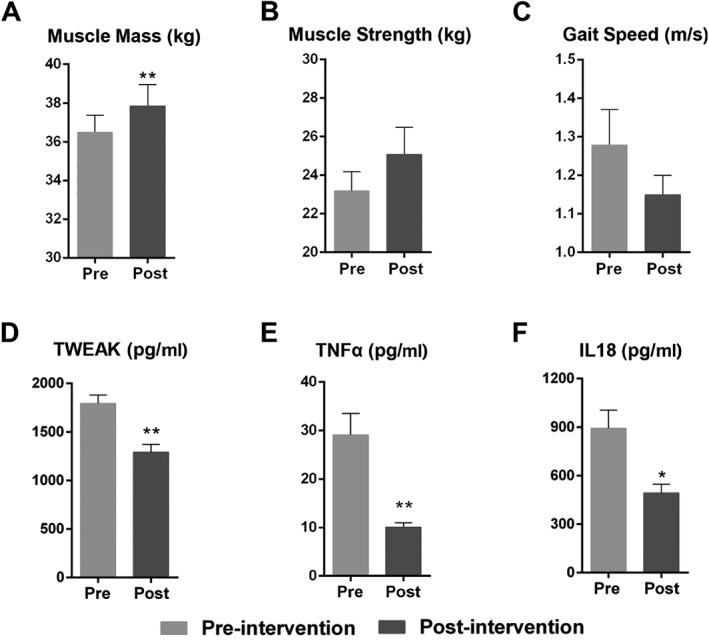
Changes in key muscle parameters and proinflammatory cytokines after lifestyle intervention. To assess the effects of our intensive lifestyle intervention regimen, we measured (A) limb extremities' muscle mass, (B) grip strength, (C) gait speed, (D) serum TWEAK levels, (E) serum TNF‐α levels, and (F) serum IL‐18 levels. Data are expressed as mean ± standard error of the mean. * P < 0.05, ** P < 0.001 (Mann–Whitney U test). IL, interleukin; TNF‐α, tumour necrosis factor α; TWEAK, tumour necrosis factor‐like weak inducer of apoptosis. The graphs were created by photograph.
Table 4.
Changes in circulating factors after intensive lifestyle interventiona
| Parameter |
Pre‐intervention sarcopenic subjects (n = 32) Mean ± SD/M (P25, P75) |
Post‐intervention sarcopenic subjects (n = 32) Mean ± SD/M (P25, P75) |
P value * |
|---|---|---|---|
| IL‐6, pg/mL | 2.9 (2.0–5.9) | 2.8 (2.0–3.1) | 0.061 |
| IL‐18, pg/mL | 961.82 ± 884.72 | 492.87 ± 300.39 | 0.017 |
| TNF‐α, pg/mL | 34.43 ± 36.05 | 10.14 ± 4.80 | <0.001 |
| TWEAK, pg/mL | 1878.46 ± 554.24 | 1290.74 ± 455.49 | <0.001 |
| HsCRP, mg/L | 0.68 (0.32–1.49) | 0.78 (0.33–2.20) | 0.842 |
| Adiponectin, μg/mL | 2.43 (1.05–6.47) | 16.61 (7.11–25.67) | <0.001 |
| Leptin, ng/mL | 11.07 (5.65–30.25) | 12.37 (5.30–20.21) | 0.700 |
| IGF1, ng/mL | 62.17 ± 20.78 | 76.73 ± 32.54 | 0.075 |
| Insulin, pmol/L | 23.15 ± 18.20 | 80.47 ± 99.75 | <0.001 |
| FGF21, pg/mL | 49.99 (46.20, 57.05) | 53.80 (46.1, 59.3) | 0.610 |
HsCRP, high‐sensitivity C‐reactive protein; IGF1, insulin‐like growth factor 1; IL, interleukin; SD, standard deviation; M, median; Q1–3, 1st and 3rd quartile values; TNF‐α, tumour necrosis factor α; TWEAK, tumour necrosis factor‐like weak inducer of apoptosis.
Sarcopenic subjects accepted a 12 week intensive lifestyle intervention programme consisting of nutritional supplementation and resistance exercise.
P values calculated by paired‐sample Wilcoxon test.
In contrast, adiponectin and insulin dramatically increased post‐intervention, increasing beyond even the levels in non‐sarcopenic elderly subjects (P < 0.001, Table 4). Hyperinsulinemia could be associated with either improved insulin secretion or insulin resistance. In order to definitively determine if the post‐intervention subjects developed insulin resistance, we closely examined their fasting glucose, fasting insulin, and homeostasis model assessment‐insulin resistance (HOMA‐IR) indices (Table 5). As expected, non‐sarcopenic subjects showed significantly higher fasting glucose, higher fasting insulin, and higher HOMA‐IR indices when they were diabetic. Sarcopenic subjects showed a mild ~6% increase in fasting glucose after intervention (5.44 ± 1.22 vs. 5.78 ± 1.26 mmol/L, P = 0.004), but which was still well within the normal boundaries (<6.10 mmol/L). Thus, we observed no evidence for pre‐diabetic hyperglycaemia in post‐intervention subjects. The HOMA‐IR indices also indicated no insulin resistance in all subjects (Table 5), except for non‐sarcopenic subjects that were already diabetic.22 We also examined the levels of FGF21, another growth factor associated with insulin resistance and type 2 diabetes, but found no significant differences in the post‐intervention subjects (Supporting Information, Table S2). Thus, it seems likely that the high insulin level post‐intervention is not because of insulin resistance but because of improved insulin secretion, possibly because of the high levels of insulinogenic amino acids derived from whey protein. More clinical studies are necessary to confirm these observations. No significant treatment effects were observed for the other circulating factors, although IGF1 (P = 0.075) did trend towards an increase, nearing the normal healthy levels of IGF1 in non‐sarcopenic elderly subjects (Table 4).
Table 5.
Fasting glucose, fasting insulin, and HOMA‐IR indices across subjects according to sarcopenia and type 2 diabetes mellitus (DM) status
| Pre‐intervention sarcopenic subjects (mean ± SD)/median | Post‐intervention sarcopenic subjects (mean ± SD)/median | Non‐sarcopenic subjects (mean ± SD)/median | |||||||
|---|---|---|---|---|---|---|---|---|---|
| Total | DMa | non‐DM | Total | DM | non‐DM | Total | DM | non‐DM | |
| Fasting glucose mmol/L (P * value) |
5.44 ± 1.2 (P 1 < 0.004) |
7.14 ± 1.5 |
5.17 ± 1.0 (P 1 = 0.011) |
5.87 ± 1.3 (P 2 = 0.019) |
7.37 ± 1.8 (P 2 = 0.800) |
5.62 ± 1.0 (P 2 = 0.015) |
5.06 ± 1.1 (P 3 = 0.346) |
6.12 ± 0.2 (P 3 = 0.800) |
4.96 ± 1.1 (P 3 = 0.436) |
| Insulin pmol/L (P value) |
22.19 ± 17.4 (P 1 = 0.027) |
27.39 ± 24.1 |
21.19 ± 15.9 (P 1 < 0.001) |
80.47 ± 99.8 (P 2 < 0.001) |
67.47 ± 53.5 (P 2 = 0.801) |
82.88 ± 106.7 (P 2 = 0.016) |
31.26 ± 24.3 (P 3 = 0.027) |
73.71 ± 77.3 (P 3 = 0.327) |
29.63 ± 20.6 (P 3 = 0.026) |
| HOMA‐IR (P value) |
0.54 (P 1 = 0.074) |
0.41 |
0.58 (P 1 = 0.069) |
1.16 (P 2 = 0.167) |
1.64 (P 2 = 0.904) |
1.06 (P 2 = 0.159) |
0.66 (P 3 = 0.212) |
2.84 (P 3 = 0.200) |
0.59 (P 3 = 0.503) |
DM, diabetes mellitus; HOMA‐IR, homeostasis model assessment‐insulin resistance.
The sample size was too small for meaningful P value calculations.
The P 1 value represents the significance of differences between pre‐intervention and post‐intervention, the P 2 value represents the significance of differences between post‐intervention sarcopenic and non‐sarcopenic elderly subjects, and the P 3 value represents the significance of differences between pre‐intervention sarcopenic and non‐sarcopenic elderly subjects. P value was calculated by Mann–Whitney U test.
Discussion
This is the first prospective cross‐sectional cohort study that shows a significant association between the levels of various circulating factors, including proinflammatory cytokines and relevant metabolic hormones, and sarcopenia in elderly persons in China, based on the diagnostic criteria of AWGS. In this study, our main finding is that proinflammatory cytokines are generally higher in sarcopenic subjects, whereas anabolic hormones are generally lower in sarcopenic subjects, compared with non‐sarcopenic elderly subjects. Higher levels of TWEAK were especially associated with a higher risk of sarcopenia and more severe muscle loss in sarcopenic subjects. Moreover, sarcopenic subjects' levels of TWEAK, TNF‐α, and IL‐18 were almost restored back to normal levels after an intensive lifestyle intervention programme for 12 weeks, in tandem with a significant recovery in muscle mass.
TWEAK is a proinflammatory cytokine belonging to the TNF super family with multiple biological functions, including stimulation of apoptosis and induction of muscle injury and atrophy.23 A novel finding in our study was that higher levels of TWEAK could independently and significantly increase the risk of sarcopenia by 13.4‐fold and predict the severity of sarcopenia, suggesting that TWEAK levels are closely connected to the pathogenic mechanism of sarcopenia. Under pathological conditions, TWEAK becomes overexpressed (high concentrations, 500 ng/mL) and activates the NF‐kB24 pathway via the FGF‐inducible 14 receptor, leading to increased expression of MuRF1 and activation of the ubiquitin‐proteasome pathway.4 In fact, the other proinflammatory cytokines associated with sarcopenia in this study, TNF‐α and IL‐18, are also known to activate NF‐κB. NF‐κB is a major proinflammatory transcription factor that not only mediates the effects of proinflammatory cytokines but also further increases their expression in a vicious cycle.1 Taken together, these studies and our clinical data suggest that the TWEAK/TNF‐α/IL‐18/NF‐κB proinflammatory signalling pathway plays a dominant role in the mechanism for sarcopenia. Muscle IL‐18 may be expressed as a consequence of physical inactivity or chronic hypoxemia,12 which is consistent with the risk of sarcopenia and the change of serum level IL‐18 in sarcopenic persons. Immunohistochemistry demonstrated that TNF‐α and IL‐18 were solely expressed by Type II fibres, whereas the expression of IL‐6 was more prominent in type I compared with type II fibres,25 which could partly explain why the levels of IL‐6 do not correlate with the risk of sarcopenia. Although the effect of CRP on skeletal muscle mass is well‐known, our data showed that CRP is not tightly associated with sarcopenia in our patients. Indeed, studies have shown that it could be easily influenced by other factors, such as IL‐6, IGF1, physical activity, and lifestyle,26 which could confound the effects of CRP in the elderly body.
Ageing‐related changes in hormones also play a major role in the development of sarcopenia. In our study, we found that the levels of several metabolic hormones were associated with muscle mass and strength in sarcopenic elderly subjects. Our data indicated that serum leptin is significantly correlated with the severity of sarcopenia, and sarcopenia risk, after adjusting for potentially confounding variables. Leptin is an appetite‐suppressive adipokine that links food intake with energy expenditure and body composition.27 Leptin is known to increase muscle mass by decreasing the expression of atrophy‐related factors such as myostatin, MuRF1, and muscle atrophy F‐box in muscles,28 possibly by regulating IGF1 levels,29 although we found no significant correlation between serum leptin and IGF1 levels in our cohort (Table 3). Changes in leptin sensitivity with ageing could contribute to the age‐related degeneration of multiple organs, including skeletal muscles.28 Serum leptin is also correlated with sarcopenic obesity in osteoarthritis patients, consistent with our data.30 In hamsters, leptin levels in the serum and adipose tissues are increased in response to proinflammatory stimuli, including TNF‐α and lipopolysaccharide endotoxin, to simulate post‐infection anorexia.31 This is consistent with our findings that both proinflammatory cytokines and leptin are positively correlated with sarcopenia, and suggests that subclinical inflammation increased leptin levels in presarcopenic and sarcopenic subjects.
Our data also indicated that serum insulin and IGF1 levels were inversely correlated with sarcopenia risk after adjusting for potentially confounding variables and that serum IGF1 levels were inversely correlated with the severity of sarcopenia. The phosphatidylinositol 3′‐kinase‐AKT pathway is the major effector kinase of both insulin and IGF1 in muscles,32 which is known to increase protein synthesis by inducing mammalian target of rapamycin and reduce muscle degradation by suppressing the FoxO‐ubiquitin ligase pathway,33 in opposition to NF‐κB‐induced degradation in skeletal muscles.
Our results indicate that serum adiponectin levels were inversely correlated with sarcopenia risk, thus supporting other studies that suggest that serum adiponectin is protective against sarcopenia.34, 35, 36 However, there are also studies which show that adiponectin is higher in sarcopenic patients, possibly because of the confounding effect of adiponectin resistance and the resultant rise of adiponectin with ageing.37, 38 It has been reported that adiponectin up‐regulates the phosphatidylinositol 3′‐kinase‐AKT pathway, which promotes muscle protein synthesis and prevents muscle protein degradation.33, 39 Interestingly, adiponectin is also an anti‐inflammatory agent, and the production of adiponectin by adipocytes is inhibited by proinflammatory factors, such as TNF‐α and IL‐6.40 Although adiponectin mainly originates from adipose tissue, other studies have shown that adiponectin can also be produced by other cells, including skeletal muscle myocytes and cardiomyocytes.41, 42 In skeletal muscle myocytes, adiponectin can locally regulate energy homeostasis and muscle function via adiponectin receptor 1, AMP‐activated protein kinase, and peroxisome proliferator‐activated receptor‐α.43, 44
Intensive lifestyle intervention via nutritional supplementation and exercise can attenuate the subclinical proinflammatory state, as seen by the significant declines in IL‐18, TNF‐α, and TWEAK levels. Two special components of whey protein, a‐lactalbumin45 and lactoferrin,46 have recently been shown to inhibit the production of proinflammatory cytokines such as TNF‐α and IL‐6 in rat or human monocytes. Whey protein also contains a high proportion of branched chain amino acids, which can stimulate skeletal muscle protein synthesis via mammalian target of rapamycin signalling and also stimulate the release of IGF1.47 In addition, whey protein‐derived amino acids have important insulinogenic properties, which promote pancreatic β‐cell insulin secretion without an additional effect on C‐peptide or insulin clearance.48 Coupled with the slower clearance of whey protein and amino acids in the elderly digestive system, this could partially explain why the levels of insulin and adiponectin increased so significantly post‐intervention in sarcopenic subjects.
There were several limitations in our study that need to be acknowledged. Firstly, given the cross‐sectional nature of this study, it is difficult to capture the dynamic changes in circulating factors during sarcopenia pathogenesis and after intervention. Future studies will aim to address these limitations, especially by analysing the long‐term effects of intensive lifestyle intervention in sarcopenic subjects. Secondly, although we examined several proinflammatory cytokines, it is inevitable that we might have missed other relevant proinflammatory factors in sarcopenia. Here, it should still be noted that the limited proinflammatory cytokine profile we observed for sarcopenia appears to be somewhat different from inclusion body myositis (IBM), a muscle disease that also involves chronic inflammation. While TWEAK appears to be a proinflammatory cytokine biomarker that is shared by both sarcopenia and IBM,49 another study that profiled 48 inflammatory cytokines to identify a list of reliable IBM biomarkers (TRAIL, IL‐8, MIF, MCP‐1, LIF, IP‐10, IFN‐α2, MIG, bNGF, and IL‐3) did not overlap with our list of proinflammatory cytokines, not even IL‐6 and TNF‐α.50 These differences are likely because of the complex pathogenic aetiologies surrounding both IBM51, 52 and sarcopenia.
In conclusion, human ageing is accompanied by a chronic subclinical proinflammatory state, which leads to a variety of complex immune and hormonal changes in the elderly. Proinflammatory cytokines, particularly TWEAK and TNF‐α, exert detrimental effects on muscle mass and strength during the development of sarcopenia in the elderly. Our PPLSS found that in sarcopenic elderly subjects, the serum proinflammatory cytokines and leptin levels are significantly higher compared with non‐sarcopenic elderly persons, while several metabolic hormones were lower. Importantly, our results support the idea that intensive lifestyle intervention, consisting of whey supplementation and resistance exercise training, can reduce the subclinical proinflammatory state and ameliorate sarcopenia.
Funding
This manuscript is based upon work supported by the Capital Clinical Characteristic Application Research Project (Z161100000516153), the Strategic Priority Research Program of the Chinese Academy of Sciences (grant no. XDA16020301), the Central Health Care Research Project (W2017BJ23), and the Key Research Program of the Chinese Academy of Sciences (grant no. KJZD‐SW‐L04).
Authors' contributions
The authors' responsibilities were as follows—K.Y. and C.‐W.L. designed the programme; C.‐W.L., J.Y., and K.L. completed the sample selection and cytokine testing; G.‐X.L. and H.‐Y.X. provided samples; C.‐W.L. and R.‐R.L. reviewed the data, performed the data analyses, and drafted the manuscript; C.‐W.L. wrote the paper; K.Y. had primary responsibility for the final content of the manuscript; K.Y., N.S.‐C., D.‐J.L., and L.‐J.J. guided the whole programme and revised the manuscript; S.‐L.Y., Z.‐J.G., L.‐Y.X., and R.‐J.L. provided technical support. The authors certify that they comply with the ethical guidelines for authorship and publishing of the Journal of Cachexia, Sarcopenia and Muscle.53
Conflict of interest
All authors declare that they have no conflict of interest.
Supporting information
Figure S1. The frequency distribution of FGF21 among 3 EWGSOP subtypes of subjects.
The FGF21 data was changed into a 5‐category histogram, by dividing the range into 5 equal parts, in order to present the frequency distributions. There were no samples for the fourth frequency interval, so only 4 categories were presented for this histogram. FGF21 = Fibroblast growth factor 21.
Figure S2. Correlation analysis of FGF21 vs. limb extremities' muscle mass and muscle strength across all subjects Correlation r is adjusted for age, gender and BMI. FGF21 = Fibroblast growth factor 21. The graphs were created by Photograph.
Table S1. Non‐parametric ANOVA for all circulating factors across 3 EWGSOP subtypes of patients (α’ = 0.017)
Table S2. FGF21 levels across subjects according to sarcopenia and type 2 diabetes mellitus (DM) status
Li C.‐w., Yu K., Shyh‐Chang N., Li G.‐x., Jiang L.‐j., Yu S.‐l., Xu L.‐y., Liu R.‐j., Guo Z.‐j., Xie H.‐y., Li R.‐r., Ying J., Li K., and Li D.‐j. (2019) Circulating factors associated with sarcopenia during ageing and after intensive lifestyle intervention, Journal of Cachexia, Sarcopenia and Muscle, 10, 586–600, 10.1002/jcsm.12417.
Contributor Information
Kang Yu, Email: yuk1997@sina.com.
Ng Shyh‐Chang, Email: huangsq@ioz.ac.cn.
References
- 1. Li H, Malhotra S, Kumar A. Nuclear factor‐kappa B signaling in skeletal muscle atrophy. J Mol Med (Berl) 2008;86:1113–1126. [DOI] [PMC free article] [PubMed] [Google Scholar]
- 2. Zhou J, Liu B, Liang C, Li Y, Song YH. Cytokine signaling in skeletal muscle wasting. Trends Endocrinol Metab 2016;27:335–347. [DOI] [PubMed] [Google Scholar]
- 3. Vinciguerra M, Musaro A, Rosenthal N. Regulation of muscle atrophy in aging and disease. Adv Exp Med Biol 2010;694:211–233. [DOI] [PubMed] [Google Scholar]
- 4. Glass DJ. Signaling pathways perturbing muscle mass. Curr Opin ClinNutr Metab Care 2010;13:225–229. [DOI] [PubMed] [Google Scholar]
- 5. Cruz‐Jentoft AJ, Baeyens JP, Bauer JM, Boirie Y, Cederholm T, Landi F, et al. Sarcopenia: European consensus on definition and diagnosis: report of the European Working Group on Sarcopenia in Older People. Age Ageing 2010;39:412–423. [DOI] [PMC free article] [PubMed] [Google Scholar]
- 6. Beyer I, Mets T, Bautmans I. Chronic low‐grade inflammation and age‐related sarcopenia. Curr Opin Clin Nutr Metab Care 2012;15:12–22. [DOI] [PubMed] [Google Scholar]
- 7. Aleman H, Esparza J, Ramirez FA, Astiazaran H, Payette H. Longitudinal evidence on the association between interleukin‐6 and C‐reactive protein with the loss of total appendicular skeletal muscle in free‐living older men and women. Age Ageing 2011;40:469–475. [DOI] [PubMed] [Google Scholar]
- 8. Bautmans I, Onyema O, Van Puyvelde K, Pleck S, Mets T. Grip work estimation during sustained maximal contraction: validity and relationship with dependency and inflammation in elderly persons. J Nutr Health Aging 2011;15:731–736. [DOI] [PubMed] [Google Scholar]
- 9. Haren MT, Malmstrom TK, Miller DK, Patrick P, Perry HM III, Herning MM, et al. Higher C‐reactive protein and soluble tumor necrosis factor receptor levels are associated with poor physical function and disability: a cross‐sectional analysis of a cohort of late middle‐aged African Americans. J Gerontol A Biol Sci Med Sci 2010;65:274–281. [DOI] [PMC free article] [PubMed] [Google Scholar]
- 10. Kim JK, Choi SR, Choi MJ, Kim SG, Lee YK, Noh JW, et al. Prevalence of and factors associated with sarcopenia in elderly patients with end‐stage renal disease. Clin Nutr 2014;33:64–68. [DOI] [PubMed] [Google Scholar]
- 11. Tajrishi MM, Sato S, Shin J, Zheng TS, Burkly LC, Kumar A. The TWEAK‐Fn14 dyad is involved in age‐associated pathological changes in skeletal muscle. Biochem Biophys Res Commun 2014;446:1219–1224. [DOI] [PMC free article] [PubMed] [Google Scholar]
- 12. Petersen AMW, Penkowa M, Iversen M, Frydelund‐Larsen L, Andersen JL, Mortensen J, et al. Elevated levels of IL‐18 in plasma and skeletal muscle in chronic obstructive pulmonary disease. Lung 2007;185:161–171. [DOI] [PubMed] [Google Scholar]
- 13. Wicherts IS, van Schoor NM, Boeke AJP, Visser M, Deeg DJH, Smit J, et al. Vitamin D status predicts physical performance and its decline in older persons. J Clin Endocrinol Metab 2007;92:2058–2065. [DOI] [PubMed] [Google Scholar]
- 14. Folstein MF, Folstein SE, McHugh PR. “Mini‐mental state”: a practical method for grading the cognitive state of patients for the clinician. J Psychiatr Res 1975;12:189–198. [DOI] [PubMed] [Google Scholar]
- 15. Chen LK, Liu LK, Woo J, Assantachai P, Auyeung TW, Bahyah KS, et al. Sarcopenia in Asia: consensus report of the Asian Working Group for Sarcopenia. J Am Med Dir Assoc 2014;15:95–101. [DOI] [PubMed] [Google Scholar]
- 16. Janssen I, Baumgartner RN, Ross R, Rosenberg IH, Roubenoff R. Skeletal muscle cut points associated with elevated physical disability risk in older men and women. Am J Epidemiol 2004;159:413–421. [DOI] [PubMed] [Google Scholar]
- 17. Frisancho AR. New standards of weight and body composition by frame size and height for assessment of nutritional status of adults and the elderly. Am J Clin Nutr 1984;40:808–819. [DOI] [PubMed] [Google Scholar]
- 18. Guralnik JM, Simonsick EM, Ferrucci L, Glynn RJ, Berkman LF, Blazer DG, et al. A short physical performance battery assessing lower extremity function: association with self‐reported disability and prediction of mortality and nursing home admission. J Gerontol 1994;49:M85–M94. [DOI] [PubMed] [Google Scholar]
- 19. Roman‐Vinas B, Serra‐Majem L, Hagstromer M. International Physical Activity Questionnaire: reliability and validity in a Spanish population. Eur J Sport Sci 2010;10:297–304. [Google Scholar]
- 20. Kyrdalen IL, Moen K, Roysland AS, Helbostad JL. The Otago Exercise Program performed as group training versus home training in fall‐prone older people: a randomized controlled trial. Physiother Res Int 2014;19:108–116. [DOI] [PubMed] [Google Scholar]
- 21. Shahar S, Kamaruddin NS, Badrasawi M, Sakian NI, Abd Manaf Z, Yassin Z, et al. Effectiveness of exercise and protein supplementation intervention on body composition, functional fitness, and oxidative stress among elderly Malays with sarcopenia. Clin Interv Aging 2013;8:1365–1375. [DOI] [PMC free article] [PubMed] [Google Scholar]
- 22. Yamada C, Moriyama K, Takahashi E. Optimal cut‐off point for homeostasis model assessment of insulin resistance to discriminate metabolic syndrome in non‐diabetic Japanese subjects. J Diabetes Investig 2012;3:384–387. [DOI] [PMC free article] [PubMed] [Google Scholar]
- 23. Mittal A, Bhatnagar S, Kumar A, Sakian NI, Abd Manaf Z, Yassin Z, et al. The TWEAK‐Fn14 system is a critical regulator of denervation‐induced skeletal muscle atrophy in mice. J Cell Biol 2010;188:833–849. [DOI] [PMC free article] [PubMed] [Google Scholar]
- 24. Enwere EK, Holbrook J, Lejmi‐Mrad R, Vineham J, Timusk K, Sivaraj B, et al. TWEAK and cIAP1 regulate myoblast fusion through the noncanonical NF‐κB signaling pathway. Sci Signal 2012;5:ra75. [DOI] [PubMed] [Google Scholar]
- 25. Verghese J, Holtzer R, Oh‐Park M, Derby CA, Lipton RB, Wang C. Inflammatory markers and gait speed decline in older adults. J Gerontol A Biol Sci Med Sci 2011;66:1083–1089. [DOI] [PMC free article] [PubMed] [Google Scholar]
- 26. Hirschfield GM, Pepys MB. C‐reactive protein and cardiovascular disease: new insights from an old molecule. QJM 2003;96:793–807. [DOI] [PubMed] [Google Scholar]
- 27. Hamrick MW, Herberg S, Arounleut P, He HZ, Shiver A, Qi RQ, et al. The adipokine leptin increases skeletal muscle mass and significantly alters skeletal muscle miRNA expression profile in aged mice. Biochem Biophys Res Commun 2010;400:379–383. [DOI] [PMC free article] [PubMed] [Google Scholar]
- 28. Hamrick MW. Role of the cytokine‐like hormone leptin in muscle‐bone crosstalk with aging. J Bone Metab 2017;24:1–8. [DOI] [PMC free article] [PubMed] [Google Scholar]
- 29. Hamrick MW, Dukes A, Arounleut P, Davis C, Periyasamy‐Thandavan S, Mork S, et al. The adipokine leptin mediates muscle‐ and liver‐derived IGF‐1 in aged mice. Exp Gerontol 2015;70:92–96. [DOI] [PMC free article] [PubMed] [Google Scholar]
- 30. Manoy P, Anomasiri W, Yuktanandana P, Tanavalee A, Ngarmukos S, Tanpowpong T, et al. Elevated serum leptin levels are associated with low vitamin D, sarcopenic obesity, poor muscle strength, and physical performance in knee osteoarthritis. Biomarkers 2017;22:723–730. [DOI] [PubMed] [Google Scholar]
- 31. Grunfeld C, Zhao C, Fuller J, Pollack A, Moser A, Friedman J, et al. Endotoxin and cytokines induce expression of leptin, the ob gene product, in hamsters. J Clin Invest 1996;97:2152–2157. [DOI] [PMC free article] [PubMed] [Google Scholar]
- 32. Luo J, Sobkiw CL, Hirshman MF, Logsdon MN, Li TQ, Goodyear LJ, et al. Loss of class IA PI3K signaling in muscle leads to impaired muscle growth, insulin response, and hyperlipidemia. Cell Metab 2006;3:355–366. [DOI] [PubMed] [Google Scholar]
- 33. Giovannini S, Marzetti E, Borst SE, Bijlsma AY, Maier AB, Meskers CG, et al. Modulation of GH/IGF‐1 axis: potential strategies to counteract sarcopenia in older adults. Mech Ageing Dev 2008;129:593–601. [DOI] [PMC free article] [PubMed] [Google Scholar]
- 34. China SP, Pal S, Chattopadhyay S, Porwal K, Kushwaha S, Bhattacharyya S, et al. Globular adiponectin reverses osteo‐sarcopenia and altered body composition in ovariectomized rats. Bone 2017;105:75–86. [DOI] [PubMed] [Google Scholar]
- 35. Inoue A, Cheng XW, Huang Z, Hu L, Kikuchi R, Jiang H, et al. Exercise restores muscle stem cell mobilization, regenerative capacity and muscle metabolic alterations via adiponectin/AdipoR1 activation in SAMP10 mice. J Cachexia Sarcopenia Muscle 2017;8:370–385. [DOI] [PMC free article] [PubMed] [Google Scholar]
- 36. Can B, Kara O, Kizilarslanoglu MC, Arik G, Aycicek GS, Sumer F, et al. Serum markers of inflammation and oxidative stress in sarcopenia. Aging Clin Exp Res 2017;29:745–752. [DOI] [PubMed] [Google Scholar]
- 37. Huang C, Tomata Y, Kakizaki M, Sugawara Y, Hozawa A, Momma H, et al. High circulating adiponectin levels predict decreased muscle strength among older adults aged 70 years and over: a prospective cohort study. Nutr Metab Cardiovasc Dis 2015;25:594–601. [DOI] [PubMed] [Google Scholar]
- 38. Bucci L, Yani SL, Fabbri C, Bijlsma AY, Maier AB, Meskers CG, et al. Circulating levels of adipokines and IGF‐1 are associated with skeletal muscle strength of young and old healthy subjects. Biogerontology 2013;14:261–272. [DOI] [PubMed] [Google Scholar]
- 39. Zhou Q, Du J, Hu Z, Walsh K, Wang XH. Evidence for adipose‐muscle cross talk: opposing regulation of muscle proteolysis by adiponectin and Fatty acids. Endocrinology 2007;148:5696–5705. [DOI] [PubMed] [Google Scholar]
- 40. Ouchi N, Parker JL, Lugus JJ, Walsh K. Adipokines in inflammation and metabolic disease. Nat Rev Immunol 2011;11:85–97. [DOI] [PMC free article] [PubMed] [Google Scholar]
- 41. Krause MP, Liu Y, Vu V, Chan L, Xu A, Riddell MC, et al. Adiponectin is expressed by skeletal muscle fibers and influences muscle phenotype and function. Am J Physiol Cell Physiol 2008;295:C203–C212. [DOI] [PMC free article] [PubMed] [Google Scholar]
- 42. Skurk C, Wittchen F, Suckau L, Witt H, Noutsias M, Fechner H, et al. Description of a local cardiac adiponectin system and its deregulation in dilated cardiomyopathy. Eur Heart J 2008;29:1168–1180. [DOI] [PubMed] [Google Scholar]
- 43. Van Berendoncks AM, Garnier A, Beckers P, Hoymans VY, Possemiers N, Fortin D, et al. Functional adiponectin resistance at the level of the skeletal muscle in mild to moderate chronic heart failure. Circ Heart Fail 2010;3:185–194. [DOI] [PubMed] [Google Scholar]
- 44. Yamauchi T, Kamon J, Minokoshi Y, Ito Y, Waki H, Uchida S, et al. Adiponectin stimulates glucose utilization and fatty‐acid oxidation by activating AMP‐activated protein kinase. Nat Med 2002;8:1288–1295. [DOI] [PubMed] [Google Scholar]
- 45. Yamaguchi M, Yoshida K, Uchida M. Novel functions of bovine milk‐derived alpha‐lactalbumin: anti‐nociceptive and anti‐inflammatory activity caused by inhibiting cyclooxygenase‐2 and phospholipase A. Biol Pharm Bull 2009;32:366–371. [DOI] [PubMed] [Google Scholar]
- 46. Mattsby‐Baltzer I, Roseanu A, Motas C, Elverfors J, Engberg I, Hanson LA. Lactoferrin or a fragment thereof inhibits the endotoxin‐induced interleukin‐6 response in human monocytic cells. Pediatr Res 1996;40:257–262. [DOI] [PubMed] [Google Scholar]
- 47. Ticinesi A, Meschi T, Lauretani F, Felis G, Franchi F, Pedrolli C, et al. Nutrition and inflammation in older individuals: focus on vitamin D, n‐3 polyunsaturated fatty acids and whey proteins. Nutrients 2016;8:186–209. [DOI] [PMC free article] [PubMed] [Google Scholar]
- 48. Gunnerud UJ, Ostman EM, Bjorck IM. Effects of whey proteins on glycaemia and insulinaemia to an oral glucose load in healthy adults; a dose‐response study. Eur J Clin Nutr 2013;67:749–753. [DOI] [PubMed] [Google Scholar]
- 49. Morosetti R, Gliubizzi C, Sancricca C, Broccolini A, Gidaro T, Lucchini M, et al. TWEAK in inclusion‐body myositis muscle. Am J Pathol 2012;180:1603–1613. [DOI] [PubMed] [Google Scholar]
- 50. Badrising UA, Tsonaka R, Hiller M, Niks EH, Evangelista T, Lochmüller H, et al. Cytokine profiling of serum allows monitoring of disease progression in inclusion body myositis. J Neuromuscul Dis 2017;4:327–335. [DOI] [PubMed] [Google Scholar]
- 51. Dalakas MC. Sporadic inclusion body myositis‐diagnosis, pathogenesis and therapeutic strategies. Nat Clin Pract Neurol 2006;2:437–447. [DOI] [PubMed] [Google Scholar]
- 52. Krause S. Insights into muscle degeneration from heritable inclusion body myopathies. Front Aging Neurosci 2015;7:13. [DOI] [PMC free article] [PubMed] [Google Scholar]
- 53. von Haehling S, Morley JE, Coats AJS, Anker SD. Ethical guidelines for publishing in the Journal of Cachexia, Sarcopenia and Muscle: update 2017. J Cachexia Sarcopenia Muscle 2017;8:1081–1083. [DOI] [PMC free article] [PubMed] [Google Scholar]
Associated Data
This section collects any data citations, data availability statements, or supplementary materials included in this article.
Supplementary Materials
Figure S1. The frequency distribution of FGF21 among 3 EWGSOP subtypes of subjects.
The FGF21 data was changed into a 5‐category histogram, by dividing the range into 5 equal parts, in order to present the frequency distributions. There were no samples for the fourth frequency interval, so only 4 categories were presented for this histogram. FGF21 = Fibroblast growth factor 21.
Figure S2. Correlation analysis of FGF21 vs. limb extremities' muscle mass and muscle strength across all subjects Correlation r is adjusted for age, gender and BMI. FGF21 = Fibroblast growth factor 21. The graphs were created by Photograph.
Table S1. Non‐parametric ANOVA for all circulating factors across 3 EWGSOP subtypes of patients (α’ = 0.017)
Table S2. FGF21 levels across subjects according to sarcopenia and type 2 diabetes mellitus (DM) status