

Abstract
Loaded into ARGONAUTE(AGO) proteins, eukaryotic micro(mi)RNAs regulate gene expression via cleavage, translational repression, and/or accelerated decay of sequence‐complementary target transcripts. Despite their importance in development, cell identity maintenance and stress responses, how individual miRNAs contribute to spatial gene regulation within the complex cell mosaics formed in tissues/organs has remained inaccessible in any organism to date. We have developed a non‐invasive methodology to examine, at single‐cell‐type resolution, the AGO‐loading and activity patterns of entire miRNA cohorts in intact organs, applied here to the Arabidopsis root tip. A dual miRNAome–targetome analytical interface allowing intuitive data integration/visualization was developed as the basis for in‐depth investigations via single‐cell‐type experimentation. These uncovered an array of so far speculative or hitherto unknown types of spatial miRNA‐mediated gene regulation schemes, including via widespread cell‐to‐cell movement between contiguous layers of distinct identities. This study provides the proof of principle that minimally invasive, genome‐scale analysis of miRNA activities within and between single‐cell types of whole organs is achievable.
Keywords: AGO1, microRNA, miRoot, translatome, targetome
Subject Categories: Methods & Resources, Plant Biology, RNA Biology
Introduction
Eukaryotic 20–22‐nt miRNAs are processed by Dicer enzymes from stem–loop precursors contained within non‐coding primary transcripts. Upon loading into ARGONAUTE (AGO) proteins, they silence gene expression by base‐pairing to sequence‐complementary target mRNAs. In metazoans, limited miRNA:target pairing centered on a 7‐nt “seed” typically predicts dozens of target transcripts for any single miRNA, which undergo accelerated mRNA decay and/or reversible translational repression (TR; Ghildiyal & Zamore, 2009). AGO1‐catalyzed endo‐nucleolytic cleavage (“slicing”) coupled to TR underlies regulations by plant miRNAs, which, unlike in metazoans, engage much smaller numbers of readily predictable target transcripts owing to extended base‐pairing. Consequently, exhaustive suites of validated miRNA targets are available in Arabidopsis (Arribas‐Hernández et al, 2016) among other model species.
Highly tractable developmental models have enabled precise deconvolutions of specific miRNA activities over time, including those of lin‐4 and let‐7 larval stage‐specific developmental timing in C. elegans (Lee et al, 1993; Reinhart et al, 2000). In zebrafish, miR‐430 alone operates the clearance of hundreds of maternally deposited zygotic transcripts via TR followed by mRNA decay shortly after fertilization, to ensure proper morphogenesis (Giraldez et al, 2006; Bazzini et al, 2012). So far, however, such developmental studies in whole animals/organs have only involved a handful of miRNAs but not comprehensive cohorts thereof. Spatial dissections, as opposed to temporal dissections of global plant/metazoan miRNA activities are even more challenging due to cellular heterogeneity and technical limitations. Indeed, whole‐tissue analyses provide an average view of potentially highly disparate miRNA:target interaction levels within individual cell types/states. In plants, this is palpable from the modest changes (twofold to threefold) in target transcript accumulation often observed in wild‐type (WT) versus generic/specific miRNA‐deficient mutants that display nonetheless profound growth defects (Brodersen et al, 2008). Most likely, high‐amplitude target regulations occur within specific cell types, yet they are confounded by the mosaic nature of tissues. Attaining cell‐type resolution while maintaining tissue integrity under limited stress is an additional challenge of such studies. For instance, protoplasting followed by fluorescence‐activated cell sorting (FACS; Breakfield et al, 2012) was used to isolate cell‐type‐specific total sRNAs in Arabidopsis, but the approach's invasiveness resulted in sequencing reads being confounded by stress‐related sRNAs. These various obstacles likely explain why unbiased, genome‐scale studies of miRNA activities are yet to be reported in any intact organ of plants or animals.
Addressing this question would typically entail the non‐invasive cell‐type‐specific isolation of (i) exhaustive functional miRNA cohorts, on the one hand, and (ii) exhaustive target transcript cohorts, on the other. Computational integration of (i) and (ii) would then be required for (iii) data visualization and validation as well as (iv) subsequent exploration and experimental confirmation of newly identified spatial modes of miRNA:target regulations. To establish, for the first time in any organism, that tasks (i–iv) are indeed achievable, we exploited the stereotypical organization of the Arabidopsis root, in which continuous stem cell division, longitudinal elongation, and differentiation produce nested, clonally related cylindrical cell files. In the dividing root tip, the endodermis (endo), cortex (cor), and epidermis (epi) surround the vascular cylinder also known as the stele (st). Above the central root cap (the columella; col), a mitotically poorly active reservoir of only few stem cells, the quiescent center (QC), contacts all of the aforementioned cell layer's initials—together forming the stem cell niche (SCN)—and maintains their stemness (Fig 1A; Petricka et al, 2012). Highly coordinated genetic programs underlie the relatively simple root tip ontology, making it a theoretically ideal model to explore functional miRNA:target interactions at cell‐type‐specific resolution within a whole, complex organ.
Figure 1. Cell‐type‐specific map of AGO1‐loaded miRNAs in the Arabidopsis root.

- Schematics of the Arabidopsis root tip; relevant cell layers are highlighted.
- Representative confocal images of cell‐type‐specific promoter::GFP:AGO1 translational fusions.
- Immunoblot analysis of FLAG:AGO1 IPed in each root tip layer.
- Left: input and IPed AGO1 following post‐lysis addition of a radiolabeled siRNA duplex (siGFP). Right: northern analysis of AGO1‐bound sRNAs.
- Layer‐specific distribution of all AGO1‐loaded miRNAs.
- Northern analysis of layer‐specific AGO1‐loaded miRNAs using sRNAs IPed independently from that used for deep sequencing. Bar‐plots underneath each panel display the deep‐sequencing results as normalized read counts.
- Origins, proportions, and conservation of previously uncharacterized AGO1‐loaded miRNAs. See Appendix Table S3 for details.
Results
The functional root tip miRNAome
To attain a cell‐type‐specific map of all miRNAs in the root tip (task i), we aimed at the non‐invasive isolation of AGO1‐loaded miRNAs, i.e., those species functionally engaged into target regulation, as opposed to total sRNAs. We expressed both FLAG‐epitope‐ and GFP‐tagged AtAGO1 (F::AGO1, GFP::AGO1) in various root cell layers of Arabidopsis thaliana (At) dcl2/3/4 triple‐mutant roots, in which endogenous (endo)siRNAs production is thereby eliminated altogether without overt impact on plant development. This artifice was mandatory to avoid endo‐siRNA‐mediated co‐suppression, a caveat inherent to AtAGO1 feedback regulation preventing stable, ectopic AGO1 expression in Arabidopsis (Mallory & Vaucheret, 2009). Being devoid of all endo‐siRNAs, the dcl2/3/4 background was also incidentally expected to enrich the miRNA contents of the various cell types analyzed. GFP::AGO1 expressed under the col‐(ACR4)‐/st‐(SHR)‐/endo‐(SCR)‐/cor‐(CO2)‐ or epi‐(WER)‐specific promoters yielded layer‐restricted fluorescent signals, indicating that AGO1 is cell‐autonomous (Fig 1B and Appendix Fig S1). Columella aside, root‐cell‐specific F::AGO1 alleles were immunoprecipitated at comparable levels in selected single‐copy lines (Fig 1C). These displayed unaltered miRNA levels and, accordingly, normal development (Fig 1B and Appendix Fig S1 and S2). The SCR::GFP (endodermis) signal overlaps the QC in the post‐embryonic root and was indeed used, in previous FACS‐based studies (Breakfield et al, 2012), to encompass the QC's total sRNAome. While the same approximation is usually made in root transcriptome and translatome studies, we nonetheless chose to treat here the QC as an unexplored layer for the sake of data accuracy.
F::AGO1 was immunoprecipitated (IPed) in each layer without detectable endogenous AtAGO1 contamination (Fig 1C). Moreover, F::AGO1 driven by the native AGO1 promoter was bound to endogenous miRNAs but not to artificial GFP siRNA duplexes added in excess during lysis, arguing against assembly of artefactual F::AGO1:sRNA complexes during the process, which would have otherwise confounded the approach (Fig 1D). Of ~20 millions deep‐sequencing reads from each cell‐specific F::AGO1‐IP, 65–80% were known miRNAs (Appendix Table S1). These miRNAs displayed cell‐specific loading patterns consistently confirmed by northern analyses of independently F:AGO1‐IPed sRNAs (Fig 1E and F, and Appendix Fig S2). These analyses concur both qualitatively and quantitatively with those of previous case‐by‐case miRNA transcription studies, e.g., endo:miR165/166 and st:miR160 (Wang et al, 2005), col:miR396 (Rodriguez et al, 2015; Fig 1E and F, and Appendix Fig S2). miR402/miR417/miR828 induced by cold/dehydration/wounding, respectively (Khraiwesh et al, 2012), remained at or below detection confirming the low invasiveness of sample preparation (Appendix Table S2).
The resulting functional miRNAome comprised 159 out of 427 annotated Arabidopsis miRNAs defining 327 loci (miRbase.v.21; Appendix Table S2). 230 additional and previously uncharacterized loci were identified that fulfilled consensus MIRNA annotation criteria (Meyers et al, 2008), of which 30% are conserved in Arabidopsis lyrata and respectively 14%, 16%, and 9.5% map to intergenic, protein‐coding, and tRNA loci (Fig 1G and Appendix Fig S3, Appendix Table S3, and Dataset EV1). Approximately 60% map to transposable elements (TEs) and had remained presumably invisible in the WT as opposed to dcl2/3/4 triple‐mutant background due to overlapping, abundant TE‐derived endo‐siRNAs (Lu et al, 2006). The sheer amount of newly discovered miRNAs precluded their experimental validation and putative target exploration as part of the present work; these will be documented in a separate study. Based on these results, we conclude that minimally invasive AGO1 IPs adequately fulfill the requirements of task (i) by defining exhaustive, cell‐type‐specific, and functional miRNAomes within a whole organ.
miRNA loading is quantitatively and qualitatively contrasted across layers
No miRNA was ubiquitously loaded across the root tip layers; none was strictly single‐layer‐specific either. miRNA loading was, instead, contrasted across and usually strongest within one layer, e.g., miR163/165a(endo), miR158a(cor/epi), miR173(epi), resulting in cell‐type‐specific clusters (Fig 1E and F, and Appendix Fig S2). Surprisingly, several sequence‐unrelated miRNAs displayed overall similar AGO1‐loading patterns culminating, moreover, in layers from very distinct initials—the cor/epi prominently (Fig 1E). That their relative position to neighboring cells, not their lineage, determines root cells’ identities could rationalize this observation (Berger et al, 1998), as might similar responses to the environment. Indeed, the cor/epi are the outermost layers in the root's radial structure (Fig 1A).
Noteworthy, the longitudinally more restricted activity of CO2 and altered/smaller anatomy of the columella (ACR4) compared to the SHR/SCR/WER transcription domains often caused a signal drop in the cortex and columella also visible by independent RNA analysis via northern blotting (Fig 1F and Appendix Fig S2). The stele dominated the AGO1‐miRNA‐loading landscape (Fig 1E; Appendix Table S2) including that of large families (e.g., miR156a‐f) expected, from previous case‐by‐case studies (Nikovics et al, 2006; Nogueira et al, 2009), to display non‐redundant functions across, rather than within, a single layer. A probable reason is that the stele's xylem, phloem, procambium, and pericycle are not individually discriminated by the SHR promoter (Helariutta et al, 2000). This stele bias is unlikely explained by a general enhancement in DCL1 activity in the dcl2/3/4 triple‐mutant background because such an effect should have been manifested in all layers, in which, instead, both miRNA enrichment and depletion were observed. Unequal DCL1 activity across individual cell types, including a stele‐specific enhancement, is also unlikely given the relatively uniform expression of DCL2, DCL3, and DCL4 in these cell types (Brady et al, 2007).
Strikingly, the prevalence of miRNA paralogs in the stele often concerned only some family members. miR159c accumulation, for instance, was fourfold higher in the epidermis than in the stele, which is, nonetheless, the main AGO1‐loading domain for miR159a‐b (Appendix Table S2). Stele miRNA paralogs also showed profound quantitative differences: the miR156g‐j AGO1‐loading levels were up to three orders of magnitude lower than those of miR156a‐f, as were those of miR157d versus miR157a‐c, and miR171a versus miR171b/c levels (Fig 1E and F; Appendix Table S2). The root tip underrepresentation of entire miRNA families (e.g., miR172a‐e) likely reflects their main or exclusive involvement in aerial tissues or, later, during root cell elongation/differentiation not covered by the study. This global analysis of AGO1‐loading patterns across distinct cell types therefore confirms the obtention of a reliable and minimally invasive map of functional miRNAs within a whole organ, as defined by task (i).
The cell‐type‐specific root tip miRNA targetome
An exhaustive view of miRNA targets across the root tip—the challenge posed by task (ii)—requires isolation of cell‐type‐specific transcriptomes in a manner reflecting transcripts’ regulations by miRNAs. Given the sheer number and genetic redundancy within sometimes extended Arabidopsis MIRNA families, a gene‐specific reverse genetic approach was beyond technical reach. Therefore, a generic miRNA‐deficient background was needed to address this task. We excluded the use of dcl1 or ago1 null alleles because of their embryonic lethality and growth arrest at the two‐cotyledon stage, respectively. Hypomorphic mutations thereof, on the other hand, display too little penetrance and/or expressivity. To solve this issue, we used a null mutation in HYPONASTIC LEAVES 1 (HYL1; Vazquez et al, 2004), which encodes a double‐stranded (ds)RNA binding protein assisting DCL1 in miRNA processing. The hyl1‐2 null allele accumulates low miRNA levels in roots at least comparable to those of the dcl1‐11 allele yet without the complication of its compromised root growth phenotype (Appendix Fig S4). Hence, hyl1‐2 roots, while cellularly disorganized, remain amenable to experimentation (Fig 2A and Appendix Fig S4); moreover, WT roots express HYL1 ubiquitously (Appendix Fig S4). Thus, we reasoned that miRNA target levels should increase in each hyl1 versus WT layer notwithstanding other indirect effects of the mutation.
Figure 2. Cell‐type‐specific impact of miRNA action on the Arabidopsis root translatome.
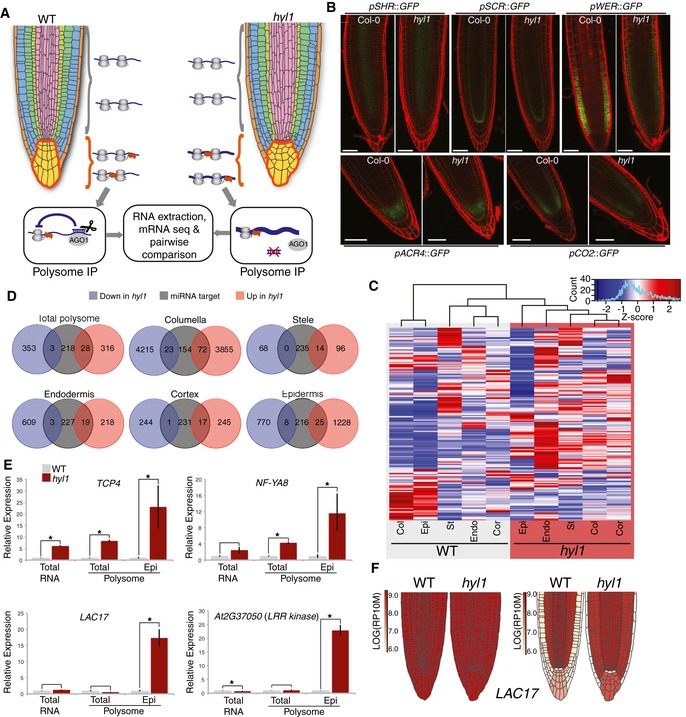
- Schematics of layer‐specific polysome profiling comparing, here, the WT versus hyl1 columella. Profiling was conducted with RPL18 expressed under each cell‐type‐specific promoter, or the ubiquitous 35S promoter, providing a control for the total roots’ signal.
- Representative confocal images of cell‐type‐specific promoter::GFP transcriptional fusions in hyl1 versus WT roots.
- Hierarchical clustering of validated miRNA targets between different cell layers in either WT or hyl1 roots.
- Total number of up‐regulated (pink) or down‐regulated (blue) transcripts in hyl1 versus WT background, compared to the total number of validated miRNA targets (gray) isolated via total, or cell‐type‐specific, polysome profiling.
- qRT–PCR validation of three distinct classes of direct miRNA target transcripts from total root‐, total root polysome‐, or epidermis‐specific polysome‐associated RNA. The AT2G37050 kinase is positively regulated by LAC17.
- miRoot snapshots of whole‐root (left) and layer‐specific (right) LAC17 mRNA accumulation in WT versus hyl1, as assessed by polysome profiling.
First, we generated cell‐type‐specific “translatomes” as proxies of active transcriptomes. We expressed, in WT Arabidopsis, a FLAG‐epitope‐tagged allele of the cell‐autonomous RPL18 ribosomal protein (F::RPL18; Mustroph et al, 2009) under the same promoters used for cell‐type‐specific AGO1‐loaded miRNA profiling (Fig 1B) or under the constitutive 35S promoter (total polysomes). Single‐copy lines displaying layer‐specific F::RPL18 expression were isolated and subsequently crossed to the hyl1‐2 mutant. As a proof of concept, we tested 8 known miRNA targets from total RNA or 35S::F:RPL18 IPs in both WT and hyl1 backgrounds (Appendix Fig S5). In most cases, polysome IPs were equal or superior to total RNA samples in quantifying miRNA‐mediated gene regulation (Appendix Fig S5). Two independent RPL18::F‐IP replicates were produced for each cell layer in WT and hyl1; the co‐IPed RNA was then deep‐sequenced, producing ~30 million paired reads/sample (Fig 2A; Appendix Table S4). In all WT replicates, the ACR4/SHR/SCR/CO2/WER mRNAs were substantially enriched within their cognate expression layers (Appendix Fig S6), indicating only marginal cross‐contamination. Crucially, the transcription patterns of ACR4/SHR/SCR/CO2/WER, assessed by transcriptional fusions, remained unaltered in hyl1 (Fig 2B). Despite the previously mentioned miRNAome caveats of the stele (SHR) and cortex (CO2) also applying to their translatomes, unsupervised clustering of all validated Arabidopsis miRNA targets (as collated in Arribas‐Hernández et al, 2016) recapitulated the cognate root layers’ phylogeny in WT samples; this phylogeny was lost, by contrast, in hyl1 (Fig 2C).
Approximately 8,000 out of 33,601 total genes (24%) displayed significantly altered expression in hyl1 versus WT columella, of which 95 (1.2%) were validated miRNA targets (Fig 2D; Arribas‐Hernández et al, 2016). By contrast, hyl1 had a comparatively less dramatic effect on the other layers’ global transcriptomes, with only 700 (2%) misregulated mRNAs in total polysomes and 0.5, 2.5, 1.5, and 6% in the stele, endodermis, cortex, and epidermis’ polysomes, respectively. Of all the 249 validated miRNA target transcripts in Arabidopsis (Arribas‐Hernández et al, 2016), 11% were misregulated in total polysomes and 28, 5.6, 7.6, 6.8, and 10% in the columella, stele, endodermis, cortex, and epidermis’ polysomes, respectively; most variations corresponded to up‐regulations in hyl1 (Fig 2D). The transcriptional impact of hyl1 is, therefore, proportionally stronger for miRNA targets than it is for the total transcript pool of Arabidopsis. The significantly higher transcriptome changes in the columella and, to a lesser extent, in the epidermis suggest either that (some) miRNAs act far upstream in these layers’ gene expression programs or that miRNA‐unrelated HYL1 functions cause more significant pleiotropy when disrupted in them.
The depth and resolution of cell‐specific F::RPL18‐IP were tested arbitrarily in the epidermis using RT–qPCR analysis of candidates identified via sequencing of RNA independently extracted from WT and hyl1 from (a) whole roots (total RNA), (b) ubiquitous F::RPL18‐IPs (total polysome), or (c) epi‐(WER)‐specific F::RPL18‐IPs (epi polysome; Fig 2E). With all approaches, miRNA targets highly regulated across all root layers; e.g., TCP4 miR319, displayed substantially higher levels in hyl1 versus WT. The difference was much less pronounced, however, with approaches a‐b applied to miRNA targets undergoing more layer‐specific regulations. NF‐YA8 miR169, for instance, exhibited ~2‐fold up‐regulation in hyl1 versus WT whole‐root analysis, yet a further fourfold (~8x) up‐regulation was seen when focusing on the epidermis (Fig 2E). Finally, the effects of certain miRNAs were exclusively visible in single layers. For instance, only by comparing epi‐(WER)‐F::RPL18‐IP signals was a ~20‐fold LAC17 miR397 enrichment uncovered. It was similarly observed for AT2G37050, which is not regulated by a miRNA but regulated by LAC17 (Fig 2E and F; Berthet et al, 2011). The successful completion of task (ii) by implementation of the first cell‐type‐specific miRNA “targetome” in any organism so far reveals, therefore, that single‐layer miRNA action enables genetic regulations of considerable amplitude and complexity. Despite their foreseeable biological significance, however, a significant fraction of these was previously confounded in whole‐tissue analysis.
Integrating miRNAome and targetome for data visualization and mining
Next, we sought to complete task (iii) by integrating the F:AGO1‐IP and F:RPL18‐IP datasets into a user‐friendly browser coined miRoot (https://www.miroot.ethz.ch). The underlying interface was designed by graphic cell layer deconvolution based upon high‐resolution images of WT versus hyl1 root tips (Fig 3A and B, and Appendix Fig S7). Layers were then digitalized and re‐assembled into virtual root tips from which, as explained, the QC was purposely excluded despite being encompassed in the SCR (endo) activity domain. In virtual root tips, cell‐specific signals for single miRNAs (WT background) or single mRNA translatomes (WT versus hyl1 backgrounds) have various color intensities reflecting the pan‐layer signals’ strengths, expressed in absolute, or log2, values. In the miRNA‐query setting (Fig 3A top blue square), all known matching miR‐5p/3p and paralogs (a,b,c,d etc.) of any given miRNA (here miR156) are displayed in a pulldown menu alongside the mature strands’ sequences (Appendix Fig S7). The 5p/3p search module therefore encompasses sequence reads of labile miRNA passenger strands (miR*) to take into account that some AGO1:miR* associations have been described as potentially functional (Manavella et al, 2013; an example is shown in Appendix Fig S8). A scale normalization option allows comparing multiple paralogous AGO1‐loaded miRNA signals within a “scale group” to intuitively discern dominant versus minor contributors to target regulation. A second option enables accretion of AGO1‐loading signals to assess the bulk contribution of paralogous miRNA activities within/across layers (Fig 3A). Due, as discussed, to its comparatively poor cell‐type resolution by SHR, the stele was found to sometimes contribute potentially exaggerated AGO1‐loading signals possibly undermining those of adjacent files (Fig 3A). This prompted the creation of a mono‐/multi‐layer removal option coupled to concurrent re‐calculation of signal intensities, which are all relative to each others. This effectively addresses the stele caveat and, more generally, enables focused analyses in any layer(s), bypassing, for instance, those layers in which miRNA‐mediated regulations are unexpected or unapparent from the sequencing read counts. An example of this is illustrated in Fig 3A, right panel; a tutorial detailing these analytical options is found in Appendix Fig S7 and on the browser itself.
Figure 3. Integration of miRNAome and targetome data into the miRoot browser.
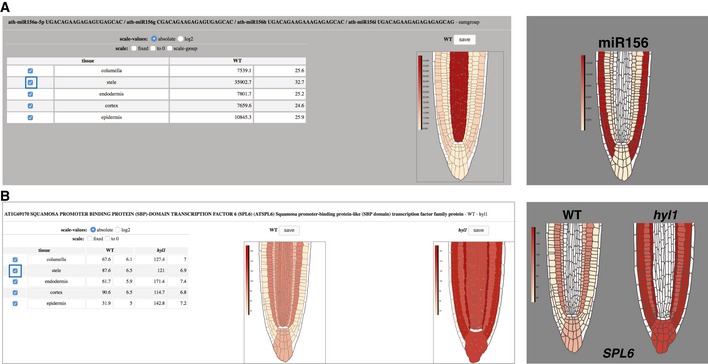
- miRoot snapshot of cell‐type‐specific miRNAs showing, in this case, a sum group of the miR156 family. The right panel shows the gradient of expression revealed upon removal of the stele (blue box).
- Snapshot of the SPL6 miR156 translatome in WT and hyl1 backgrounds. Removal of the stele (blue box) reveals subtleties of miR156‐mediated gene regulation in the other layers, resulting in a near‐mirror image of (A).
The same options are available in the transcript‐query setting of miRoot (Fig 3B), in which the full curated Arabidopsis transcriptome (TAIR10) may be interrogated. In the example of Fig 3B, a well‐known target of miR156a, SPL6 miR156, was queried using all cell layers (left panel) or with the stele removal option (right panel). The ensuing mutually exclusive patterns of AGO1‐loaded miR156a and SPL6 mir156 accumulation are fully consistent with a direct, cell‐autonomous miRNA:target interaction. This example, among many others presented here, incidentally demonstrates the functionality and accuracy of miRoot and, hence, of the underlying datasets.
miRoot analyses seconded by in planta experimentation were then used as the basis for data validation and exploration of potentially novel modes of transcript regulations—the ambitious objectives of task (iv). Appendix Fig S9 shows that even a relatively common form of metazoan/plant miRNA–target interactions—called buffering, believed to preserve near‐constant target gene expression from environmental or stress‐induced fluctuations—is endowed by an unexpectedly dynamic range across cell layers, not appreciable in whole‐tissue analysis. Appendix Fig S10 illustrates the regulatory versatility of a single miRNA:target pair across contiguous development stages, while Appendix Fig S11 shows how selective transcript accumulation gradients might be defined across cell layers under limiting miRNA concentrations.
The additional examples highlighted in the following sections of the present study were specifically chosen to further illustrate how single‐cell‐type resolution deepens our understanding of gene regulatory mechanisms inferred from previous macroscopic observations, or purely theoretical premises. Other examples uncover so far largely unexplored facets of miRNA‐mediated gene regulation, be it in plants or metazoans, none of which would have been accessible via analysis conducted in whole‐tissues or cell cultures. These include the ability of some—albeit not all—miRNAs to act non‐cell‐autonomously. The emphasis in these examples is not on the nature of selected miRNA:target pairs per se but, instead, on the underlying spatial regulatory schemes revealed by such interactions of relevance beyond plants.
A single miRNA:target pair engages in distinctly unique regulatory mechanisms in directly adjoining cell types
As root cell lineages emerge, stemness‐promoting transcription factors continuously specify the QC and surrounding col/st/endo/cor initials forming the SCN. These transcription factors include PLETHORA1/2 (PLT1/2), both negatively controlled by GROWTH‐REGULATING FACTOR2/3 (GRF2/3; Rodriguez et al, 2015). miR396a/b promotes stemness by targeting GRF1‐3 miR396 in the QC and columella initials, which, together with columella cells, form its known transcription domain (Rodriguez et al, 2015). Analysis of pmiR396a::H2B:GFP and F::AGO1‐miRNA sequencing data independently corroborated this pattern and the significantly weaker signal yielded by pmiR396b (Fig 4A and B; Rodriguez et al, 2015). A pGRF2::H2B:GFP transcriptional fusion yielded respectively strong and fainter signals in the columella and transient‐amplifying cells (TACs) above the QC and SCN (Fig 4C). The signal was below detection, however, in the region in‐between the QC/SCN‐spanning domain, thus uncovering GRF2/MIR396a antipodal transcription patterns. These typify “mutual exclusion” (Flynt & Lai, 2008; Voinnet, 2009) whereby continued miR396 production in an otherwise GRF2 transcription‐free domain likely prevents, rather than actively suppresses, unwanted GRF2 accumulation in the QC/SCN. Indeed, the ensuing PLT1/2 deficit would presumably critically compromise stemness.
Figure 4. Cell‐type‐specific analysis reveals hitherto unknown miRNA‐mediated gene regulatory programs.
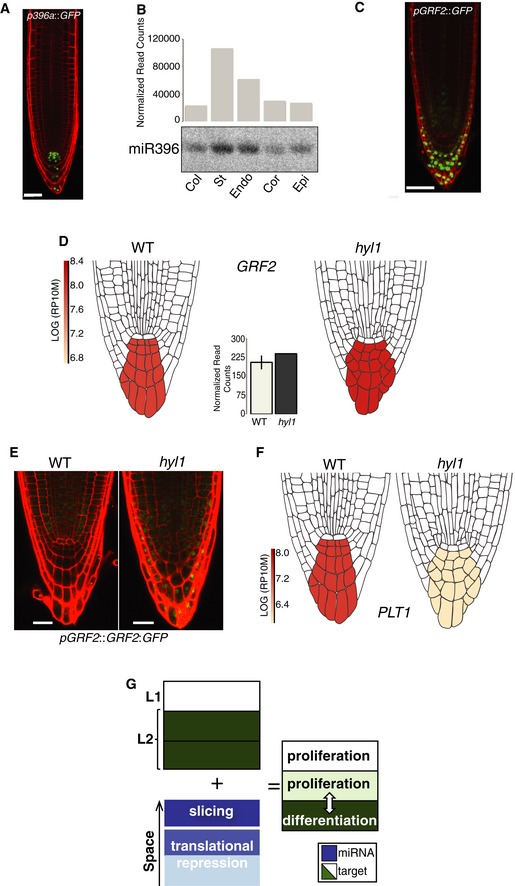
- Confocal image of pmiR396a::H2B:GFP.
- Normalized read counts from AGO1‐IP‐seq and independent northern analysis of AGO1‐loaded miR396.
- Representative confocal image of the pGRF2::H2B:GFP translational fusion.
- Focused miRoot analysis of the GRF2 translatome signal in WT versus hyl1 columella. Graph: GRF2‐normalized read counts.
- Representative confocal images of the pGRF2::GRF2:GFP translational fusion in WT or hyl1 backgrounds.
- Focused miRoot analysis of the PLT1 translatome signal in WT versus hyl1 columella.
- Schematic demonstrating multiple principles of miR396‐mediated transcript regulation.
In addition to slicing, plant miRNA targets also undergo translational repression (TR) to varying extents via poorly understood, likely reversible mechanisms (Flynt & Lai, 2008). TR is difficult to conceptualize with ongoing slicing (Brodersen et al, 2008; Voinnet, 2009; Li et al, 2013, 2016) raising the conjecture that the two processes might be subcellularly partitioned or even spatially separated between individual cells in ways inaccessible in whole tissues (Voinnet, 2009). This idea was pursued via a deeper analysis of the regulation of GRF2 by miR396, which, in contrast to their QC/SCN‐proximal mutual exclusion, display overlapping transcription in the columella cells just below the QC/SCN (Fig 4C). This previously uncharacterized pattern was visualized with miRoot by focusing exclusively on the columella. Counterintuitively, transcript levels of GRF1/GRF2 were unchanged or even slightly decreased for GRF3 in WT versus hyl1 columella (Fig 4D and Appendix Fig S12), yet pGRF2::GRF2:GFP and pGRF3::GRF3:GFP translational fusions yielded a TAC‐restricted signal in WT root tips, as reported (Rodriguez et al, 2015). This signal expanded further into the columella initials in hyl1, spanning the GRF2/MIR396a transcription domains (Fig 4E). This pattern is specifically miR396‐dependent and not a pleiotropic effect of the hyl1 background because it was recapitulated in WT tissues with a miR396‐resistant pGRF3::rGRF3:GFP allele (Rodriguez et al, 2015; Appendix Fig S12). Accordingly, PLT1/2 levels decreased by respectively 2.5‐fold/3.4‐fold in hyl1 versus WT columella (Fig 4F and Appendix Fig S12).
We conclude that miR396a mediates near or exclusive TR of GRF2/GRF3 in this layer, yet its constitutive expression across root tip layers consistently reduces the GRF2/GRF3 mRNA levels by up to fivefold when assayed at the whole root level (Casadevall et al, 2013; Rodriguez et al, 2015). This provides the first experimental indication that slicing and TR mediated by individual miRNAs may be indeed spatially separated between, rather than coincident within, single cells. Therefore, while mutual exclusion tightly maintains stemness in the QC/SCN, TR in columella cells—which, unlike slicing, is probably reversible (Bhattacharyya et al, 2006; Flynt & Lai, 2008)—conceivably enables flexible, rapid cell fate specification through dynamic control of the PLT1/2 (promoting stemness)‐versus‐GRF2/3 (promoting differentiation) ratio. This might continually adapt root cap properties, including the shedding magnitude of protective slough columella cells, under varying soil conditions. Collectively, these results illustrate how a single miRNA:target pair engages into fundamentally distinct regulatory circuits across directly contiguous cells of common origin, within the same cellular niche, to achieve a coordinated developmental outcome (Fig 4G).
Paralogous miRNA:target interactions enable exquisitely refined combinatorial gene regulation patterns
With no cell‐type‐specific miRNA targetome available in any organism/organ to date, whether—as is commonly assumed in plants and animals—paralogous miRNA expression diversifies/refines spatial gene regulation remains an open question. Encompassing 14 genetic loci, MIR169a‐n is the largest Arabidopsis MIRNA family, with four nucleotide sequence variants defined by miR169a, miR169b‐c, miR169d‐g, and miR169h‐n (Fig 5A). Their potential contribution to the root tip AGO1:miR169 landscape is depicted, with scale normalization, in Fig 5B (upper panels). MIR169a and MIR169d‐g spawn respectively moderate and low AGO1:miR169 signals that are homogeneously distributed across layers, possibly acting as global buffers. By contrast, strong MIR169h‐n and MIR169b‐c‐derived signals, contrasted across layers, are highest in the stele and inverted in intensity in the endo/cor/epi, which is better evidenced without normalization (Fig 5B, lower panels). miR169 targets seven of ten NUCLEAR FACTOR‐YA(NF‐YA) TF family members. miRNA: target interaction profiles were tentatively further deconvoluted by combining normalized signal intensities of each miR169 sequence variant with their base‐pairing strengths to four NF‐YA transcription factor mRNAs (NF‐YA2/3/5/9) .This was calculated with the plant‐specific psRNATarget algorithm (Dai & Zhao, 2011) excluding base‐pairing penalty scores > 3 (Fig 5C). This combinatorial approach could readily rationalize most of the distinctive cross‐layer translatome patterns typified by NF‐YA2/3/5/9 (Fig 5D). Although its experimental validation is currently beyond our technical abilities, the resulting deconvolution suggests a vast array of possible regulatory outcomes, especially since MIR169 paralogs might individually respond to distinct stress/developmental cues. Complexifying this picture further, the seven NF‐YA targets of miR169a‐n are among 36 related Arabidopsis TF subunits whose combinatorial interactions can theoretically form 1,690 distinct regulatory complexes (Siefers et al, 2009). While largely qualitative, these results provide compelling evidence that miRNA paralogs contribute an extraordinary degree of refinement/diversification to target gene regulation at the organ scale, which could equally apply to single miRNAs regulating many targets in metazoans.
Figure 5. Spatial deconvolution of miRNA‐mediated gene regulation.
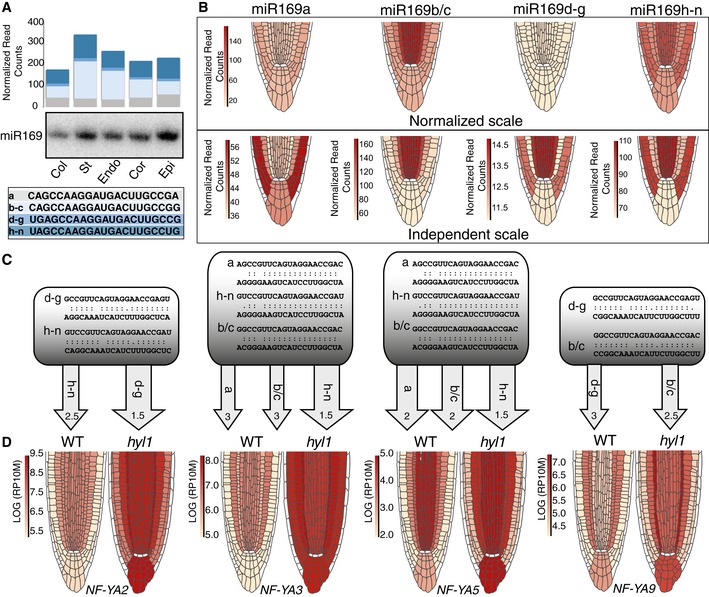
- Layer‐specific normalized read counts of miR169 paralogs (separated into 4 different groups based on sequence identity: a, b‐c, d–g, h–n) from AGO1‐IP‐deep‐seq and independent northern analysis, as in Fig 1F.
- Cell‐type‐specific AGO1‐IP signals for each miR169 sequence group with (upper panel) or without (lower panel) the miRoot scale normalization option.
- Predicted base‐pairing of indicated miR169 sequence group to four NF‐YA target transcripts. Pairing with expectation value > 3 was not considered. The color gradient (pale: low; dark: strong) qualitatively approximates the pairing contribution of each miR169 sequence group according to the upper panel of (B).
- miRoot snapshots of layer‐specific translatome signals of four out of seven miR169 NF‐YA targets in WT versus hyl1 backgrounds.
Source data are available online for this figure.
Non‐cell‐autonomous miRNA action under normal and stressed conditions
Circumstantial evidence suggests that some miRNAs might function non‐cell‐autonomously in plants (reviewed in Liu & Chen, 2018). Here, for instance, a st‐>endo‐>cor miR164a‐c gradient reported in Appendix Fig S11 might reflect differential layer‐intrinsic MIR164 transcription or, alternatively, movement of miR164a‐b‐c or longer precursors thereof. The term “pre/miR”, used here, infers possible mobility of either molecule; movement of AGO1:miRNA complexes is ruled out because GFP:AGO1 fusions are cell layer‐autonomous (Fig 1B and Appendix Fig S1). Neither pmiR164a::3xVENUS‐N7/pmiR164b::H2B:GFP nor pmiR164c::3xVENUS‐N7 yielded signals in the endo/cor, displaying, however, inversely correlated AGO1:miR164 versus NAC1/6 miR164 gradients (Appendix Fig S11). Advocating, therefore, pre/miR164 movement, this finding adds to only two documented instances of functional endogenous pre/miRNA cell‐to‐cell movement in Arabidopsis (Carlsbecker et al, 2010; Knauer et al, 2013). In one of these two cases, experiments conducted with an EMS‐induced miR165/166‐resistant version of PHB miR165 showed how a decreasing RNA‐turnover gradient spans the stele's outer‐to‐inner layers in a suggested miR165/166‐concentration‐dependent manner (Carlsbecker et al, 2010). pre/miR165/166 movement from the endodermis to the outer stele enables this process, important for xylem cell specification (Fig 6A; Carlsbecker et al, 2010). Promoter fusions and F::AGO1‐IP‐northern/deep‐sequencing analyses confirmed, but also extended, these results by showing that pre/miR165/166 radiates into all root tip layers (Fig 6A and Appendix Fig S13), readily rationalizing in situ hybridization signals unexplored in the Carlsbecker et al (2010) study. This wide‐ranging movement is functional because aggregated miR165/166 signals generate, in the col/endo/cor/epi, a mirror image of HD‐ZP‐III miR165 translatome signals, which, as expected from cognate miRNA regulation, is lost in hyl1 (Fig 6A and B, and Appendix Fig S13). A third original example of non‐cell‐autonomous regulation in root patterning discovered as part of the present study involves MIR160a/b/c and its target ARF17 miR160; it is described in Appendix Fig S14.
Figure 6. Non‐cell‐autonomous miRNA action.
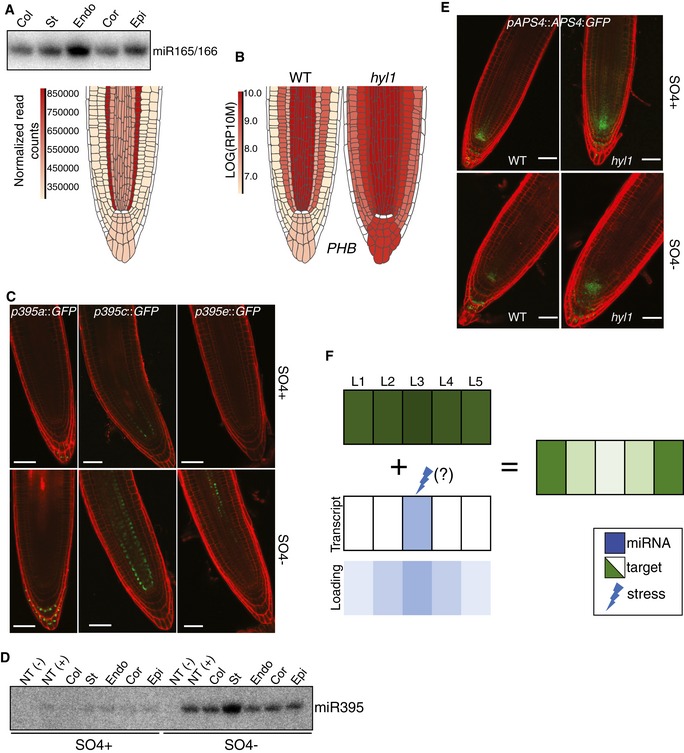
- Browser representation and independent northern analysis and AGO1‐loaded miR165/166.
- miRoot snapshot of PHB translatome signals in WT versus hyl1 backgrounds.
- Representative confocal images of pmiR395(a/c/e)::H2B:GFP transcriptional fusions under SO4−‐deficient or SO4−‐proficient growth conditions.
- Northern analysis of AGO1‐loaded miR395 under the conditions in (C).
- Representative confocal images of the pAPS4::APS4:GFP translational fusion under the conditions in (C).
- The principles of non‐cell‐autonomous miRNA‐mediated gene regulation within a whole organ.
Beside patterning, plant miRNAs facilitate cellular stress responses, premises under which pre/miRNA movement was also investigated. Limited sulfate (SO4−) availability in the soil strongly enhances MIR395a‐f transcription (Kawashima et al, 2009). This, in turn, lowers the steady‐state levels of APS1 miR395 /APS3 miR395 /APS4 miR395‐encoded ATP sulfurylases(APS) and of the sulfur transporter SULTR2;1 mRNA. These collectively catalyze sulfate activation, ultimately enabling organic compound–sulfur conjugation (Kawashima et al, 2009). The ensuing starvation/miR395‐mediated increase in free‐SO4− is systemically distributed via the vasculature, possibly rationalizing the vascular‐restricted MIR395 transcription in the shoot (Kawashima et al, 2009). In SO4−‐starved root tips, only the pmiR395a::H2B:GFP, pmiR395c::H2B:GFP, and pmiR395e::H2B:GFP transcriptional fusions yield detectable signals in the pericycle/inner stele for MIR395c/e, and distal columella for MIR395a; SO4− sufficiency generates similar signals, except for miR395e, which was below detection (Fig 6C). In northern analysis, a strongly enhanced stele‐derived AGO1:miR395 signal in SO4−‐starved roots expands to all adjacent files (Fig 6D). Starvation does not alter AGO1 cell autonomy (Appendix Fig S15) implying, therefore, pre/miR395 movement.
Restricted to the QC/SCN and columella of starved WT roots, the pAPS4::APS4:GFP signal was detected in all initials and newly emerging col/st/endo/cor/epi cell files in hyl1, strongly suggesting that mobile pre/miR395a is functional (Fig 6E). A faint, yet widespread AGO1:miR395 hybridization signal (also seen in AGO1‐IP‐sequencing results) in SO4−‐sufficient root tips suggests a role for pre/miR395 mobility also during unstressed growth (Fig 6D; Appendix Table S2). pre/miR395 movement likely regulates the normal root tip SO4− homeostasis because APS1 miR395, APS4 miR395, and SULTR2;1 miR395 translatome signals were significantly increased in all layers of hyl1 versus WT SO4−‐sufficient root tips (Appendix Fig S16). Accordingly, the WT pAPS4::APS4:GFP signal, restricted to the QC/SCN and distal columella, was detected in all hyl1 initials and newly emerging cell files (Fig 6E). It was also longitudinally extended compared to that of SO4−‐starved roots, likely reflecting the much lower miR395 accumulation levels under unstressed conditions. Therefore, enhancing pre/miR395 movement, a normal feature of the root tip physiology, likely helps increasing the free SO4− pool during starvation. A scheme illustrating gradients or boundaries of gene expression created by mobile miRNAs across contiguous cell layers, under native or stress conditions, is shown in Fig 6F.
Mature miR395 moves from cell‐to‐cell
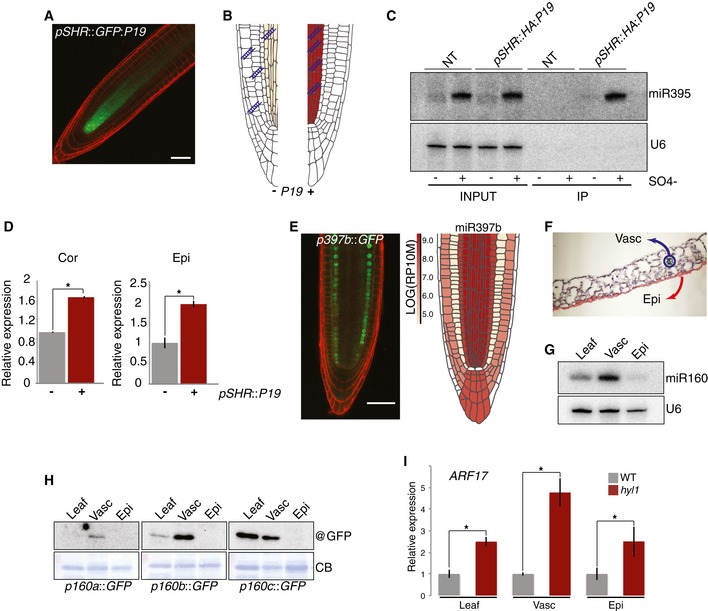
To explore which mobile entity (pre/miRNA) underlies miR395 action in stele‐distal layers, we expressed, under the SHR(st) or WER(epi) promoters, HA‐epitope/GFP‐tagged alleles of the tombusvirus P19 silencing suppressor. P19 selectively binds 21‐nt si/miRNA duplexes, unlike single‐stranded sRNA, longer (>24‐nt) dsRNA, or DNA (Fig 7A and B; Ye et al 2003). The resulting stele and epidermis confinement of GFP indicated the protein's cell autonomy (Fig 7A and Appendix Fig S17). Under SO4−‐sufficient conditions, stele‐derived miR395 duplexes were readily detected in WER(epi)‐specific HA:P19‐IPs, directly demonstrating movement of mature miR395 and/or pri/pre‐miR395 subsequently processed in recipient cells (Appendix Fig S17). Other pre/miRNAs identified here as extensively mobile (miR165/166, miR160) were also detected in WER(epi)‐specific HA:P19‐IPs (Appendix Fig S17). To address the issues of the movement of and functionality of mobile miR395, SHR::HA:P19 plants were crossed to the WER::F:RPL18 or CO2::F:RPL18 lines used for translatome analyses. In both SO4−‐starved and SO4−‐sufficient conditions, miR395 was IPed with SHR::HA:P19, albeit substantially more, as expected, under starvation (Fig 7C and Appendix Fig S18). Under SO4− sufficiency, APS4 miR395 translatome signals were indeed consistently twofold higher in the cor/epi of SHR::HA:P19 containing lines, compared to their uncrossed counterparts (Fig 7D). This P19 barrier effect was unapparent under SO4− starvation due, presumably, to saturating stele‐derived miR395 levels overcoming the P19 binding capacity. We conclude that movement of mature miR395 duplexes contributes to functional target regulation over at least three distinct root tip layers.
Figure 7. Mechanisms and examples of miRNA movement in different tissue types.
-
A,B(A) Representative confocal image of the pSHR::GFP:P19 translational fusion and (B) principle of P19‐based miRNA duplex sequestration.
-
CBinding of miR395 by SHR::HA:P19 under SO4−‐sufficient (+) and SO4−‐deficient (−) growth conditions.
-
DqRT–PCR analysis of polysome‐associated APS4 in the cortex or epidermis in the presence (+) or absence (−) of SHR::HA:P19. Signals are relative to SHR::HA:P19 (−) lines given a value of 1.
-
ERepresentative confocal image of the pmiR397b::H2B:GFP transcriptional fusion (left) and the browser AGO1‐loaded signal for miR397b (right).
-
FCross section of Arabidopsis leaf showing cell types isolated via Meselect.
-
GmiR160 northern analysis in whole leaf, vasculature, and epidermis. U6: loading control.
-
HWestern analysis of the promoter::H2B:GFP translational fusions shown in (5C) in the cell types isolated in (G).
-
IqRT–PCR analysis of ARF17 in whole leaves or in separated cell types in WT versus hyl1 backgrounds.
Evacuation‐filling of pri/pre‐miRNAs
Northern analyses of layer‐specific F:AGO1‐IPed sRNAs show that miRNA gradients occur commonly in the root tip (Appendix Fig S2). Caution should be exerted, however, in interpreting these patterns. Northern/deep‐sequencing analyses suggest, for instance, that an outward AGO1:miR163 gradient is generated from the endodermis, possibly because MIR163 transcription prevailing in this layer enables pre/miR163 movement in the others (Fig 1F). The pmiR163::H2B:mCHERRY signal is columella/lateral root cap‐specific, however (Appendix Fig S19). Unlike most pri‐miRNAs, pri‐miR163 efficiently associates with polysomes and, consistent with the strong pri‐miR163 promoter activity, significant translatome signals were detected in columella polysomes of hyl1 (Appendix Fig S19). The root cap MIR163 transcription thus likely constitutes a pre/miR163 reservoir continually depleted to fill the distant endodermis, possibly via lateral root cap–epidermis connections (Bennett & Scheres, 2010; Vragović et al, 2015; Xuan et al, 2016). Noteworthy, the pri‐miR163 translatome signal prevailing in the hyl1 columella is also strong in the cor/endo/st (Appendix Fig S19), suggesting, in this case, pri/pre‐miR163 movement into these layers, at least under miRNA processing‐defective conditions. This previously uncharacterized pri/pre‐miRNA evacuation‐filling phenomenon is neither miR163‐restricted nor col‐endo‐specific. Indeed, deep‐sequencing analyses revealed a sharp AGO1:miR397b‐loading deficit in the cortex and respectively strong and moderate signals in surrounding endo/st/col and epi (Fig 7E). Strikingly, the pmiR397b::H2B:GFP transcriptional signal is strictly cortex‐restricted, thus also identifying this layer as a reservoir of mobile pre/miR397b whose evacuation‐filling must therefore underlie the LAC4 miR397 accumulation pattern in the root tip (Appendix Fig S10, right). Collectively, these results uncover a novel, non‐cell‐autonomous gene regulation process that could not have been deciphered without comparative miRNAome–targetome analysis at single cell‐type resolution.
pri/pre‐miRNA cell‐to‐cell movement is not exclusive to the root tip or the root
Extensive connections between meristematic cells are possibly facilitated by their unusually thin cell walls and enlarged plasmodesmata (Roberts et al, 1997). The root tip and shoot apical meristem—the only two domains associated so far with this process—might thus provide exceptional grounds for pre/miRNA cell‐to‐cell movement. To address this issue, leaves of pmiR160a‐c::H2B:GFP promoter fusion plants were subjected to Meselect (Svozil et al, 2016), which separates the vasculature from the lower epidermis (Fig 7F). As with the root tip data (Appendix Fig S14), the three transcriptional fusions consistently yielded vascular, but not epidermal, GFP signals yet mature miR160 was detected in both tissues, implying pre/miR160 multi‐layer movement (Fig 7G and H, and Appendix Fig S20). pre/miR160 movement was functional because ARF17 miR160 levels were respectively ~5‐fold and 2.5‐fold higher in the hyl1 versus WT vasculature and epidermis (Fig 7I). Recapitulating the extensive root tip pre/miR160 movement in a fully developed aerial organ therefore suggests that cell‐to‐cell movement is intrinsic to at least some miRNAs regardless of developmental stage, cell or tissue type.
Discussion
A unique dual miRNAome–targetome approach
Using the Arabidopsis root tip as a paradigm, we have shown here that global miRNA activities can be deconvoluted at single‐cell‐type resolution from within a whole, complex organ and with minimal invasiveness. Because (i) anti‐AGO antibodies or epitope‐tagged versions thereof are available in several model organisms, (ii) RPL18 is a universal ribosome component, and (iii) cell‐type‐specific promoters are known in many organisms, the dual approach described here should be applicable to a variety of model systems beyond plants. In animals, one challenge might be the viability of generic miRNA pathway mutants akin to hyl1 used here. However, conditional knockdown/knockout exists including, for instance, a thermo‐sensitive Pasha mutant in C. elegans (Lehrbach et al, 2012). The second challenge is posed by the relaxed miRNA:target pairing and relatively modest changes in target mRNA accumulation caused by miRNA activities in metazoans. That being said, neither are unsurmountable in principle.
While the combined miRNAome–targetome approach described here is unprecedented in plants and metazoans, the acquisition of tissue‐ or cell‐specific miRNA repertoires has been reported in some of these organisms. Recent work in C. Elegans shows an interesting alternative to AGO‐IP using methylation‐dependent miRNA sequencing or “mime‐seq”. Mime‐seq relies on cell‐ or tissue‐specific expression of Arabidopsis HEN1—which 2′‐O methylates all plant small RNAs—thus enabling in vivo labeling of animal miRNAs, normally devoid of this modification. Chemoselective small RNA cloning and high‐throughput sequencing then allow tissue‐specific miRNAome acquisition (Alberti et al, 2018). In Arabidopsis, a major effort toward elucidation of the root miRNAome was conducted by the Benfey Lab using cell‐specific marker lines subjected to protoplasting and subsequent FACS (Breakfield et al, 2012). The approach had merit in encompassing both radial (i.e., cell‐type‐specific) and longitudinal (i.e., developmental‐stage‐specific) dimensions, unlike the present analysis, which is restricted to the former. Nonetheless, Breakfield et al (2012) conceded themselves that protoplastization resulted in substantial amounts of stress‐induced small RNAs and tRNA fragments confounding the deep‐sequencing output. Additionally, total small RNA—including, therefore, abundant transposon‐derived 24‐nt siRNAs and, to a lesser extent, DCL4‐dependent young miRNAs—was analyzed in the Breakfield et al (2012) study as opposed to exclusively loaded, DCL1‐dependent miRNAs here.
While the acquisition of cell‐type targetomes, in addition to miRNAomes, is a clear asset of the method described in this study, it does not come without compromises or potential caveats. For instance, the miRNA‐deficient hyl1 background, selected for its relatively unchanged root growth to conduct the RPL18 IP analyses, is pleiotropic and, as such, is a potential source of unwanted secondary effects. Possibly mitigating this issue, however, is the observation that a single mutation in AUXIN RESPONSE FACTOR 8 (ARF8), the target of miR167, rescues the pleiotropic phenotypes and viability of strong dcl1 mutant alleles (Katiyar‐Agarwal et al, 2007). Thus, the resembling aberrant phenotype of miRNA‐deficient Arabidopsis mutants, hyl1 included, might reflect ectopic accumulation of only a handful of miRNA target transcripts. Avoiding AGO1‐intrinsic feedback regulation also imposed the use of the siRNA‐deficient dcl2/3/4 background, yet its possible impact on miRNAomes—which we assume to be limited—was not thoroughly assessed especially under stress conditions known to engage de novo siRNA production in a DCL2/3/4‐dependent manner (Borsani et al, 2005; Katiyar‐Agarwal et al, 2007).
Our method also has some room for improvement. For instance, the QC, made of only a few stem cells not specifically studied here, will deserve attention in future studies, as will individual layers of the stele, which, despite being identified as the most abundant sources of root tip miRNAs, are not distinctively resolved by the generic SHR promoter. Future studies would undoubtedly also benefit from complementary cell layer analyses in the EZ/DZ, thereby adding a temporal to the spatial dimension investigated here. Additionally, ribosome foot‐printing could illuminate the contribution of slicing versus TR to individual miRNA:target interactions, likely broadening the findings made here with miR396a and GRF2/GRF3 (Fig 4).
The Arabidopsis root tip as a paradigm for functional miRNA studies within and between single cell‐types
The Arabidopsis root tip is commonly viewed as a group of actively dividing cells collectively contributing to a meristem. Adding to those of previous transcriptome, genetic, and cell biological studies (Brady et al, 2007; Mustroph et al, 2009), our results underscore how unique and sophisticated genetic programs characterize each nascent cell file and that miRNAs are integral components of these programs. The study further illustrates how the refinement and versatility granted by miRNAs enable potent coordination of gene expression not only within but also between five cell layers over a ~150 μm radius. The columella gene expression landscape was the most altered under miRNA‐deficient conditions, possibly reflecting this layer's unique enrichment in stem cells continuously shed and replaced upon their rapid differentiation.
The initial constraint posed by the use of siRNA‐deficient dcl2/3/4 roots for miRNAome analyses became, in retrospect, an asset when combined with cell‐specific AGO1‐IPs, by increasing the current estimate of Arabidopsis MIRNA loci by ~60%. The corresponding miRNAs are often loaded into AGO1 at low‐to‐moderate levels possibly denoting their evolutionary transience. Compared to the elaboration of TFs and matching cis‐regulatory elements, the birth of MIRNA genes from “to‐be” target gene sequences (Allen et al, 2004) requires minimal investments, a cost‐effective solution to the sampling of many possible gene regulation patterns including—perhaps primarily—during cell fate determination. Some low‐expressed MIRNA loci have been possibly fixed, but their functions might be only visible under conditions not recapitulated in the laboratory. Stress applications on the suite of layer‐specific GFP::AGO1 transgenic lines now available to the community should address this issue and, perhaps, uncover other as yet unanticipated modes of miRNA‐mediated gene regulation.
Our results demonstrate that cell‐to‐cell movement is possibly a common feature of miRNA‐mediated gene regulation in Arabidopsis. We conclude from our study that movement is diversified in its spatial manifestations and functions, may originate from any layer in both inward and outward directions, and potentially involves multiple forms of these molecules (e.g., mature/pri/pre‐miRNA). While clear benefits of mobility include the generation of expression gradients, it is hard to reconcile passive diffusion—a postulated mode of siRNA movement via plasmodesmata—with the precise effects of cell‐fate‐determining molecules acting through gene expression gradients. The unique evacuation‐filling phenomenon, in particular (Fig 7D), suggests that active, complex transport processes might be involved. Complicating this issue further, some miRNA target transcripts also likely move between cells, as suggested by spatial discrepancies—not investigated further here—observed between signals of transcriptional and translational reporter–gene fusions of various targets in hyl1, including that of APS4 miR395 among the most striking (Fig 6E and Appendix Fig S21). mRNA cell‐to‐cell movement is not unprecedented (Kim et al, 2005), and grafting experiments suggest a long‐distance component to this process (Thieme et al, 2015). The implementation of a non‐invasive, exhaustive map of mRNA cell‐to‐cell movement in the root tip, in complement to the miRoot interface, would thus improve our understanding of the complex spatial gene regulation patterns uncovered here. Meanwhile and although relaxed miRNA:target pairing constitutes an additional challenge in these organisms, the novel approaches developed in this study provide a proof of concept that similar investigations can be conducted in metazoans.
Materials and Methods
Plant material and growth conditions
Unless otherwise stated, all plant material was in the Columbia (Col‐0) Arabidopsis background. The dcl2‐1/dcl3‐1/dcl4‐2, hyl1‐2, abh1‐285, se‐1, and dcl1‐11 mutant lines were described previously (Prigge & Wagner, 2001; Vazquez et al, 2004; Deleris et al, 2006; Laubinger et al, 2008; Zhang et al, 2008). For all experiments involving root isolation, plants were grown vertically on 1/2 MS media covered in mesh (Sefar Nitex 03‐65125) under long daylight conditions at 22°C. Cell‐type‐specific promoters were PCR‐amplified either from genomic DNA of Col‐0 (pACR4, pCO2, and pWER) or from plasmid templates kindly provided by Dr. Eric van der Graaff and Prof. Thomas Laux (pSHR and pSCR). Promoter sequences were amplified using the primers listed in Table S6 and recombined into the Gateway vector pDONR4‐1r. Clones were sequenced for authenticity and were used to generate cell‐type‐specific specific expression of both AGO1 and a subset of RPL18 lines.
The FLAG:AGO1 sequence was removed from the FLAG:AGO1 vector in pGreen by digesting with XhoI and SpeI and subcloning into pJLBlue. The subsequent entry clones (containing cell‐type‐specific promoters or FLAG:AGO1) were recombined into the destination vector pB7m24GW (Invitrogen). The resulting binary vectors were mobilized in the Agrobacterium strains GV3101 or AGL0 and transformed into either WT or dcl234 mutant lines via the floral dip method (Clough & Bent, 1998). T1 plants were selected in soil using BASTA. T2 plants were assessed for single‐copy insertions via a 3:1 segregation ratio and propagated to the T3 generation for further analysis. N‐terminal GFP‐tagged AGO1 lines were generated by recombining a cell‐type‐specific clones with the entry vector pDONR P2R‐P3 containing an N‐terminal‐specific GFP minus STOP codon and the coding region of AGO1 (in pDONR221) into the destination vector pB7m34GW. Plants were screened for single insertion prior to further experimentation.
The p35S::HF:RPL18, pSCR::HF:RPL18, and pCO2::HF:RPL18 lines were a kind gift from Prof. Julia Bailey‐Serres and have been described previously (Mustroph et al, 2009). The other complementary set of cell‐type‐specific RPL18 lines were generated as follows. The promoter sequences pACR4 and pWER were amplified from the entry clones described above (pDONR4‐1r clones) with the primers listed in Appendix Table S1 (pACR4‐1‐2F, pACR4‐1‐2R, pWER‐1‐2‐F, and pWER‐1‐2‐R) for recombination into the pDONR221 vector (Gateway technologies). The corresponding cell‐type‐specific RPL18 lines were generated by recombining the promoter ENTRY vectors in the destination vector pGATA:HF‐RPL18 (a kind grift from Prof. Julia Bailey‐Serres). Due to problems crossing the pSHR:HF‐RPL18 line, the line was re‐generated using a slightly different technique as follows. The HF‐RPL18 sequence was amplified from the pGATA:HF‐RPL18 vector using the oligonucleotides HFRPL18‐1‐F and HFRPL18‐2‐R and recombined into pDONR221. The resulting clone, in combination with the pSHR clone, was recombined into the destination vector pB7m24GW (Invitrogen). All binary vectors were transferred into the Agrobacterium strain GV3101 and transformed into Col‐0. First‐generation transformants were selected on either Kanamycin or BASTA and screened for single‐copy insertions in the T2 generation. Single‐copy T3 homozygous lines were crossed to hyl1‐2 and selected as double homozygous lines in the F3 generation either by phenotype (hyl1‐2), by BASTA resistance, or by genotyping. Promoter fusion lines (transcriptional fusions) of all protein‐coding genes were generated by amplifying 2–2.5 kb of sequence upstream of the ATG using the oligonucleotides listed in Appendix Table S1 with Phusion polymerase (Thermo Scientific). All promoters were cloned either by recombining into pDONR P4‐P1r or by restriction digestion into modified version containing a multiple cloning site using appropriate restriction enzymes listed in the sequences of Appendix Table S6. Promoters, H2B (pDONR221) and eGFP or mCherry (pDONR P2R‐P3), were recombined into pB7m34GW. Translational fusions were generated by cloning the full genomic DNA CDS into pDONR221 minus a STOP codon, using the primers listed in Appendix Table S6, and recombining into pB7m34GW in combination with the cognate promoter and GFP at the 3′ end.
Isolation of vasculature and epidermal cells from mature leaves (Meselect)
Meselect was performed essentially as described in Svozil et al (2016). Briefly, leaves were placed in a “tape sandwich”, and the lower epidermis was separated by peeling away from the vasculature and upper part of the leaf. Both pieces of tape were incubated in protoplasting solution (1% cellulase Onozuka RS (Yakult, Japan), 0.4 M mannitol, 10 mM CaCl2, 20 mM KCl, 0.1% BSA, and 20 mM MES, pH 5.7) on a rocking platform at 50 rpm. The epidermal side was incubated for 15 min and the vasculature for 20–30 min. After the appropriate time, they were washed twice with washing buffer (154 mM NaCl, 125 mM CaCl2, 5 mM KCl, 5 mM glucose, and 2 mM MES, pH 5.7). After washing, the epidermal tape was frozen in liquid nitrogen, and the vasculature was removed from the tape with forceps and also frozen. RNA and protein extractions were performed as described below.
Immunoprecipitation of cell‐type‐specific AGO1
6‐day‐old Arabidopsis roots from AGO1 lines or non‐transformed positive or negative controls were ground in liquid nitrogen, and cells were lysed in IP buffer (~3 vol/1 weight; 50 mM Tris–HCL, pH7.5, 150 mM NaCL, 10% glycerol, 0.1% NP40) containing 2 μM MG‐132 and one tablet/10 ml complete protease inhibitor cocktail (Roche) on ice for ~10 min with intermittent mixing by inversion. All subsequent steps were performed at 4°C. Centrifugation twice at 14 000 g for 10 min was performed to remove cell debris. Cleared lysates were normalized for protein concentration by using a modified Lowry procedure with the DC™ Protein Assay Kit (Bio‐Rad). After normalization, lysates were pre‐cleared with 20 μl of protein A agarose beads (Roche) for 1 h on a rotating wheel. For the input fractions, 10% of the cleared lysate was removed prior to proceeding with immunoprecipitation. With the exception of the positive control for total root AGO1, pre‐cleared lysates were subsequently incubated with EZview™ Red ANTI‐FLAG M2 Affinity Gel (Sigma) beads for 2–3 h on a rotating wheel. For total AGO1, the lysate was incubated for 1–2 h with an anti‐AGO1 antibody (Agrisera AS09 527) at a 1/1,000 dilution followed by the addition of 20 μl of protein A agarose beads (Roche) and incubated for 1 h again with rotation. Agarose bead conjugates were subsequently washed 3 times for 10 min each with IP buffer. Beads were then pelleted, and AGO1 immunoprecipitates and input samples were subjected to RNA extraction using TRIzol reagent (Life Technologies) following the manufacturer's instructions. Proteins were extracted from the organic phase by the addition of 3 volumes of acetate, overnight incubation at −20°C followed by centrifugation at 12,000 rpm for 10 min and washing with 80% acetone.
For the experiment depicted in Fig 1D confirming that no miRNAs were loaded post‐lysis, immunoprecipitation was essentially performed as described above with several minor adjustments. Roots from pAGO1::F:AGO1 (Baumberger & Baulcombe, 2005) were ground in liquid nitrogen and lysed as described above. After clearing the lysate and normalizing the protein concentrations, an annealed siRNA consisting of the RNA oligonucleotide siRNA guide (5′ UAGUUCAUCCAUGCCAUGUGU 3′) and siRNA passenger (5′ ACAUGGCAUGGAUGAACUAUA 3′) was added and the immunoprecipitation carried out as previously described. After transfer to a nitrocellulose membrane, the blot was probed with an oligonucleotide complementary to the guide strand of the siRNA duplex.
Immunoprecipitation of cell‐type‐specific RPL18 complexes
Constitutively expressed or cell‐type‐specific RPL18 complexes were immunoprecipitated essentially as described in Mustroph et al, 2009;. Briefly, 6‐day‐old roots grown on MS media covered by mesh were harvested and ground to a fine powder in liquid nitrogen and lysed for ~10 min in polysome extraction buffer (200 mM Tris–HCl pH9, 200 mM KCL, 25 mM EGTA, 35 mM MgCl2, 1% PTE, 1% Brij‐35, 1% Triton X‐100, 1% Igepal CA630, 1% Tween‐20, 5 mM DTT, 50 μg/ml cycloheximide, 50 μg/ml chloramphenicol, and 2 tablet/50 ml complete protease inhibitor cocktail). Lysates were centrifuged at 16 000 g for 15 min at 4°C and subsequently filtered through Miracloth. Centrifugation was repeated, and samples were normalized by measuring OD260. Input samples were obtained by saving 10% of the lysate prior to immunoprecipitation. All subsequent steps were performed at 4°C. Samples were pre‐cleared with protein A agarose beads (Roche) for 1 hr and subsequently incubated with EZview™ Red ANTI‐FLAG M2 Affinity Gel (Sigma) beads for 2–3 h both with rotation. Epitope‐tagged ribosomes were washed once with polysome extraction buffer and three subsequent times with a wash buffer identical to the extraction buffer but omitting the detergents and PTE. Complexes were eluted from the beads using 3xFLAG peptide at a concentration of 200 ng/μl in wash buffer for 30 min with agitation at 4°C. RNA from input and immunoprecipitated complexes was extracted using 1 volume of phenol:chloroform, and ethanol sodium acetate was precipitated.
Small RNA sequencing
AGO1‐bound RNA (10 μl, 20 ng/μl), extracted using TRIzol reagent (Invitrogen), was processed into sequencing libraries using adapted Illumina protocols and sequenced at Fasteris (http://www.fasteris.com, Switzerland) using the Illumina HiSeq sequencer. These deep‐sequencing files were deposited to the NCBI Gene Expression Omnibus (GEO) under accession number GSE104115.
RNA sequencing
RNA from polysome IP was sequenced at Fasteris (http://www.fasteris.com, Switzerland). RNA was isolated as described above in polysome immunoprecipitation. Ribosomal depletion and random hexamer paired‐end (2 × 300‐bp) stranded RNA sequencing were applied. Raw data are available from NCBI GEO under accession number GSE104116.
Bioinformatic analysis
sRNA sequencing data processing
De‐multiplexing and adapter removal were done by Fasteris. 15‐to‐44‐nt reads with identical sequences were grouped using the processReads function from the ncPRO‐seq pipeline (Chen et al, 2012) and aligned against A. thaliana genome (TAIR10) using Bowtie (Langmead & Salzberg, 2012). Annotation was done by genomic positions’ comparison of small RNA sequences using the TAIR10, miRBase(v21), and A.th repeat‐masker databases. For small RNAs with multiple genomic locations, an annotation was attributed based on a priority order. 20‐ to 24‐nt‐long reads whose genomic position was nested in mature miRNA annotation enlarged by 2nt upstream and downstream were counted. These values were then normalized by library size as well as by the number of genomic position of each sRNA sequence. Mature miRNAs with a normalized read count of at least 50 in at least one library were used to generate the heatmap presented in Fig 1E. The heatmap was constructed using the heatmap2 function from the gplot R package. miRNA in the heatmap is shown as hierarchically clustered based on the Pearson correlation of the log‐normalized read count +1 and complete aggregation algorithm. As miRNAs differ substantially in their abundance and given that we wanted to compare their differential accumulation between cell layers, the color gradient was scaled by rows while no clustering was applied to the columns.
Predictions of novel miRNA were done using miRPlant v5 (An et al, 2014) with the following parameters: stem–loop length, 300 bp; min number of reads, 10; and read length, 20–22 nt. Only predictions with a score of at least 1 were considered while predictions overlapping known miRNA precursors (miRBase V21) were discarded. Annotation of predicted miRNA was done by comparing genomic positions against TAIR10 annotations. If several overlaps were found, the annotation was attributed following a priority order as follows: tRNA, snRNA, snoRNA, TE, pseudogene, intron, exon. Conservation in Arabidopsis lyrata was assessed by BLAST (default parameters) of the predicted stem–loop sequences against the Arabidopsis lyrata genome (assembly GCA_000004255.1). Stem–loop sequences with length alignments matching at least 80% of the total predicted stem‐loop length were considered conserved.
mRNA sequencing data processing
Reads were trimmed and clipped using FASTX‐Toolkit (fastx_trimmer options: ‐f 11 –l 121; fastx_clipper options –a AGATCGGAAGAGC). Remaining pairs were then aligned onto the Arabidopsis thaliana TAIR10 Ensembl genome and gene annotation (http://ccb.jhu.edu/software/tophat/igenomes.shtml) using TopHat (v2.0.11) (Kim et al, 2013) and Bowtie (v2.2.1.0) (Langmead & Salzberg, 2012). Counts for annotated genes (Ensembl TAIR10) were generated using the featureCounts function from the Subread package (Liao et al, 2014) with options ‐s ‐p ‐O –M. Given that miRNA genes annotations correspond mostly to the stem–loop sequences, TAIR10 miRNA gene annotations were enlarged by 100bp upstream and downstream before applying featureCount. Differential analysis was performed using EdgeR (v3.14.0, Robinson et al, 2010) considering only genes with cpm (counts per million) higher than 0 in at least 2 samples. Genes with a FDR bellow 5% were considered differentially expressed. Results of the differential analysis are provided in Dataset EV2.
The heatmap presented in Fig 2C represents hierarchical clustering of RNA‐seq read count from validated miRNA targets for each cell layer in WT and hyl1 mutant. It was constructed using the heatmap2 function from the gplot R package. The numbers of features reported by featureCount were used for library size normalization (reads per 10 millions reads). Then, the means of 2 replicates were used for clustering and only genes with a normalized value of at least 50 in at least one sample were presented. The clustering is based on the Pearson correlation of the log‐normalized reads count +1 and complete aggregation algorithm; the color gradient is scaled by rows.
RNA gel blot analysis
Total RNA was extracted from snap‐frozen root tissue by grinding in liquid nitrogen with a mortar and pestle using TRIzol (Invitrogen) following the manufacturer's instructions. Total or immunoprecipitated RNA was separated on 17.5% polyacrylamide–urea‐denaturing gels, and transferred to Hybond‐NX nitrocellulose membranes (GE Healthcare), and cross‐linked via 1‐ethyl‐3‐(3‐dimethylaminopropyl) carbodiimide‐mediated chemical cross‐linking, as previously described (Pall & Hamilton, 2008). Oligonucleotides used as probes were complements of the respective miRNA sequences and were end‐labeled using T4 PNK (Thermo Scientific) with [γ‐32P] dATP. The sequences of all probes are listed in Appendix Table S6.
Real‐time qRT–PCR analysis
Total (input) or polysome‐immunoprecipitated RNA was treated with DNaseI (Thermo Fisher) and reverse‐transcribed using Maxima Reverse Transcriptase (Thermo Fisher) according to the manufacturer's instructions. Real‐time quantitative reverse transcriptase PCR (RT–qPCR) was performed using the LightCycler 480 II (Roche) with KAPA SYBR® 480 qPCR Kit (KAPA Biosystems) using gene‐specific primers listed in Appendix Table S1. PCR was carried out technical triplicates using the following cycling conditions: 95°C for 3 min, followed by 45 cycles of denaturation at 95°C for 10 s, annealing at 60°C for 20 s, and elongation at 72°C for 20 s. A melting curve was generated at the end of the amplification in every run to confirm primer specificity. Threshold cycle (C t) values were determined by calculating the second‐derivative maximum of three technical triplicates for each sample. 1‐tailed t‐tests were used.
Western blot analysis
Total protein was extracted via lysis during immunoprecipitation experiments or by grinding in liquid nitrogen and resuspending in two volumes of RIPA buffer (50 mM Tris, 150 mM NaCl, 1% NP‐40, 0.5% sodium deoxycholate, 0.1% sodium dodecyl sulfate [pH 7.5]) containing Roche complete protease inhibitors. Extracts were cleared by centrifugation at 13K for 10 min at 4°C. Protein concentrations were normalized using a modified Lowry procedure with the DC™ Protein Assay Kit (Bio‐Rad). Proteins were resolved on SDS–PAGE and electro‐transferred to Immobilon‐P PVDF membranes (Millipore) after blocking for 30 min in 1× PBS + 0.1% Tween‐20 supplemented with 5% skim milk powder, with subsequent antibody incubations carried out overnight at 4°C in the same solution. Primary anti‐AGO1 (Agrisera AS09 527) and anti‐GFP (Chromotek 3H9) antibodies were diluted 1/8,000 and 1/5,000, respectively, with HRP‐conjugated FLAG (Sigma A8592‐1MG) or HA (Sigma H6533‐1VL) antibodies diluted both to 1/5000. Membranes were washed four times in 1× PBS + 0.1% Tween‐20, and then if necessary incubated for 1hr at RT with horseradish peroxidase‐conjugated goat anti‐rabbit (Abcam, ab6721) or goat anti‐rat (Cell Signaling, 7077S). After washing again four times in 1× PBS + 0.1% Tween‐20, detection was performed using the ECL Western Blotting Detection Kit (GE Healthcare) and revealed either by exposing to film or using the ChemiDoc™ Touch Imaging System (Bio‐Rad). Membranes were stained with Coomassie blue to confirm equal loading.
Live cell imaging
Fluorescent transcriptional or translational fusion‐expressing roots were imaged under a Zeiss 780 confocal microscope immediately after excision from growing plants. The images shown in all figures are representative of consistent results obtained in multiple independent experiments using multiple independent transgenic lines.
MiRoot browser
For intuitive exploration of the dataset, we developed the miRoot Web interface (https://www.miroot.ethz.ch), which allows the user to choose between the datasets and select for the gene or microRNA of interest to display its expression values in the different root cell types.
The tool was developed on a LAMP system (Linux, Apache, MySQL, PHP) making use of jQuery1, jQuery UI2, D3—Data‐Driven Documents3, and TOAST—The no‐nonsense CSS grid4. The template SVG root images were created by Gaia Codoni.
The separate tutorial that explains the usage in detail is available on the web site.
JQuery—https://jquery.com/
JQuery UI—https://jqueryui.com/
D3—Data‐Driven Documents—https://d3js.org/
TOAST—The no‐nonsense CSS grid—https://daneden.github.io/Toast/
Author contributions
CAB and OV conceived the study; CAB and PL performed all experiments; NGB contributed biological material; AS performed the bioinformatic analysis; MH‐H implemented the miRoot Web interface; CAB and OV analyzed the data and wrote the manuscript.
Conflict of interest
The authors declare that they have no conflict of interest.
Supporting information
Appendix
Dataset EV1
Dataset EV2
Source Data for Appendix
Review Process File
Source Data for Figure 1
Source Data for Figure 4
Source Data for Figure 5
Source Data for Figure 6
Source Data for Figure 7
Acknowledgements
We thank members of the Voinnet Lab for their valuable input and discussions. We thank A. Imboden for assistance in plant growth and the ETH‐Z ScopeM platform, E. Meyerowitz for providing the miR164a and miR164c promoter fusions, J. Palatnik for the GRF3 and rGRF3 translational fusions, J. Bailey‐Serres for the RPL18 lines, and Gaia Codoni for assistance with the initial image work for miRoot. CAB was supported by an EMBO long‐term fellowship (ALTF 728‐2009). Work was supported by a European Research Council Advanced Grant (Frontiers in RNAi‐II No. 323071) and a grant from the Swiss National Foundation (No. 310030B_152832) both attributed to O.V.
The EMBO Journal (2019) 38: e100754
Contributor Information
Christopher Andrew Brosnan, Email: c.brosnan@uq.edu.au.
Olivier Voinnet, Email: voinneto@ethz.ch.
Data availability
Scripts and commands used for the processing of the sequencing data are available upon request.
References
- Alberti C, Manzenreither RA, Sowemimo I, Burkard TR, Wang J, Mahofsky K, Ameres SL, Cochella L (2018) Cell‐type specific sequencing of microRNAs from complex animal tissues. Nat Methods 15: 283–289 [DOI] [PMC free article] [PubMed] [Google Scholar]
- Allen E, Xie Z, Gustafson AM, Sung G‐H, Spatafora JW, Carrington JC (2004) Evolution of microRNA genes by inverted duplication of target gene sequences in Arabidopsis thaliana . Nat Genet 36: 1282–1290 [DOI] [PubMed] [Google Scholar]
- An J, Lai J, Sajjanhar A, Lehman ML, Nelson CC (2014) miRPlant: an integrated tool for identification of plant miRNA from RNA sequencing data. BMC Bioinformatics 15: 275 [DOI] [PMC free article] [PubMed] [Google Scholar]
- Arribas‐Hernández L, Kielpinski LJ, Brodersen P (2016) mRNA decay of most Arabidopsis miRNA targets requires slicer activity of AGO1. Plant Physiol 171: 2620–2632 [DOI] [PMC free article] [PubMed] [Google Scholar]
- Baumberger N, Baulcombe DC (2005) Arabidopsis ARGONAUTE1 is an RNA Slicer that selectively recruits microRNAs and short interfering RNAs. Proc Natl Acad Sci USA 102: 11928–11933 [DOI] [PMC free article] [PubMed] [Google Scholar]
- Bazzini AA, Lee MT, Giraldez AJ (2012) Ribosome profiling shows that miR‐430 reduces translation before causing mRNA decay in zebrafish. Science 336: 233–237 [DOI] [PMC free article] [PubMed] [Google Scholar]
- Bennett T, Scheres B (2010) Root development‐two meristems for the price of one? Curr Top Dev Biol 91: 67–102 [DOI] [PubMed] [Google Scholar]
- Berger F, Haseloff J, Schiefelbein J, Dolan L (1998) Positional information in root epidermis is defined during embryogenesis and acts in domains with strict boundaries. Curr Biol 8: 421–430 [DOI] [PubMed] [Google Scholar]
- Berthet S, Demont‐Caulet N, Pollet B, Bidzinski P, Cézard L, Le Bris P, Borrega N, Hervé J, Blondet E, Balzergue S et al (2011) Disruption of LACCASE4 and 17 results in tissue‐specific alterations to lignification of Arabidopsis thaliana stems. Plant Cell 23: 1124–1137 [DOI] [PMC free article] [PubMed] [Google Scholar]
- Bhattacharyya SN, Habermacher R, Martine U, Closs EI, Filipowicz W (2006) Relief of microRNA‐mediated translational repression in human cells subjected to stress. Cell 125: 1111–1124 [DOI] [PubMed] [Google Scholar]
- Borsani O, Zhu J, Verslues PE, Sunkar R, Zhu J‐K (2005) Endogenous siRNAs derived from a pair of natural cis‐antisense transcripts regulate salt tolerance in Arabidopsis . Cell 123: 1279–1291 [DOI] [PMC free article] [PubMed] [Google Scholar]
- Brady SM, Orlando DA, Lee J‐Y, Wang JY, Koch J, Dinneny JR, Mace D, Ohler U, Benfey PN (2007) A high‐resolution root spatiotemporal map reveals dominant expression patterns. Science 318: 801–806 [DOI] [PubMed] [Google Scholar]
- Breakfield NW, Corcoran DL, Petricka JJ, Shen J, Sae‐Seaw J, Rubio‐Somoza I, Weigel D, Ohler U, Benfey PN (2012) High‐resolution experimental and computational profiling of tissue‐specific known and novel miRNAs in Arabidopsis . Genome Res 22: 163–176 [DOI] [PMC free article] [PubMed] [Google Scholar]
- Brodersen P, Sakvarelidze‐Achard L, Bruun‐Rasmussen M, Dunoyer P, Yamamoto YY, Sieburth L, Voinnet O (2008) Widespread translational inhibition by plant miRNAs and siRNAs. Science 320: 1185–1190 [DOI] [PubMed] [Google Scholar]
- Carlsbecker A, Lee J‐Y, Roberts CJ, Dettmer J, Lehesranta S, Zhou J, Lindgren O, Moreno‐Risueno MA, Vatén A, Thitamadee S et al (2010) Cell signalling by microRNA165/6 directs gene dose‐dependent root cell fate. Nature 465: 316–321 [DOI] [PMC free article] [PubMed] [Google Scholar]
- Casadevall R, Rodriguez RE, Debernardi JM, Palatnik JF, Casati P (2013) Repression of growth regulating factors by the microRNA396 inhibits cell proliferation by UV‐B radiation in Arabidopsis leaves. Plant Cell 25: 3570–3583 [DOI] [PMC free article] [PubMed] [Google Scholar]
- Chen C‐J, Servant N, Toedling J, Sarazin A, Marchais A, Duvernois‐Berthet E, Cognat V, Colot V, Voinnet O, Heard E et al (2012) ncPRO‐seq: a tool for annotation and profiling of ncRNAs in sRNA‐seq data. Bioinformatics 28: 3147–3149 [DOI] [PubMed] [Google Scholar]
- Clough SJ, Bent AF (1998) Floral dip: a simplified method for Agrobacterium‐mediated transformation of Arabidopsis thaliana . Plant J Cell Mol Biol 16: 735–743 [DOI] [PubMed] [Google Scholar]
- Dai X, Zhao PX (2011) psRNATarget: a plant small RNA target analysis server. Nucleic Acids Res 39: W155–W159 [DOI] [PMC free article] [PubMed] [Google Scholar]
- Deleris A, Gallego‐Bartolome J, Bao J, Kasschau KD, Carrington JC, Voinnet O (2006) Hierarchical action and inhibition of plant Dicer‐like proteins in antiviral defense. Science 313: 68–71 [DOI] [PubMed] [Google Scholar]
- Flynt AS, Lai EC (2008) Biological principles of microRNA‐mediated regulation: shared themes amid diversity. Nat Rev Genet 9: 831–842 [DOI] [PMC free article] [PubMed] [Google Scholar]
- Ghildiyal M, Zamore PD (2009) Small silencing RNAs: an expanding universe. Nat Rev Genet 10: 94–108 [DOI] [PMC free article] [PubMed] [Google Scholar]
- Giraldez AJ, Mishima Y, Rihel J, Grocock RJ, Van Dongen S, Inoue K, Enright AJ, Schier AF (2006) Zebrafish MiR‐430 promotes deadenylation and clearance of maternal mRNAs. Science 312: 75–79 [DOI] [PubMed] [Google Scholar]
- Helariutta Y, Fukaki H, Wysocka‐Diller J, Nakajima K, Jung J, Sena G, Hauser MT, Benfey PN (2000) The SHORT‐ROOT gene controls radial patterning of the Arabidopsis root through radial signaling. Cell 101: 555–567 [DOI] [PubMed] [Google Scholar]
- Katiyar‐Agarwal S, Gao S, Vivian‐Smith A, Jin H (2007) A novel class of bacteria‐induced small RNAs in Arabidopsis . Genes Dev 21: 3123–3134 [DOI] [PMC free article] [PubMed] [Google Scholar]
- Kawashima CG, Yoshimoto N, Maruyama‐Nakashita A, Tsuchiya YN, Saito K, Takahashi H, Dalmay T (2009) Sulphur starvation induces the expression of microRNA‐395 and one of its target genes but in different cell types. Plant J Cell Mol Biol 57: 313–321 [DOI] [PubMed] [Google Scholar]
- Khraiwesh B, Zhu J‐K, Zhu J (2012) Role of miRNAs and siRNAs in biotic and abiotic stress responses of plants. Biochim Biophys Acta 1819: 137–148 [DOI] [PMC free article] [PubMed] [Google Scholar]
- Kim J‐Y, Rim Y, Wang J, Jackson D (2005) A novel cell‐to‐cell trafficking assay indicates that the KNOX homeodomain is necessary and sufficient for intercellular protein and mRNA trafficking. Genes Dev 19: 788–793 [DOI] [PMC free article] [PubMed] [Google Scholar]
- Kim D, Pertea G, Trapnell C, Pimentel H, Kelley R, Salzberg SL (2013) TopHat2: accurate alignment of transcriptomes in the presence of insertions, deletions and gene fusions. Genome Biol 14: R36 [DOI] [PMC free article] [PubMed] [Google Scholar]
- Knauer S, Holt AL, Rubio‐Somoza I, Tucker EJ, Hinze A, Pisch M, Javelle M, Timmermans MC, Tucker MR, Laux T (2013) A protodermal miR394 signal defines a region of stem cell competence in the Arabidopsis shoot meristem. Dev Cell 24: 125–132 [DOI] [PubMed] [Google Scholar]
- Langmead B, Salzberg SL (2012) Fast gapped‐read alignment with Bowtie 2. Nat Methods 9: 357–359 [DOI] [PMC free article] [PubMed] [Google Scholar]
- Laubinger S, Sachsenberg T, Zeller G, Busch W, Lohmann JU, Rätsch G, Weigel D (2008) Dual roles of the nuclear cap‐binding complex and SERRATE in pre‐mRNA splicing and microRNA processing in Arabidopsis thaliana . Proc Natl Acad Sci USA 105: 8795–8800 [DOI] [PMC free article] [PubMed] [Google Scholar]
- Lee RC, Feinbaum RL, Ambros V (1993) The C. elegans heterochronic gene lin‐4 encodes small RNAs with antisense complementarity to lin‐14. Cell 75: 843–854 [DOI] [PubMed] [Google Scholar]
- Lehrbach NJ, Castro C, Murfitt KJ, Abreu‐Goodger C, Griffin JL, Miska EA (2012) Post‐developmental microRNA expression is required for normal physiology, and regulates aging in parallel to insulin/IGF‐1 signaling in C. elegans . RNA 18: 2220–2235 [DOI] [PMC free article] [PubMed] [Google Scholar]
- Li S, Liu L, Zhuang X, Yu Y, Liu X, Cui X, Ji L, Pan Z, Cao X, Mo B et al (2013) MicroRNAs inhibit the translation of target mRNAs on the endoplasmic reticulum in Arabidopsis . Cell 153: 562–574 [DOI] [PMC free article] [PubMed] [Google Scholar]
- Li S, Le B, Ma X, Li S, You C, Yu Y, Zhang B, Liu L, Gao L, Shi T et al (2016) Biogenesis of phased siRNAs on membrane‐bound polysomes in Arabidopsis . Elife 5: e22750 [DOI] [PMC free article] [PubMed] [Google Scholar]
- Liao Y, Smyth GK, Shi W (2014) FeatureCounts: an efficient general purpose program for assigning sequence reads to genomic features. Bioinformatics 30: 923–930 [DOI] [PubMed] [Google Scholar]
- Liu L, Chen X (2018) Intercellular and systemic trafficking of RNAs in plants. Nat Plants 4: 869–878 [DOI] [PMC free article] [PubMed] [Google Scholar]
- Lu C, Kulkarni K, Souret FF, MuthuValliappan R, Tej SS, Poethig RS, Henderson IR, Jacobsen SE, Wang W, Green PJ et al (2006) MicroRNAs and other small RNAs enriched in the Arabidopsis RNA‐dependent RNA polymerase‐2 mutant. Genome Res 16: 1276–1288 [DOI] [PMC free article] [PubMed] [Google Scholar]
- Mallory AC, Vaucheret H (2009) ARGONAUTE 1 homeostasis invokes the coordinate action of the microRNA and siRNA pathways. EMBO Rep 10: 521–526 [DOI] [PMC free article] [PubMed] [Google Scholar]
- Manavell PA, Koeng D, Rubio‐Somoza I, Burbano HA, Becker C, Weigel D (2013) Tissue‐specific silencing of Arabidopsis SU(VAR)3‐9 HOMOLOG8 by miR171a. Plant Physiol. 161: 805–812 [DOI] [PMC free article] [PubMed] [Google Scholar]
- Meyers BC, Axtell MJ, Bartel B, Bartel DP, Baulcombe D, Bowman JL, Cao X, Carrington JC, Chen X, Green PJ et al (2008) Criteria for annotation of plant MicroRNAs. Plant Cell 20: 3186–3190 [DOI] [PMC free article] [PubMed] [Google Scholar]
- Mustroph A, Zanetti ME, Jang CJH, Holtan HE, Repetti PP, Galbraith DW, Girke T, Bailey‐Serres J (2009) Profiling translatomes of discrete cell populations resolves altered cellular priorities during hypoxia in Arabidopsis . Proc Natl Acad Sci USA 106: 18843–18848 [DOI] [PMC free article] [PubMed] [Google Scholar]
- Nikovics K, Blein T, Peaucelle A, Ishida T, Morin H, Aida M, Laufs P (2006) The balance between the MIR164A and CUC2 genes controls leaf margin serration in Arabidopsis . Plant Cell 18: 2929–2945 [DOI] [PMC free article] [PubMed] [Google Scholar]
- Nogueira FTS, Chitwood DH, Madi S, Ohtsu K, Schnable PS, Scanlon MJ, Timmermans MCP (2009) Regulation of small RNA accumulation in the maize shoot apex. PLoS Genet 5: e1000320 [DOI] [PMC free article] [PubMed] [Google Scholar]
- Pall GS, Hamilton AJ (2008) Improved northern blot method for enhanced detection of small RNA. Nat Protoc 3: 1077–1084 [DOI] [PubMed] [Google Scholar]
- Petricka JJ, Winter CM, Benfey PN (2012) Control of Arabidopsis root development. Annu Rev Plant Biol 63: 563–590 [DOI] [PMC free article] [PubMed] [Google Scholar]
- Prigge MJ, Wagner DR (2001) The Arabidopsis serrate gene encodes a zinc‐finger protein required for normal shoot development. Plant Cell 13: 1263–1279 [DOI] [PMC free article] [PubMed] [Google Scholar]
- Reinhart BJ, Slack FJ, Basson M, Pasquinelli AE, Bettinger JC, Rougvie AE, Horvitz HR, Ruvkun G (2000) The 21‐nucleotide let‐7 RNA regulates developmental timing in Caenorhabditis elegans . Nature 403: 901–906 [DOI] [PubMed] [Google Scholar]
- Roberts AG, Cruz SS, Roberts IM, Prior D, Turgeon R, Oparka KJ (1997) Phloem unloading in sink leaves of nicotiana benthamiana: comparison of a fluorescent solute with a fluorescent virus. Plant Cell 9: 1381–1396 [DOI] [PMC free article] [PubMed] [Google Scholar]
- Robinson MD, McCarthy DJ, Smyth GK (2010) edgeR: a Bioconductor package for differential expression analysis of digital gene expression data. Bioinformatics 26: 139–140 [DOI] [PMC free article] [PubMed] [Google Scholar]
- Rodriguez RE, Ercoli MF, Debernardi JM, Breakfield NW, Mecchia MA, Sabatini M, Cools T, De Veylder L, Benfey PN, Palatnik JF (2015) MicroRNA miR396 regulates the switch between stem cells and transit‐amplifying cells in Arabidopsis roots. Plant Cell 27: 3354–3366 [DOI] [PMC free article] [PubMed] [Google Scholar]
- Siefers N, Dang KK, Kumimoto RW, Bynum WE, Tayrose G, Holt BF (2009) Tissue‐specific expression patterns of Arabidopsis NF‐Y transcription factors suggest potential for extensive combinatorial complexity. Plant Physiol 149: 625–641 [DOI] [PMC free article] [PubMed] [Google Scholar]
- Svozil J, Gruissem W, Baerenfaller K (2016) Meselect – A rapid and effective method for the separation of the main leaf tissue types. Front Plant Sci 7: 1701 [DOI] [PMC free article] [PubMed] [Google Scholar]
- Thieme CJ, Rojas‐Triana M, Stecyk E, Schudoma C, Zhang W, Yang L, Miñambres M, Walther D, Schulze WX, Paz‐Ares J et al (2015) Endogenous Arabidopsis messenger RNAs transported to distant tissues. Nat Plants 1: 15025 [DOI] [PubMed] [Google Scholar]
- Vazquez F, Gasciolli V, Crété P, Vaucheret H (2004) The nuclear dsRNA binding protein HYL1 is required for microRNA accumulation and plant development, but not posttranscriptional transgene silencing. Curr Biol 14: 346–351 [DOI] [PubMed] [Google Scholar]
- Voinnet O (2009) Origin, biogenesis, and activity of plant microRNAs. Cell 136: 669–687 [DOI] [PubMed] [Google Scholar]
- Vragović K, Sela A, Friedlander‐Shani L, Fridman Y, Hacham Y, Holland N, Bartom E, Mockler TC, Savaldi‐Goldstein S (2015) Translatome analyses capture of opposing tissue‐specific brassinosteroid signals orchestrating root meristem differentiation. Proc Natl Acad Sci USA 112: 923–928 [DOI] [PMC free article] [PubMed] [Google Scholar]
- Wang J‐W, Wang L‐J, Mao Y‐B, Cai W‐J, Xue H‐W, Chen X‐Y (2005) Control of root cap formation by MicroRNA‐targeted auxin response factors in Arabidopsis . Plant Cell 17: 2204–2216 [DOI] [PMC free article] [PubMed] [Google Scholar]
- Xuan W, Band LR, Kumpf RP, Van Damme D, Parizot B, De Rop G, Opdenacker D, Möller BK, Skorzinski N, Njo MF et al (2016) Cyclic programmed cell death stimulates hormone signaling and root development in Arabidopsis . Science 351: 384–387 [DOI] [PubMed] [Google Scholar]
- Ye K, Malinina L, Patel DJ (2003) Recognition of small interfering RNA by a viral suppressor of RNA silencing. Nature 426: 874–878 [DOI] [PMC free article] [PubMed] [Google Scholar]
- Zhang J‐F, Yuan L‐J, Shao Y, Du W, Yan D‐W, Lu Y‐T (2008) The disturbance of small RNA pathways enhanced abscisic acid response and multiple stress responses in Arabidopsis . Plant Cell Environ 31: 562–574 [DOI] [PubMed] [Google Scholar]
Associated Data
This section collects any data citations, data availability statements, or supplementary materials included in this article.
Supplementary Materials
Appendix
Dataset EV1
Dataset EV2
Source Data for Appendix
Review Process File
Source Data for Figure 1
Source Data for Figure 4
Source Data for Figure 5
Source Data for Figure 6
Source Data for Figure 7
Data Availability Statement
Scripts and commands used for the processing of the sequencing data are available upon request.