Abstract
Background
Antiretroviral therapy (ART) for HIV infection increases risk for coronary artery disease (CAD), presumably by causing dyslipidemia and increased atherosclerosis. We applied systems pharmacology to identify and validate specific regulatory gene networks (RGNs) through which ART drugs may promote CAD.
Methods
Transcriptional responses of human cell lines to 15 ART drugs retrieved from the Library of Integrated Cellular Signatures (overall 1,127 experiments) were used to establish consensus ART gene/transcriptional signatures. Next, enrichments of differentially expressed genes and gene-gene connectivity within these ART-consensus signatures were sought in 30 RGNs associated with CAD and CAD-related phenotypes in the Stockholm Atherosclerosis Gene Expression study.
Results
Ten of 15 ART signatures were significantly enriched both for differential expression and connectivity in a specific atherosclerotic arterial wall, AR-RGN, causal for CAD involving RNA processing genes. An atherosclerosis in vitro model of cholestryl ester (CE)-loaded foam cells was then used for experimental validation. Treatments of these foam cells with ritonavir, nelfinavir, and saquinavir at least doubled CE accumulation (P=0.02; 0.0009, and 0.02, respectively), whereas RNA silencing of the AR-RGN top key driver, polyglutamine binding protein 1 (PQBP1), significantly curbed CE accumulation following treatment with any of these ART drugs by >37% (P<0.05).
Conclusions
By applying a novel systems pharmacology data analysis framework, three commonly used ARTs (ritonavir, nelfinavir and saquinavir) were found altering the activity of a regulatory gene network (AR-RGN) promoting foam cell formation and risk of CAD. Targeting AR-RGN or its top key driver PQBP may help reduce CAD side effects of these ART drugs.
Keywords: HIV, antiretroviral therapy, atherosclerosis, systems pharmacology, regulatory gene networks, Lipids and Cholesterol, Computational Biology, Gene Expression and Regulation
Antiretroviral therapy (ART) has dramatically reduced mortality among people living with HIV (PLWH).1 As a result, opportunistic infections and other acquired immunodeficiency syndrome (AIDS)-related deaths are less common and non-AIDS related comorbidities, such as cardiovascular disease (CVD), account for the majority of deaths for PLWH.2 Specifically, PLWH have a 1.5–2-fold increase in relative risk for myocardial infarction (MI) or atherosclerotic coronary artery disease (CAD),3, 4 due in part to an increased burden of CAD traditional risk factors such as smoking, dyslipidemia, and type 2 diabetes (T2D). In addition, both inflammation and the vascular effects of viral replication may promote the risk of CAD.
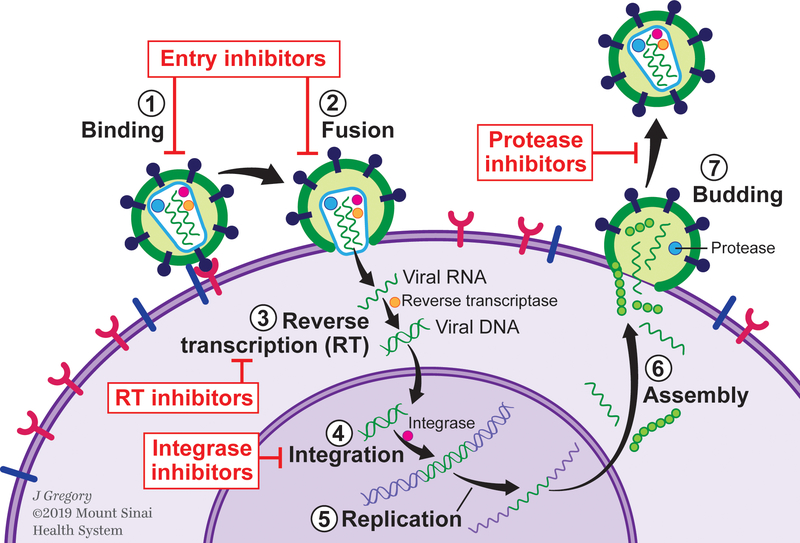
ART impacts multiple steps of the HIV life cycle: binding or attachment of HIV to the surface of the host CD4 cell, fusion of the HIV envelope with the CD4 membrane, reverse transcription converting HIV RNA to HIV DNA, integration into the host cell’s nucleus, replication, assembly, and budding (Figure 1). Multiple ART drug classes (7 to date) targeting distinct stages in the HIV life cycle have been approved by the Food and Drug Administration.5 The most commonly used classes include: nucleoside reverse transcriptase inhibitors (NRTIs) and non-nucleoside reverse transcriptase inhibitors (NNRTIs), both of which target reverse transcription via different mechanisms; protease inhibitors (PIs), which target the key enzyme that cleaves the long non-infectious protein chains into smaller HIV proteins that form infectious HIV, and integrase inhibitors, which target virus integration to the cell. Other classes include entry inhibitors, such as fusion inhibitors, co-receptor antagonists, and most recently post-attachment inhibitors6 (Figure 1). ART is typically prescribed as regimens of three or more drugs to decrease risk of resistance.
Figure 1.
Illustration of the HIV life cycle and antiretroviral therapy targets.
While ART reduces viral replication and chronic inflammation decreasing HIV-related morbidity and mortality, early studies suggested it may increase CVD risk.7 CVD risk has been linked to longer ART or PI duration,8, 9 recent abacavir or didanosine use,10 and ART interruptions,11 though findings vary.12, 13 Specifically, patients on ART have shown dyslipidemia,14 with the greatest effect noted when PI and NNRTI drug classes were prescribed in combination and applied to higher levels of total cholesterol, low density lipoprotein (LDL) cholesterol and triglycerides.15 PIs have also been associated with impaired glucose metabolism and older NRTIs with body morphology abnormalities including peripheral lipoatrophy with fat loss and central lipohypertrophy with visceral fat accumulation.16, 17
However, the reported data are largely observational making it difficult to infer the causality. Yet, several potential mechanisms have been proposed. For example, ART-associated dyslipidemia has been suggested to act through structural similarity of the catalytic region of the HIV-1 protease and the homologous human retinoic acid-binding protein type 1 (CRABP-1) to LDL receptor-related protein type 1 (LRP1).18 PI therapy has been suggested to promote body morphology abnormalities and increase plasma lipid levels by inhibiting mitochondrial DNA polymerase γ, leading to respiratory chain dysfunction and altered levels of adipocytokines involved in energy homeostasis.18 Newer drug classes such as integrase inhibitors and entry inhibitors have less effect on lipid and glucose metabolism, but may still produce cardiometabolic effects through weight gain19 or other mechanisms.
The biological pathways by which individual ART medications and classes impact CAD risk require further investigation using a systematic, rigorous and unbiased approaches with experimental validation of putative mechanisms. Therefore, in this study, we used a novel in silico systems pharmacology framework to identify biological networks and pathways through which ART may promote atherosclerosis and thus CAD.
First, we used the National Institute of Health’s Library of Integrated Cellular Signatures (LINCS) database20 to identify transcriptional signatures induced by ART in a wide range of human cells.21 Next, we looked for enrichment and co-expression of these ART signatures in CAD-causal regulatory gene networks (RGNs) constructed from genotype and gene expression data of multiple vascular and metabolic tissues from CAD patients in the Stockholm Atherosclerosis Gene Expression (STAGE) study.22 Finally, to validate the prediction that the pro-atherosclerotic effect of ART drugs was mediated by a particular RGN, we used a well-established in vitro foam cell model of atherosclerosis.23 This model mimics the macrophages that are ultimately transformed into lipid-laden foam cells, the prototypical cells in the atherosclerotic plaque.24
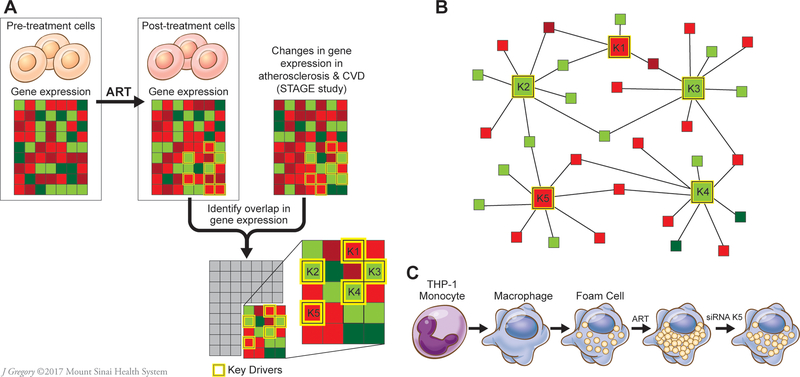
Our novel in silico systems pharmacology framework (Figure 2) could be useful to pinpoint pathways that promote off-target drug effects, help anticipate side effects of new ART regimens, design novel therapies, and improve the identification of PLWH at highest risk for ART-associated cardiometabolic complications.
Figure 2.
Schematic flow of analytic and experimental validation steps. A. Genes differentially expressed in response to 15 antiretroviral therapy (ART) drugs were identified in the LINCS database. Their enrichments and co-expression were then sought in 30 regulatory gene networks (RGNs) identified in the STAGE study as coronary artery disease (CAD)-causal.22 Genes most essential for the activity of RGNs, or key drivers (K1-K5) were also included in this analysis. B. A schematic example of a RGN with 5 key disease drivers. C. Experimental validation of atherosclerosis-related RGN (AR-RGN) enriched in ART signatures using an atherosclerosis model in vitro. THP-1 monocytes were differentiated into THP-1 macrophages in vitro and then incubated with AcLDL and individual ART drugs to form THP-1 foam cells. To assess the role of key driver genes in AR-RGN in foam cell formation induced by ART drugs, THP-1 macrophages were subjected to key driver silencing. CVD, cardiovascular disease. STAGE, the Stockholm Atherosclerosis Gene Expression study.22 Red color exemplifies downregulated genes, green color upregulated genes.
Materials and Methods
The LINCS dataset used in the analyses is publically available. The study methods are described in sufficient detail to allow reproducibility and replication of the results and procedures. The additional material can be available directly from the corresponding authors. Our study did not involve human subjects and therefore no IRB approval was required. The detailed methods are available as Supplemental Material.
Results
Enrichment of ART-Induced Transcriptional Signatures in 4 of 30 CAD-causal RGNs
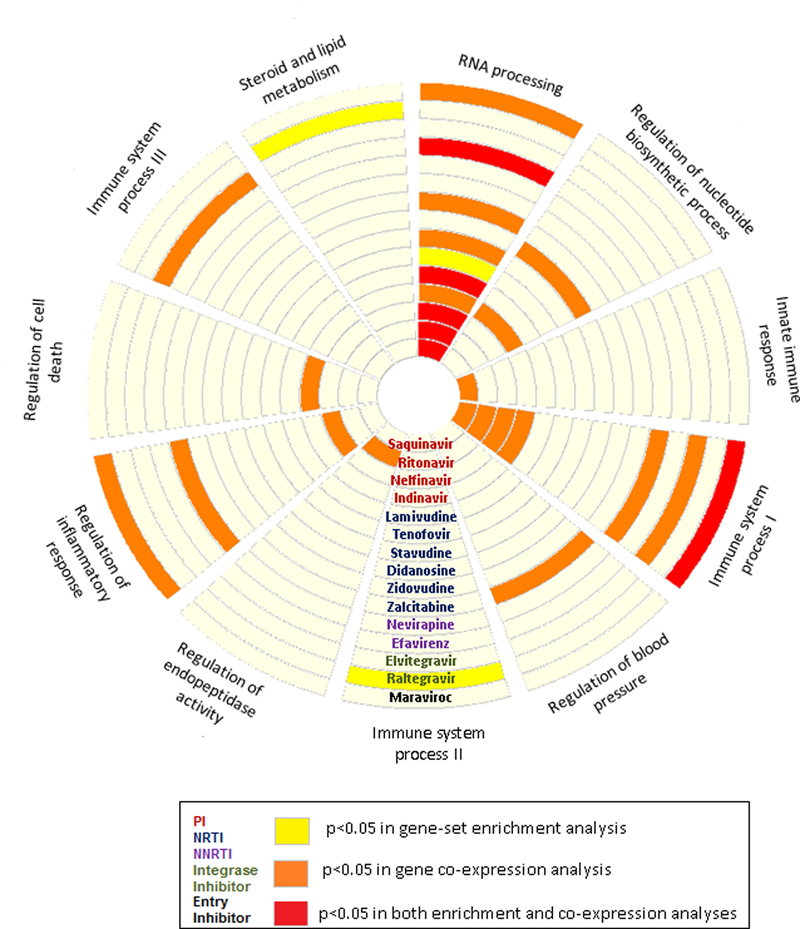
Transcriptional signatures associated with 15 ART drugs in LINCS (Supplemental Table S1) constituted a total of 13,428 genes; some downregulated and some upregulated in at least 2 experiments. Among the 30 CAD-causal RGNs identified in the STAGE study22 (Supplemental Table S2), two were consistently enriched in the ART-induced gene signatures (Figure 3). The strongest enrichment was in AR-RGN, a network of RNA processing genes that was derived from the atherosclerotic arterial wall tissue and associated with the extent of coronary atherosclerosis in the STAGE study.25 Specifically, the downregulated genes induced by three PIs showed significant overlap with AR-RGN genes, including 29/73 genes shared by saquinivir (adjusted P=0.048), 27/73 by nelfinavir (P=0.035), and 23/73 by ritonavir (P=0.035). The AR-RGN was also enriched in ART-induced signatures of the two NRTIs, tenofovir (15/73 genes, P=0.01) and lamivudine (25/73 genes, P=0.048), and NNRTI efavirenz (16/73 genes, P=0.03) (Table 1). Genes from the immune system process RGNs were enriched among the genetic signatures induced by integrase inhibitor raltegravir (1¾5, P=0.049) and entry inhibitor maraviroc (33/57, P=0.048). Raltegravir-induced signature was also enriched in another CAD-causal RGN involved in steroid and lipid metabolism (35/170 genes, P=0.035). This subcutaneous fat–specific network was strongly associated with fasting glucose levels (5.0×10⁻²⁷) and HDL (8.0×10−38) in the STAGE study.22
Figure 3.
CAD-causal regulatory gene networks enriched for ART drug gene signatures. Circular layout of 10 CAD-causal RGNs from the STAGE study22 that were either enriched (yellow), co-expressed (orange) or both (red) with 15 ART drug-induced gene signatures identified in the LINCS database at P<0.05. PI, protease inhibitors; NRTI, nucleoside-analog reverse transcriptase inhibitors; NNRTI, non-nucleoside reverse transcriptase inhibitors.
Table 1:
Coronary artery disease-causal regulatory genetic networks enriched in ART-induced gene signatures in the Library of Integrated Cellular Signatures (LINCS).
| Drug | Direction of change | Regulatory Gene Network | Gene set size | Exp. Hits | Obs. Hits | P | P adj | Gene enrichment overlap | Fold Change |
|---|---|---|---|---|---|---|---|---|---|
| Maraviroc, Entry inhibitor | up | Immune system process I | 57 | 20 | 33 | 0.0004 | 0.048 | ACP2|ADA|AMPD1|ARRB1|CEBPA|CLN6|COQ2|CST7|CTSC| CTSH|CYBA|GAS7|GLA|GPX1|GRN|HLA-DPB1|LAMP3|LTB| MAN2B1|MAPKAPK3|NFKBIE|OLR1|PCK2|PLA2G15|PLEK2| PPIF|PYCARD|RGS19|SECTM1|SH3TC1|TMEM51|TNF| TNFRSF1B | 1.64 |
| Raltegravir, Integrase inhibitor | down | Immune system process II | 45 | 5 | 13 | 0.0005 | 0.049 | AHSP|ALAS2|BPI|CAMP|CEACAM8|DEFA4|ELANE|MS4A3| PRG2|RNASE3|S100A12|SLC4A1|SPTA1 | 2.75 |
| Tenofovir, NRTI | down | RNA processing | 73 | 4 | 15 | 1.10E-05 | 0.01 | AKR7A2|CD320|CYC1|DRAP1|GPX4|HSPB2|MIF|MRPL12| MRPL23|NHP2|NT5C|PCBD1|POLR2I|RABAC1|TPI1 | 3.59 |
| Efavirenz, NNRTI | down | RNA processing | 73 | 5 | 16 | 6.10E-05 | 0.03 | AKR7A2|BAD|CD320|CYC1|DRAP1|ENDOG|EXOSC4|GAMT| MIF|MRPL12|PCBD1|PLEKHJ1|POLR2I|TBCB|TIMM10|TPI1 | 2.96 |
| Ritonavir, PI | down | RNA processing | 73 | 11 | 23 | 0.0002 | 0.035 | AIP|AKR7A2|CD320|CLPP|CYC1|EXOSC4|GPX4|HSD17B8| HSPB2|MIF|MPG|MRPL11|MRPL12|MRPL28|NHP2|PCBD1| PMM1|POLR2I|PPIH|RHOD|SDHAF1|TMED1|XAF1 | 2.15 |
| Nelfinavir, PI | down | RNA processing | 73 | 14 | 27 | 0.0002 | 0.035 | AIP|AKR7A2|BAD|CD320|CINP|CUEDC2|CYC1|DCPS|DRAP1| EXOSC4|HS1BP3|MIF|MPG|MRPL11|MRPL12|MRPL28| NT5C|PLEKHJ1|POLR2I|RPL39L|SSSCA1|SURF2|TBCB| TIMM10|TPI1|TRAPPC2L|ZNF593 | 1.96 |
| Lamivudine, NRTI | up | RNA processing | 73 | 13 | 25 | 0.0004 | 0.048 | AIP|ARL2|ASNA1|BAD|CD320|CYC1|EXOSC4|GPX4|HSPB2| MIF|MRPL23|NT5C|PLEKHJ1|POLR2I|PPIH|RHOD|RPL39L| SDHAF1|SNRPB|SURF2|TBCB|TIMM10|TMED1|TMED3| ZNF593 | 1.96 |
| Saquinavir, PI | down | RNA processing | 73 | 16 | 29 | 0.0005 | 0.049 | AKR7A2|AP1S1|BAD|CD320|CUEDC2|CYC1|DCPS|DRAP1| ENDOG|EXOSC4|GAMT|HSD17B8|MIF|MRPL12|MRPL23| NPM3|PCBD1|PLEKHJ1|PMM1|POLR2I|RPL39L|SDHAF1| SSSCA1|TBCB|TIMM10|TPI1|TRAPPC2L|ZMAT5|ZNF593 | 1.80 |
| Raltegravir, Integrase inhibitor | up | Steroid and lipid metabolism | 170 | 19 | 35 | 0.0002 | 0.035 | ARG1|C8B|C9|CP|CRP|CYP27A1|F2|FBP1|FGA|FGL1|GJB1| HAL| HOMER2|HPR|HSD17B6|IL13RA2|ITIH3|KNG1|LECT2|MBL2| MT1H|MTTP|PIPOX|PLS1|QPRT|RNF128|SERPINA10|SERPINA3| SERPINC1|SERPIND1|SLC22A1|SLCO1B3|STAP2|UGT2B4|ZGPAT | 1. 87 |
ART, antiretroviral therapy. Exp. Hits, number of expected overlaps; Obs. Hits, number of observed overlaps. P adj, P-value adjusted for multiple hypothesis testing. NNRTI, non-nucleoside reverse transcriptase inhibitor; NRTI, nucleoside reverse transcriptase inhibitor, PI, protease inhibitor.The total number of genes in the universe-4,576.
Co-expression of Genes in 9 of 30 CAD-Causal RGNs in the ART-Induced Signatures
Next, we used the ART-induced signature from LINCS to determine whether the gene-gene connections predicted by the 30 CAD-causal RGNs could be reproduced. We observed significant gene co-expression between RGN genes and at least one ART-induced signature for 9 CAD-causal RGNs (Figure 3). The connectivity of the AR-RGN genes was reproducible in as many as 9 out of 15 ART-induced signatures, including those of the PIs nelfinavir, ritonavir, indinavir, and saquinavir and the NNRTI efavirenz (Figure 3). AR-RGN genes were also strongly co-expressed in the ART signatures induced by zidovudine, stavudine, and lamivudine (all NRTIs). Moreover, stronger-than-expected co-expression of AR-RGN genes was observed in the signature of the entry inhibitor maraviroc (Figure 3). In addition to AR-RGN enriched in RNA processing genes, ART-induced gene signatures for all 4 PIs, NNRTI nevirapine, integrase inhibitor elvitegravir and entry inhibitor maraviroc overlapped with at least one of the immune-mediated RGNs involved in immune system processing, innate response or regulation of inflammatory response. Also, single ART drugs were co-expressed with RGNs representing regulation of nucleotide biosynthetic process, cell death, endopeptidase activity, and blood pressure (Figure 3). Adjusted P-values from co-expression analysis between the 30 RGNs and 15 ARTs are provided in Supplemental Table S3.
AR-RGN Key Driver Polyglutamine Binding Protein 1 (PQBP1) Is Upregulated Following ART Treatment in LINCS
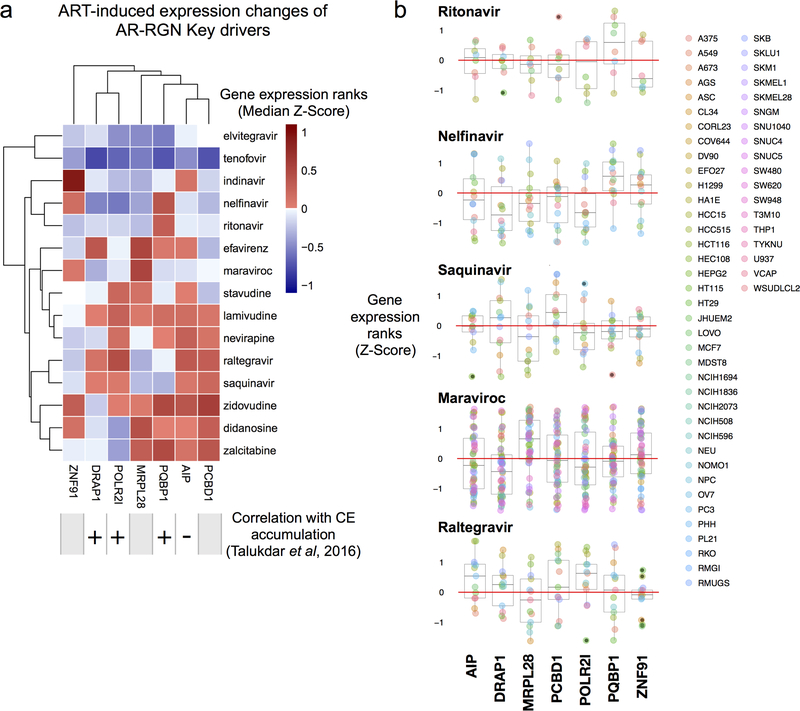
To explore whether the established key drivers of the AR-RGN that modulate foam cell formation in vitro22 are affected by ritonavir, nelfinavir, and saquinavir, we examined their effects on the expression of key driver genes identified in AR-RGN (e.g., DRAP1, POLR2I, and PQBP1)22 using the LINCS data (Figure 4, Supplemental Table S1). Indeed, the expression of PQBP1 was consistently upregulated by ritonavir and nelfinavir across a range of cell and dosage conditions (Figure 4). This result prompted in vitro experiments aimed to mitigate ART-induced CE accumulation by targeting PQBP1.
Figure 4.
Summary of expression changes for the key driver genes in LINCS. A, Expression changes of 7 AR-RGN key drivers induced by 15 antiretroviral therapy (ART) drugs profiled in LINCS. Four key drivers have validated relationships with cholesterol ester accumulation. Median Z-score of gene expression ranks are shown within each cell. B, Expression changes of 7 AR-RGN key drivers in response to ritonavir, nelfinavir, saquinavir, maraviroc, and raltegravir. Persistent induction of PQBP1 by ritonavir, and nelfinavir, across a range of cell-line contexts (color legend on the right; details at http://lincs.hms.harvard.edu/db/cells/) suggested that these compounds increase cholesterol accumulation, possibly by interacting with PQBP1. AR-RGN, atherosclerosis-related regulatory gene network.
Foam Cell Formation in THP1 Cells after ART is Mediated by AR-RGN and PQBP1
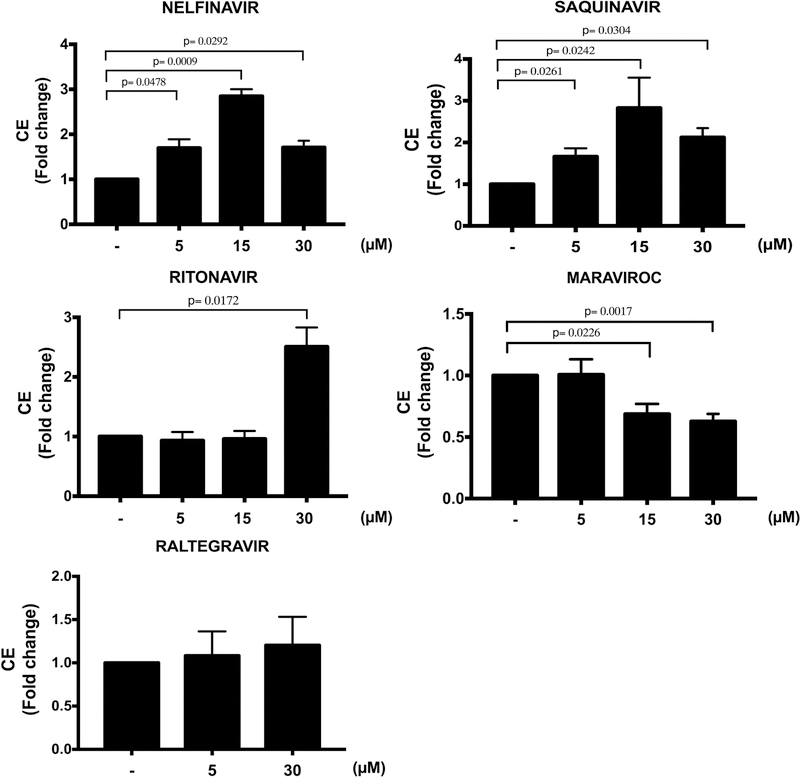
LINCS ART signature overlap, co-expression, and activation of key driver PQBP1 in AR-RGN suggest that this network mediates possible side effects of ritonavir, nelfinavir, and saquinavir by increasing foam cell formation. We validated the effects of selected ART drugs on CE accumulation in THP-1 cells in vitro. Nelfinavir and saquinavir induced a ~3-fold increase (P=0.0009 and P=0.02, respectively, for the 15 μM dose) and ritonavir a ~2.5-fold increase (P=0.02 for the 30 μM dose) in CE accumulation (Figure 5). In contrast, treatment with maraviroc significantly reduced CE accumulation (P=0.02 and 0.002 at 15 μM and 30 μM, respectively), while treatment with raltegravir showed no effect.
Figure 5.
Effect of ART drugs on cholesteryl ester (CE) accumulation in THP-1 foam cells. CE accumulation was measured in cell lysates of THP-1-derived macrophages pre-treated with DMSO (−), nelfinavir, saquinavir, ritonavir, maraviroc (5, 15 and 30 μM), and raltegravir (5 and 30 μM) for 24 hours and then incubated with AcLDL (50 μg/mL) for additional 48 hours. Drug treatment was maintained throughout the experiment. Results are shown for 3 independent experiments with 3 technical replicates (n=9). Data are expressed as mean±SEM.
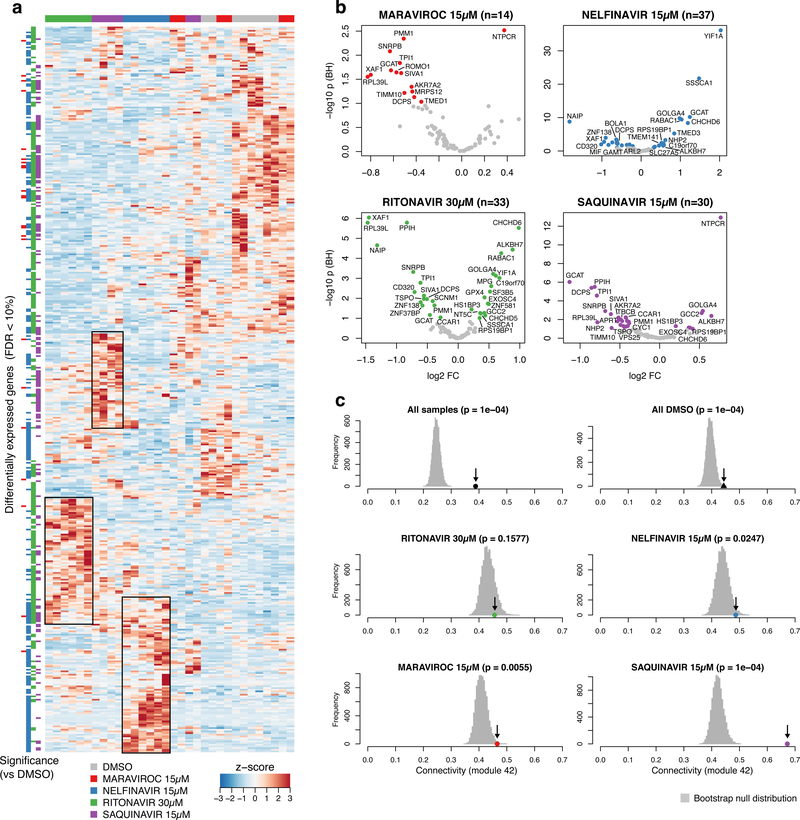
To assess whether the induced foam cell formation in vitro is mediated by AR-RGN, we compared AR-RGN expression between THP-1 foam cells treated with dimethyl sulfoxide (DMSO, control) versus selected ART drugs (Figure 6). The overall RNA-Seq signature induced by ritonavir, nelfinavir, and saquinavir that promoted CE accumulation in THP-1 foam cells was clearly different from the signatures induced by DMSO and maraviroc that significantly reduced CE accumulation (Figure 6a). Similarly, 59 genes, including PQBP1 of the AR-RGN in the THP-1 foam cells, were significantly up or downregulated by ritonavir, nelfinavir, or saquinavir, whereas only 14 AR-RGN genes were differentially expressed in response to maraviroc (false discovery rate, FDR<10%; Figure 6b). PQBP1 also demonstrated differential expression of specific isoforms for some of the ART experiments in foam cells (Supplemental Figure S1). Across all treatments of the THP-1 foam cells, including DMSO, the integrity of AR-RGN, measured as mean connectivity of AR-RGN genes compared to the connectivity of 10,000 random gene sets of genes of equal size, was intact (Figure 6c, top panel). This was also true when assessing the mean connectivity for AR-RGN for each treatment besides ritonavir, where the connectivity of AR-RGN was only slightly higher than background (Figure 6c, lower panels). Taken together, these results strongly suggest that the effects of these ART drugs on CE accumulation in THP-1 foam cells are mediated by AR-RGN and its top key driver, PQBP1.
Figure 6.
Effects of antiretroviral (ART) drugs on gene expression in THP-1 foam cells. A. Heat map of all differentially expressed genes comparing treatments with DMSO versus ritonavir, nelfinavir, saquinavir and maraviroc, respectively, in THP-1 foam cells incubated with acetylated LDL. B. Volcano plots showing differentially expressed AR-RGN genes in THP-1 foam cells following ART drug treatments. C. Permutation test showing the mean connectivity (r, Pearson correlations, x-axis) of atherosclerosis-related regulatory gene network (AR-RGN) genes (arrow) compared to the null distribution of 1,000 random equally sized sets of genes in THP-1 foam cells following ART drug treatments (color code indicates each ART drug).
Combined ART and Silencing of the Key Driver Gene PQBP1 in AR-RGN Partially Restores Baseline CE Levels in THP-1 Foam Cells
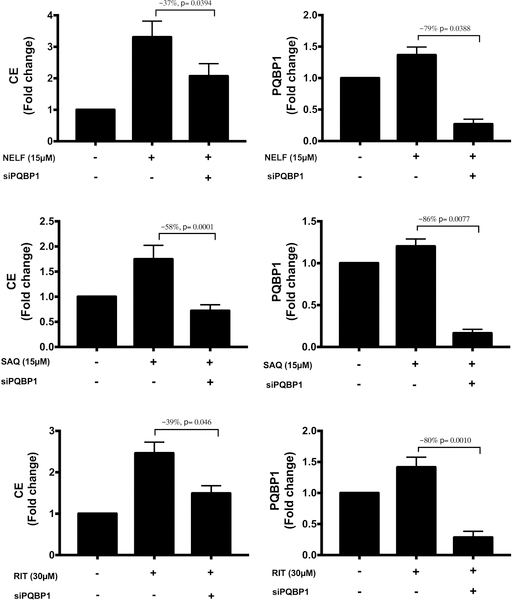
Next, we tested whether siRNA silencing of PQBP1 would reduce ART-induced increases in CE accumulation in THP-1 foam cells observed in Figure 5. We found that silencing of PQBP1 prior to treatment with nelfinavir, saquinavir, or ritonavir reduced CE accumulation in THP-1 foam cells by 37%, 58%, and 39%, respectively (Figure 7), suggesting PQBP1 as the primary means by which these drugs lead to CE accumulation.
Figure 7.
Effect of PQBP1 silencing on cholesteryl ester (CE) accumulation in antiretroviral therapy (ART)-treated foam cells. THP-1 macrophages were first transfected with a pool of 3 PQBP1 siRNAs or a pool of 2 control siRNAs. Following a 24 hour pre-treatment with either DMSO (–), nelfinavir (15 μM), saquinavir (15μM), or ritonavir (30 μM), AcLDL (50 μg/mL) was added to the culture media for the following 48 hours. Drug treatment was maintained throughout the experiment. CE accumulation and PQBP1 expression levels were measured in cell lysates. Results are shown for 3 independent experiments with 3 technical replicates (n=9) for CE accumulation measurements and 2 technical replicates (n=6) for PQBP1 RNA level quantification. Data are expressed as mean±SEM. NELF, nelfinavir; SAQ, saquinavir; RIT, ritonavir.
Discussion
In this study, we used a novel in silico systems pharmacology data analysis framework combined with an in vitro atherosclerosis model to identify and experimentally validate biological networks and associated pathways that likely mediate CAD progression in response to ART. In human cell lines treated with 15 individual commonly used ART drugs, we identified transcriptional signatures that were significantly enriched in CAD-causal RGNs active in metabolic and arterial wall tissues. We also found that AR-RGN, an arterial wall-specific RNA processing network, reported to regulate foam cell formation,22 consistently overlapped with as many as 3 (ritonavir, nelfinavir, and saquinavir) of the 4 PI ART-induced gene signatures. Finally, in a THP-1 foam cell model of atherosclerosis, we confirmed a causal role of AR-RGN and its key driver PQBP1 in mediating CAD-causal pathways arising from these PIs. Our data provide first evidence that nelfinavir and saquinavir increase the CE accumulation in foam cells, a mechanism that could contribute to the increased risk for CAD. Using our unbiased data-driven approach we also predicted and experimentally reproduced the known effect of ritonavir on foam cell formation,25 supporting the robustness of our approach. Moreover, the fact that PQBP1 and AR-RGN are intracellular molecular mediators of augmented foam cell formation prompted by these PIs is novel and merits further investigation.
In the STAGE study,22 AR-RGN was the only cross-species-validated, atherosclerosis-specific RGN that was also linked to mouse atherosclerosis, strongly supporting its causal role in promoting CAD. Among the AR-RGN key drivers, the top driver PQBP1 was the most consistently upregulated gene in response to several ARTs in LINCS and demonstrated differential expression of specific isoforms for some of our ART experiments in foam cells (Figure 6; Supplemental Figure S1). PQBP1, a key regulator of mRNA processing and gene transcription, has been shown to bind to immunogenic reverse-transcribed HIV-1 DNA.26 Mutations in the PQBP1 locus severely impair the innate immune response to HIV-1 challenge.26 Moreover, PQBP1 has been linked to lipid metabolism, with PQBP1 repression leading to reduction of lipid content in mammalian primary white adipocytes.27 We detected that silencing of PQBP1 by siRNA reduced CE accumulation by 37%−58% in foam cells treated with PIs nelfinavir, saquinavir or ritonavir (Figure 7). Our findings are consistent with previous observational studies demonstrating that ART-associated dyslipidemia is especially evident with the use of PIs, which promote a decrease in plasma high-density lipoprotein cholesterol and increase overall cholesterol, triglycerides, and LDL cholesterol, hereby promoting an increased risk of CVD (reviewed in 18). Our findings suggest that while PQBP1 in itself is not a PI drug target but as a network key driver it plays a central role in AR-RGN gene activity and foam cell formation. We suggest that downregulation of the RNA processing pathway is likely to be a broad off-target effect of this class of compounds; therefore, PQBP1 inhibition could be considered as a novel strategy to decrease the cardiometabolic side effects of PIs.
Of note, CE accumulation in foam cells was not affected following raltegravir treatment and was reduced by maraviroc (Figure 5). While raltegravir has previously been shown not to alter foam cell formation,28 no previous reports involving the in vivo foam cell model have been published for maraviroc. However, our findings are consistent with reports that maraviroc reduces the development and progression of atherosclerotic plaques in humans29 and animal models of HIV30 and improves lipid profiles in dyslipidemic HIV patients.31 Thus, the enrichment of the maraviroc-induced transcriptional signatures within AR-RGN and the associated reduction in foam cell formation suggest that maraviroc protects against CAD by modulating RNA processing in AR-RGN in a way that reduces foam cell formation.
The immune system process I pathway showed strong gene co-expression with the transcriptional signatures of all four PIs, as well as those of nevirapine, elvitegravir, raltegravir, and maraviroc. One of its 3 key gene regulators, CEBPA, mediates adipocyte differentiation that may be involved in the peripheral loss of adipose tissue or lipoatrophy, a common side effect of PIs.32 Another key regulator of this pathway, HMGA1 (high mobility group AT-hook 1), helps regulate gene transcription, including integration of retroviruses into chromosomes. The HMGA1 variant rs146052672 has been linked to risk for T2D, acute myocardial infarction, and metabolic syndrome.33
The drug-induced transcriptional signature of the integrase inhibitor raltegravir was enriched in CAD-related RGNs involved in immune process and steroid and lipid metabolism. Steroid and lipid metabolism RGN includes key driver genes such as apolipoprotein A, the major protein component of HDL particles in plasma, and CYP4F2, a cytochrome P450 monooxygenase that regulates drug metabolism and synthesis of cholesterol, steroids, fatty acids, and other lipids. The beneficial regulatory effects of raltegravir on this RGN could explain earlier findings that raltegravir reduces the oxidative stress induced by treatment with PIs.28
NNRTIs and NNRIs induce less dyslipidemia than PIs but there are variations within a drug class. For example, efavirenz has greater adverse effects on lipid metabolism than other NNRTIs such as nevirapine (reviewed in 34). In our study, the efavirenz- but not nevirapine-induced transcriptional signature showed significant enrichment and co-expression in AR-RGN. Also, switching from tenofovir-based to lamivudine-based NRTI therapy has been shown to increase lipid levels,35 which is consistent with our findings indicating an opposite effects of tenofovir-induced downregulation and lamivudine-induced upregulation of genes that overlap with AR-RGN. Future studies are warranted to determine whether structural modifications of certain drugs based on our findings could reduce ART-associated side effects.
A limitation of our study is the lack of data in LINCS on the transcriptional responses for multi-drug ART regimens, the standard of care for HIV infection. However, our approach enabled us to parse out specific effects of individual drugs. Further studies are warranted to detect the enrichment of multi-drug ART transcriptional signatures in the causal CAD RGNs using our single-drug framework. Also, transcriptional profiles for ART drugs were often generated in cell lines not directly relevant to CAD pathogenesis. Moreover, in LINCS, only 978 genes were directly measured with the L1000 array, whereas <12,450 genes were computationally inferred, leaving a large number of genes out of analysis. Therefore, we conducted RNA-Seq analysis in THP-1 foam cells, a well-characterized in vitro model of atherosclerosis directly measuring gene expression genome-wide. Importantly, additional factors such as genetic predisposition, lifestyle (diet, smoking, and exercise), viral load, degree of chronic inflammation, co-morbidities, and concomitant medications may exacerbate the effects of ART on CAD risk. While our approach cannot predict which patients receiving ART may be more susceptible to cardiometabolic complications, the genes that are differentially expressed in response to specific drugs could contain single nucleotide variants that may cause a predisposition to adverse effects.
In summary, our study shows that systems pharmacology can be used to detect specific mechanisms of CAD risk associated with ART regimens and help identify key drivers of ART-associated effects and highlight drugs that are particularly likely to promote cardiovascular risk. As treatments for HIV continue to evolve, our approach may be useful in anticipating side effects of new classes of ART drugs.
Supplementary Material
Acknowledgments
Sources of Funding: This work was supported by National Institute of Health’s (NIH) National Heart, Lung, and Blood Institute (NHLBI, R01 HL125027 to I.P and H.M.C.). C.G. was supported by NIH’s NHLBI (K23HL111339, R03HL135289) and National Center for Advancing Translational Sciences (R21TR001739, UH2TR002067). J.K. acknowledges research support from the NIH’s NHLBI (R01HL130423) and The Leducq Foundation (Transatlantic Network of Excellence Award). J.L.M. acknowledges research support from NIH R01HL125863, American Heart Association (A14SFRN20840000), Swedish Research Council (2018-02529), Heart Lung Foundation (20170265), and Foundation Leducq (PlaqueOmics: Novel Roles of Smooth Muscle and Other Matrix Producing Cells in Atherosclerotic Plaque Stability and Rupture, 18CVD02; and CADgenomics: Understanding CAD Genes, 12CVD02).
Footnotes
Disclosures: None
References
- 1.Palella FJ Jr., et al. Declining morbidity and mortality among patients with advanced human immunodeficiency virus infection. HIV Outpatient Study Investigators. N Engl J Med. 1998;338:853–60. [DOI] [PubMed] [Google Scholar]
- 2.Palella FJJ, et al. Mortality in the highly active antiretroviral therapy era: changing causes of death and disease in the HIV outpatient study. J Acquir Immune Defic Syndr. 2006. 43:27–34. [DOI] [PubMed] [Google Scholar]
- 3.Paisible AL, et al. HIV infection, cardiovascular disease risk factor profile, and risk for acute myocardial infarction. J Acquir Immune Defic Syndr. 2015;68:209–16. [DOI] [PMC free article] [PubMed] [Google Scholar]
- 4.Freiberg MS, et al. HIV infection and the risk of acute myocardial infarction. JAMA Intern Med. 2013;173:614–22. [DOI] [PMC free article] [PubMed] [Google Scholar]
- 5.U.S. Department of Health and Human Services. FDA-approved HIV medicines. AIDSInfo. [Google Scholar]
- 6.Arts EJ and Hazuda DJ. HIV-1 Antiretroviral Drug Therapy. Cold Spring Harbor Perspectives in Medicine. 2012;2:a007161. [DOI] [PMC free article] [PubMed] [Google Scholar]
- 7.Rhew DC, et al. Association between protease inhibitor use and increased cardiovascular risk in patients infected with human immunodeficiency virus: a systematic review. Clin Infect Dis. 2003;37:959–72. [DOI] [PubMed] [Google Scholar]
- 8.Friis-Moller N, et al. Combination antiretroviral therapy and the risk of myocardial infarction. N Engl J Med. 2003;349:1993–2003. [DOI] [PubMed] [Google Scholar]
- 9.Mary-Krause M, et al. Increased risk of myocardial infarction with duration of protease inhibitor therapy in HIV-infected men. AIDS. 2003;17:2479–86. [DOI] [PubMed] [Google Scholar]
- 10.Sabin CA, et al. Use of nucleoside reverse transcriptase inhibitors and risk of myocardial infarction in HIV-infected patients enrolled in the D:A:D study: a multi-cohort collaboration. Lancet. 2008;371:1417–26. [DOI] [PMC free article] [PubMed] [Google Scholar]
- 11.El-Sadr WM, et al. CD4+ count-guided interruption of antiretroviral treatment. N Engl J Med. 2006;355:2283–96. [DOI] [PubMed] [Google Scholar]
- 12.Klein D, et al. Do protease inhibitors increase the risk for coronary heart disease in patients with HIV-1 infection? J Acquir Immune Defic Syndr. 2002;30:471–7. [DOI] [PubMed] [Google Scholar]
- 13.Bozzette SA, et al. Cardiovascular and cerebrovascular events in patients treated for human immunodeficiency virus infection. N Engl J Med. 2003;348:702–710. [DOI] [PubMed] [Google Scholar]
- 14.Grunfeld C, et al. Lipids, lipoproteins, triglyceride clearance, and cytokines in human immunodeficiency virus infection and the acquired immunodeficiency syndrome. J Clin Endocrinol Metab. 1992;75:1045–52. [DOI] [PubMed] [Google Scholar]
- 15.Friis-Moller N, et al. Cardiovascular disease risk factors in HIV patients--association with antiretroviral therapy. Results from the DAD study. AIDS. 2003;17:1179–93. [DOI] [PubMed] [Google Scholar]
- 16.Shlay JC, et al. Long-term body composition and metabolic changes in antiretroviral naive persons randomized to protease inhibitor-, nonnucleoside reverse transcriptase inhibitor-, or protease inhibitor plus nonnucleoside reverse transcriptase inhibitor-based strategy. J Acquir Immune Defic Syndr. 2007;44:506–17. [DOI] [PubMed] [Google Scholar]
- 17.Joly V, et al. Increased risk of lipoatrophy under stavudine in HIV-1-infected patients: results of a substudy from a comparative trial. AIDS. 2002;16:2447–54. [DOI] [PubMed] [Google Scholar]
- 18.da Cunha J, et al. Impact of antiretroviral therapy on lipid metabolism of human immunodeficiency virus-infected patients: Old and new drugs. World J Virol. 2015;4:56–77. [DOI] [PMC free article] [PubMed] [Google Scholar]
- 19.Taramasso L, et al. Weight Gain: A Possible Side Effect of All Antiretrovirals. Open Forum Infect Dis. 2017;4:ofx239. [DOI] [PMC free article] [PubMed] [Google Scholar]
- 20.Keenan AB, et al. A Next Generation Connectivity Map: L1000 Platform and the First 1,000,000 Profiles. Cell. 2017;171:1437–1452 e17. [DOI] [PMC free article] [PubMed] [Google Scholar]
- 22.Talukdar HA, et al. Cross-Tissue Regulatory Gene Networks in Coronary Artery Disease. Cell systems. 2016;2:196–208. [DOI] [PMC free article] [PubMed] [Google Scholar]
- 23.Yu XH, et al. Foam cells in atherosclerosis. Clin Chim Acta. 2013;424:245–52. [DOI] [PubMed] [Google Scholar]
- 24.Lusis AJ. Atherosclerosis. Nature. 2000;407:233–41. [DOI] [PMC free article] [PubMed] [Google Scholar]
- 25.Wilson ME, et al. Estrogen prevents cholesteryl ester accumulation in macrophages induced by the HIV protease inhibitor ritonavir. J Cell Biochem. 2008;103:1598–606. [DOI] [PubMed] [Google Scholar]
- 26.Yoh SM, et al. PQBP1 Is a Proximal Sensor of the cGAS-Dependent Innate Response to HIV-1. Cell. 2015. 1293–305. [DOI] [PMC free article] [PubMed] [Google Scholar]
- 27.Takahashi K, et al. Nematode homologue of PQBP1, a mental retardation causative gene, is involved in lipid metabolism. PLoS One. 2009;4:e4104. [DOI] [PMC free article] [PubMed] [Google Scholar]
- 28.Zhang X, et al. Reduction of the HIV protease inhibitor-induced ER stress and inflammatory response by raltegravir in macrophages. PLoS One. 2014;9:e90856. [DOI] [PMC free article] [PubMed] [Google Scholar]
- 29.Maggi P, et al. Effects of Therapy with Maraviroc on the Carotid Intima Media Thickness in HIV-1/HCV Co-infected Patients. In Vivo. 2017;31:125–131. [DOI] [PMC free article] [PubMed] [Google Scholar]
- 30.Cipriani S, et al. Efficacy of the CCR5 antagonist maraviroc in reducing early, ritonavir-induced atherogenesis and advanced plaque progression in mice. Circulation. 2013;127:2114–24. [DOI] [PubMed] [Google Scholar]
- 31.MacInnes A, et al. Maraviroc can improve lipid profiles in dyslipidemic patients with HIV: results from the MERIT trial. HIV Clin Trials. 2011;12:24–36. [DOI] [PubMed] [Google Scholar]
- 32.Carr A HIV protease inhibitor-related lipodystrophy syndrome. Clin Infect Dis. 2000;30 Suppl 2:S135–42. [DOI] [PubMed] [Google Scholar]
- 33.De Rosa S, et al. HMGA1 is a novel candidate gene for myocardial infarction susceptibility. Int J Cardiol. 2017;227:331–334. [DOI] [PubMed] [Google Scholar]
- 34.Feeney ER et al. HIV and HAART-Associated Dyslipidemia. The Open Cardiovascular Medicine Journal. 2011;5:49–63. [DOI] [PMC free article] [PubMed] [Google Scholar]
- 35.Arae H, et al. Evaluation of the Lipid Concentrations after Switching from Antiretroviral Drug Tenofovir Disoproxil Fumarate/Emtricitabine to Abacavir Sulfate/Lamivudine in Virologically-suppressed Human Immunodeficiency Virus-infected Patients. Intern Med. 2016;55:3435–3440. [DOI] [PMC free article] [PubMed] [Google Scholar]
Associated Data
This section collects any data citations, data availability statements, or supplementary materials included in this article.


