Abstract
Although synapsins regulate GABA release, it is unclear which synapsin isoforms are involved. We identified the synapsin isoforms that regulate GABA release via rescue experiments in cultured hippocampal neurons from synapsin I, II, and III triple knock-out (TKO) mice. In situ hybridization indicated that five different synapsin isoforms are expressed in hippocampal interneurons. Evoked IPSC amplitude was reduced in TKO neurons compared with triple wild-type neurons and was rescued by introducing any of the five synapsin isoforms. This contrasts with hippocampal glutamatergic terminals, where only synapsin IIa rescues the TKO phenotype. Deconvolution analysis indicated that the duration of GABA release was prolonged in TKO neurons and this defect in release kinetics was rescued by each synapsin isoform, aside from synapsin IIIa. Because release kinetics remained slow, whereas peak release rate was rescued, there was a 2-fold increase in GABA release in TKO neurons expressing synapsin IIIa. TKO neurons expressing individual synapsin isoforms showed normal depression kinetics aside from more rapid depression in neurons expressing synapsin IIIa. Measurements of the cumulative amount of GABA released during repetitive stimulation revealed that the rate of mobilization of vesicles from the reserve pool to the readily releasable pool and the size of the readily releasable pool of GABAergic vesicles were unaffected by synapsins. Instead, synapsins regulate release of GABA from the readily releasable pool, with all isoforms aside from synapsin IIIa controlling release synchrony. These results indicate that synapsins play fundamentally distinct roles at different types of presynaptic terminals.
SIGNIFICANCE STATEMENT Synapsins are a family of proteins that regulate synaptic vesicle (SV) trafficking within nerve terminals. Here, we demonstrate that release of the inhibitory neurotransmitter GABA is supported by many different synapsin types. This contrasts with the release of other neurotransmitters, which typically is supported by only one type of synapsin. We also found that synapsins serve to synchronize the release of GABA in response to presynaptic action potentials, which is different from the synapsin-dependent trafficking of SVs in other nerve terminals. Our results establish that different synapsins play fundamentally different roles at nerve terminals releasing different types of neurotransmitters. This is an important clue to understanding how neurons release their neurotransmitters, a process essential for normal brain function.
Keywords: exocytosis, GABA, hippocampus, interneurons, synapsin, synaptic vesicle trafficking
Introduction
Synapsins are key regulators of synaptic vesicle (SV) dynamics in presynaptic terminals (Hilfiker et al., 1999; Rizzoli, 2014; Song and Augustine, 2015). These proteins are known to regulate synaptic transmission by controlling the storage and mobilization of a reserve pool (RP) of SVs (Hilfiker et al., 1999; Gitler et al., 2008; Cesca et al., 2010). Synapsins may also be involved in other stages of SV trafficking, such as regulation of SV fusion with the plasma membrane (Hilfiker et al., 1998, 2005; Humeau et al., 2001; Samigullin et al., 2004) and SV endocytosis (Evergren et al., 2004).
At excitatory synapses of neurons from synapsin I, II, and III triple knock-out (TKO) mice, complete loss of synapsins does not affect synaptic transmission evoked by single stimuli (Gitler et al., 2004a, 2008; Vasileva et al., 2012). However, loss of synapsins does increase the rate of synaptic depression during repetitive activity, whereas overexpression of synapsins slows synaptic depression (Vasileva et al., 2013). These results are consistent with a role for synapsins in regulating the reserve pool of glutamatergic SVs. In contrast, at inhibitory synapses of TKO mice, loss of synapsins reduces the peak amplitude of GABAergic IPSCs evoked by single stimuli, whereas the kinetics of synaptic depression are unaffected (Gitler et al., 2004a, 2008; Medrihan et al., 2013). Loss of synapsins in TKO mice increases dopamine release from dopaminergic terminals but has no effect on the release of serotonin (Kile et al., 2010). Therefore, it appears that synapsins have different roles in terminals that release different types of transmitters and presumably use different types of SVs.
Alternative splicing of the three synapsin genes creates at least five different synapsin isoforms (Südhof et al., 1989; Hosaka and Südhof, 1998; Kao et al., 1999; Porton et al., 1999). Therefore, it is possible that the different roles played by synapsins at different types of presynaptic terminals could be subserved by different synapsin isoforms (Song and Augustine, 2015). Consistent with this possibility, a single synapsin isoform, synapsin IIa, is capable of rescuing the depression phenotype at glutamatergic synapses of cultured hippocampal TKO neurons (Gitler et al., 2008), whereas a different isoform, synapsin IIIa, seems to be involved in regulating dopamine release in striatum (Kile et al., 2010).
The synapsin isoform(s) involved in regulation of GABA release at inhibitory synapses is less clear. GABAergic transmission has been examined in knock-out mice deficient in synapsin I (Terada et al., 1999; Baldelli et al., 2007), synapsin II (Medrihan et al., 2013), or synapsin III (Feng et al., 2002). However, interpretation of these experiments is complicated by the presence of multiple synapsin genes: if only one or two of the three synapsin genes are deleted, then the remaining gene products may compensate for the missing isoforms. Further, deletion of a gene will eliminate all splice variants associated with that gene, possibly masking different actions of the isoforms produced by that gene. For these reasons, the roles of individual synapsin isoforms at inhibitory synapses have not yet been defined.
Here, we have examined the functions of individual synapsin isoforms in cultured hippocampal interneurons from synapsin TKO mice by examining the ability of each isoform to rescue the defects in GABAergic transmission caused by loss of synapsins. We found that all synapsin isoforms can regulate the amplitude of IPSCs at GABAergic synapses. However, there are differences in the ability of synapsins to synchronize quantal discharge from the readily releasable pool (RRP): although most isoforms can synchronize GABA release, synapsin IIIa is unique because it is unable to synchronize GABA release yet does enhance the total number of quanta released. Therefore, synapsins have unique roles in regulation of GABA vesicle trafficking relative to trafficking of glutamatergic and dopaminergic SVs.
Materials and Methods
In situ hybridization.
To examine the expression of synapsin isoforms in hippocampal interneurons, we performed in situ hybridization (ISH) based on the procedures of Schaeren-Wiemers and Gerfin-Moser (1993). In brief, digoxigenin-labeled cRNA probes designed to distinguish each synapsin isoform were used for ISH on cryostat sections (14 μm thick) of hippocampal tissue from wild-type mice at postnatal day 50 (P50) to P60 (both male and female). Riboprobes were designed based on sequences within the unique domains of each isoform and antisense digoxigenin riboprobes were generated according to the recommendations of the manufacturer (Roche Diagnostics). Riboprobes were designed from Mus musculus synapsins; from bases 2110–2490 of synapsin I variant la [National Center for Biotechnology Information (NCBI) accession no.: NM_013680.4,GI:160707900], bases 1875–2385 of synapsin I variant lb (NCBI accession no.: NM_001110780.1, GI:160707902), bases 1443–2041 of synapsin II variant lla (NCBI accession no.: NM_001111015.1 GI:161168986), bases 1551–2160 of synapsin II variant llb (NCBI accession no.: NM_013681.3 GI:557357673), and bases 1461–2135 of synapsin III variant IIIa (NCBI accession no.: NM_013722.3 GI:256985122). All image processing and analysis was done with ImageJ software.
To examine the specificity of our probes, we expressed GFP-tagged synapsin isoforms (syns) individually in HEK293 cells (Fig. 1A1). Successful ISH could be detected as a blue reaction product against cellular mRNA in these cells (Fig. 1A2). To determine whether this product was found in cells expressing synapsins, we segmented the ISH images based on thresholds for signal intensity and minimum area (orange areas in Fig. 1A3) and merged the segmented images with images of GFP–synapsin fluorescence (Fig. 1A4). The example shown in Figure 1A4 shows a good correlation between the location of cells labeled by the synapsin Ia riboprobe and expression of GFP-synapsin Ia (yellow), aside from a small number of cells in which very intense ISH caused the blue reaction product to quench GFP fluorescence (orange). In contrast, labeling was absent from HEK cells expressing any of the other four synapsin isoforms (Fig. 1B). This indicates good isoform specificity for this synapsin Ia probe. Similar analyses were done for riboprobes for all five synapsin isoforms (Fig. 1C). For every probe, virtually all labeling was restricted to cells expressing the synapsin isoform used to generate the probe; labeling of cells expressing off-target isoforms was nearly undetectable. This indicates good labeling specificity for all five riboprobes used in our analysis of synapsin isoform expression in mouse hippocampal tissue.
Figure 1.
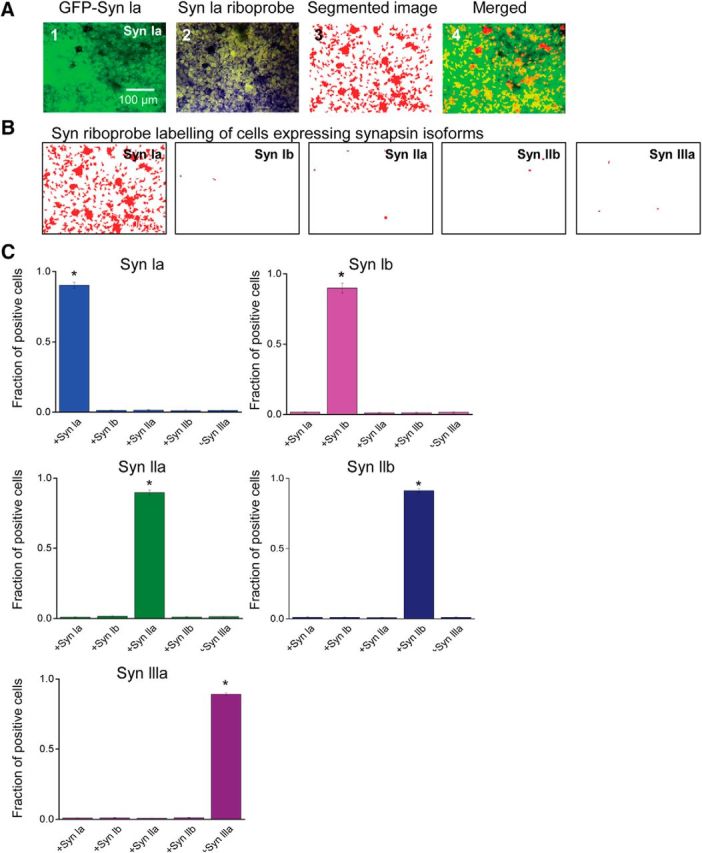
Specificity of riboprobes for ISH. A, Detection of labeling. A1, Expression of GFP-tagged synapsin Ia in HEK 293T cells. A2, ISH (blue color) with the synapsin Ia riboprobe for the same field shown in A1. A3, Image shown in A2 was segmented (orange) by using intensity and area thresholds to define locations where ISH occurs. Segmented image from A3 was merged with the fluorescence image from A1, revealing that ISH occurred in nuclei of cells expressing synapsin Ia. B, A synapsin Ia riboprobe was used to probe HEK cells expressing the indicated synapsin isoforms and segmented images, as in A3, were used to visualize ISH. Only cells expressing synapsin Ia exhibited appreciable ISH, demonstrating the specificity of the synapsin Ia probe. C, ISH data were analyzed by counting the number of cells with positive nuclear signals. Each synapsin riboprobe significantly labeled only cells expressing the cognate synapsin isoform, validating the specificity of each riboprobe. Asterisks indicate p < 0.05 by t test or ANOVA with Holm–Bonferroni post hoc test.
Hippocampal neuron culture.
Homozygous synapsin TKO mice and matching triple wild-type (TWT) mice were derived by serial breeding of the mice described in Gitler et al. (2004a). Hippocampal neurons were cultured from newborn pups (P0–P2) as described in Banker and Goslin (1984). Dissociated neurons were plated on 18-mm-diameter coverslips coated with poly-d-lysine (1 mg/ml). Cultures were grown in Neurobasal medium (Invitrogen) supplemented with B27 (Invitrogen) and 0.5 mm l-glutamine. Neurons were allowed to mature for 13–18 d before being used for electrophysiological analyses. Such cultures represent a heterogeneous mixture of projection neurons and interneurons (Bi and Poo, 1998).
Lentiviral vectors.
Synapsins were subcloned from pEGFP, pEYFP, or pECFP vectors (Gitler et al., 2004b) into the pFUGW plasmid (Lois et al., 2002), which was constructed by inserting the following into the multicloning site of HR'CS-G (vector backbone from I. Verma, Salk Institute): HIV-1 flap sequence, amplified by PCR from the HIV NLA4.3 genome, the human polyubiquitin promoter-C (gift from L. Thiel, Amgen), the EGFP gene, and the Woodchuck hepatitis virus posttranscriptional regulatory element WRE. The inserted genes were confirmed via sequencing. Lentivirus was prepared as described in Lois et al. (2002) and Gitler et al. (2008). Neurons were infected 11–14 d after plating and analyzed 2 d after infection.
Expression of each synapsin isoform in TKO neurons was examined in several ways. First, the efficacy of expression of each synapsin isoform was quantified by comparing the localization of the GFP tag with the distribution of vesicular GABA transporter (VGAT), a marker of GABA-containing SVs (Fig. 2A; Chaudhry et al., 1998). Immunocytochemical visualization of VGAT showed that ∼95% of VGAT-positive inhibitory synapses colocalized with the GFP tag for each synapsin isoform. Further, comparison of GFP fluorescence intensity for these inhibitory synapses showed that the level of presynaptic expression was very similar for all synapsin isoforms (Fig. 2B).
Figure 2.
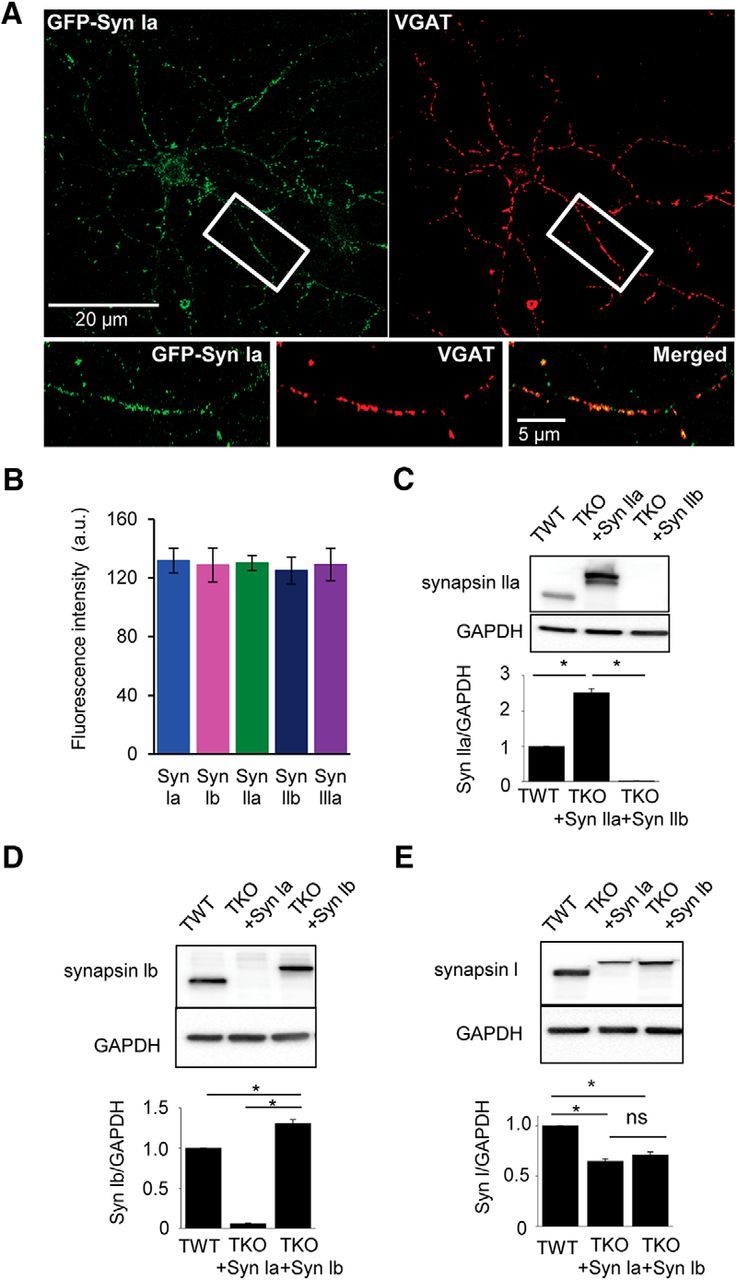
Expression of synapsin isoforms in cultured hippocampal neurons. A, TKO neurons expressing GFP-synapsin Ia (green) were stained with anti-VGAT antibody (red) to define GABAergic presynaptic terminals. Region indicate by white rectangle is enlarged below, with merged image (right) illustrating colocalization (yellow) of synapsin Ia and VGAT. B, Quantification of GFP fluorescence in inhibitory synaptic boutons (defined by VGAT staining) from neurons expressing GFP-tagged versions of each synapsin isoform. Number of cells: synapsin Ia (8), synapsin Ib (8), synapsin IIa (5), synapsin IIb (7), and synapsin IIIa (6). C–E, Western blot analysis of endogenous synapsin expression in TWT neurons and exogenous synapsin expression in TKO neurons infected with virus expressing indicated synapsin isoforms. Antibodies against synapsin IIa (C), synapsin Ib (D), and synapsin I (E) were used in Western blots (top) to quantify antibody labeling (bottom). Labeling was normalized by levels of GAPDH as a loading control. Values indicate means ± SEM, with n = 5 for each measurement. Asterisks indicate statistical significance (p < 0.05) by t test or ANOVA with Holm–Bonferroni post hoc test.
To compare the expression of synapsins expressed in TKO neurons with the levels of endogenous synapsins in TWT neurons, we used a variety of anti-synapsin antibodies for Western blot analyses. An anti-synapsin IIa antibody (gift from Paul Greengard) indicated that levels of virally expressed synapsin IIa were ∼2.5 times as high as the level of endogenous synapsin IIa (Fig. 2C; n = 5, p < 0.05, unpaired t test). Similarly, an anti-synapsin Ib antibody (gift from Paul Greengard) indicated that levels of exogenous synapsin Ib were ∼30% greater than endogenous synapsin Ib (Fig. 2D; n = 5, p < 0.05, unpaired t test). A pan-synapsin I antibody (1925-SYNP; Phosphosolutions) revealed that levels of synapsin Ia and Ib expression in TKO neurons each were less than the combined expression of synapsin Ia and Ib in TWT neurons (Fig. 2E). The measurements of synapsin Ib expression shown in Figure 2D allowed us to determine that endogenous synapsin Ia and Ib contribute in approximately equal amounts to the synapsin I signal measured in TWT neurons (Fig. 2E), so that exogenous synapsin Ia in TKO neurons was ∼40% greater than that of endogenous synapsin Ia in TWT neurons. Although we were unable to measure the expression of synapsin IIb or synapsin IIIa directly, it has been reported that synapsin IIIa expression in cultured hippocampal neurons at 15 d in vitro is similar to that of synapsin IIa (Ferreira et al., 2000). Given that all exogenous synapsins are expressed at similar levels in TKO neurons (Fig. 2B) and that exogenous synapsin IIa is 2.5 times as high as endogenous synapsin IIa (Fig. 2C), we deduce that the level of expression of exogenous synapsin IIIa in TKO neurons is also ∼2.5 times the level of endogeneous synapsin IIIa in TWT neurons. In summary, measured levels of exogenous synapsin isoforms were ∼1.3- to 2.5-fold greater than endogenous synapsins in TWT neurons, indicating mild overexpression in virally infected TKO neurons.
Electrophysiology.
Whole-cell patch-clamp recordings were made from cultured hippocampal neurons, as described in Maximov et al. (2007). Patch pipettes (4–5 MΩ) were filled with intracellular solution containing the following (in mm): 140 CsCl, 4 NaCl, 0.5 CaCl2, 5 EGTA, 2 MgATP, 0.4 Na3GTP, 10 HEPES-KOH, and 10 QX-314, pH 7.4, adjusted with CsOH. The extracellular solution contained the following (in mm): 150 NaCl, 3 KCl, 2 CaCl2, 2 MgCl2, 20 d-glucose, and 10 HEPES-NaOH, pH 7.3. Neurons were voltage clamped at −70 mV with an EPC-9D amplifier (HEKA). To minimize series resistance errors (Marty and Neher, 1995), IPSC measurements were only accepted for analysis when series resistance was <20 MΩ. All recordings were made at room temperature (21–25°C).
Presynaptic inputs were stimulated with a concentric bipolar electrode (FHC) that was placed within 100–150 μm of the neuron that was being recorded from and was used to apply brief current pulses (0.5 ms). Extracellular stimuli were generated by a Grass Instruments S48 stimulator with a SIU5 stimulation isolation unit (Grass Instruments). Increasing the amplitude of the extracellular stimulus increased IPSC amplitude by recruiting larger numbers of interneurons (Maximov et al., 2007). To make it possible to compare IPSC amplitudes across experiments, we used the “minimal stimulation” technique that has been used widely in hippocampal slice experiments (Stevens and Wang, 1995; Isaac et al., 1996). This strategy seemed quite effective: IPSC amplitudes were relatively consistent in each genotype and even across genotypes (see Fig. 5B below) aside from the smaller IPSCs expected for TKO neurons (Gitler et al., 2004a). Electrophysiological data were sampled at 25 kHz and low-pass filtered at 10 kHz. Evoked IPSCs (eIPSCs) were pharmacologically isolated by adding the AMPA receptor blocker CNQX (20 μm) and the NMDA receptor blocker APV (50 μm) to the extracellular solution. For measuring each IPSC evoked by a train of stimuli, the baseline was defined as the final current level measured during the preceding event (Gitler et al., 2004a).
Figure 5.
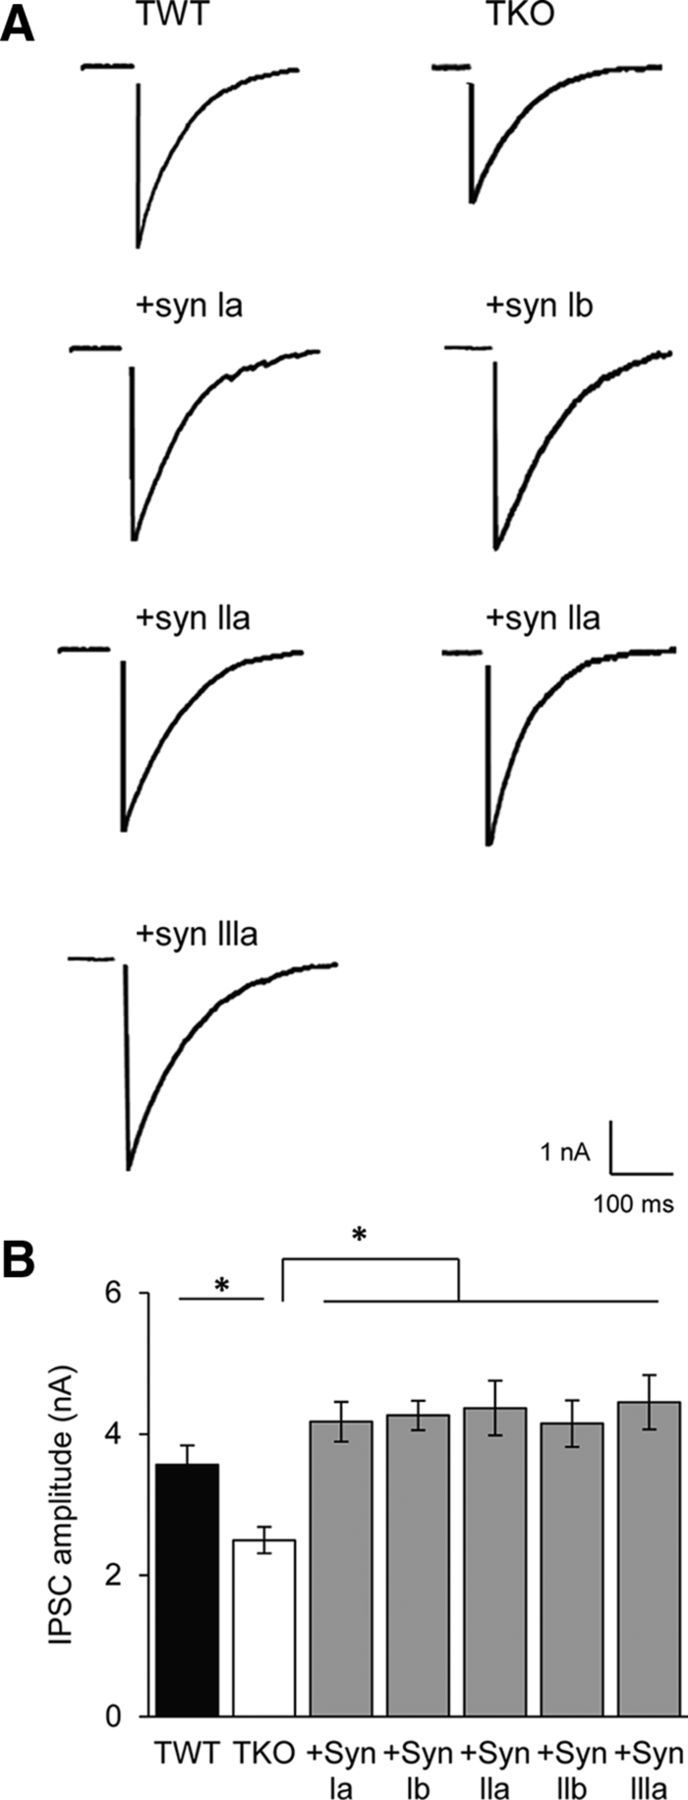
Synapsins rescue amplitude of eIPSCs in TKO neurons. A, Representative eIPSCs (single trials) recorded from TWT and TKO neurons, as well as from TKO neurons expressing indicated synapsin isoforms. Stimulus artifact has been blanked for clarity. B, Mean amplitudes of evoked IPSCs in TWT (black, n = 14) and TKO neurons (white, n = 14), as well as in TKO neurons expressing indicated synapsin isoforms (shaded). TKO and TWT data were compared with unpaired t test, whereas the rest were compared by ANOVA with Holm–Bonferroni post hoc test; asterisks indicate significant differences (p < 0.05). Sample sizes for each isoform are as follows: synapsin Ia (15), Ib (25), IIa (14), IIb (17), and IIIa (19).
Spontaneous miniature IPSCs (mIPSCs) were recorded in the presence of tetrodotoxin (1 μm) to block action potentials and were semiautomatically analyzed offline using the MiniAnalysis program (Synaptosoft). mIPSCs were defined as events exceeding an amplitude threshold of 5 pA and rise time <3 ms. Events were also verified by visual inspection before inclusion in the dataset. Statistical analyses used are described in the text. Error bars shown in the figures indicate the SEM.
To determine the time course and magnitude of quantal transmitter release during eIPSCs, we used the deconvolution technique of van der Kloot (1988) (see also Nishiki and Augustine, 2004). In brief, for a given eIPSC, the number of quantal release events at time t, n(t), was calculated as follows:
 |
where Δt is the time interval of the measurement (1 ms), I(t) is the amplitude of an eIPSC at time t, τ is the time constant of decay of mIPSCs, and i is the mean amplitude of mIPSCs recorded from the same postsynaptic neuron.
Statistics.
Data are presented as means ± SEM. Origin (OriginLab) or Prism 7 (GraphPad) software were used for all statistical analyses. For each set of data to be compared, we used the Kolmogorov–Smirnov test to determine whether data were normally distributed. All datasets were normally distributed, permitting the use of nonparametric statistical tests. Differences between the TWT and TKO group means were assessed with an unpaired Student's t test. Differences between TKO neurons expressing different exogenous synapsin isoforms were assessed by using a one-way ANOVA to determine whether there were any significant differences between groups, followed by the post hoc Holm–Bonferroni method, which allows multiple comparisons while correcting for familywise error rates (Holm, 1979). Differences were considered statistically significant if p < 0.05.
To provide a more reliable measure of mean values for the rate constants in Figure 10C, we calculated harmonic means (H):
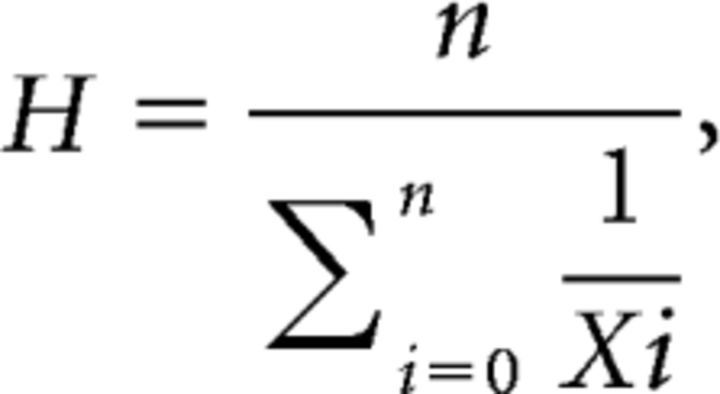 |
where xi indicates rate constant determined in a given experiment and n is the number of experiments. The standard error of H (SEMH) was then estimated as:
 |
where the reciprocal standard deviation, SDR, is the standard deviation of 1/xi (Norris, 1940).
Figure 10.
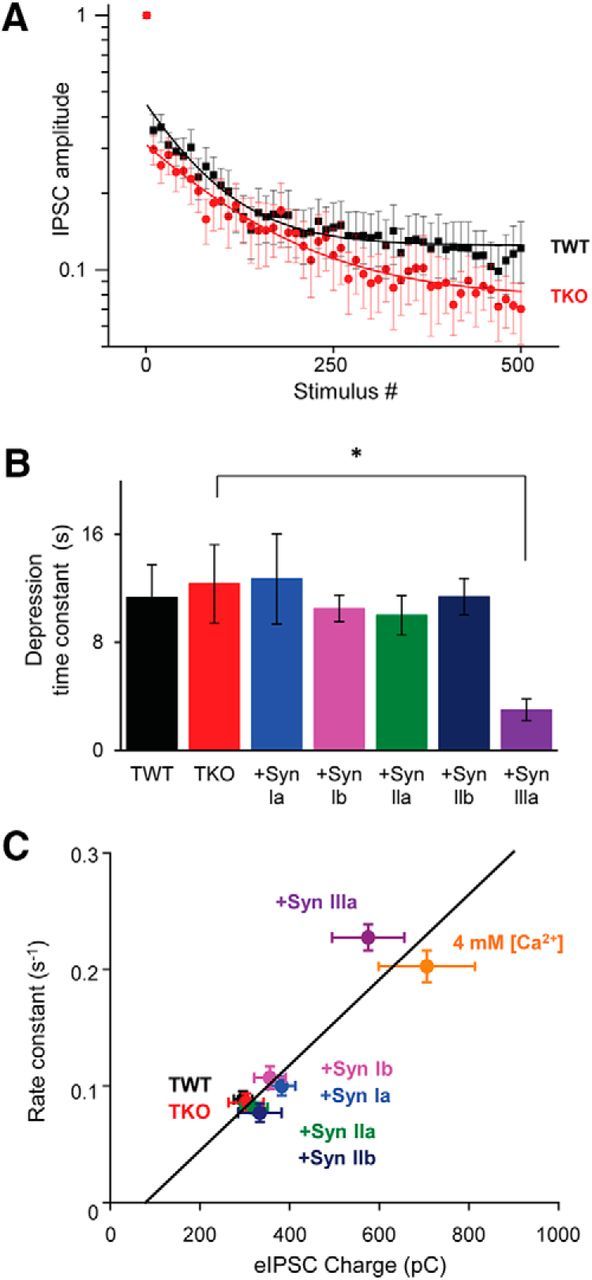
Synapsin IIIa accelerates synaptic depression. Time courses of synaptic depression at inhibitory synapses activated by trains of 500 stimuli applied at 10 Hz are shown. A, Depression of eIPSC amplitudes during the stimulus trains; amplitude of every tenth eIPSC is plotted. B, Mean time constant of depression in TWT and TKO neurons, as well as in TKO neurons expressing indicated synapsin isoforms. Depression was significantly faster in TKO neurons expressing synapsin IIIa. Statistical comparisons were done with ANOVA, followed by Holm–Bonferroni post hoc test; asterisks indicate significant differences (p < 0.05). C, Correlation (r2 = 0.91) between rate of depression and the amount of transmitter release, as measured by eIPSC charge. Points indicate mean values ± SEM for indicated genotypes, as well as TWT neurons exposed to high (4 mm) external Ca2+. Sample sizes are as follows: TWT (12), TKO (10), synapsin Ia (13), synapsin Ib (11), synapsin IIa (17), synapsin IIb (10), synapsin IIIa (17), and TWT in 4 mm [Ca2+] (14).
Results
Expression of synapsin isoforms in hippocampal interneurons
Before analyzing the ability of synapsin isoforms to rescue defects in GABA release in cultured hippocampal interneurons, we first determined which synapsin isoforms are found in these interneurons. For this purpose, we used ISH to analyze synapsin isoform expression in hippocampal sections from mouse brain, taking advantage of the favorable anatomy of the hippocampus: interneurons are virtually excluded from the pyramidal and granule cell layers (Buckmaster and Soltesz, 1996; Freund and Buzsáki, 1996) and glutamatergic neurons likewise are virtually excluded from the other layers within the hippocampus (Lorente de Nó, 1934; Corsellis and Bruton, 1983; Ishizuka et al., 1995; Megias et al., 2001). [The giant glutamatergic neurons in the stratum radiatum described by Gulyás et al. (1998) represent <5% of neurons in this layer, based on our analysis of Vglut1 and Gad67 expression data in the Allen Brain Atlas; http://mouse.brain-map.org.] To define interneurons, we used a probe directed against GAD67, a standard marker of GABAergic interneurons (Jin et al., 2003). This probe labeled the cellular mRNA of many interneurons throughout the hippocampus. As expected, labeling was absent in the CA pyramidal cell layers and granule cell layer of the dentate gyrus, but was abundant in other layers such as stratum oriens, stratum lucidum, and stratum lacunosum-moleculare, where interneurons are known to be present (Fig. 3A). By counting the number of GAD67-positive cells in hippocampal regions, excluding the CA pyramidal cell layers and dentate gyrus, we determined that there were ∼170 interneurons in our typical hippocampal section (Fig. 3B).
Figure 3.
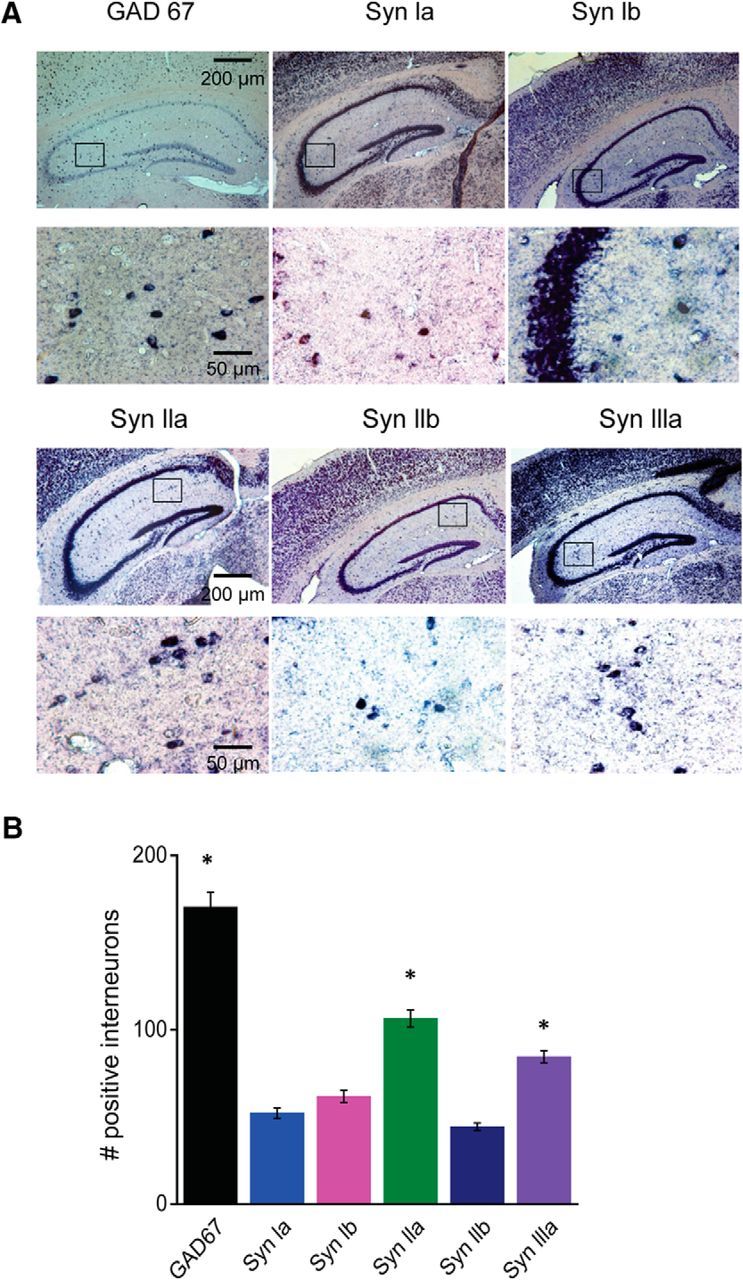
Expression of synapsin isoforms in hippocampal interneurons. A, Representative ISH images from mouse hippocampal sections using the indicated riboprobes. Top rows of images were taken at low magnification, whereas bottom rows show high-magnification images taken from the areas indicated by rectangles in the low-magnification images. B, Quantification of labeling of interneurons by the indicated riboprobes. Interneurons were identified by their location outside of pyramidal cell or granule cell layers. The GAD67 and synapsin IIa and synapsin IIIa groups are significantly different from each other and from the other groups (asterisks indicate p < 0.05 by ANOVA with Holm–Bonferroni post hoc test). Values indicate mean number (±SEM) of labeled cells per section. Number of sections are as follows: GAD67 (10), synapsin Ia (16), synapsin Ib (16), synapsin IIa (21), synapsin IIb (14), and synapsin IIIa (17), taken from six different mouse brains.
We next used the synapsin-specific riboprobes described in the Materials and Methods section to analyze the patterns of expression of the five synapsin isoforms. In addition to abundant labeling in pyramidal cell layers (Fig. 3A, top rows), each synapsin probe also labeled hippocampal interneurons within the other layers (Fig. 3A, bottom rows). Comparing results across synapsin probes, the number of labeled interneurons varied for different probes (Fig. 3B). Comparing the number of synapsin-expressing cells with the number of GAD67-expressing cells measured in different tissue sections, it appeared that synapsin IIa and synapsin IIIa probes each labeled ∼50% of the interneurons and the other probes labeled at least 25% (Fig. 3B). These results indicate that hippocampal interneurons collectively express all synapsin isoforms.
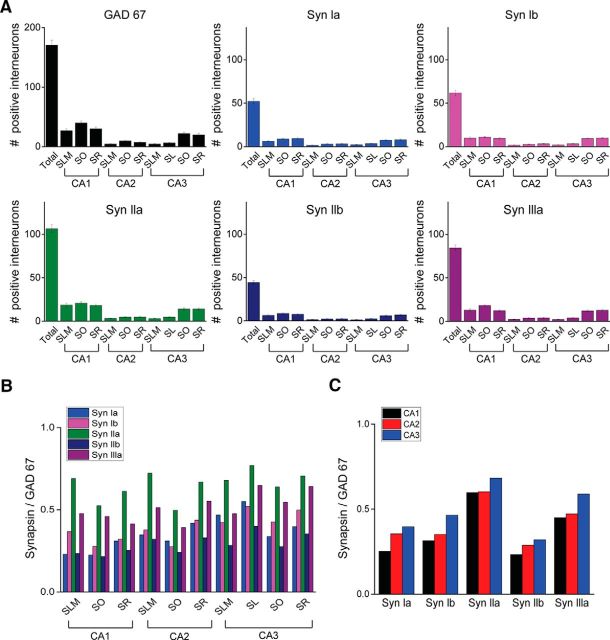
We further characterized the expression of synapsin isoforms within interneurons in different hippocampal subregions. The number of GAD67-expressing interneurons varied between regions and layers, with the largest number of labeled interneurons found in the various layers of CA1 (Fig. 4A). There was a similar variation in the pattern of synapsin isoform labeling within these interneurons (Fig. 4A), although there were quantitative differences that could be discerned by calculating the ratio of number of nuclei labeled by each synapsin riboprobe relative to the number labeled by the GAD67 probe. Although these ratios differed for each isoform, the overall pattern of expression was relatively consistent across interneurons in many hippocampal regions (Fig. 4B). In all subregions, this ratio was highest for synapsin IIa and typically was lowest for synapsin IIb (Fig. 4C).
Figure 4.
Distribution of synapsin expression in hippocampal interneurons. A, Labeling of interneurons in indicated regions with indicated riboprobes. Values indicate mean number (±SEM) of labeled cells per section. Note change in y-axis scale between GAD67 and synapsin probes. B, C, Synapsin isoform expression was normalized by GAD67 expression and compared across the indicated hippocampal regions. DG, Dentate gyrus; SLM, stratum lacunosum-moleculare; SO, stratum oriens; SR, stratum radiatum; SL, stratum lucidum.
Rescue of IPSC amplitude by synapsin isoforms
In microisland cultures of hippocampal interneurons from synapsin TKO mice, the peak amplitude of evoked IPSCs is reduced compared with TWT neurons (Gitler et al., 2004a). To identify the synapsin isoform(s) involved in regulation of GABA release, we determined which synapsin isoforms could rescue this physiological phenotype. For this purpose, conventionally cultured hipocampal neurons (Banker and Goslin, 1984) were infected with lentivirus encoding GFP-tagged versions of each synapsin isoform (Gitler et al., 2008). Previous work has established that GFP-tagged synapsins appear to function normally in regard to synaptic targeting (Gitler et al., 2004b), phosphorylation by protein kinases (Chi et al., 2003), and partial rescue of the phenotype of glutamatergic synapses of cultured hippocampal neurons (Gitler et al., 2008). The data shown in Figure 3 (see Materials and Methods) indicate that virtually all of the cultured interneurons expressed synapsins after viral infection and the level of synapsin expression was similar for all isoforms. This information enables straightforward interpretation of synaptic responses evoked by stimulation of these neurons.
To measure GABAergic synaptic transmission, we used whole-cell patch-clamp recordings to measure IPSCs evoked in one cultured neuron when neighboring neurons were minimally stimulated (see Materials and Methods) with an extracellular electrode. Glutamate receptor antagonists were used to eliminate excitatory responses, allowing measurement of IPSCs in isolation (Maximov et al., 2007). Consistent with previous results in microisland cultures (Gitler et al., 2004a), the peak amplitude of eIPSCs was significantly reduced in TKO neurons compared with TWT neurons (Fig. 5A, top row). On average, eIPSCs of TKO neurons were ∼30% smaller in peak amplitude (Fig. 5B). Remarkably, GABAergic synaptic transmission was rescued when any synapsin isoform was expressed in TKO neurons (Fig. 5A). Peak eIPSC amplitude in neurons expressing any one of the synapsin isoforms was significantly larger than that of TKO neurons and was comparable to that measured in control TWT neurons (Fig. 5B). This result indicates that each synapsin isoform can regulate GABA release, which is quite different from the case of cultured hippocampal glutamatergic neurons, in which only synapsin IIa causes a significant degree of rescue (Gitler et al., 2008).
Synapsins regulate IPSC kinetics differentially
Synapsins can influence the kinetics of glutamate release (Hilfiker et al., 1998, 2005; Humeau et al., 2001) and a recent study has indicated that this may also be the case for GABA release (Medrihan et al., 2013). We therefore examined IPSC kinetics in TWT and TKO neurons, as well as in neurons expressing individual synapsin isoforms. Although the rise time of eIPSCs was similar in TKO and TWT neurons, the decay of eIPSCs was prolonged in TKO neurons (Fig. 6A). This prolongation of eIPSC decay was most evident when eIPSCs were scaled to the same peak amplitude to take into account the reduction in peak amplitude observed in TKO neurons (Fig. 6A, right). Quantification indicated that eIPSC rise time was unaffected in TKO neurons (Fig. 6B) and these neurons exhibited a selective slowing of eIPSC decay (Fig. 6C). Although eIPSCs were smaller in TKO neurons, the slowing of eIPSC decay caused the total charge of eIPSCs to be identical in TWT and TKO neurons (Fig. 6D).
Figure 6.
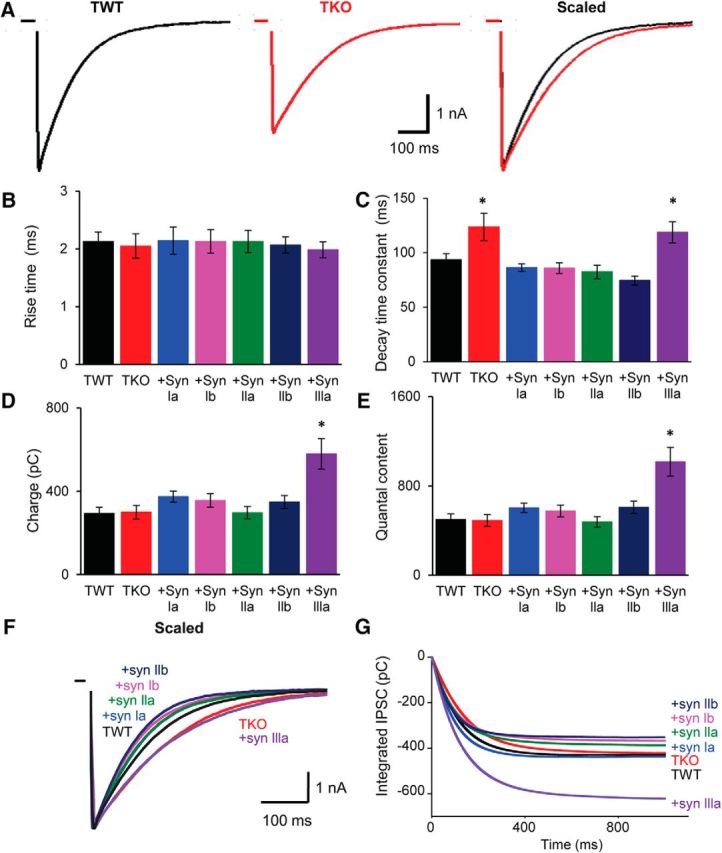
eIPSC kinetics are regulated by synapsins. A, Evoked IPSCs recorded from TWT and TKO neurons. Superimposed, scaled traces at right illustrate different decay kinetics for eIPSCs from TWT and TKO neurons. Traces represent averaged eIPSCs from 14 TWT neurons and 14 TKO neurons. B, C, Mean rise times (20–80%) and decay time constants measured for eIPSCs in TWT and TKO neurons, as well as in TKO neurons expressing indicated synapsin isoforms. eIPSC decay was prolonged in TKO neurons, as well as in TKO neurons expressing synapsin IIIa. D, Mean eIPSC charge for TWT and TKO neurons, as well as TKO neurons expressing indicated synapsin isoforms. E, Mean quantal content of eIPSCs in TWT and TKO neurons, as well as TKO neurons expressing indicated synapsin isoforms. F, Averaged and normalized eIPSC traces from neurons of the indicated genotypes. G, Integrated eIPSCs calculated from traces in F. For B–E, statistical comparisons were done with ANOVA, followed by Holm–Bonferroni post hoc test; asterisks indicate significant differences (p < 0.05). Number of cells used to generate data in B–G: TWT (14), TKO (14), synapsin Ia (15), synapsin Ib (25), synapsin IIa (14), synapsin IIb (17), and synapsin IIIa (19).
We next investigated which synapsin isoforms rescued the retardation of eIPSC decay observed in TKO neurons. Synapsin Ia, synapsin Ib, synapsin IIa, and synapsin IIb were each capable of restoring the rapid decay of eIPSCs (Fig. 6C,F). In TKO neurons expressing each of these isoforms, eIPSC decay constants were not significantly different from those measured in TWT neurons (Fig. 6C). eIPSC rise time also was not different across all genotypes (Fig. 6B). Because the rescue of faster eIPSC decay rate (Fig. 6C) was accompanied by rescue of larger eIPSC peak amplitude (Fig. 5B), the eIPSC charge (Fig. 6D,G) was similar in TKO neurons expressing any of these four synapsin isoforms. Therefore, these four synapsin isoforms completely restored eIPSCs to wild-type amplitudes and time courses.
However, inhibitory synaptic transmission was different in TKO neurons expressing synapsin IIIa. In these neurons, eIPSC decay remained slow, similar to the rate of decay measured in TKO neurons not expressing any synapsins (Fig. 6C,F). Therefore, synapsin IIIa does not rescue this aspect of the TKO phenotype. Because the peak amplitude of eIPSCs was rescued by synapsin IIIa (Fig. 5B), the eIPSC charge (Fig. 6D,G) was significantly larger for these neurons than for any other genoype. These results indicate a difference between synapsin IIIa and other synapsin isoforms in the ability to rescue the GABAergic phenotype of synapsin TKO interneurons.
Synapsins regulate presynaptic GABA release
In principle, differences in IPSC decay kinetics observed with genetic manipulations of synapsins could result from either presynaptic or postsynaptic factors. We therefore next examined the properties of mIPSCs, quantal events with properties that can distinguish between presynaptic and postsynaptic mechanisms (Fatt and Katz, 1952). Spontaneous mIPSCs were examined in the presence of tetrodotoxin to prevent spontaneous action potentials, as well as glutamate receptor antagonists to eliminate miniature EPSCs. Such recordings revealed that mIPSC properties were relatively similar in each experimental group (Fig. 7A). Although the frequency of mIPSCs was not significantly different between TWT and TKO neurons (Fig. 7B), expression of each synapsin isoform in TKO neurons caused a small increase in mIPSC frequency that was not statistically significant (Fig. 7B; p > 0.05). The mean amplitude of mIPSCs was not different for any genotype (Fig. 7C) and mIPSC rise (Fig. 7D) and decay times (Fig. 7E) were also similar in each case. These data are consistent with the conclusion that the observed changes in eIPSCs arise from a presynaptic locus of action, rather than from changes in postsynaptic properties.
Figure 7.
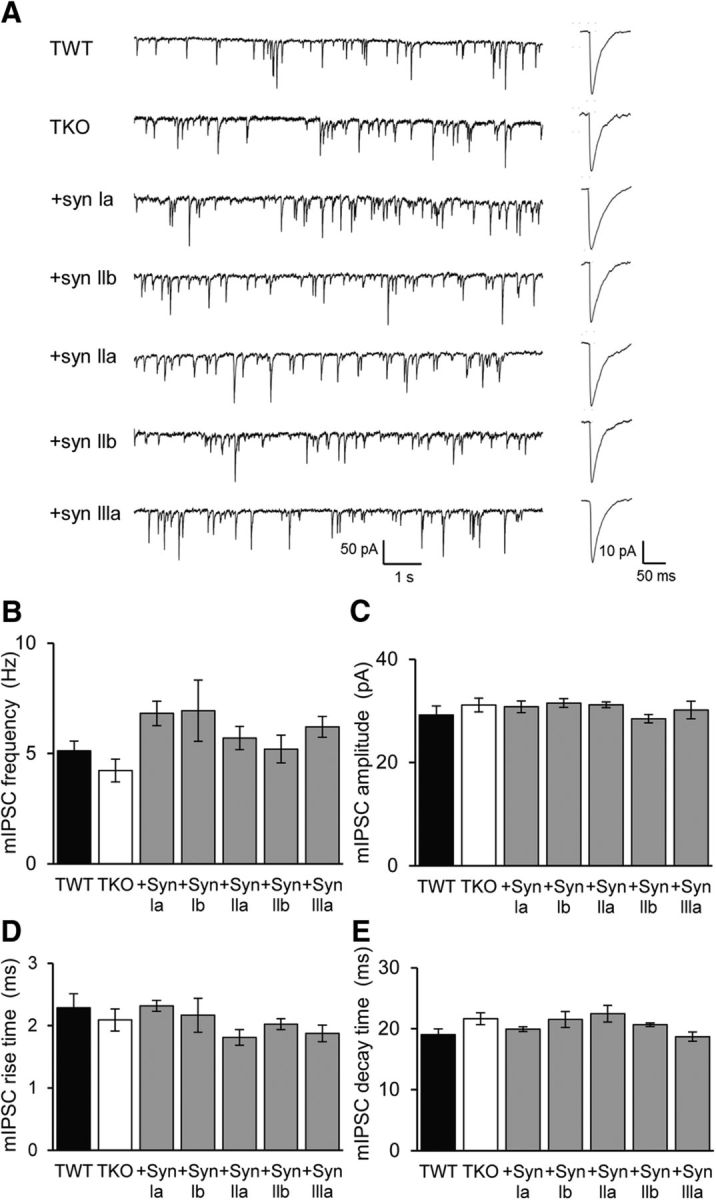
Properties of mIPSCs. A, Left, representative traces of mIPSCs recorded in TWT and TKO neurons, as well in TKO neurons expressing indicated synapsin isoforms. Right, Averaged mIPSCs. In each case, mIPSCs were sampled for 60 s. B, Mean mIPSC frequency of TWT (black, n = 15) and TKO (white, n = 12) neurons, as well as TKO neurons expressing indicated synapsin isoforms (shaded). Sample sizes for each isoform are: synapsin Ia (20), synapsin Ib (11), synapsin IIa (11), synapsin IIb (25), and synapsin IIIa (15). C–E, Effects of synapsin isoforms on amplitude (C), rise time (D), and decay time (E) of mIPSCs. For B–E, statistical comparisons were done with ANOVA, followed by Holm–Bonferroni post hoc test; there were no significant differences (p > 0.05).
Determination of mIPSC properties allowed us to calculate the quantal content, a measure of presynaptic release properties (del Castillo and Katz, 1954) that can be defined in our situation as the ratio of eIPSC charge to mIPSC charge. The quantal content of eIPSCs was the same in TWT and TKO neurons (Fig. 6E). Therefore, there was no net change in the total amount of GABA released in response to a presynaptic action potential. Further, the quantal content was similar for TKO neurons expressing each synapsin isoform (Fig. 6E), except for synapsin IIIa, where the quantal content was approximately twice as high due to the slow eIPSC decay (Fig. 6C) and attendant increase in eIPSC charge (Fig. 6D).
Synapsins regulate rates of GABA release
The fact that loss of synapsins in TKO neurons slows the time course of decay of eIPSCs (Fig. 6A,C), but not the decay of mIPSCs (Fig. 7E), indicates a slowing of the time course of evoked transmitter release (Diamond and Jahr, 1995). To quantify the influence of synapsins on the kinetics of GABA release, we applied deconvolution analysis. This analysis uses eIPSC properties to determine precisely the time course and magnitude of quantal transmitter release in response to a presynaptic action potential, provided that the amplitude and time course of the underlying unitary quantal events (mIPSCs) are known (Van der Kloot, 1988; Diamond and Jahr, 1995; Vorobieva et al., 1999; Neher and Sakaba, 2001; Hefft and Jonas, 2005). We used the deconvolution technique of van der Kloot (1988) (see also Nishiki and Augustine, 2004) to compare release rates during eIPSCs in TWT and TKO neurons. This analysis revealed that the peak rate of GABA release was lower in TKO neurons (Fig. 8A, left), accounting for the reduced peak amplitude of eIPSCs in these cells (Fig. 5B). In addition, the timing of GABA release was desynchronized in TKO neurons compared with TWT, with a prolonged enhancement of GABA release lasting up to several hundred milliseconds after a stimulus (Fig. 8A). Integration of release rates over time revealed the total amount of GABAergic quanta released in response to a stimulus. In both genotypes, integrated release was an exponential process (Fig. 8B), with a significantly slower rate constant for TKO neurons (Fig. 8C). This desynchronization of GABA release accounts for the observed differences in eIPSC decay between the two genotypes (Fig. 6C). The desynchronization of release also causes the total amount of GABA release to be very similar in both genotypes (Fig. 8B,D). This can explain the similar quantal contents for eIPSCs in the two genotypes (Fig. 6E).
Figure 8.
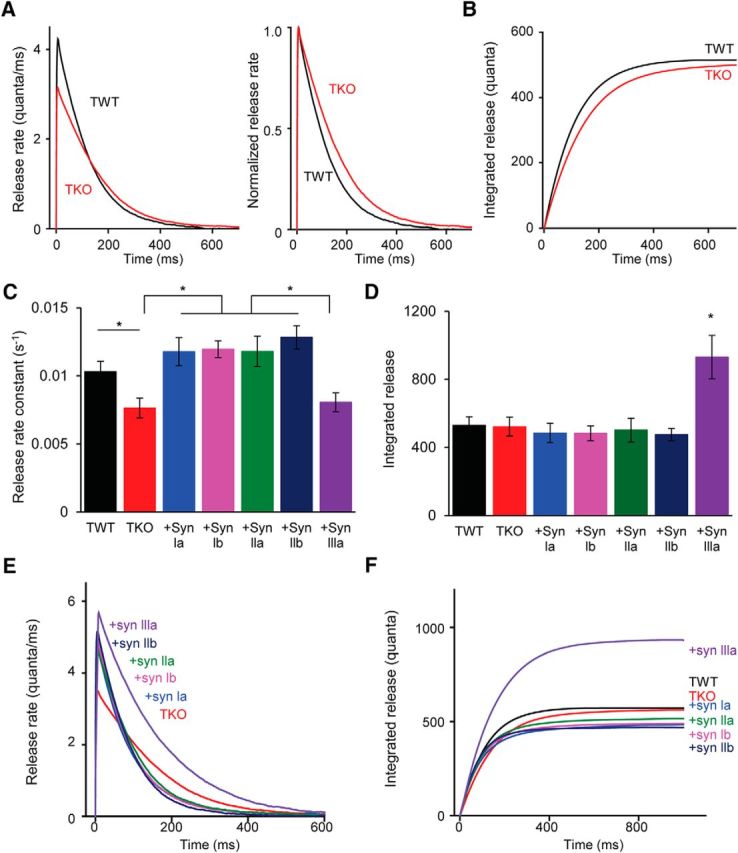
Synapsins influence the rate of quantal GABA release. A, Deconvolution analysis was used to determine rate of quantal release from average eIPSC waveforms. Left, Release rates for TWT and TKO neurons. Right, Same as left but scaled to the same maxima and superimposed. B, Integrals of release rate plots shown at left of A. C, Mean release rate constants for integrated release were determined for indicated genotypes. Release rate constants were prolonged in TKO neurons, as well as in TKO neurons expressing synapsin IIIa. D, Integrated amount of release for indicated isoforms. For C and D, asterisks indicate significant differences (p < 0.05) between TWT and TKO, determined by unpaired t test, and between TKO neurons expressing indicated synapsin isoforms, determined by ANOVA with Holm–Bonferroni post hoc test. E, Deconvolution analysis of release rates of TWT and TKO neurons, as well as TKO neurons expressing individual synapsin isoforms. Sample sizes for each group are as follows: TWT (14), TKO (14), synapsin Ia (15), synapsin Ib (25), synapsin IIa (14), synapsin IIb (17), and synapsin IIIa (19). F, Integrals of release calculated from traces in E.
Release rates were next determined for TKO neurons expressing each synapsin isoform. All isoforms rescued the peak rates of release (Fig. 8E), accounting for the rescue of eIPSC peak amplitudes by all synapsins (Fig. 5B). In addition, all isoforms except synapsin IIIa were able to accelerate release kinetics, indicated by recovery of the faster rate constant of release (Fig. 8C). As a result, the total number of GABA quanta released by a presynaptic action potential was similar in all conditions except for TKO neurons expressing synapsin IIIa, in which evoked release nearly doubled due to the persistent, asynchronous release of GABA (Fig. 8D,F). These results account for the effects of these isoforms on eIPSC charge (Fig. 6D,F). In summary, deconvolution analysis indicates that synapsins control both the peak rate of GABA release and the temporal structure of GABA release in response to a presynaptic action potential. Both of these actions are regulated by all synapsin isoforms, aside from the inability of synapsin IIIa to synchronize GABA release.
Synapsins and depression of GABAergic transmission
At glutamatergic synapses, perturbation of synapsin function accelerates the rate of synaptic depression (Pieribone et al., 1995; Rosahl et al., 1995; Hilfiker et al., 1998, 2005; Gitler et al., 2004a). This usually is interpreted as a synapsin-dependent defect in mobilization of SVs from a RP (Greengard et al., 1993; Akbergenova and Bykhovskaia, 2007; Gitler et al., 2008; Vasileva et al., 2012). Because it has been reported that loss of synapsins does not affect depression kinetics at GABAergic synapses of cultured hippocampal neurons (Gitler et al., 2004a), we have reexamined eIPSC depression in TWT and TKO neurons, as well as in TKO neurons expressing synapsin isoforms.
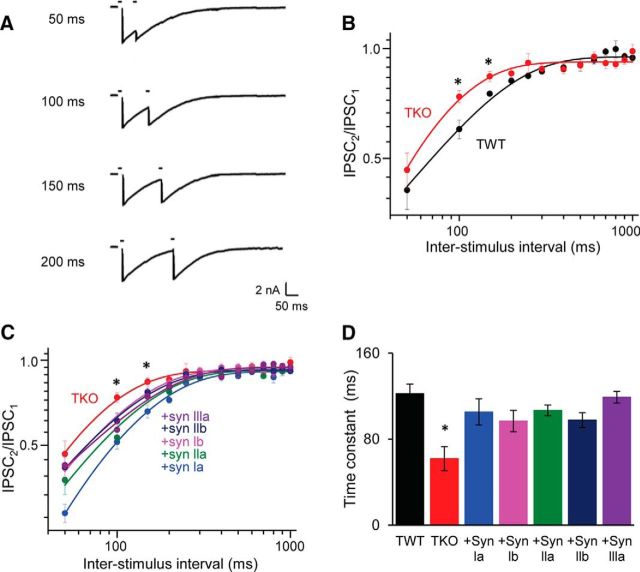
We began by using pairs of stimuli to examine the kinetics of recovery from depression. In this protocol, synaptic depression was elicited by the first stimulus and this caused eIPSCs evoked by the second stimulus to be smaller in amplitude than eIPSCs evoked by the first stimulus (Fig. 9A). This was the case for both TWT and TKO neurons. By varying the interval between the stimuli, the amplitude of the second eIPSC could be used to monitor the rate of recovery from depression: longer interstimulus intervals yielded less depression of the amplitude of the second eIPSC (Fig. 9A). In TWT neurons, the amplitude of the second eIPSC fully recovered with interstimulus intervals of 500 ms or greater (Fig. 9B). Recovery from depression in these neurons could be fit by an exponential function with a time constant of 122 ± 9 ms (Fig. 9B,D). Loss of synapins caused a significantly faster rate of recovery in TKO neurons, with a time constant of 68 ± 11 ms (Fig. 9B,D). Expression of any individual synapsin isoform in the TKO background restored the slower rate of recovery from depression, indicating that all synapsin isoforms can rescue the phenotype (Fig. 9C,D).
Figure 9.
Recovery from synaptic depression measured with pairs of stimuli delivered at various interstimulus intervals. A, Examples of depression of eIPSCs in a TWT neuron. B, Kinetics of recovery from depression for TWT (black, n = 16) and TKO (red, n = 17) neurons (note logarithmic coordinates). Depression was less for TKO neurons at 100 and 150 ms interstimulus intervals. Statistical comparisons were done with unpaired t test; asterisks indicate significant differences (p < 0.05). C, Comparison of recovery from depression for TKO neurons, as well as TKO neurons expressing indicated synapsin isoforms (note logarithmic coordinates). Sample sizes are as follows: synapsin Ia (17), synapsin Ib (21), synapsin IIa (15), synapsin IIb (23), and synapsin IIIa (15). D, Mean time constants of recovery from depression for each genotype, determined as in C. Depression recovered significantly faster in TKO neurons For C and D, statistical comparisons were done with ANOVA, followed by Holm–Bonferroni post hoc test; asterisks indicate significant differences (p < 0.05).
The rate of synaptic depression was determined by measuring the decline in eIPSC charge during trains of stimuli (10 Hz, 50 s). In both TWT and TKO neurons, during such trains, there was a rapid (but variable) initial drop in eIPSCs followed by a slower, exponential decline to a steady-state level (Fig. 10A; Jensen et al., 1999; Gitler et al., 2004a). Consistent with previous studies (Gitler et al., 2004a, 2008), the time course of depression was measured by fitting an exponential decay function to the slower decline. The time constant for this exponential was very similar in both TWT and TKO neurons, being nearly 12 s under our stimulus conditions (Fig. 10B). Introduction of synapsin Ia, synapsin Ib, synapsin IIa, or synapsin IIb into TKO neurons did not affect the kinetics of synaptic depression (Fig. 10B). However, expression of synapsin IIIa caused a nearly 3-fold acceleration in the rate of depression (Fig. 10B). Given that synapsin IIIa increases the total amount of GABA release (Fig. 8D), it is likely that the faster depression in TKO neurons expressing synapsin IIIa is a consequence of this increased GABA release. To test this possibility, we raised extracellular Ca2+ concentration to increase GABA release while measuring the resulting rate of depression in TWT neurons. Increasing Ca2+ concentration increased release ∼3-fold, as determined from eIPSC charge, and caused the time constant of depression to decrease ∼3-fold as well, from 11.3 ± 2.4 s to 4.1 ± 0.9 s. Across all experimental conditions, the rate of depression, measured as the inverse of the depression time constant, was correlated with the amount of transmitter release, measured by IPSC charge (Fig. 10C). This provides support for the idea that synapsin IIIa accelerates depression by increasing the rate of GABA release. The correlation further indicates that desynchronization of GABA release can explain why rates of depression are similar in TWT and TKO neurons even though the peak eIPSC amplitude is reduced in TKO neurons (Gitler et al., 2004a).
Finally, we used synaptic depression as a tool to assess the size of the RRP and the rate of mobilization of GABAergic vesicles from the RP. For this purpose, we measured the kinetics of integrated GABA release during a train of stimuli (Schneggenburger et al., 1999; Stevens and Williams, 2007) employing the same stimulus paradigm (10 Hz, 50 s) used for the experiments shown in Figure 9. To account for differential effects of synapsins on release kinetics (Fig. 8), we measured eIPSC charge produced in response to each stimulus and then integrated these responses over the course of the entire stimulus train. For both TWT and TKO neurons, such plots had two distinct kinetic components: a rapid initial increase, corresponding to depletion of the RRP, followed by a slower linear increase associated with mobilization from the RP (Fig. 11A). RRP size could be defined by back-extrapolating the slower linear component back to its y-intercept (dashed lines in Fig. 11A). Comparison of RRP values for TWT and TKO neurons indicated that the presence or absence of synapsins does not affect RRP size (Fig. 11B). Further, there were no changes in RRP size observed in TKO neurons expressing any of the individual synapsin isoforms (Fig. 11B). Mobilization, representing the rate of replenishment of SVs from the RP to the RRP, was determined by the slope of linear fits to the late component of integrated eIPSC charge (Fig. 11A). The rate of mobilization of GABAergic vesicle mobilization was also not significantly different across genotypes, being unaffected by loss of synapsins or by reintroduction of any of the synapsin isoforms (Fig. 11C). Therefore, we conclude that, for GABA release, synapsins affect neither the rate of mobilization from the RP nor the size of the RRP.
Figure 11.
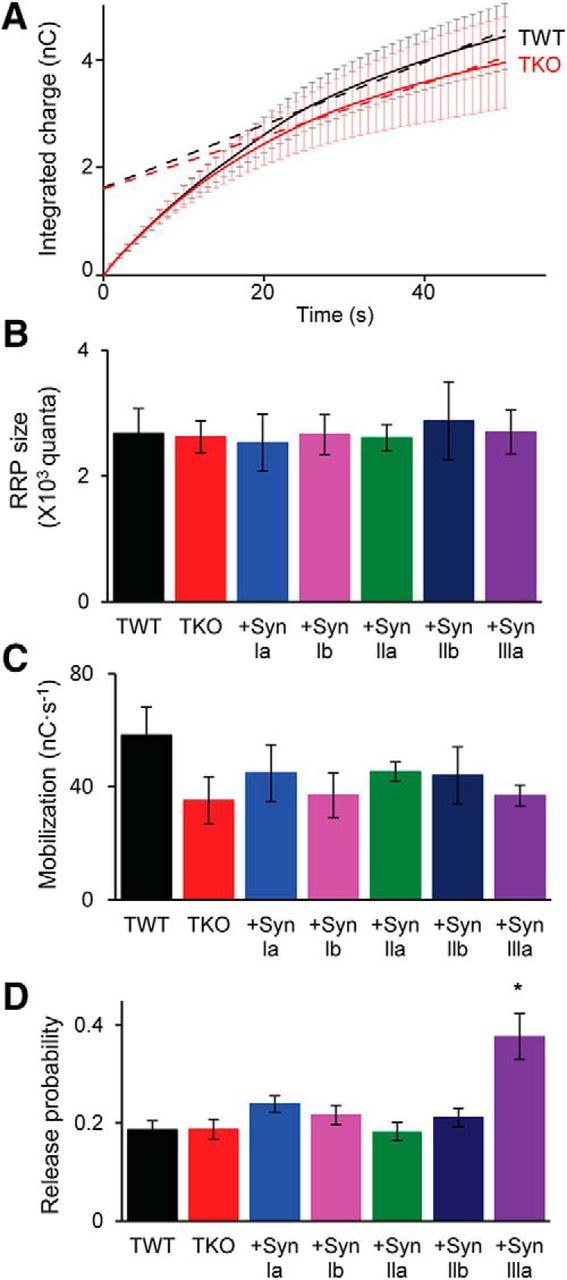
Synapsins do not affect RRP size or mobilization of SVs from the RP. A, Time course of cumulative IPSC charge during trains of 500 stimuli applied at 10 Hz. Amplitude of every tenth eIPSC is plotted. Data points from 20 to 50 s were fitted by linear regression and line was extrapolated back to the y-intercept to estimate RRP size. B, Mean RRP values determined for TWT and TKO neurons, as well as TKO neurons expressing indicated synapsin isoforms. C, Mean values of SV mobilization from RP to RRP, presented as in B. D, Release probability calculated from RRP size. Values indicate means ± SEM. Sample sizes for each group are as follows: TWT (12), TKO (10), synapsin Ia (13), synapsin Ib (11), synapsin IIa (17), synapsin IIb (10), synapsin IIIa (17), and TWT in 4 mm [Ca2+] (14). For B–D, statistical comparisons were done with ANOVA, followed by Holm–Bonferroni post hoc test; asterisks indicate significant differences (p < 0.05).
Given that eIPSCs in TKO neurons expressing synapsin IIIa have a higher quantal content (Fig. 6E) even though their RRP size is the same as for all other genotypes (Fig. 11B), it appears that synapsin IIIa affects the probability of GABA release in response to a presynaptic action potential. To quantify this effect of synapsin IIIa, we calculated release probability for each genotype by dividing eIPSC quantal content (Fig. 6E) by RRP size. These calculations indicate that release probability is indeed significantly higher in TKO neurons expressing synapsin IIIa compared with all other genotypes (Fig. 11D).
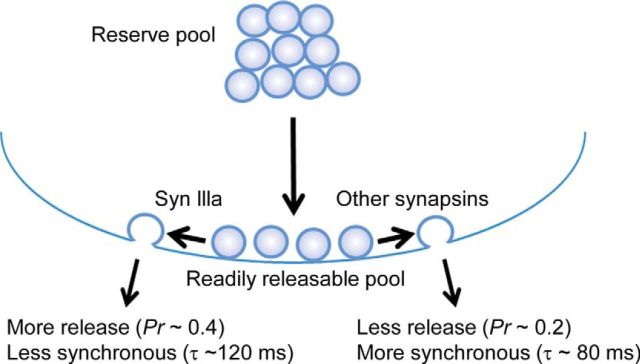
In conclusion, all synapsins affect the rate of release of GABA quanta residing within the RRP. Most synapsin isoforms synchronize the kinetics of GABA released by a presynaptic action potential; the exception is synapsin IIIa, which approximately doubles the probability of GABA release without affecting the timing of release (Fig. 12).
Figure 12.
Model for regulation of GABA release from RRP by synapsins. Although most synapsins allow GABA release to be synchronized by a presynaptic action potential, synapsin IIIa does not but increases the probability of GABA release from the RRP.
Discussion
Until now, it was unclear which synapsin isoforms regulate GABA release. Previous genetic studies were confounded by the presence of multiple synapsin genes that may compensate for each other (Rosahl et al., 1993, 1995; Li et al., 1995; Ryan et al., 1996; Feng et al., 2002; Medrihan et al., 2013). Indeed, our results indicate that most synapsin isoforms can compensate for each other in supporting GABA release. To avoid such issues, we reintroduced individual synapsin isoforms in a null TKO background and found that all of these isoforms, aside from synapsin IIIa, are responsible for synchronizing quantal GABA release from the RRP. Although synapsin IIIa is unable to synchronize GABA release, it is still capable of rescuing the related defect in the peak rate of GABA release. This indicates that synapsin IIIa shares some, but not all, molecular characteristics required to support proper trafficking and exocytosis of GABAergic SVs.
The ability of multiple synapsins to rescue the TKO phenotype is consistent with our finding that all five major synapsin isoforms are expressed in hippocampal interneurons. However, there was heterogeneity in the patterns of expression; no synapsin isoform was found in every hippocampal interneuron, likely due to the presence of many different interneuron types within the hippocampus (Maccaferri et al., 2000; Klausberger, 2009). Our physiological measurements side-stepped this heterogeneity by using a large sample size to achieve a reliable measure of “average” responses of the interneuron population. The validity of this strategy can be seen in the consistency of our measurements of transmission (IPSC amplitudes and time course of release) across many different genotypes. However, it remains possible that there are quantitative differences in GABA release properties (and synapsin rescue) between interneuron types (Maccaferri et al., 2000; Hefft and Jonas, 2005) that were concealed by our population-based determinations.
Synapsins and kinetics of GABA release
Although the total amount of GABA released by a presynaptic action potential was the same in TKO and TWT interneurons (Fig. 6E), GABA release was temporally dispersed in TKO neurons (Fig. 8). The phenotype of synapsin TKO neurons is reminiscent of the loss of synchronized transmitter release found in neurons deficient in synaptotagmins (Geppert et al., 1994; Nishiki and Augustine, 2004; Maximov and Südhof, 2005) or complexins (Reim et al., 2009; Dhara et al., 2014). It is not clear whether this similarity reflects a commonality in mechanism; synapsins are not known to interact physically or genetically with either synaptotagmins or complexins.
Our results contrast with the observation that knock-out of the synapsin II gene causes faster and more highly synchronized GABA release from hippocampal interneurons (Medrihan et al., 2013). In our studies, expression of either synapsin IIa or IIb in TKO neurons accelerates releases kinetics (Fig. 8E), which is the opposite of expectations based on the synapsin II-null phenotype. These differing results could arise from differences in genetic strategy. In our case, only individual synapsin isoforms were expressed on a null background, whereas in the synapsin II knock-out mice, two isoforms are removed together and three other synapsin isoforms remain. Interneuron heterogeneity could also contribute; whereas we examined interneurons from throughout the hippocampus, Medrihan et al. (2013) examined GABA release from only dentate gyrus interneurons. Future work will be needed to explain the reported differences in the phenotypes of TKO and synapsin II knock-out mice.
The time course of evoked GABA release (∼80 ms time constant; Fig. 6C) was 4-fold slower than the decay of a mIPSC (20 ms time constant; Fig. 7E). This difference could result from the mIPSCs being generated at synapses that are electrotonically closer to the cell body compared with synapses that produce eIPSCs (Major et al., 1994; Maccaferri et al., 2000). However, this was not the case: the rise time of eIPSCs (2.07 ± 0.06 ms across all 118 neurons in Fig. 6B) was identical to that of spontaneous mIPSCs (2.14 ± 0.06 ms; n = 109 neurons in Fig. 7D), indicating that evoked and spontaneous responses arise from synapses with similar spatial distributions. Instead, it appears that asynchronous release determines the time course of GABA release, even for TWT neurons containing a full complement of synapsins. This is consistent with previous reports that asynchronous release governs the time course of evoked synaptic transmission (Diamond and Jahr, 1995; Isaacson and Walmsley, 1995; Maximov and Südhof, 2005; Medrihan et al., 2013). However, phasic release is still present, indicated by the abrupt increase in release rate immediately after a stimulus (Fig. 8A), whereas the decay of release is blurred by asynchronous release of GABA that persists for a few hundred milliseconds. Given that the amount of asynchronous GABA release differs between interneuron types and can yield long-lasting inhibition (Hefft and Jonas, 2005), the inability of synapsin IIIa to support synchronized GABA release might indicate a unique physiological role for this synapsin isoform in certain interneurons.
The prolonged enhancement of GABA release from TKO neurons may produce the apparently faster rate of recovery from synaptic depression in these neurons. Faster recovery is observed only at 100–150 ms (Fig. 9B,D), a time window when GABA release is more pronounced in TKO neurons (Fig. 8A,B) and could contribute to eIPSCs evoked by the second stimulus when measuring recovery from depression. This is consistent with previous evidence that recovery from depression is limited by time-dependent changes in release probability (Wu and Borst, 1999). Although TKO neurons expressing synapsin IIIa show a similar prolongation of release kinetics (Fig. 8E), these neurons have a normal time course of recovery from depression (Fig. 9D). This may be related to the greater amount of depression in these cells (Fig. 10B,C).
Synapsins and trafficking of GABAergic vesicles
Although the RP of glutamatergic SVs in cultured hippocampal neurons is maintained by synapsins, specifically synapsin IIa (Gitler et al., 2008), our results indicate a role for synapsins in controlling release from the RRP of GABAergic SVs. RRP size was identical in TKO and TWT neurons (Fig. 11B), indicating that synapsins influence the properties of GABA release from the RRP, rather than the number of SVs within the RRP. This is consistent with previous EM analyses indicating that the number of docked GABAergic SVs, which presumably represent the RRP (Schikorski and Stevens, 2001; Imig et al., 2014; cf. Rizzoli and Betz, 2004), is only mildly (20–30%) reduced in TKO neurons (Gitler et al., 2004a). Our observations that most synapsins rescue the kinetics of GABA release indicate that such isoforms work at a step that synchronizes release of GABA from the RRP. The exception is synapsin IIIa, which cannot rescue release kinetics (Figs. 6F, 8C), but approximately doubles RRP release probability (Fig. 11D). A diagram summarizing our conclusions regarding synapsin action in trafficking of GABAergic SVs is shown in Figure 12.
How synapsins control the kinetics or magnitude of GABA release from the RRP is unknown. One possibility is that synapsins regulate the spatial relationship between SVs and presynaptic Ca2+ channels (Medrihan et al., 2013). Alternatively, synapsins may participate in a postdocking priming reaction that influences the speed of SV exocytosis. Further work will be needed to distinguish between these and other possible explanations for how synapsins control the kinetics of GABA release.
Structural features of synapsins important for GABA release
Our comparison of the functional properties of synapsin isoforms allows us to make some structural deductions. Nearly all synapsin isoforms can rescue the kinetics of GABA release at TKO neurons; this implicates conserved synapsin domains (A, B, and/or C) in mediating this function. Within these conserved domains, domain C is a prime candidate for controlling the kinetics of GABA release because this domain is known to regulate the kinetics of glutamate release (Hilfiker et al., 2005). Domain C can bind to many different proteins (Cheetham et al., 2001), including self-association to mediate multimerization (Hosaka and Südhof, 1999; Brautigam et al., 2004). It is unknown which, if any, of these binding activities are involved in control of GABA release kinetics. In the case of synapsin IIIa, which did not rescue GABA release kinetics, it is possible that the function of its conserved domains is regulated by the J domain, which is unique to this isoform (Kao et al., 1998). These structural requirements for synapsin function provide important clues for understanding how synapsins subserve their roles in trafficking of GABAergic SVs (Song and Augustine, 2015).
In summary, at GABAergic terminals, multiple synapsin isoforms can synchronize quantal discharge from the RRP. This differs from glutamatergic vesicles, in which only one isoform, synapsin IIa, is capable of maintaining SVs within the RP. These contrasts reveal fundamental differences in the roles of synapsins in the trafficking of different types of SVs.
Footnotes
This work was supported by the Singapore Ministry of Education and the World Class Institute (WCI) program (WCI Grant 2015-T1-001-069) of the National Research Foundation of Korea funded by the Ministry of Science, ICT and Future Planning (WCI Grant 2009-003). We thank K. Chung, J. Do, S. Kay, M. Lee, P. Teo, and J. Yoo for technical assistance; S. Kamath and N. Zainolabidin for help with ISH; A. Pappas for participating in pilot studies; and A. Chen, D. Gitler, and M. Graf for suggestions that improved our manuscript.
The authors declare no competing financial interests.
References
- Akbergenova Y, Bykhovskaia M. Synapsin maintains the reserve vesicle pool and spatial segregation of the recycling pool in Drosophila presynaptic boutons. Brain Res. 2007;1178:52–64. doi: 10.1016/j.brainres.2007.08.042. [DOI] [PubMed] [Google Scholar]
- Baldelli P, Fassio A, Valtorta F, Benfenati F. Lack of synapsin I reduces the readily releasable pool of synaptic vesicles at central inhibitory synapses. J Neurosci. 2007;27:13520–13531. doi: 10.1523/JNEUROSCI.3151-07.2007. [DOI] [PMC free article] [PubMed] [Google Scholar]
- Banker G, Goslin K. Culturing nerve cells. Cambridge, MA: MIT; 1984. [Google Scholar]
- Bi GQ, Poo MM. Synaptic modifications in cultured hippocampal neurons: dependence on spike timing, synaptic strength, and postsynaptic cell type. J Neurosci. 1998;18:10464–10472. doi: 10.1523/JNEUROSCI.18-24-10464.1998. [DOI] [PMC free article] [PubMed] [Google Scholar]
- Brautigam CA, Chelliah Y, Deisenhofer J. Tetramerization and ATP binding by a protein comprising the A–C domains of rat synapsin I. J Biol Chem. 2004;279:11948–11956. doi: 10.1074/jbc.M312015200. [DOI] [PubMed] [Google Scholar]
- Buckmaster PS, Soltesz I. Neurobiology of hippocampal interneurons: a workshoop review. Hippocampus. 1996;6:330–339. doi: 10.1002/(SICI)1098-1063(1996)6:3<330::AID-HIPO9>3.0.CO;2-Q. [DOI] [PubMed] [Google Scholar]
- Cesca F, Baldelli P, Valtorta F, Benfenati F. The synapsins: key actors of synapse function and plasticity. Prog Neurobiol. 2010;91:313–348. doi: 10.1016/j.pneurobio.2010.04.006. [DOI] [PubMed] [Google Scholar]
- Chaudhry FA, Reimer RJ, Bellocchio EE, Danbolt NC, Osen KK, Edwards RH, Storm-Mathisen J. The vesicular GABA transporter, VGAT, localizes to synaptic vesicles in sets of glycinergic as well as GABAergic neurons. J Neurosci. 1998;18:9733–9750. doi: 10.1523/JNEUROSCI.18-23-09733.1998. [DOI] [PMC free article] [PubMed] [Google Scholar]
- Cheetham JJ, Hilfiker S, Benfenati F, Weber T, Greengard P, Czernik AJ. Identification of synapsin I peptides that insert into lipid membranes. Biochem J. 2001;354:57–66. doi: 10.1042/0264-6021:3540057. [DOI] [PMC free article] [PubMed] [Google Scholar]
- Chi P, Greengard P, Ryan TA. Synaptic vesicle mobilization is regulated by distinct synapsin I phosphorylation pathways at different frequencies. Neuron. 2003;38:69–78. doi: 10.1016/S0896-6273(03)00151-X. [DOI] [PubMed] [Google Scholar]
- Corsellis JA, Bruton CJ. Neuropathology of status epilepticus in humans. Adv Neurol. 1983;34:129–139. [PubMed] [Google Scholar]
- Del Castillo J, Katz B. Quantal components of the end-plate potential. J Physiol. 1954;124:560–573. doi: 10.1113/jphysiol.1954.sp005129. [DOI] [PMC free article] [PubMed] [Google Scholar]
- Dhara M, Yarzagaray A, Schwarz Y, Dutta S, Grabner C, Moghadam PK, Bost A, Schirra C, Rettig J, Reim K, Brose N, Mohrmann R, Bruns D. Complexin synchronizes primed vesicle exocytosis and regulates fusion pore dynamics. J Cell Biol. 2014;204:1123–1140. doi: 10.1083/jcb.201311085. [DOI] [PMC free article] [PubMed] [Google Scholar]
- Diamond JS, Jahr CE. Asynchronous release of synaptic vesicles determines the time course of the AMPA receptor-mediated EPSC. Neuron. 1995;15:1097–1107. doi: 10.1016/0896-6273(95)90098-5. [DOI] [PubMed] [Google Scholar]
- Evergren E, Marcucci M, Tomilin N, Löw P, Slepnev V, Andersson F, Gad H, Brodin L, De Camilli P, Shupliakov O. Amphiphysin is a component of clathrin coats formed during synaptic vesicle recycling at the lamprey giant synapse. Traffic. 2004;5:514–528. doi: 10.1111/j.1398-9219.2004.00198.x. [DOI] [PubMed] [Google Scholar]
- Fatt P, Katz B. Spontaneous subthreshold activity at motor nerve endings. J Physiol. 1952;117:109–128. [PMC free article] [PubMed] [Google Scholar]
- Feng J, Chi P, Blanpied TA, Xu Y, Magarinos AM, Ferreira A, Takahashi RH, Kao HT, McEwen BS, Ryan TA, Augustine GJ, Greengard P. Regulation of neurotransmitter release by synapsin III. J Neurosci. 2002;22:4372–4380. doi: 10.1523/JNEUROSCI.22-11-04372.2002. [DOI] [PMC free article] [PubMed] [Google Scholar]
- Ferreira A, Kao HT, Feng J, Rapoport M, Greengard P. Synapsin III: developmental expression, subcellular localization, and role in axon formation. J Neurosci. 2000;20:3736–3744. doi: 10.1523/JNEUROSCI.20-10-03736.2000. [DOI] [PMC free article] [PubMed] [Google Scholar]
- Freund TF, Buzsáki G. Interneurons of the hippocampus. Hippocampus. 1996;6:347–470. doi: 10.1002/(SICI)1098-1063(1996)6:4<347::AID-HIPO1>3.0.CO;2-I. [DOI] [PubMed] [Google Scholar]
- Geppert M, Goda Y, Hammer RE, Li C, Rosahl TW, Stevens CF, Südhof TC. Synaptotagmin I: a major Ca2+ sensor for transmitter release at a central synapse. Cell. 1994;79:717–727. doi: 10.1016/0092-8674(94)90556-8. [DOI] [PubMed] [Google Scholar]
- Gitler D, Takagishi Y, Feng J, Ren Y, Rodriguiz RM, Wetsel WC, Greengard P, Augustine GJ. Different presynaptic roles of synapsins at excitatory and inhibitory synapses. J Neurosci. 2004a;24:11368–11380. doi: 10.1523/JNEUROSCI.3795-04.2004. [DOI] [PMC free article] [PubMed] [Google Scholar]
- Gitler D, Xu Y, Kao HT, Lin D, Lim S, Feng J, Greengard P, Augustine GJ. Molecular determinants of synapsin targeting to presynaptic terminals. J Neurosci. 2004b;24:3711–3720. doi: 10.1523/JNEUROSCI.5225-03.2004. [DOI] [PMC free article] [PubMed] [Google Scholar]
- Gitler D, Cheng Q, Greengard P, Augustine GJ. Synapsin IIa controls the reserve pool of glutamatergic synaptic vesicles. J Neurosci. 2008;28:10835–10843. doi: 10.1523/JNEUROSCI.0924-08.2008. [DOI] [PMC free article] [PubMed] [Google Scholar]
- Greengard P, Valtorta F, Czernik AJ, Benfenati F. Synaptic vesicle phosphoproteins and regulation of synaptic function. Science. 1993;259:780–785. doi: 10.1126/science.8430330. [DOI] [PubMed] [Google Scholar]
- Gulyás AI, Tóth K, McBain CJ, Freund TF. Stratum radiatum giant cells: a type of principal cell in the rat hippocampus. Eur J Neurosci. 1998;10:3813–3822. doi: 10.1046/j.1460-9568.1998.00402.x. [DOI] [PubMed] [Google Scholar]
- Hefft S, Jonas P. Asynchronous GABA release generates long-lasting inhibition at a hippocampal interneuron-principal neuron synapse. Nat Neurosci. 2005;8:1319–1328. doi: 10.1038/nn1542. [DOI] [PubMed] [Google Scholar]
- Hilfiker S, Schweizer FE, Kao HT, Czernik AJ, Greengard P, Augustine GJ. Two sites of action for synapsin domain E in regulating neurotransmitter release. Nat Neurosci. 1998;1:29–35. doi: 10.1038/229. [DOI] [PubMed] [Google Scholar]
- Hilfiker S, Pieribone VA, Czernik AJ, Kao HT, Augustine GJ, Greengard P. Synapsins as regulators of neurotransmitter release. Philos Trans R Soc Lond B Biol Sci. 1999;354:269–279. doi: 10.1098/rstb.1999.0378. [DOI] [PMC free article] [PubMed] [Google Scholar]
- Hilfiker S, Benfenati F, Doussau F, Nairn AC, Czernik AJ, Augustine GJ, Greengard P. Structural domains involved in the regulation of transmitter release by synapsins. J Neurosci. 2005;25:2658–2669. doi: 10.1523/JNEUROSCI.4278-04.2005. [DOI] [PMC free article] [PubMed] [Google Scholar]
- Holm S. A simple sequentially rejective multiple test procedure. Scand J Stat. 1979;6:65–70. [Google Scholar]
- Hosaka M, Südhof TC. Synapsin III, a novel synapsin with an unusual regulationby Ca2+ J Biol Chem. 1998;273:13371–13374. doi: 10.1074/jbc.273.22.13371. [DOI] [PubMed] [Google Scholar]
- Hosaka M, Südhof TC. Homo- and heterodimerization of synapsins. J Biol Chem. 1999;274:16747–16753. doi: 10.1074/jbc.274.24.16747. [DOI] [PubMed] [Google Scholar]
- Humeau Y, Doussau F, Vitiello F, Greengard P, Benfenati F, Poulain B. Synapsin controls both reserve and releasable synaptic vesicle pools during neuronal activity and short-term plasticity in Aplysia. J Neurosci. 2001;21:4195–4206. doi: 10.1523/JNEUROSCI.21-12-04195.2001. [DOI] [PMC free article] [PubMed] [Google Scholar]
- Imig C, Min SW, Krinner S, Arancillo M, Rosenmund C, Südhof TC, Rhee J, Brose N, Cooper BH. The morphological and molecular nature of synaptic vesicle priming at presynaptic active zones. Neuron. 2014;84:416–431. doi: 10.1016/j.neuron.2014.10.009. [DOI] [PubMed] [Google Scholar]
- Isaac JT, Hjelmstad GO, Nicoll RA, Malenka RC. Long-term potentiation at single fiber inputs to hippocampal CA1 pyramidal cells. Proc Natl Acad Sci U S A. 1996;93:8710–8715. doi: 10.1073/pnas.93.16.8710. [DOI] [PMC free article] [PubMed] [Google Scholar]
- Isaacson JS, Walmsley B. Counting quanta: direct measurements of transmitter release at a central synapse. Neuron. 1995;15:875–884. doi: 10.1016/0896-6273(95)90178-7. [DOI] [PubMed] [Google Scholar]
- Ishizuka N, Cowan WM, Amaral DG. A quantitative analysis of the dendritic organization of pyramidal cells in the rat hippocampus. J Comp Neurol. 1995;362:17–45. doi: 10.1002/cne.903620103. [DOI] [PubMed] [Google Scholar]
- Jensen K, Lambert JD, Jensen MS. Activity-dependent depression of GABAergic IPSCs in cultured hippocampal neurons. J Neurophysiol. 1999;82:42–49. doi: 10.1152/jn.1999.82.1.42. [DOI] [PubMed] [Google Scholar]
- Jin H, Wu H, Osterhaus G, Wei J, Davis K, Sha D, Floor E, Hsu CC, Kopke RD, Wu JY. Demonstration of functional coupling between gamma-aminobutyric acid (GABA) synthesis and vesicular GABA transport into synaptic vesicles. Proc Natl Acad Sci U S A. 2003;100:4293–4298. doi: 10.1073/pnas.0730698100. [DOI] [PMC free article] [PubMed] [Google Scholar]
- Kao HT, Porton B, Czernik AJ, Feng J, Yiu G, Häring M, Benfenati F, Greengard P. A third member of the synapsin gene family. Proc Natl Acad Sci U S A. 1998;95:4667–4672. doi: 10.1073/pnas.95.8.4667. [DOI] [PMC free article] [PubMed] [Google Scholar]
- Kao HT, Porton B, Hilfiker S, Stefani G, Pieribone VA, DeSalle R, Greengard P. Molecular evolution of the synapsin gene family. J Exp Zool. 1999;285:360–377. [PubMed] [Google Scholar]
- Kile BM, Guillot TS, Venton BJ, Wetsel WC, Augustine GJ, Wightman RM. Synapsins differentially control dopamine and serotonin release. J Neurosci. 2010;30:9762–9770. doi: 10.1523/JNEUROSCI.2071-09.2010. [DOI] [PMC free article] [PubMed] [Google Scholar]
- Klausberger T. GABAergic interneurons targeting dendrites of pyramidal cells in the CA1 area of the hippocampus. Eur J Neurosci. 2009;30:947–957. doi: 10.1111/j.1460-9568.2009.06913.x. [DOI] [PubMed] [Google Scholar]
- Li L, Chin LS, Shupliakov O, Brodin L, Sihra TS, Hvalby O, Jensen V, Zheng D, McNamara JO, Greengard P. Impairment of synaptic vesicle clustering and of synaptic transmission, and increased seizure propensity, in synapsin I-deficient mice. Proc Natl Acad Sci U S A. 1995;92:9235–9239. doi: 10.1073/pnas.92.20.9235. [DOI] [PMC free article] [PubMed] [Google Scholar]
- Lois C, Hong EJ, Pease S, Brown EJ, Baltimore D. Germline transmission and tissue-specific expression of transgenes delivered by lentiviral vectors. Science. 2002;295:868–872. doi: 10.1126/science.1067081. [DOI] [PubMed] [Google Scholar]
- Lorente de Nó R. Studies on the structure of the cerebral cortex. II. Continuation of the study of the ammonic system. J Psychol Neurol. 1934;46:113–177. [Google Scholar]
- Maccaferri G, Roberts JD, Szucs P, Cottingham CA, Somogyi P. Cell surface domain specific postsynaptic currents evoked by identified GABAergic neurones in rat hippocampus in vitro. J Physiol. 2000;524:91–116. doi: 10.1111/j.1469-7793.2000.t01-3-00091.x. [DOI] [PMC free article] [PubMed] [Google Scholar]
- Major G, Larkman AU, Jonas P, Sakmann B, Jack JJ. Detailed passive cable models of whole-cell recorded CA3 pyramidal neurons in rat hippocampal slices. J Neurosci. 1994;14:4613–4638. doi: 10.1523/JNEUROSCI.14-08-04613.1994. [DOI] [PMC free article] [PubMed] [Google Scholar]
- Marty A, Neher E. Tight-seal whole-cell recording. In: Sakmann B, Neher E, editors. Single-channel Recording. Ed 2. New York: Plenum; 1995. pp. 31–52. [Google Scholar]
- Maximov A, Südhof TC. Autonomous function of synaptotagmin 1 in triggering synchronous release independent of asynchronous release. Neuron. 2005;48:547–554. doi: 10.1016/j.neuron.2005.09.006. [DOI] [PubMed] [Google Scholar]
- Maximov A, Pang ZP, Tervo DG, Südhof TC. Monitoring synaptic transmission in primary neuronal cultures using local extracellular stimulation. J Neurosci Methods. 2007;161:75–87. doi: 10.1016/j.jneumeth.2006.10.009. [DOI] [PubMed] [Google Scholar]
- Medrihan L, Cesca F, Raimondi A, Lignani G, Baldelli P, Benfenati F. Synapsin II desynchronizes neurotransmitter release at inhibitory synapses by interacting with presynaptic calcium channels. Nat Commun. 2013;4:1512. doi: 10.1038/ncomms2515. [DOI] [PMC free article] [PubMed] [Google Scholar]
- Megías M, Emri Z, Freund TF, Gulyás AI. Total number and distribution of inhibitory and excitatory synapses on hippocampal CA1 pyramidal cells. Neuroscience. 2001;102:527–540. doi: 10.1016/S0306-4522(00)00496-6. [DOI] [PubMed] [Google Scholar]
- Neher E, Sakaba T. Estimating transmitter release rates from postsynaptic current fluctuations. J Neurosci. 2001;21:9638–9654. doi: 10.1523/JNEUROSCI.21-24-09638.2001. [DOI] [PMC free article] [PubMed] [Google Scholar]
- Nishiki T, Augustine GJ. Synaptotagmin I synchronizes transmitter telease in mouse hippocampal neurons. J Neurosci. 2004;24:6127–6132. doi: 10.1523/JNEUROSCI.1563-04.2004. [DOI] [PMC free article] [PubMed] [Google Scholar]
- Norris N. The standard errors of the geometric and harmonic means and their application to index numbers. Ann Math Stat. 1940;11:445–448. [Google Scholar]
- Pieribone VA, Shupliakov O, Brodin L, Hilfiker-Rothenfluh S, Czernik AJ, Greengard P. Distinct pools of synaptic vesicles in neurotransmitter release. Nature. 1995;375:493–497. doi: 10.1038/375493a0. [DOI] [PubMed] [Google Scholar]
- Porton B, Kao HT, Greengard P. Characterization of transcripts from the synapsin III gene locus. J Neurochem. 1999;73:2266–2271. doi: 10.1046/j.1471-4159.1999.0732266.x. [DOI] [PubMed] [Google Scholar]
- Reim K, Regus-Leidig H, Ammermüller J, El-Kordi A, Radyushkin K, Ehrenreich H, Brandstätter JH, Brose N. Aberrant function and structure of retinal ribbon synapses in the absence of complexin 3 and complexin 4. J Cell Sci. 2009;122:1352–1361. doi: 10.1242/jcs.045401. [DOI] [PubMed] [Google Scholar]
- Rizzoli SO. Synaptic vesicle recycling: steps and principles. EMBO J. 2014;33:788–822. doi: 10.1002/embj.201386357. [DOI] [PMC free article] [PubMed] [Google Scholar]
- Rizzoli SO, Betz WJ. The structural organization of the readily releasable pool of synaptic vesicles. Science. 2004;303:2037–2039. doi: 10.1126/science.1094682. [DOI] [PubMed] [Google Scholar]
- Rosahl TW, Geppert M, Spillane D, Herz J, Hammer RE, Malenka RC, Südhof TC. Short-term synaptic plasticity is altered in mice lacking synapsin I. Cell. 1993;75:661–670. doi: 10.1016/0092-8674(93)90487-B. [DOI] [PubMed] [Google Scholar]
- Rosahl TW, Spillane D, Missler M, Herz J, Selig DK, Wolff JR, Hammer RE, Malenka RC, Südhof TC. Essential functions of synapsins I and II in synaptic vesicle regulation. Nature. 1995;375:488–493. doi: 10.1038/375488a0. [DOI] [PubMed] [Google Scholar]
- Ryan TA, Li L, Chin LS, Greengard P, Smith SJ. Synaptic vesicle recycling in synapsin I knock-out mice. J Cell Biol. 1996;134:1219–1227. doi: 10.1083/jcb.134.5.1219. [DOI] [PMC free article] [PubMed] [Google Scholar]
- Samigullin D, Bill CA, Coleman WL, Bykhovskaia M. Regulation of transmitter release by synapsin II in mouse motor terminals. J Physiol. 2004;561:149–158. doi: 10.1113/jphysiol.2004.073494. [DOI] [PMC free article] [PubMed] [Google Scholar]
- Schaeren-Wiemers N, Gerfin-Moser A. A single protocol to detect transcripts of various types and expression levels in neural tissue and cultured cells: in situ hybridization using digoxigenin-labelled cRNA probes. Histochemistry. 1993;100:431–440. doi: 10.1007/BF00267823. [DOI] [PubMed] [Google Scholar]
- Schikorski T, Stevens CF. Morphological correlates of functionally defined synaptic vesicle populations. Nat Neurosci. 2001;4:391–395. doi: 10.1038/86042. [DOI] [PubMed] [Google Scholar]
- Schneggenburger R, Meyer AC, Neher E. Released fraction and total size of a pool of immediately available transmitter quanta at a calyx synapse. Neuron. 1999;23:399–409. doi: 10.1016/S0896-6273(00)80789-8. [DOI] [PubMed] [Google Scholar]
- Song SH, Augustine GJ. Synapsin isoforms and synaptic vesicle trafficking. Mol Cells. 2015;38:936–940. doi: 10.14348/molcells.2015.0233. [DOI] [PMC free article] [PubMed] [Google Scholar]
- Stevens CF, Wang Y. Facilitation and depression at single central synapses. Neuron. 1995;14:795–802. doi: 10.1016/0896-6273(95)90223-6. [DOI] [PubMed] [Google Scholar]
- Stevens CF, Williams JH. Discharge of the readily releasable pool with action potentials at hippocampal synapses. J Neurophysiol. 2007;98:3221–3229. doi: 10.1152/jn.00857.2007. [DOI] [PMC free article] [PubMed] [Google Scholar]
- Südhof TC, Czernik AJ, Kao HT, Takei K, Johnston PA, Horiuchi A, Kanazir SD, Wagner MA, Perin MS, De Camilli P. Synapsins: mosaics of shared and individual domains in a family of synaptic vesicle phosphoproteins. Science. 1989;245:1474–1480. doi: 10.1126/science.2506642. [DOI] [PubMed] [Google Scholar]
- Terada S, Tsujimoto T, Takei Y, Takahashi T, Hirokawa N. Impairment of inhibitory synaptic transmission in mice lacking synapsin I. J Cell Biol. 1999;145:1039–1048. doi: 10.1083/jcb.145.5.1039. [DOI] [PMC free article] [PubMed] [Google Scholar]
- Van der Kloot W. Estimating the timing of quantal releases during end-plate currents at the frog neuromuscular junction. J Physiol. 1988;402:595–603. doi: 10.1113/jphysiol.1988.sp017224. [DOI] [PMC free article] [PubMed] [Google Scholar]
- Vasileva M, Horstmann H, Geumann C, Gitler D, Kuner T. Synapsin-dependent reserve pool of synaptic vesicles supports replenishment of the readily releasable pool under intense synaptic transmission. Eur J Neurosci. 2012;36:3005–3020. doi: 10.1111/j.1460-9568.2012.08225.x. [DOI] [PubMed] [Google Scholar]
- Vasileva M, Renden R, Horstmann H, Gitler D, Kuner T. Overexpression of synapsin Ia in the rat calyx of Held accelerates short-term plasticity and decreases synaptic vesicle volume and active zone area. Front Cell Neurosci. 2013;7:270. doi: 10.3389/fncel.2013.00270. [DOI] [PMC free article] [PubMed] [Google Scholar]
- Vorobieva ON, Hackett JT, Worden MK, Bykhovskaia M. Evaluation of quantal neurosecretion from evoked and miniature postsynaptic responses by deconvolution method. J Neurosci Methods. 1999;92:91–99. doi: 10.1016/S0165-0270(99)00101-6. [DOI] [PubMed] [Google Scholar]
- Wu LG, Borst JG. The reduced release probability of releasable vesicles during recovery from short-term synaptic depression. Neuron. 1999;23:821–832. doi: 10.1016/S0896-6273(01)80039-8. [DOI] [PubMed] [Google Scholar]


