Abstract
Canavan disease (CD) is a severe, lethal leukodystrophy caused by deficiency in aspartoacylase (ASPA), which hydrolyzes N-acetylaspartate (NAA). In the brains of CD patients, NAA accumulates to high millimolar concentrations. The pathology of the disease is characterized by loss of oligodendrocytes and spongy myelin degeneration in the CNS. Whether accumulating NAA, absence of NAA-derived acetate, or absence of any unknown functions of the ASPA enzyme is responsible for the pathology of the disease is not fully understood. We generated ASPA-deficient (Aspanur7/nur7) mice that are also deficient for NAA synthase Nat8L (Nat8L−/−/Aspanur7/nur7). These mice have no detectable NAA. Nevertheless, they exhibited normal myelin content, myelin sphingolipid composition, and full reversal of spongy myelin and axonal degeneration. Surprisingly, although pathology was fully reversed, the survival time of the mice was not prolonged. In contrast, Aspanur7/nur7 mice with only one intact Nat8L allele accumulated less NAA, developed a less severe pathology, phenotypic improvements, and, importantly, an almost normal survival time. Therefore, inhibition of NAA synthase is a promising therapeutic option for CD. The reduced survival rate of Nat8L−/−/Aspanur7/nur7 mice, however, indicates that complete inhibition of NAA synthase may bear unforeseeable risks for the patient. Furthermore, we demonstrate that acetate derived from NAA is not essential for myelin lipid synthesis and that loss of NAA-derived acetate does not cause the myelin phenotype of Aspanur7/nur7 mice. Our data clearly support the hypothesis that NAA accumulation is the major factor in the development of CD.
SIGNIFICANCE STATEMENT Canavan disease (CD) is a severe, lethal leukodystrophy caused by aspartoacylase deficiency leading to accumulation of its substrate, N-acetylaspartate (NAA), and spongy myelin degeneration. In our study, we found that deletion of the NAA synthase gene Nat8L in a CD mouse model prevents myelin degeneration. This shows that accumulation of NAA to toxic levels causes the spongy myelin degeneration and excludes that a deficiency of NAA degradation products is responsible for the disease. This conclusion also suggests that inhibition of NAA synthase may be a therapeutic option for CD. The observed sudden premature death of Nat8L-deficient mice, however, also indicates that complete inhibition of NAA synthase may bear unforeseeable risks for patients.
Keywords: aspartoacylase, Canavan disease, leukodystrophy, N-acetylaspartate, NAA synthase, spongy degeneration
Introduction
N-acetylaspartate (NAA) is an abundant amino acid derivative in the nervous system of vertebrates (for review, see Baslow, 2003; Moffett et al., 2007). NAA is synthesized by an NAA synthase, encoded by the Nat8L gene, which is mainly expressed in neurons (Wiame et al., 2009). NAA is released from neurons by an unknown mechanism. Degradation of NAA takes place in oligodendrocytes, which express the NAA hydrolase aspartoacylase (ASPA), and possibly to some extent also in other cell types (Moffett et al., 2011). In addition, neuronal NAA is a precursor for the neuropeptides N-acetylaspartylglutamate (NAAG) and N-acetylaspartylglutamylglutamate, which are synthesized by two related peptide synthases (Becker et al., 2010; Collard et al., 2010; Lodder-Gadaczek et al., 2011). Apart from its role as a substrate for these synthases, the physiological role of NAA is largely unclear. NAA may be an acetyl-group carrier to supply oligodendrocytes with substrates for myelin lipid synthesis (Madhavarao et al., 2005) and may function as a molecular water pump to reduce osmotic stress in neurons (Baslow et al., 2013).
ASPA deficiency causes a rare leukodystrophy, Canavan disease (CD), in which NAA accumulates to high millimolar concentrations (Matalon et al., 1988). Two main, non-mutually exclusive hypotheses may explain the pathology of CD. According to the first, the NAA hydrolysis product acetate is required for myelin lipid synthesis and loss of ASPA causes a reduction in acetyl group supply for lipid synthesis (Namboodiri et al., 2006). The second model assumes that, because of its large hydrate shell, high NAA concentration causes “osmotic stress” to myelin/oligodendrocytes and this causes loss of myelin (Baslow et al., 2013). The latter hypothesis is supported by the severe vacuolation in CD. An argument against this hypothesis, however, was the observation that restoration of ASPA expression in neurons did not improve the myelin phenotype in a CD mouse model (Klugmann et al., 2005). Furthermore, acetyl groups derived from NAA may also be used for acetylation reactions (e.g., protein acetylation) and ASPA could have other, currently unknown functions, the loss of which could cause oligodendrocyte death; however, there are currently no experimental data to support this hypothesis.
To further elucidate the cause of myelin loss in CD, we examined the effect of an NAA synthase deficiency in the Aspanur7/nur7 mouse mutant, an established CD mouse model showing widespread spongiform degeneration in the CNS (Traka et al., 2008). Nat8L−/− mice that did not lack ASPA, did not show any signs of a myelin phenotype, and exhibited normal myelin protein and lipid levels throughout development. Moreover, our data show clearly that the myelin pathology of Aspanur7/nur7 mice can be rescued by the additional knock-out of the NAA-synthase Nat8L. Most surprisingly, however, the impressive reversal of myelin pathology did not result in prolonged survival times. In contrast, the survival rate of Aspanur7/nur7 mice heterozygous for Nat8L was almost normal until 1 year of age. This correlated with some behavioral improvements and a less severe spongy degeneration. Our results show that accumulation of NAA to toxic levels is the key event in the development of CD and the absence of NAA degradation products is not responsible for myelin degeneration in Aspanur7/nur7 mice. Our findings suggest that partial inhibition of NAA-synthase may be a therapeutic option for CD.
Materials and Methods
Mouse lines.
Mice were housed on a regular dark/light cycle (12 h dark from 6:00 P.M. to 6:00 A.M. and 12 h light from 6:00 A.M. to 6:00 P.M.). Aspartoacylase-deficient mice (Aspanur7/J; Traka et al., 2008) were obtained from The Jackson Laboratory. Although this mouse line has been reported to have a pure C57BL/6 genetic background, a single nucleotide polymorphism panel analysis done at The Jackson Laboratory showed that 7 of 27 markers were not of the C57BL/6 allele type (The Jackson Laboratory; http://jaxmice.jax.org/strain/008607.html). Nat8L-deficient mice were generated as follows. A Nat8L targeting construct containing floxed exon 3 of the Nat8L gene and a loxP/FRT-flanked neomycin resistance gene followed by an IRES-lacZ cassette was generated by the recombineering technique using a 129/Sv BAC clone (Source BioScience). The linearized targeting construct was electroporated into HM-1 embryonic stem cells (Magin et al., 1992) and subjected to selection with G418 using standard methods (Hogan et al., 1994). G418-resistant colonies were tested for homologous recombination by PCR and positive clones were confirmed by Southern blotting using 5′- and 3′-external probes. One selected positive ES cell clone was used to produce chimeric male founder mice that were bred with C57BL/6 females. Floxed heterozygous mice were mated with pgk-Cre mice to delete exon 3 and the neomycin selection cassette. Heterozygous mice were than mated to obtain Nat8L−/− mice. Mice of the established Nat8L−/− line were crossed with Aspanur7/+ mice. Most of the animals analyzed in this study were obtained from Nat8L+/−/Aspanur7/nur7 × Nat8L+/−/Aspanur7/nur7 breeding pairs. Mice with the genotypes Nat8L+/+/Aspa+/+ and Nat8L+/+/Aspanur7/+ were used as controls in all experiments, if not otherwise indicated. All animal experiments were performed in compliance with German national guidelines and approved by the Landesamt für Natur, Umwelt und Verbraucherschutz NRW (Düsseldorf, Germany).
Genotyping.
Genotyping of the Nat8L gene was done by PCR using the following primers: 5′-TCCCTGTGTCCCATGCCCGT-3′, 5′- TCCCAGCCCTTGGTCTGCCA-3′, and 5′-TGGGGCAAGTGTGGAGGGTGG-3′ (PCR products: wild-type allele = 225 bp, knock-out allele = 266 bp, floxed allele = 316 bp). Genotyping of the Aspa gene was done by PCR followed by restriction digest analysis. PCR was done using the two primers 5′-TAAAATCAAGAGCATGTTTTATCATTTTTCTCATCT-3′ and 5′-CTCCTGTCGCAACCTATTTCTTG-3′. The first primer anneals directly upstream of the nur7 mutation and has a mismatch at the second to last position (T to C transition). In the presence of the nur7 mutation, a BfaI restriction site (CTAG) is formed in the PCR product. The PCR product was digested with BfaI and analyzed by agarose gel electrophoresis. Digested PCR products gave fragments of 170, 161, and 51 bp in the wild-type allele and fragments of 161, 133, 51, and 37 bp in the nur7 allele.
Antibodies.
The following primary antibodies were used for Western blotting (WB), immunofluorescence (IF), and immunohistochemistry (IHC): mouse anti-β/A4 amyloid precursor protein (APP) clone 22C11 (IHC 1:250, MAB348; Merck/Millipore), mouse anti-glial fibrillary acidic protein (GFAP) (WB 1:1000, IF 1:100, ICN691102; MP Biomedicals), rabbit anti-myelin basic protein (MBP) (WB 1:5000, AB980; Merck/Millipore), mouse anti-2′3′-cyclic nucleotide 3′-phosphohydrolase (CNPase) clone 11-5B (WB 1:1000, MAB326; Merck/Millipore), mouse anti-proteolipid protein (PLP) (WB 1:1000, MAB388; Merck/Millipore), and mouse anti-α-tubulin (WB 1:5000, T5168; Sigma-Aldrich). The rabbit anti-large myelin associated glycoprotein (l-MAG) antiserum (WB 1:5000) was kindly provided by Dr. Arthur Butt (Center for Neuroscience Research, King's College London). The following secondary antibodies were used: goat anti-mouse Alexa Fluor 546 (IF 1:400, A-11030; Thermo Scientific), goat anti-rabbit Alexa Fluor 546 (IF 1:400, A-11035; Thermo Scientific), goat anti-rabbit IgG DyLight 800 (WB 1:10,000, 35571; Thermo Scientific), goat anti-rabbit IgG DyLight 649 (WB 10,000, 35565; Thermo Scientific), goat anti-mouse IgG DyLight 800 (WB 10,000, 35521; Thermo Scientific), and goat anti-mouse IgG DyLight 649 (WB 10,000, 35515; Thermo Scientific).
Northern blot analysis.
Total RNA of murine brain was isolated using TRIzol (Thermo Scientific) as described by the manufacturer. Total RNA (20 μg/lane) was separated in a 1 m formaldehyde/1% agarose gel and transferred onto Hybond-N+ nylon membrane (GE Healthcare). A 564 bp fragment of the Nat8L cDNA was used to synthesize a digoxigenin-labeled RNA antisense probe with DIG RNA labeling Mix (Roche). Hybridization was performed using standard procedures. Anti-digoxigenin-AP Fab fragments (11093274910; Roche) were used for signal detection and bound antibody was visualized by enhanced chemiluminescence with disodium 3-(4-methoxyspiro{1,2-dioxetane-3,2′-(5′-chloro)tricyclo[3.3.1.13,7]decan}-4-yl)phenylphosphate (Roche) as a substrate after exposure to x-ray films.
Reverse transcription real-time PCR.
Total RNA was isolated using TRIzol (Life Technologies) following the instructions of the manufacturer. cDNA was synthesized out of 5 μg of RNA using Superscript II reverse transcriptase (GE Healthcare) as described previously (Becker et al., 2008). Real-time PCR was done using SYBR Select Master Mix (Life Technologies) in an Applied Biosystems 7300 Real Time PCR system (Life Technologies). Data were analyzed by the 2−dCt method using actin as a housekeeping gene. All PCRs were done in duplicate and at least three independent experiments using RNA preparations from three mice per genotype were performed. Data were tested for significance using a two-tailed t test with a significance level of p < 0.05. The following primer pairs were used: actin (TCCATCATGAAGTGTGACGT, GAGCAATGATCTTGATCTTCAT), aspartoacylase (Aspa) (AACCACTCGTTCCATTGCCA, CTCTAAGGACACCGTGAGGC), ATP:citrate lyase (TGGATGCCACAGCTGACTAC, GGTTCAGCAAGGTCAGCTTC), MBP (GACCATCCAAGAAGACCCCAC, GCCATAATGGGTAGTTCTCGTGT), Nat8L (TGTGCGCTGCACACGGACAT, TTGCCGTCCAGCACAGCCAC), and PLP (TGAGCGCAACGGTAACAGG, GGGAGAACACCATACATTCTGG).
Measurement of NAA and NAAG.
NAA and NAAG were determined by an LC/MS method described previously (Lodder-Gadaczek et al., 2011) with minor modifications. Frozen brain tissue samples were grounded under liquid nitrogen using a mortar and one-third of the homogenate from one hemisphere was resuspended in 500 μl of ice-cold 90% methanol, passed 10 times through a 21 gauge needle, and sonicated for 5 min in a water bath sonifier. Stable isotope-labeled [13C/15N]-NAA and NAAG standards (Panatecs) were added and samples were incubated for 10 min at room temperature. Protein precipitates were sedimented by centrifugation for 10 min at 20,000 × g and 4°C and the protein content in the pellet was determined. The supernatant was dried under vacuum and dissolved in 50 μl of HPLC grade water. Insoluble material was removed by centrifugation for 10 min at 20,000 × g and 4°C. Samples were analyzed by a tandem LC/MS spectroscopy method. For HPLC (HPLC 1200 series; Agilent Technologies), a column (organic acid resin 250 × 4 mm sphere image; CS Chromatographie Service) with an organic acid resin, PS-DVB with a sulfonic acid changer, was used. The mobile phase consisted of 0.05% formic acid and absorbance was measured at 214 nm. For equilibration, the column was washed with the mobile phase for 1 h at a flow rate of 1 ml/min. The flow rate for all analysis was 0.5 ml/min. ESI/MS spectra (ESI-MS HCTultra; Bruker Daltonics) were recorded in negative ion mode with auto/MS fragmentation. Eluate fractions from the HPLC were injected directly. Nitrogen was used as a drying gas at 350°C. The collision gas was a mixture of helium with 3% argon. The capillary voltage was set to 4000 V.
Histology, immunohistochemistry, and immunofluorescence.
Mice were decapitated and brains were quickly removed. One hemisphere of each animal was fixed in Bouin's fixative (diluted 1:4 with PBS) overnight at 4°C. Fixed tissues were properly washed in tap water and embedded in paraffin. Alternatively, the hemispheres were fixed in 4% PFA overnight at 4°C and washed in PBS after paraffin embedding. Brain sections were cut at 4 μm using a Leica RM2155 microtome. After deparaffinization processed by a routine protocol, the sections were stained with H&E for histological illustration. Luxol Fast Blue staining was used for revelation of myelin and myelinated axons. For both immunohistochemistry and immunofluorescence analysis, paraffin sections were deparaffinized, followed by epitope uncovering by heat-induced antigen retrieval in citrate buffer. For immunohistochemistry, paraffin sections were treated with 0.3% Triton X-100 for 10 min and then blocked for 2 h with TBS containing 5% normal goat serum, 1% bovine serum albumin, and 0.1% Triton X-100 at room temperature. Incubation with the primary antibodies was performed in blocking solution at 4°C overnight. After washing with TBS, bound primary antibodies were detected using Super Sensitive Link-Label IHC detection system (BioGenex) and 3,3′-diaminobenzidine as a substrate. The sections were counterstained with hematoxylin, dehydrated, cleared with xylene, and mounted with DPX. For immunofluorescence analysis, sections were treated with sodium borohydride (2 mg/ml) for 10 min, washed 3 times with PBS, and blocked for 1 h with PBS containing 5% BSA and 0.4% Triton X-100 at room temperature. Incubation with the primary antibodies was done in PBS containing 1% BSA and 0.1% Triton X-100 overnight at 4°C. Sections were washed with PBS and then incubated with the appropriate secondary antibody and DAPI for 90 min at room temperature. After washing with PBS, a saturated Sudan Black B solution in 70% ethanol was used to reduce autofluorescence. The sections were washed with PBS, water, and finally mounted with ProLong Gold antifade reagent (Life Technologies).
High-resolution light microscopy and transmission electron microscopy.
Mice were killed by an overdose of anesthetics and immediately after death fixed by sequential transcardiac perfusion with first 30 ml of 1% procaine in PBS and then 200 ml of 6% glutardialdehyde and 1% procaine in PBS. After postfixation for at least 16 h in 6% glutardialdehyde, regions of interest were dissected, washed in buffer, postfixed in 1% OsO4 for 2 h, dehydrated in an ascending series of ethanol, and embedded in Spurr's resin using propylene oxide as an intermediate; the latter was chosen for its capacity to minimize shrinkage during embedding (Edwards et al., 2009). Blocks were cut at 1 μm for semithin sections being stained with pyronine G and toluidine blue for high-resolution light microscopy. Selected regions were then recut at 70 nm and sections contrasted with uranyl acetate and lead citrate for transmission electron microscopy.
NAA synthase activity.
NAA synthase activity was measured as described previously (Truckenmiller et al., 1985) with minor modifications. Briefly, brain tissues were homogenized in 100 mm sodium phosphate, pH 6.8, and homogenates were incubated in reaction mixture containing 100 mm sodium phosphate, pH 6.8, 1 mm l-[14C]-aspartate (2 μCi/μmol), and 0.5 mm acetyl-coenzyme A in a total volume of 20 μl. The reactions were incubated at 37°C for 30 min and stopped by adding 20 μl of ice-cold ethanol. After centrifugation (10,000 × g, 2 min), 5 μl of the supernatant was applied to an HPTLC silica gel plate und the chromatogram was developed with a solvent system of chloroform/methanol/acetic acid (90:10:50). Radioactive signals were visualized using a Fuji Bioimager and quantified using AIDA software (Raytest). Protein concentrations were determined with the Bio-Rad DC protein assay. [14C]-labeled aspartate was obtained from Hartmann Analytik.
WB analysis.
Frozen brain tissue samples were grounded under liquid nitrogen using a mortar. Tissues were homogenized in ice-cold TBS buffer containing 5 mm EDTA, 1 mm PMSF, 1 μg/ml aprotinin, and 1 μg/ml leupeptin and centrifuged for 1 h at 150,000 × g at 4°C. The pellet containing membranes was resuspended in 1% SDS in PBS. After centrifugation for 20 min at 20,000 × g at 4°C, samples of the supernatant were separated by SDS-PAGE on 7.5%, 10%, or 12.5% acrylamide gels and transferred onto nitrocellulose membranes by semidry blotting. Protein concentrations were determined with the Bio-Rad DC protein assay using BSA as a standard. After blocking in 5% nonfat milk in TBS, membranes were incubated with primary antibodies overnight at 4°C in 5% nonfat milk in TBS. After washing in TBS containing 0.05% Tween 20, membranes were incubated for 45 min in the dark with the appropriate DyLight 800- and DyLight 649-conjugated secondary antibodies. Bound antibodies were visualized and quantified using infrared fluorescence detection (Odyssey Imager System; Li-Cor Bioscience).
Lipid analysis.
Frozen brain tissue samples were ground under liquid nitrogen using a mortar. Lipids were extracted as described previously (Yaghootfam et al., 2005). Lipids corresponding to 1 mg of brain (wet weight) were loaded onto HPTLC silica gel 60 plates (Merck/Millipore) using an automatic TLC 4 sampler (CAMAG) and separated using chloroform/methanol/water (65:25:4; v/v/v) as a solvent system. Lipids were visualized by spraying with 0.625 m copper sulfate in 8% (v/v) phosphoric acid, followed by heating at 180°C for 5 min. Serial dilutions (0.2–3 μg) of bovine galactosylceramide (GalC) and sulfatide standards (Sigma-Aldrich) were applied onto the same TLC plate as the samples and used to construct a standard curve. Lipids were quantified by densitometry using AIDA software (Raytest).
Myelin purification.
Myelin was purified from brain by means of sucrose density gradient centrifugation as described previously (Zöller et al., 2008).
Behavioral analyses.
Rotarod tests were done using an accelerating rotarod from TSE Systems with male and female mice of the following genotypes: Nat8L+/+/Aspanur7/+, Nat8L+/+/Aspanur7/nur7, Nat8L+/−/Aspanur7/nur7, and Nat8L−/−/Aspanur7/nur7. On the first day, mice were acclimatized to the rotarod apparatus by placing them on the rod (rotating at a constant speed of 4 rpm) 2 times for 2 min with a 10 min break in between. Mice that fell off the rod during the 2 min were placed on the rod again (while timing was stopped). Mice that were unable to learn this task and fell off the rod repeatedly during the second 2 min training phase (2 Nat8L+/+/Aspanur7/nur7 mice) or that repeatedly jumped off the rod (1 Nat8L−/−/Aspanur7/nur7 mouse) were excluded from the experiment. On the next day, mice were placed on the accelerating rod and speed was increased continuously from 4 to 40 rpm within 5 min. The time, the number of mice that remained on the rod was determined (cutoff 5 min). The test was repeated two times with a 15 min break between trials and the mean of the three runs was calculated. The test runs were repeated on the following day. The assay was done with mice at an age of postnatal day 26 (P26)-P27 and P58-P60 (the same cohort of mice was used for both age groups). Open field tests were done with the same cohort of mice examined with the rotarod at an age of 1 month (P28-P30) and 2 months (P60-P70). The size of the open field box area (MED Associates) was 43 × 43 cm2. The tests were performed between 4:30 and 6:30 P.M. Tests were started by placing the mouse in the center of the open field box under bright light (110 lux) and movement of the mouse was monitored for 20 min. Thereafter, the mouse was returned into its home cage. The total activity (distance traveled), rearing activity (vertical time, vertical counts), and time spent in the center of the open field area were analyzed using Activity software (MED Associates). Additional open field tests were done with male Nat8L−/− and wild-type littermates of a separate colony that had not been crossed with the Aspanur7/nur7 mouse line at an age of 2–3 months.
Statistics.
Comparison of survival rates was done by log-rank test. Behavioral data of the open field test were tested for significance by ANOVA and post hoc Bonferroni test. All other comparisons were done using Student's t test. A significance level of p < 0.05 was used for all tests.
Results
Nat8L−/− mice lack NAA synthase activity but exhibit no loss of myelin
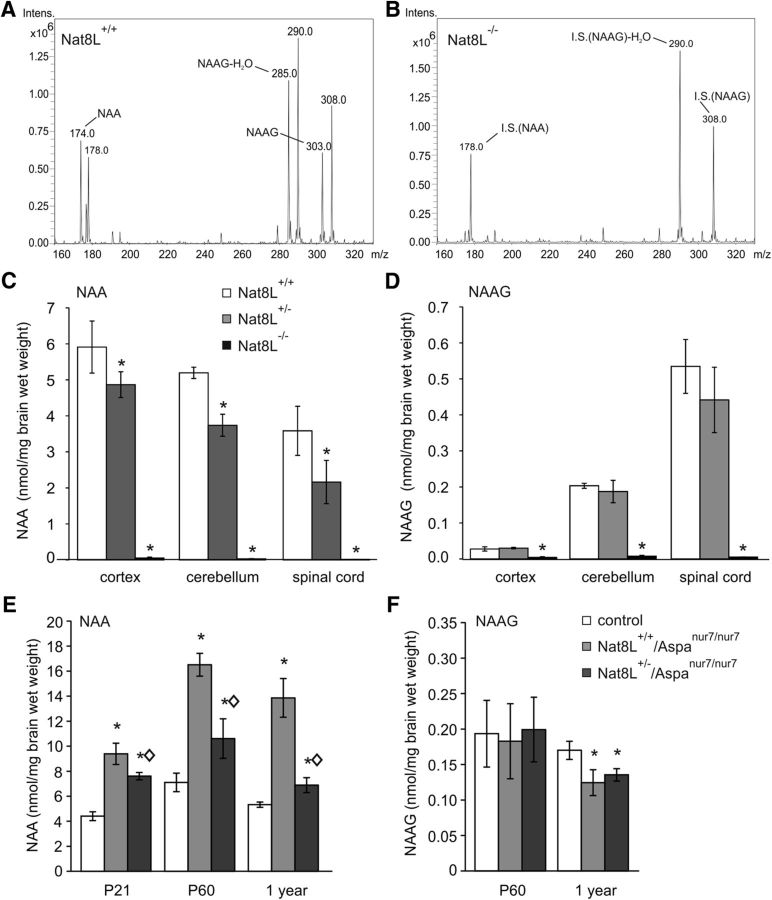
To enable the conditional knock-out of the NAA synthase gene (Nat8L), a targeting construct was generated in which exon 3, which contains the catalytically essential domain, was flanked by loxP sites. The FRT-flanked neoselection marker and the lacZ reporter gene were introduced downstream of exon 3 (Fig. 1A). Heterozygous floxed F1 males were crossed with female mice expressing Cre recombinase (pgk-Cre) to generate Nat8L-heterozygous mice. Heterozygous F1 mice lacking cre recombinase were mated to obtain litters with all possible genotypes. Nat8L−/− and Nat8L+/− mice were born at the expected mendelian ratio. Cre-mediated deletion of exon 3 of the Nat8L gene was confirmed by Southern blot analysis and PCR (Fig. 1B). Northern blot analysis confirmed the absence of Nat8L expression in Nat8L−/− mice and significant reduced expression in heterozygous (Nat8L+/−) mice (Fig. 1C), which correlated with the absence of and reduced NAA synthase activity in 2-month-old Nat8L−/− and Nat8L+/− mice, respectively (Fig. 1D). Expression of Aspa was unaltered in the Nat8L−/− mice. Expression of ATP:citrate lyase mRNA, which could potentially compensate a loss of NAA-derived acetyl-CoA for lipid synthesis during myelination and has been shown to be upregulated in brown adipose tissue in Nat8L−/− mice (Pessentheiner et al., 2013), was not changed in brains of 20-d-old Nat8L−/− mice (Fig. 1E). The concentrations of NAA and NAAG in brain samples from 3-month-old mice of all three genotypes was determined by LC-MS using isotope-labeled [13C/15N]-NAA and NAAG internal standards (Fig. 2A,B). NAA levels in heterozygous mice were reduced to different degree in different CNS regions (−17% in cortex, −27% in cerebellum, −40% in spinal cord) compared with wild-type littermates (Fig. 2C). NAA was undetectable in Nat8L−/− mice. In addition, the NAA-derived neuropeptide NAAG was absent in Nat8L−/− brains, but was not significantly reduced in Nat8L+/− mice (Fig. 2D). The expression of myelin genes such as PLP and MBP and MBP staining were not significantly altered in Nat8L−/− mice (Fig. 1E,G) and normal myelin content was confirmed by myelin isolation from total brain of 2-month-old mice (Fig. 1F). Consistent with these data, male Nat8L−/− mice exhibited no abnormal behavioral phenotype in the open field test (data not shown).
Figure 1.
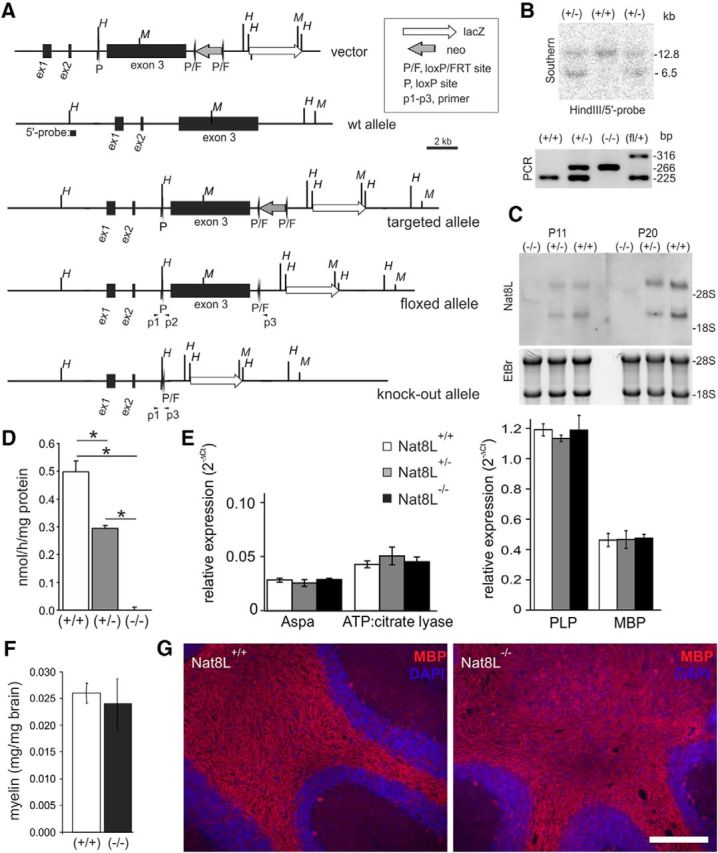
Generation and characterization of Nat8L-deficient mice. A, Targeting strategy to generate a conditional, floxed Nat8L allele. An FRT-flanked neomycin resistance gene and a lacZ reporter gene with an upstream splice acceptor site and an internal ribosome entry site (IRES) were inserted downstream of exon 3. Mice containing the targeted floxed Nat8L allele were crossed with transgenic deleter-Flp mice to remove the neomycin selection cassette or with pgk-Cre transgenic mice to create a Nat8L knock-out allele expressing the lacZ reporter gene under the control of the Nat8L promoter. The position of restriction enzyme cut sites used for Southern blot analysis (H, HindIII; M, MfeI) and the position of primers (p1–p3) used for PCR are indicated. B, Southern blot analysis of mouse genomic DNA digested with HindIII of wild-type (+/+) and heterozygous (+/−) Nat8L mice. PCR analysis of genomic DNA from Nat8L+/+, Nat8L+/−, Nat8L−/−, and heterozygous floxed (fl/+) mice: wild-type allele = 225 bp; knock-out allele = 266 bp; floxed allele = 316 bp (position of PCR primers are shown in A). C, Northern blot analysis of Nat8L expression in brain of 11- and 20-d-old Nat8L−/−, Nat8L+/−, and Nat8L+/+ littermates indicating the absence and reduced expression of Nat8L mRNA in Nat8L−/− and Nat8L+/− mice, respectively, and upregulation of Nat8L during postnatal development in wild-type mice. Two different mRNAs are present because of an alternative polyadenylation site in exon 3. D, NAA synthase activity was undetectable in Nat8L−/− mice and reduced to ∼60% in Nat8L+/− mice compared with Nat8L+/+ littermates (age: 2 months; mean ± SD, n = 3; *p < 0.05, t test). E, Quantitative real-time PCR revealed no significant changes in the expression of Aspa, ATP:citrate lyase, PLP, and MBP in total brain of 20-d-old Nat8L−/−, Nat8L+/− and wild-type littermates (mean ± SEM, n = 3). F, Myelin was isolated from the brains of 2-month-old Nat8L+/+ and Nat8L−/− mice by sucrose gradient centrifugation. No significant difference in myelin content was observed (mean ± SD, n = 3). G, MBP immunofluorescence staining on brain paraffin sections of 1-year-old animals showed no obvious difference between wild-type and Nat8L−/− mice in cerebellum (G) or other brain regions (data not shown). Scale bar, 200 μm.
Figure 2.
NAA and NAAG quantification. Quantification of NAA and NAAG was done by mass spectrometry using stable-isotope-labeled internal standards. Representative ESI-MS spectra (negative ion mode) of methanolic peptide extracts of the cerebellum from 3-month-old Nat8L+/+ (A) and Nat8L−/− (B) mice are shown. Mass peaks of m/z 303.0 and 174.0 correspond to NAAG and NAA, respectively. As expected, none of these signals was detectable in the peptide extracts of Nat8L−/− mice (B). Mass peaks of m/z 308.0 and 178.0 correspond to the 13C-labeled NAAG and NAA internal standards (I.S.) that were used for quantification. Mass peaks of m/z 285.0 and 290.0 correspond to NAAG and 13C-NAAG after elimination of H2O, respectively. C, D, ESI-MS detection of NAA and NAAG in selected brain regions of 3-month-old mice. C, Compared with wild-type (Nat8L+/+) littermates, Nat8L+/− mice showed a significant reduction in NAA in cortex, cerebellum, and spinal cord (1-tailed t test, *p < 0.05, n = 3), whereas NAA was undetectable in Nat8L−/− mice. D, The concentration of NAAG was significantly reduced below the detection limit in all three examined brain regions in Nat8L−/− mice, but was not significantly altered in Nat8L+/− mice compared with wild-type controls. E, F, Quantification of NAA and NAAG in total brain homogenates. Nat8L+/+/Aspanur7/+ (control), Nat8L+/+/Aspanur7/nur7, and Nat8L+/−/Aspanur7/nur7 mice were analyzed at three different ages. E, As expected, Nat8L+/+/Aspanur7/nur7 animals showed a statistically significant increase of NAA compared with Nat8L+/+/Aspanur7/+ littermates (control) at every examined time point (t test, *p < 0.05, n = 3–6). Likewise, NAA was elevated in Nat8L+/−/Aspanur7/nur7 mice, although NAA concentrations in these mice were significantly lower compared with Nat8L+/+/Aspanur7/nur7 mice at all ages examined (diamonds, t test, p < 0.05, n = 3–6). F, Total brain concentration of NAAG was not altered at P60 in all analyzed genotypes. However, a statistically significant reduction of NAAG was observed in Nat8L+/+/Aspanur7/nur7 and Nat8L+/−/Aspanur7/nur7 mice at the age of 1 year compared with controls (t test, *p < 0.05, n = 3–6).
Deletion of one Nat8L allele in Aspanur7/nur7 mice reduces NAA accumulation
Because no obvious myelin phenotype was observed in Nat8L−/− mice, we examined whether absence of or reduced NAA synthesis in a CD mouse model could prevent the disease or improve its phenotype. Nat8L−/− mice were therefore crossed with the Aspanur7/nur7 mouse line, which contains a nonsense mutation (Q193X) in the Aspa gene (Traka et al., 2008). We used a mass spectrometry method for NAA and NAAG quantification (Lodder-Gadaczek et al., 2011). As expected, NAA was strongly increased in Nat8L+/+/Aspanur7/nur7, compared with Nat8L+/+/Aspanur7/+ mice (control) (Fig. 2E), but was not detectable in Nat8L−/−/Aspanur7/nur7 mice (data not shown). Nat8L+/−/Aspanur7/nur7 mice had significantly reduced NAA levels compared with Nat8L+/+/Aspanur7/nur7 mice, but these were still higher than in controls. Interestingly, NAA concentrations increased strongly between P21 and P60, but slightly declined between P60 and 12 months in all genotypes (Fig. 2E). This suggests that substantial amounts of NAA, comparable to or even exceeding the amount of NAA synthesized, can be transported through the blood–brain barrier and possibly excreted in Aspa-deficient mice.
NAAG levels have been found to be increased in the urine of CD patients (Burlina et al., 1994). However, NMR measurements of NAAG did not show elevated NAAG levels in the brain of Aspa-deficient mice (Surendran et al., 2004; Traka et al., 2008). Consistent with this, we found similar brain NAAG concentrations in all genotypes at P60. However, in 1-year-old Nat8L+/+/Aspanur7/nur7 and Nat8L+/−/Aspanur7/nur7 mice, NAAG was significantly reduced by 25% and 22%, respectively (Fig. 2F).
Survival rate and behavior of Aspanur7/nur7 mice in the absence or with reduced levels of NAA
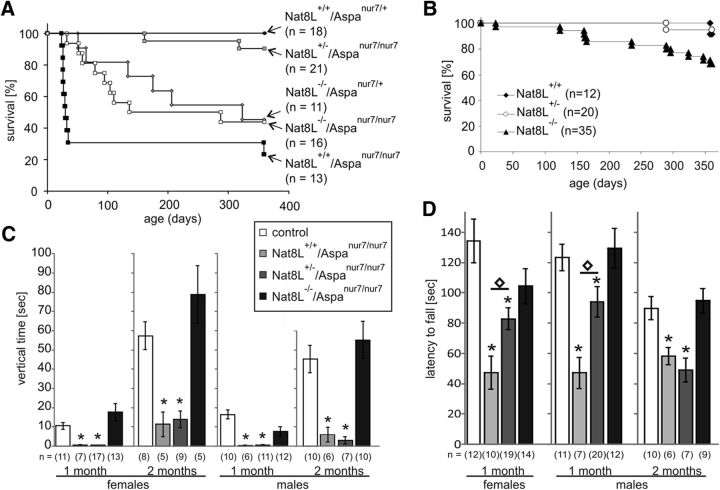
The majority of Nat8L+/+/Aspanur7/nur7 mice died within 4 weeks, consistent with previous reports on similar CD mouse models (Fig. 3A). This high mortality rate correlates well with the substantial increase in NAA in young animals (Fig. 2). Mortality of the mice surviving this period was, however, very low, which correlates with the absence of the further increase of NAA in the adult mice (see above). Nevertheless, these mice showed the typical symptoms of CD such as ataxic gait, tremors, and seizures. Surprisingly, Nat8L−/−/Aspanur7/nur7 mice had a significantly reduced life span (Fig. 3A). This was also the case for Nat8L−/−/Aspa+/+ mice (Fig. 3B), indicating that premature death was independent of the Aspa genotype. These mice died suddenly without any obvious signs of illness, weight loss, or seizures. To investigate how sensitive mice are to a NAA reduction, we generated Aspanur7/nur7 mice with only one functional copy of the NAA synthase gene (Nat8L+/−/Aspanur7/nur7). Nat8L+/−/Aspanur7/nur7 mice developed similar symptoms as Nat8L+/+/Aspanur7/nur7, but their survival rate improved significantly compared with that of control mice. This shows that reduced NAA levels are beneficial for CD mice. In addition, when Nat8L+/−/Aspanur7/nur7 are compared with Nat8L−/−/Aspanur7/nur7, the survival time is also significantly improved, suggesting a vital function of NAA that does not depend on its degradation by ASPA. In agreement with previous reports, body weights were reduced in Nat8L+/+/Aspanur7/nur7 mice (data not shown). In contrast, Nat8L−/−/Aspanur7/nur7 mice had normal body weights throughout development and body weights of Nat8L+/−/Aspanur7/nur7 mice were slightly reduced compared with controls, although they were significantly increased compared with Nat8L+/+/Aspanur7/nur7 mice (data not shown).
Figure 3.
Nat8L−/−/Aspanur7/nur7 mice have normal motor coordination capabilities, but survival time is not improved compared with Nat8L+/+/Aspanur7/nur7 mice. A, Kaplan–Meier plots revealing that the survival of Aspanur7/nur7 mice is strongly increased when they are heterozygous for the Nat8L gene (Nat8L+/−/Aspanur7/nur7). There was no significant difference between these and Nat8L+/+/Aspanur7/+ mice (log-rank test, p > 0.05). Mortality of Nat8L−/−/Aspanur7/nur7 mice was comparable to that of Nat8L−/−/Aspanur7/+ mice, indicating that premature death was not caused by NAA accumulation. Nevertheless, survival times of these mice were not significantly different from that of Nat8L+/+/Aspanur7/nur7 mice (log-rank test, p > 0.05). B, Kaplan–Meier plots showing increased lethality of Nat8L−/− mice. Approximately 30% of the Nat8L−/− mice died suddenly within 1 year without any preceding signs of sickness or abnormal behavior. Differences in survival time between Nat8L−/−/Aspanur7/+ (A) and Nat8L−/−/Aspa+/+ mice (B) might be due to differences in the genetic background. C, Rearing activity (vertical time during the 20 min test session) measured in the open field test. The test was performed with male and female mice of the indicated genotypes at 1 and 2 months of age. Data shown are the mean ± SEM (the number of animals analyzed is given below each column). Asterisks indicate statistically significant differences compared with Nat8L+/+/Aspanur7/+ mice (ANOVA with post hoc Bonferroni test; *p < 0.05). There was no significant difference between Nat8L+/−/Aspanur7/nur7 and Nat8L+/+/Aspanur7/nur7 mice. D, To examine motor coordination capability, accelerating rotarod tests were performed at 1 and 2 months of age with mice of the indicated genotypes. Latency to fall was significantly reduced in Nat8L+/−/Aspanur7/nur7 and Nat8L+/+/Aspanur7/nur7 mice compared with controls. Asterisks indicate significant differences from controls (Nat8L+/+/Aspanur7/+) (*p < 0.05, t test). Diamonds indicate significant differences between Nat8L+/−/Aspanur7/nur7 and Nat8L+/+/Aspanur7/nur7 mice. Data shown are the mean ± SEM (the number of animals analyzed is given below each column).
The behavior of all mice was examined in the open field test. Activity (total distance traveled) was reduced in both Nat8L+/+/Aspanur7/nur7 and Nat8L+/−/Aspanur7/nur7 mice (data not shown), but was normal in Nat8L−/−/Aspanur7/nur7 mice. A much more sensitive indicator for the CD phenotype was rearing activity (vertical time), which was strongly reduced in the Nat8L+/+/Aspanur7/nur7 mice and to a similar extent also in the Nat8L+/−/Aspanur7/nur7 mice (Fig. 3C). Again, performance of the Nat8L−/−/Aspanur7/nur7 mice was not significantly different from control mice. In addition, accelerating rotarod tests were done with mice of all genotypes at 1 and 2 months of age using the same cohort of mice at both ages (Fig. 3D). Consistent with previous reports (Traka et al., 2008; Mersmann et al., 2011; Ahmed et al., 2013), latency to fall off the rotating rod was reduced by ∼50% in Nat8L+/+/Aspanur7/nur7 mice compared with controls. In contrast, latency to fall of Nat8L−/−/Aspanur7/nur7 mice was similar to controls. Therefore, motor coordination deficits of the Nat8L+/+/Aspanur7/nur7 mice were apparently fully rescued by the additional Nat8L deficiency. Rotarod performance of the Nat8L+/−/Aspanur7/nur7 mice was significantly improved at 1 month of age compared with Nat8L+/+/Aspanur7/nur7 mice, although it was still worse than in control mice. This was no longer the case at 2 months of age, which may be explained by the premature death of the majority of Nat8L+/+/Aspanur7/nur7 mice and probably the survival of only those animals that were less severely affected by the disease. Together, the behavioral analyses revealed an apparently complete functional rescue in Nat8L−/−/Aspanur7/nur7 mice, however, without a significantly increased survival time. In contrast, reducing NAA synthesis by deleting one functional Nat8L allele completely normalized the survival rate of Aspanur7nur7 mice and also resulted in a significantly improved behavioral phenotype.
Nat8L deficiency in Aspanur7/nur7 mice prevents spongy degeneration and demyelination
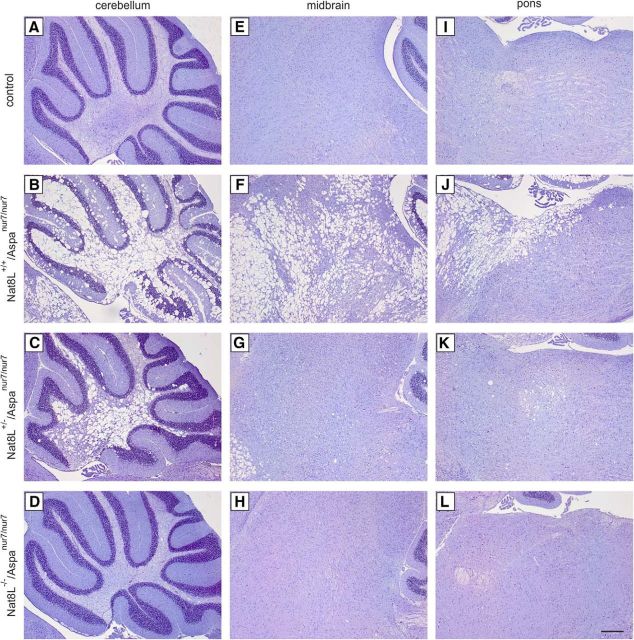
Analysis of brains (21-d-old mice) by high-resolution semithin sections using a protocol suitable to retain myelin lipids in the sections (Fig. 4) confirmed a massive spongy degeneration of white matter in the cerebellum of Nat8L+/+/Aspanur7/nur7 mice, which was most pronounced around the deep cerebellar nuclei, but less prominent within the folial white matter (Fig. 4E). Within the corpus callosum, white matter degeneration mainly affected the immediate subcortical callosal surface, from here visibly extending along the myelinated thalamocortical fibers into the deeper layers of the isocortex up to about lamina 4 (Fig. 4H). In Nat8L−/−/Aspanur7/nur7 mice, the effects on the cerebellum and corpus callosum were reversed to wild-type morphology (cf. Fig. 4C,F,I and A,D,G). With increasing age, the spongy degeneration became more extensive in Nat8L+/+/Aspanur7/nur7 mice, but remained absent from Nat8L−/−/Aspanur7/nur7 mice (Fig. 5). Remarkably, Nat8L+/−/Aspanur7/nur7 mice (Fig. 5C,G,K) showed a less severe spongy degeneration compared with Nat8L+/+/Aspanur7/nur7 mice (Fig. 5B,F,J). This difference was most obvious in the pons and midbrain (cf. Fig. 5F,J and G,K), but was also visible in the cerebellum (cf. Fig. 5B,C) and other brain regions (data not shown). Vacuolation was not observed in the brains of Nat8L−/−/Aspanur7/nur7 mice (Fig. 5D,H,L).
Figure 4.
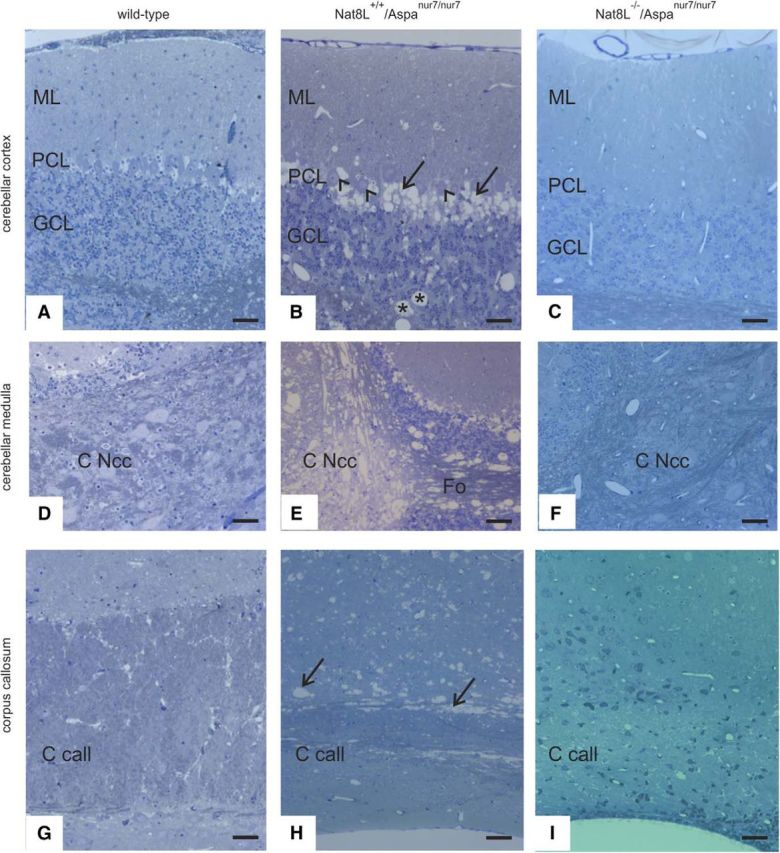
Histopathology of cerebellum and corpus callosum. Figure shows sections of the cerebellar cortex (A–C), cerebellar medulla (D–F), and corpus callosum (G–I) of 21-d-old mice of the indicated genotypes. Compared with wild-type (A), Nat8L+/+/Aspanur7/nur7 cerebellum (B) features vacuolic degeneration both within granule cell layer (GCL) and folial white matter (asterisks), but most prominently at the level of the Purkinje cell layer (PCL, arrows). Interestingly, the majority of Purkinje cell somata appear to be preserved (arrowheads), indicating that the degeneration seen here is confined to passing axons and possibly Bergmann glia cell bodies. In Nat8L−/−/Aspanur7/nur7 mice (C), the effects on the cerebellar cortex are reversed to wild-type morphology. A similar, but more severe, effect of Aspa deficiency is seen around the deep cerebellar nuclei (C Ncc; cf. Nat8L+/+/Aspanur7/nur7 morphology in E with wild-type in D), again reversed in Nat8L−/−/Aspanur7/nur7 mice (F). Note that the severe degeneration seen in the medullary center of the cerebellum (E) is only partially seen in the folial white matter (Fo in E). Within the corpus callosum (G–I), lesions in Nat8L+/+/Aspanur7/nur7 are mainly observed at its dorsal aspect (H, arrows), extending into the deeper layers of the cortex up to about layer IV. Again, degeneration is not seen in Nat8L−/−/Aspanur7/nur7 mice (I). Scale bars, 50 μm.
Figure 5.
Less severe spongy degeneration in Aspanur7/nur7 heterozygous for Nat8L. HE staining on sagittal paraffin-embedded brain sections of Nat8L+/+/Aspanur7/+ (control) (A, E, I), Nat8L+/+/Aspanur7/nur7 (B, F, J), Nat8L+/−/Aspanur7/nur7 (C, G, K), and Nat8L−/−/Aspanur7/nur7 (D, H, L) mice at the age of 1 year. Extensive vacuolation was observed in cerebellum (A–D), midbrain (E–H), and pons (I–L) of Nat8L+/+/Aspanur7/nur7. Vacuolation was much less intense in Nat8L+/−/Aspanur7/nur7 mice, most obvious in midbrain and pons, but also in cerebellum (C, G, K), and absent from Nat8L−/−/Aspanur7/nur7 mice (D, H, L). Scale bar, 200 μm.
Loss of myelin in Nat8L+/+/Aspanur7/nur7 and Nat8L+/−/Aspanur7/nur7 mice was examined using Luxol Fast Blue staining, which revealed widespread white matter degeneration in the cerebellum (Fig. 6B,C), corpus callosum (Fig. 6F,G), and other brain regions (data not shown), whereas myelin staining in Nat8L−/−/Aspanur7/nur7 mice (Fig. 6D,H) was comparable to controls (Fig. 6A,E). Myelin was further quantified in 2-month-old animals using WB analysis of major myelin proteins, showing significantly reduced levels of PLP, l-MAG, and MBP in Nat8L+/+/Aspanur7/nur7 and Nat8L+/−/Aspanur7/nur7 mice, but normal levels in Nat8L−/−/Aspanur7/nur7 mice (Fig. 7).
Figure 6.
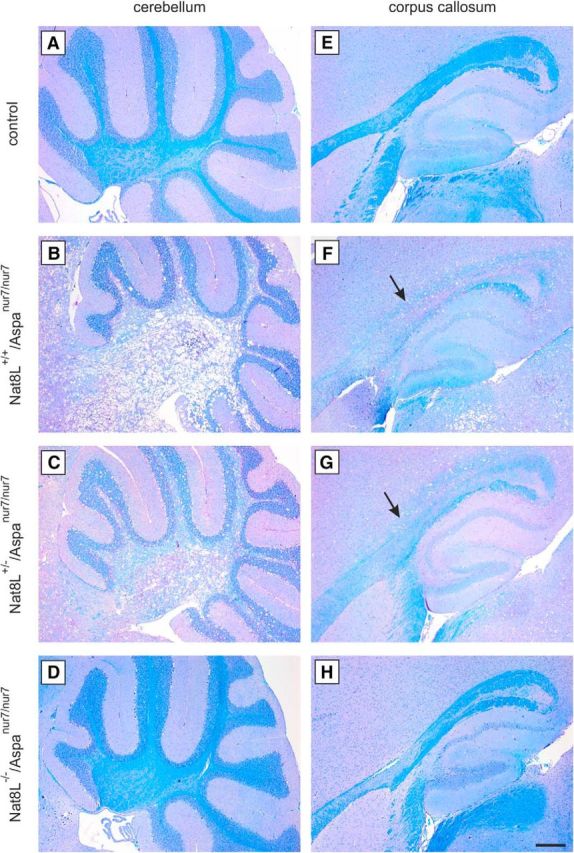
Luxol Fast Blue staining. A–H, Luxol Fast Blue staining of sagittal paraffin embedded brain sections of 60-d-old animals. Spongy degeneration and vacuoles formation go along with demyelination in Nat8L+/+/Aspanur7/nur7 (B, F) mice. Demyelination is demonstrated by less intense Luxol Fast Blue staining (arrows in F and G) shown, for example, in the white matter of cerebellum (A–D) and corpus callosum (E–H) compared with control littermates (A, E). Nat8L−/−/Aspanur7/nur7 (D, H) did not show any indication of myelin loss compared with controls. Scale bar, 200 μm.
Figure 7.
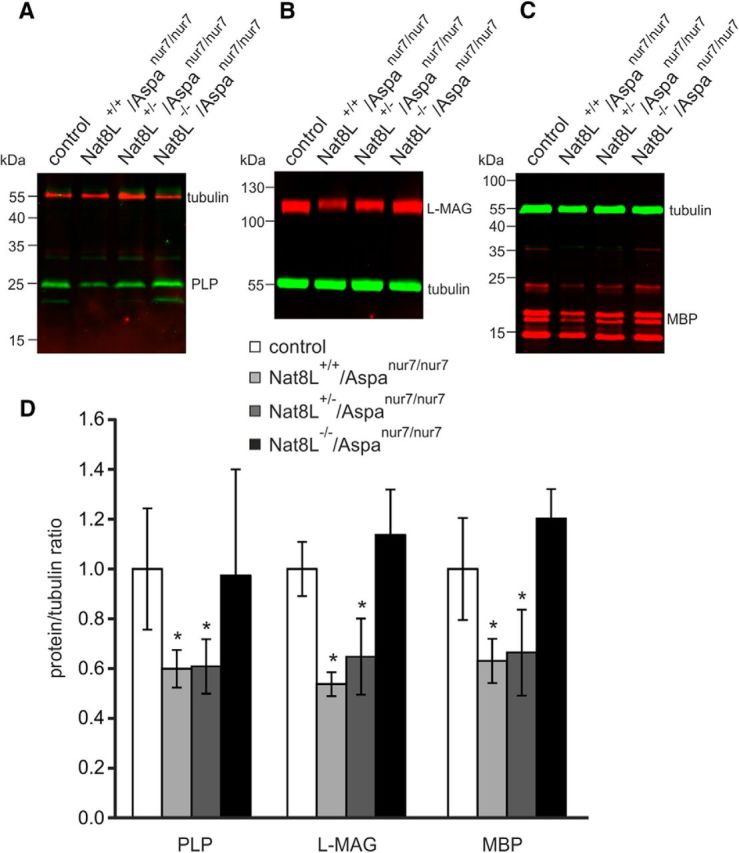
WB analysis of myelin proteins. The 60-d-old Nat8L+/+/Aspanur7/nur7 and Nat8L+/−/Aspanur7/nur7 mice showed reduced levels of PLP (A, D), l-MAG (B, D), and MBP (C, D) compared with controls. In contrast, the amounts of these myelin proteins were not significantly reduced in Nat8L−/−/Aspanur7/nur7 mice (*p < 0.05, t test; n = 3–4).
On electron microscopic inspection (Fig. 8), vacuoles in Nat8L+/+/Aspanur7/nur7mice could be identified as dramatically swollen axons surrounded by compressed myelin layers, the latter often already fragmented (Fig. 8B). Vacuole formation and separation of lamellae within the myelin sheaths was not or only rarely encountered. In Nat8L−/−/Aspanur7/nur7 mice, myelin structure appeared largely normal (Fig. 8C,E); however, unusually broad internal mesaxa were regularly encountered (Fig. 8E, inset), which were not observed in wild-type controls (Fig. 8D). In addition, we found enlargement of characteristically pale astrocytic somata (Fig. 8E) extending unusually broad processes that tended to group neighboring axons into microfascicles. Despite these structural changes, the g-ratio of myelinated axons in the optic nerve of 8-week-old of Nat8L−/−/Aspanur7/nur7: (0.99 ± 0.28) and wild-type mice (0.93 ± 0.23) did not differ significantly (Fig. 8F), demonstrating a normal thickness of myelin sheaths relative to axon caliber.
Figure 8.
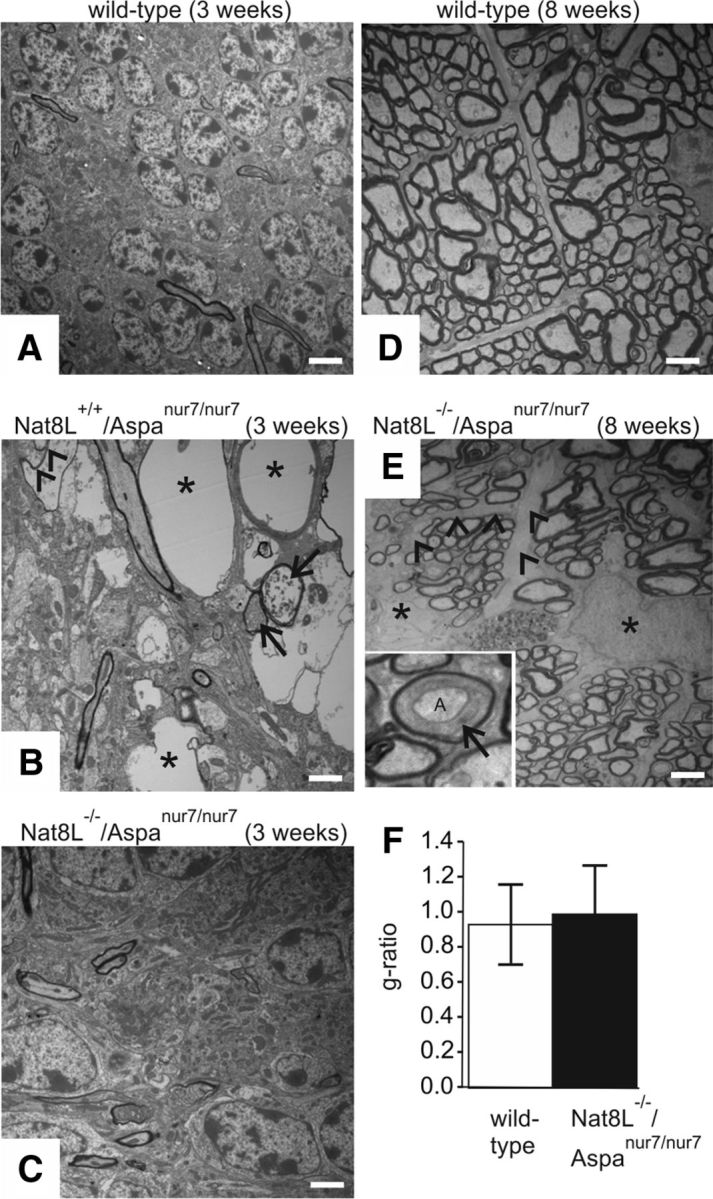
Ultrastructural analysis of CNS. TEM analysis of Nat8L+/+/Aspanur7/nur7 mice reveals drastically swollen axons (asterisks in B) without visible remainders of myelin sheaths (cerebellum, 3 weeks). Less severely affected axons (B, arrows) are filled with debris, but are still surrounded by apparently compressed myelin. Occasionally, intermediate forms are seen (B, arrowheads) in which fragments of myelin are visible along parts of the axonal perimeter. As already seen by light microscopy, defects are no longer visible in Nat8L−/−/Aspanur7/nur7 mice (C). To ascertain the formation of normal myelin sheaths in Nat8L−/−/Aspanur7/nur7 mice, we have chosen the optic nerve (D–F), which, due to its rather homogenous fiber population, would simplify detection of smaller g-ratio deviations (8-week-old mice were examined). Although myelinated fibers look normal again in Nat8L−/−/Aspanur7/nur7 mice (cf. E with wild-type controls shown in D), we occasionally identified axons with minor structural aberrations of the surrounding myelin sheath, most notably axons (“A” in inset of E) surrounded by an unusually broad internal mesaxon (arrow in inset). Furthermore, we observed enlargement of characteristically pale astrocytic somata (asterisks in E) extending unusually broad processes (E, arrowheads), tending to group neighboring axons into microfascicles. Despite these moderate structural abnormalities, the g-ratio in Nat8L−/−/Aspanur7/nur7 mice (black bar in F) corresponds to that of wild-type mice (white bar in F), demonstrating a normal thickness of myelin sheaths relative to axon caliber. Scale bars: A–C, 3 μm; D, E, 1.5 μm; E, inset, 0.5 μm.
Vacuolation in the corpus callosum of Nat8L+/+/Aspanur7/nur7 (Fig. 9C,G) and Nat8L+/−/Aspanur7/nur7 mice (Fig. 9D,H) at P21 was less intense than in other white matter tracts. Moreover, although spongy degeneration in general worsens with age in both Nat8L+/+/Aspanur7/nur7 and Nat8L+/−/Aspanur7/nur7 mice, vacuolation in the corpus callosum was less severe at P60 compared with P21 (data not shown) and almost undetectable in 1-year-old mice (Fig. 9E,F,I,J). In Nat8L+/+/Aspanur7/nur7 mice, this might in part be explained by the premature death of more severely affected mice. This, however, cannot explain the same observation in Nat8L+/−/Aspanur7/nur7 mice, which had an almost normal survival rate at least until 1 year of age (Fig. 3A). Therefore, it seems possible that spongy degeneration is reversible in less affected regions.
Figure 9.
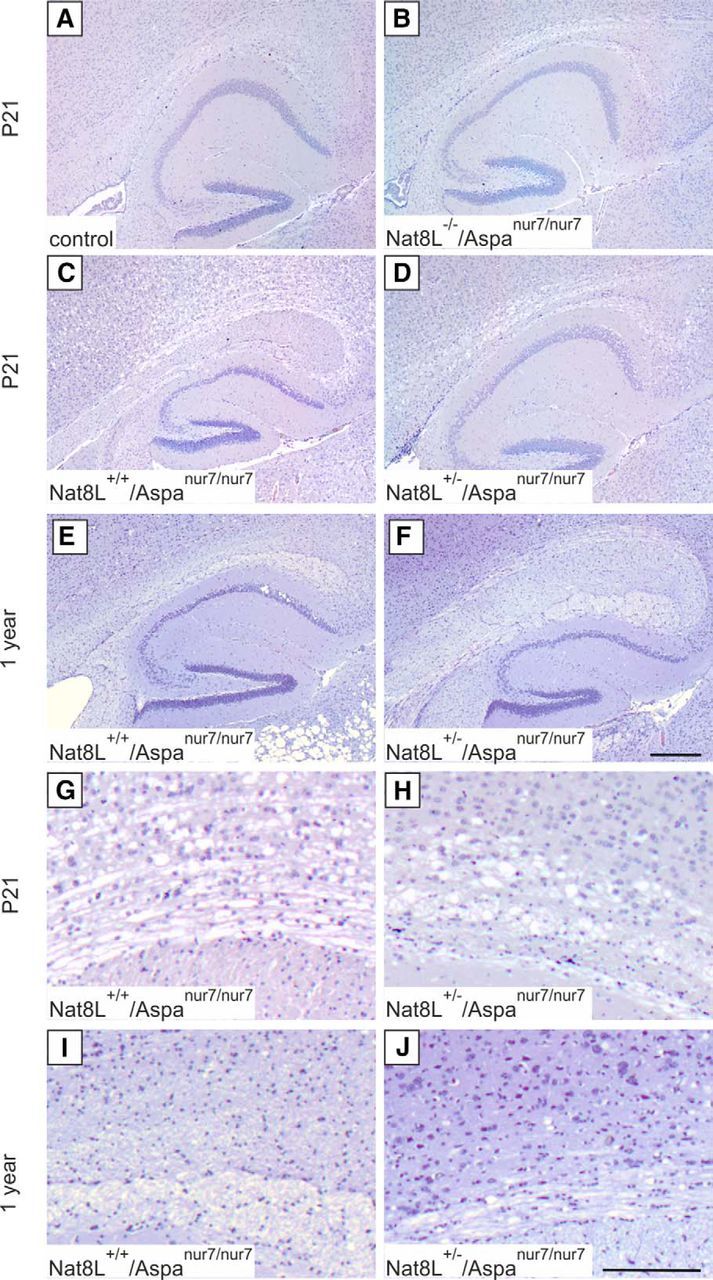
Reduced vacuolation in the corpus callosum of aged Aspanur7/nur7 mice. HE staining on sagittal paraffin-embedded brain sections demonstrate a reversible phenotype in the corpus callosum of Nat8L+/+/Aspanur7/nur7 and Nat8L+/−/Aspanur7/nur7 mice. At the age of P21, Nat8L+/+/Aspanur7/nur7 (C, G) and Nat8L+/−/Aspanur7/nur7 (D, H) mice show a clear vacuolation in the white matter of corpus callosum compared with Nat8L+/+/Aspanur7/+ (control) (A) and Nat8L−/−/Aspanur7/nur7 (B) mice. At the age of 1 year, only a few small vacuoles were evident in this brain region and the histology appeared almost normal in Nat8L+/+/Aspanur7/nur7 (E, I) and Nat8L+/−/Aspanur7/nur7 (F, J) mice. Images G–J show higher magnifications of the images C–F. Scale bars: A–F, 200 μm; G–J: 100 μm.
Nat8L deficiency prevents axon degeneration in Aspanur7/nur7 mice
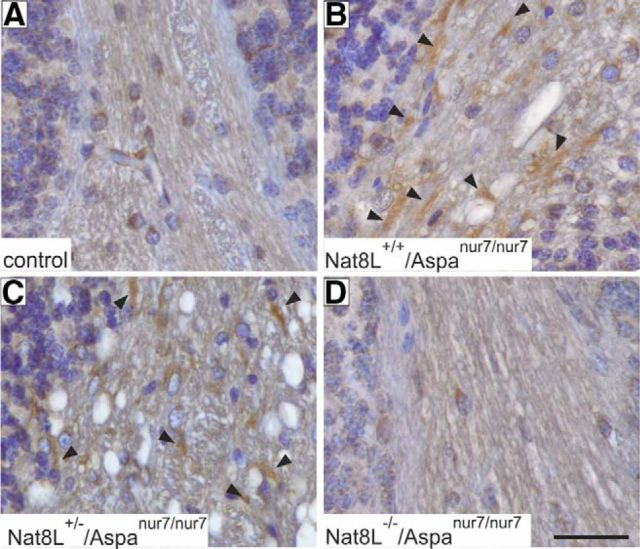
Aspanur7/nur7 mice exhibit significant axonal degeneration (Traka et al., 2008), which might be secondary to myelin degeneration. Conversely, because of the high concentration of NAA in axons (Bjartmar et al., 2002), its absence in neurons may also affect axonal integrity directly. The electron microscopic examination shown in Figure 8 confirmed axon degeneration in Nat8L+/+/Aspanur7/nur7 mice (Fig. 8B) and indicated its absence from Nat8L−/−/Aspanur7/nur7 mice (Fig. 8C,E). This was further confirmed by APP staining, which revealed axonal degeneration in white matter tracts in the cerebellum of Nat8L+/+/Aspanur7/nur7 mice (Fig. 10B) and Nat8L+/−/Aspanur7/nur7 mice (Fig. 10C), but not in Nat8L−/−/Aspanur7/nur7 mice (Fig. 10D) or controls (Fig. 10A). Therefore, the absence of NAA seems not to impair axonal integrity and axon loss in CD mice appears to be secondary to myelin degeneration.
Figure 10.
Nat8L deficiency prevents axon degeneration in Aspanur7/nur7 mice. Shown is immunohistochemical staining for APP on sagittal paraffin-embedded brain sections at the age of P60. Positive signals (arrowheads) were detectable in the cerebellar white matter of Nat8L+/+/Aspanur7/nur7 (B) and Nat8L+/−/Aspanur7/nur7 (C) mice, demonstrating axonal degeneration but none in control littermates (A) or Nat8L−/−/Aspanur7/nur7 mice (D). Scale bars, 20 μm.
Nat8L deficiency prevents the massive astrogliosis in Aspanur7/nur7 mice
Because the electron microscopic examination revealed enlarged astrocytic somata with unusual broad processes in the optic nerve (Fig. 8E), we investigated to what extent astrogliosis is reverted in Nat8L−/−/Aspanur7/nur7 compared with Nat8L+/+/Aspanur7/nur7 mice. Analysis at P21 and P60 revealed a strong increase in GFAP staining in Nat8L+/+/Aspanur7/nur7 and Nat8L+/−/Aspanur7/nur7 mice (Fig. 11). GFAP signals in Nat8L−/−/Aspanur7/nur7 mice, however, were similar to control mice. To quantify astrogliosis, WB analyses were done in parallel, confirming the immunofluorescence data showing a significant increase in GFAP at P60 in Nat8L+/+/Aspanur7/nur7 and Nat8L+/−/Aspanur7/nur7 mice, but not in Nat8L−/−/Aspanur7/nur7 mice (Figs. 11A,B). Therefore, the widespread massive astrogliosis found in Aspanur7/nur7 mice depends mainly on NAA accumulation and is secondary to the spongy myelin degeneration.
Figure 11.
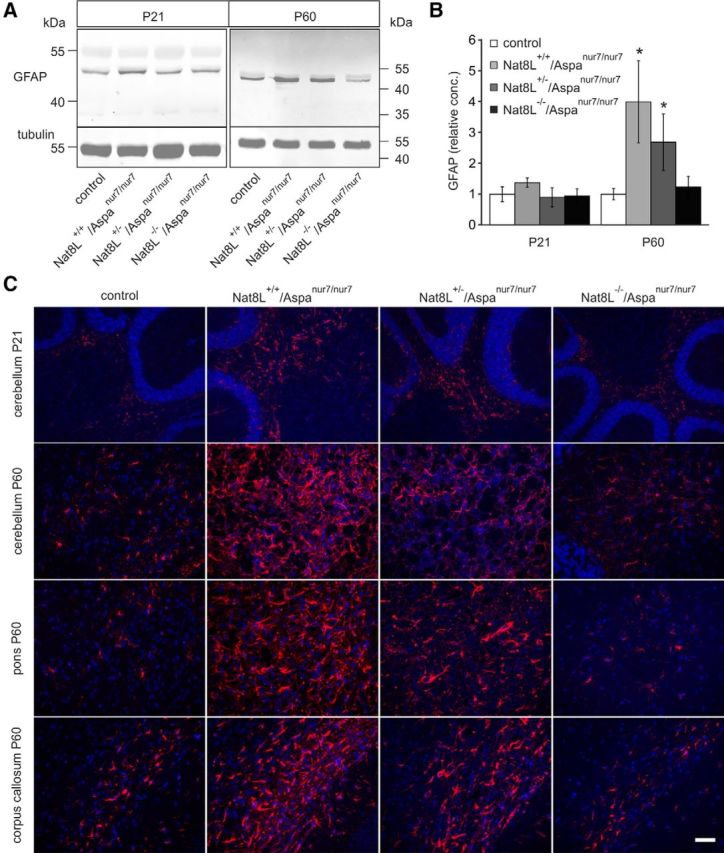
Nat8L deficiency prevents the massive astrogliosis in Aspanur7/nur7 mice. A, WB analysis of total brain homogenates indicated a strong increase in GFAP in Nat8L+/+/Aspanur7/nur7 and Nat8L+/−/Aspanur7/nur7 mice. Blots were reprobed with antibodies against α-tubulin as a loading control. B, Densitometric quantification of GFAP WBs showed a statistically significant elevation of GFAP in Nat8L+/+/Aspanur7/nur7 and Nat8L+/−/Aspanur7/nur7 mice at P60. GFAP signals were normalized to tubulin and the mean of controls was set to 1 (*p < 0.05, t test; n = 3). C, GFAP immunofluorescence staining confirmed increased GFAP expression and indicated a less severe GFAP upregulation in some brain regions (e.g., cerebellum) of Nat8L+/−/Aspanur7/nur7 compared with Nat8L+/+/Aspanur7/nur7 mice. Scale bar, 100 μm.
Nat8L−/−/Aspanur7/nur7 mice exhibit normal sphingolipid composition
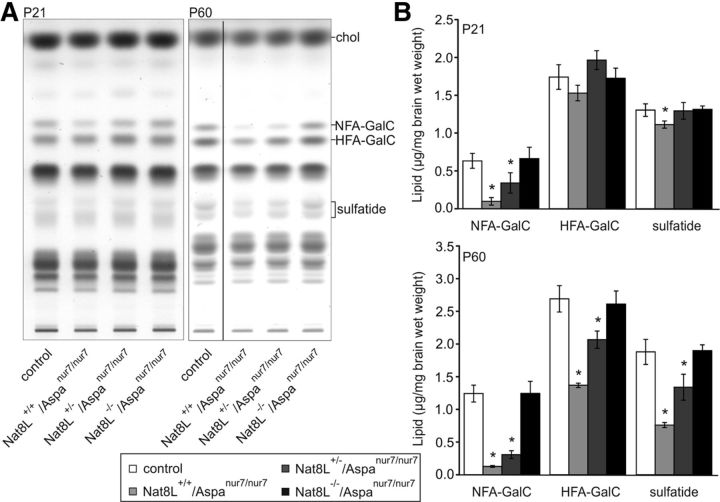
Previous studies demonstrated significant changes in the myelin lipid composition in Aspa-deficient mice and tremor rat (Madhavarao et al., 2005; Traka et al., 2008; Wang et al., 2009). In particular, a strong reduction in the concentration of nonhydroxylated fatty acid containing GalC (NFA-GalC) was observed, which was viewed as an argument for the hypothesis that NAA-derived acetate is required for efficient myelin lipid synthesis (Ledeen et al., 2006). Confirming these data, TLC analysis of brain lipids showed strong reduction of NFA-GalC in Nat8L+/+/Aspanur7/nur7 mice at P21 and P60, whereas 2-hydroxylated fatty acid-containing GalC (HFA-GalC) levels were reduced to a lesser extent at P60 only (Fig. 12). Sulfatide was also slightly reduced (whether in this case also only NFA-sulfatide was affected could not be examined, because NFA- and HFA-sulfatide are not separated under standard TLC conditions). Loss of GalC and sulfatide was less pronounced in Nat8L+/−/Aspanur7/nur7 mice. Moreover, sphingolipid levels in Nat8L−/−/Aspanur7/nur7 mice were not different from control mice, indicating that the reduction of myelin-specific sphingolipids in Nat8L+/+/Aspanur7/nur7 mice is not due to an insufficient supply of acetyl groups by NAA.
Figure 12.
Myelin sphingolipid levels are normalized in Aspanur7/nur7 mice with an additional Nat8L deficiency. A, Lipids were isolated from total brain of Nat8L+/+/Aspa+/+ or Nat8L+/+/Aspanur7/+ (control), Nat8L+/+/Aspanur7/nur7, Nat8L+/−/Aspanur7/nur7, and Nat8L−/−/Aspanur7/nur7 mice at the age of P21 and P60. Total lipids were separated by HPTLC and quantified by densitometry. The amount of lipids corresponding to 1 mg wet weight of brain tissue was applied per lane. Positions of standard lipids run on the same TLC plate are indicated (chol, cholesterol; NFA-GalC, nonhydroxy fatty acid-containing galactosylceramide; HFA-GalC, 2-hydroxy fatty acid-containing galactosylceramide). All samples from P60 mice were separated on the same TLC plate, however, several nonrelevant lanes between the first and second lane shown in the figure were omitted and a merged image is shown. B, Quantitative analysis of the lipids demonstrate a statistically significant reduction in NFA-GalC in Nat8L+/+/Aspanur7/nur7 and Nat8L+/−/Aspanur7/nur7 mice, but not in Nat8L−/−/Aspanur7/nur7 mice, compared with control mice. At P21, sulfatide was only reduced in Nat8L+/+/Aspanur7/nur7 mice. At P60, all quantified sphingolipids were significantly reduced in both, Nat8L+/+/Aspanur7/nur7 and Nat8L+/−/Aspanur7/nur7 mice compared with control littermates, demonstrating demyelination and the worsened phenotype from P21 to P60. There was no statistically significant difference between Nat8L−/−/Aspanur7/nur7 mice and control mice (*p < 0.05, t test, n = 3–4).
Discussion
ASPA deficiency causes a massive progressive spongy degeneration and loss of myelin in CD patients (Canavan, 1931) and corresponding mouse models (Matalon et al., 2000; Surendran et al., 2005; Traka et al., 2008). Different hypotheses to explain the pathology of CD have been proposed (for review, see Hoshino and Kubota, 2014). The results presented here show clearly that the absence of NAA hydrolysis products is not responsible for CD because the hallmarks of the disease (spongy degeneration, loss of myelin, and axon degeneration) were not observed in Nat8L−/− mice. Moreover, the lack of NAA leads to an apparently complete reversal of the Canavan pathology in Aspa-deficient mice, indicating that the presence of high NAA concentrations is toxic and causal for the demyelination and axonal degeneration found in CD. Similar results were recently presented by Guo et al. (2015). However, although myelin sheaths of Nat8L−/−/Aspanur7/nur7 mice in general appeared normal in our study (in agreement with Guo et al., 2015), which we could further substantiate by their normal g-ratio, we occasionally observed myelinated axons with minor structural abnormalities. Although the cause for these unusually thickened internal mesaxa is currently not clear, it is a first indication for an important role of NAA (or NAA-derived peptides such as NAAG) in the axon–oligodendrocyte interaction. Whether the observed structural changes play a role in the unexpected finding that the reversal of the spongy myelin degeneration by NAA deficiency did not improve survival times of Aspanur7/nur7 mice requires further study. Nevertheless, it strongly argues that NAA has some yet unrevealed vital function. With respect to a therapeutic inhibition of NAA synthase, this cannot be ignored. To investigate how well a reduction in NAA levels is tolerated, we generated mice with only one functional allele of the Nat8L gene. Compared with Nat8L+/+/Aspanur7/nur7 mice, these animals (Nat8L+/−/Aspanur7/nur7) accumulated less NAA, which correlated with a significantly improved phenotype. The amelioration of motor coordination in the rotarod test in Nat8L+/−/Aspanur7/nur7 compared with Nat8L+/+/Aspanur7/nur7 mice, however, was only transient and disappeared at 2 months of age despite a less pronounced spongy degeneration in the former genotype. Possibly, axon and myelin integrity is already substantially affected in Aspa-deficient mice before a widespread massive vacuolation (because it is seen in 2-month-old Nat8L+/+/Aspanur7/nur7 mice) is visible. Consistent with this, myelin protein levels were reduced to almost the same extent in both Nat8L+/−/Aspanur7/nur7 and Nat8L+/+/Aspanur7/nur7 mice.
Because all Nat8L+/+/Aspanur7/nur7 mice surviving beyond 4 weeks survived for at least 1 year, it seems that reducing NAA synthesis at a critical period of 3–4 weeks of age, when Nat8L expression and NAA synthesis reach a maximum, may be sufficient to massively extend the lifespan of Aspa-deficient mice. Consistent with this, Ahmed et al. (2013) showed that Aspa delivery by a single injection of a recombinant adeno-associated virus as late as P20 prevented early death and alleviated CD symptoms in Aspa-deficient mice. Nat8L+/−/Aspanur7/nur7 mice may serve as a new mouse model for late-onset forms of CD and, furthermore, can be used to study the efficacy of late therapeutic interventions. Apparently normal myelination in Nat8L−/− and Nat8L−/−/Aspanur7/nur7 mice is also consistent with data from the only known patient with a defect in the Nat8L gene (Martin et al., 2001). According to the mutation in this patient (a 19 bp deletion), it can be assumed that he completely lacks NAA synthase activity (Wiame et al., 2009). Nevertheless, MRI scans revealed only minor changes in the white matter of this patient (Martin et al., 2001).
Different studies showed that acetyl groups derived from NAA are incorporated into myelin lipids (D'Adamo and Yatsu, 1966; Chakraborty et al., 2001). However, normal levels of myelin lipids, especially the major myelin sphingolipids GalC and sulfatide, in Nat8L−/−/Aspanur7/nur7 mice show clearly that NAA is not essential for myelin lipid synthesis. Nevertheless, this observation does not exclude the possibility that efficient remyelination under pathological conditions may partly depend on, or be improved by, acetate supply via NAA. This hypothesis could explain why acetate therapy alleviates symptoms in Aspa-deficient mice (Arun et al., 2010). The significantly stronger reduction of NFA-GalC compared with HFA-GalC in Aspa-deficient mice or tremor rat (Ledeen et al., 2006; Traka et al., 2008; Wang et al., 2009) might be due to differential distribution of these two lipids within different myelin domains and higher susceptibility to the toxic effect of NAA of NFA-GalC-enriched myelin domains.
NAA concentrations strongly increased in Aspanur7/nur7 mice until P60, which correlates with the upregulation of NAA synthase activity during early postnatal development, as expected. Thereafter, however, NAA did not further increase, but rather its concentration slightly declined not only in controls, but also in Nat8L+/+/Aspanur7/nur7 and Nat8L+/−/Aspanur7/nur7 mice. This is possibly due to a lower NAA synthase activity in adult mice, together with an efficient transport of NAA through the blood–brain barrier and excretion. Strongly elevated NAA levels in the urine of CD patients (>50-fold increase in urine NAA) and CD mouse models have been reported (Matalon et al., 1988, 2006). Because NAA was measured in total brain, however, continued white matter accumulation of NAA in adult mice cannot be excluded and is in fact likely because spongy degeneration deteriorates in different brain regions such as the cerebellum or medulla after P60 in Aspanur7/nur7 mice (Traka et al., 2008). Because axons contain high amounts of NAA (Bjartmar et al., 2002), the decline of NAA levels in Aspa-deficient brains could in part also be the result of axonal degeneration. This could also explain the observed changes in the NAA-derivative NAAG. Although NAAG was not increased in younger mice (P60), in agreement with previous reports (Surendran et al., 2004; Traka et al., 2008), the decreased NAAG levels in 1-year-old Nat8L+/+/Aspanur7/nur7 and Nat8L+/−/Aspanur7/nur7 mice possibly reflect axonal degeneration, which worsens significantly with age (Traka et al., 2008).
The rescue of early lethality, partially improved behavioral phenotype, and alleviated spongy degeneration in Nat8L+/−/Aspanur7/nur7 mice compared with the conventional Aspanur7/nur7 mice indicate that the severity of the disease correlates with the NAA concentration in the brain, which was significantly lower in Nat8L+/−/Aspanur7/nur7 mice. This, together with the apparently normal phenotype of Nat8L−/−/Aspanur7/nur7 mice, is consistent with the hypothesis that the osmotic stress of accumulating NAA is the main factor responsible for disease progression in CD (Baslow et al., 2013). Moreover, it provides strong support for the hypothesis that the inhibition of NAA synthase is a promising therapeutic option for CD. Importantly, however, the therapeutic window may be narrow, because severe reduction of NAA may result in premature death not related to myelin pathology. Crossing the herein described conditional (floxed) Nat8L-deficient mice with inducible Cre-transgenic mice can serve as a model to further prove the feasibility of such a substrate reduction therapy.
Footnotes
This work was supported by the Deutsche Forschungsgemeinschaft (M.E.). V.G. is a member of the Bonn Cluster of Excellence ImmunoSensation. We thank Arthur Butt for kindly providing l-MAG antibodies.
The authors declare no competing financial interests.
References
- Ahmed et al., 2013.Ahmed SS, Li H, Cao C, Sikoglu EM, Denninger AR, Su Q, Eaton S, Liso Navarro AA, Xie J, Szucs S, Zhang H, Moore C, Kirschner DA, Seyfried TN, Flotte TR, Matalon R, Gao G. A single intravenous rAAV injection as late as P20 achieves efficacious and sustained CNS Gene therapy in Canavan mice. Mol Ther. 2013;21:2136–2147. doi: 10.1038/mt.2013.138. [DOI] [PMC free article] [PubMed] [Google Scholar]
- Arun et al., 2010.Arun P, Madhavarao CN, Moffett JR, Hamilton K, Grunberg NE, Ariyannur PS, Gahl WA, Anikster Y, Mog S, Hallows WC, Denu JM, Namboodiri AM. Metabolic acetate therapy improves phenotype in the tremor rat model of Canavan disease. J Inherit Metab Dis. 2010;33:195–210. doi: 10.1007/s10545-010-9100-z. [DOI] [PMC free article] [PubMed] [Google Scholar]
- Baslow, 2003.Baslow MH. N-acetylaspartate in the vertebrate brain: metabolism and function. Neurochem Res. 2003;28:941–953. doi: 10.1023/A:1023250721185. [DOI] [PubMed] [Google Scholar]
- Baslow and Guilfoyle, 2013.Baslow MH, Guilfoyle DN. Canavan disease, a rare early-onset human spongiform leukodystrophy: insights into its genesis and possible clinical interventions. Biochimie. 2013;95:946–956. doi: 10.1016/j.biochi.2012.10.023. [DOI] [PubMed] [Google Scholar]
- Becker et al., 2008.Becker I, Wang-Eckhardt L, Yaghootfam A, Gieselmann V, Eckhardt M. Differential expression of (dihydro)ceramide synthases in mouse brain: oligodendrocyte-specific expression of CerS2/Lass2. Histochem Cell Biol. 2008;129:233–241. doi: 10.1007/s00418-007-0344-0. [DOI] [PubMed] [Google Scholar]
- Becker et al., 2010.Becker I, Lodder J, Gieselmann V, Eckhardt M. Molecular characterization of N-acetylaspartylglutamate synthetase. J Biol Chem. 2010;285:29156–29164. doi: 10.1074/jbc.M110.111765. [DOI] [PMC free article] [PubMed] [Google Scholar]
- Bjartmar et al., 2002.Bjartmar C, Battistuta J, Terada N, Dupree E, Trapp BD. N-acetylaspartate is an axon-specific marker of mature white matter in vivo: a biochemical and immunohistochemical study on the rat optic nerve. Ann Neurol. 2002;51:51–58. doi: 10.1002/ana.10052. [DOI] [PubMed] [Google Scholar]
- Burlina et al., 1994.Burlina AP, Corazza A, Ferrari V, Erhard P, Künnecke B, Seelig J, Burlina AB. Detection of increased urinary N-acetylaspartylglutamate in Canavan disease. Eur J Pediatr. 1994;153:538–539. doi: 10.1007/BF01957015. [DOI] [PubMed] [Google Scholar]
- Canavan, 1931.Canavan MM. Schilder's encephalitis periaxialis diffusa: Report of a case in a child aged sixteen and one-half months. Archives of Neurology & Psychiatry. 1931;25:299–308. doi: 10.1001/archneurpsyc.1931.02230020085005. [DOI] [Google Scholar]
- Chakraborty et al., 2001.Chakraborty G, Mekala P, Yahya D, Wu G, Ledeen RW. Intraneuronal N-acetylaspartate supplies acetyl groups for myelin lipid synthesis: evidence for myelin-associated aspartoacylase. J Neurochem. 2001;78:736–745. doi: 10.1046/j.1471-4159.2001.00456.x. [DOI] [PubMed] [Google Scholar]
- Collard et al., 2010.Collard F, Stroobant V, Lamosa P, Kapanda CN, Lambert DM, Muccioli GG, Poupaert JH, Opperdoes F, Van Schaftingen E. Molecular identification of N-acetylaspartylglutamate synthase and beta-citrylglutamate synthase. J Biol Chem. 2010;285:29826–29833. doi: 10.1074/jbc.M110.152629. [DOI] [PMC free article] [PubMed] [Google Scholar]
- D'Adamo and Yatsu, 1966.D'Adamo AF, Jr, Yatsu FM. Acetate metabolism in the nervous system: N-acetyl-L-aspartic acid and the biosynthesis of brain lipids. J Neurochem. 1966;13:961–965. doi: 10.1111/j.1471-4159.1966.tb10292.x. [DOI] [PubMed] [Google Scholar]
- Edwards et al., 2009.Edwards K, Griffiths D, Morgan J, Pitman R, von Ruhland C. Can the choice of intermediate solvent or resin affect glomerular basement membrane thickness? Nephrol Dial Transplant. 2009;24:400–403. doi: 10.1093/ndt/gfn504. [DOI] [PubMed] [Google Scholar]
- Guo et al., 2015.Guo F, Bannerman P, Mills Ko E, Miers L, Xu J, Burns T, Li S, Freeman E, McDonough JA, Pleasure D. Ablating N-acetylaspartate prevents leukodystrophy in a Canavan disease model. Ann Neurol. 2015;77:884–888. doi: 10.1002/ana.24392. [DOI] [PMC free article] [PubMed] [Google Scholar]
- Hogan et al., 1994.Hogan B, Beddington R, Constantini F, Lacy E. Manipulating the mouse embryo: a laboratory manual. Ed 2. New York: Cold Spring Harbor Laboratory; 1994. [Google Scholar]
- Hoshino and Kubota, 2014.Hoshino H, Kubota M. Canavan disease: clinical features and recent advances in research. Pediatr Int. 2014;56:477–483. doi: 10.1111/ped.12422. [DOI] [PubMed] [Google Scholar]
- Klugmann et al., 2005.Klugmann M, Leichtlein CB, Symes CW, Serikawa T, Young D, During MJ. Restoration of aspartoacylase activity in CNS neurons does not ameliorate motor deficits and demyelination in a model of Canavan disease. Mol Ther. 2005;11:745–753. doi: 10.1016/j.ymthe.2005.01.006. [DOI] [PubMed] [Google Scholar]
- Ledeen et al., 2006.Ledeen RW, Wang J, Wu G, Lu ZH, Chakraborty G, Meyenhofer M, Tyring SK, Matalon R. Physiological role of N-acetylaspartate: contribution to myelinogenesis. Adv Exp Med Biol. 2006;576:131–143. doi: 10.1007/0-387-30172-0_9. discussion 361–363. [DOI] [PubMed] [Google Scholar]
- Lodder-Gadaczek et al., 2011.Lodder-Gadaczek J, Becker I, Gieselmann V, Wang-Eckhardt L, Eckhardt M. N-acetylaspartylglutamate synthetase II synthesizes N-acetylaspartylglutamylglutamate. J Biol Chem. 2011;286:16693–16706. doi: 10.1074/jbc.M111.230136. [DOI] [PMC free article] [PubMed] [Google Scholar]
- Madhavarao et al., 2005.Madhavarao CN, Arun P, Moffett JR, Szucs S, Surendran S, Matalon R, Garbern J, Hristova D, Johnson A, Jiang W, Namboodiri MA. Defective N-acetylaspartate catabolism reduces brain acetate levels and myelin lipid synthesis in Canavan's disease. Proc Natl Acad Sci U S A. 2005;102:5221–5226. doi: 10.1073/pnas.0409184102. [DOI] [PMC free article] [PubMed] [Google Scholar]
- Magin et al., 1992.Magin TM, McWhir J, Melton DW. A new mouse embryonic stem cell line with good germ line contribution and gene targeting frequency. Nucleic Acids Res. 1992;20:3795–3796. doi: 10.1093/nar/20.14.3795. [DOI] [PMC free article] [PubMed] [Google Scholar]
- Martin et al., 2001.Martin E, Capone A, Schneider J, Hennig J, Thiel T. Absence of N-acetylaspartate in the human brain: impact on neurospectroscopy? Ann Neurol. 2001;49:518–521. [PubMed] [Google Scholar]
- Matalon et al., 1988.Matalon R, Michals K, Sebesta D, Deanching M, Gashkoff P, Casanova J. Aspartoacylase deficiency and N-acetylaspartic aciduria in patients with Canavan disease. Am J Med Genet. 1988;29:463–471. doi: 10.1002/ajmg.1320290234. [DOI] [PubMed] [Google Scholar]
- Matalon et al., 2000.Matalon R, Rady PL, Platt KA, Skinner HB, Quast MJ, Campbell GA, Matalon K, Ceci JD, Tyring SK, Nehls M, Surendran S, Wei J, Ezell EL, Szucs S. Knock-out mouse for Canavan disease: a model for gene transfer to the central nervous system. J Gene Med. 2000;2:165–175. doi: 10.1002/(SICI)1521-2254(200005/06)2:3<165::AID-JGM107>3.0.CO;2-R. [DOI] [PubMed] [Google Scholar]
- Matalon et al., 2006.Matalon R, Michals-Matalon K, Surendran S, Tyring SK. Canavan disease: studies on the knockout mouse. Adv Exp Med Biol. 2006;576:77–93. doi: 10.1007/0-387-30172-0_6. discussion 361–363. [DOI] [PubMed] [Google Scholar]
- Mersmann et al., 2011.Mersmann N, Tkachev D, Jelinek R, Röth PT, Möbius W, Ruhwedel T, Rühle S, Weber-Fahr W, Sartorius A, Klugmann M. Aspartoacylase-lacZ knockin mice: an engineered model of Canavan disease. PLoS One. 2011;6:e20336. doi: 10.1371/journal.pone.0020336. [DOI] [PMC free article] [PubMed] [Google Scholar]
- Moffett et al., 2007.Moffett JR, Ross B, Arun P, Madhavarao CN, Namboodiri AM. N-Acetylaspartate in the CNS: from neurodiagnostics to neurobiology. Prog Neurobiol. 2007;81:89–131. doi: 10.1016/j.pneurobio.2006.12.003. [DOI] [PMC free article] [PubMed] [Google Scholar]
- Moffett et al., 2011.Moffett JR, Arun P, Ariyannur PS, Garbern JY, Jacobowitz DM, Namboodiri AM. Extensive aspartoacylase expression in the rat central nervous system. Glia. 2011;59:1414–1434. doi: 10.1002/glia.21186. [DOI] [PMC free article] [PubMed] [Google Scholar]
- Namboodiri et al., 2006.Namboodiri AM, Moffett JR, Arun P, Mathew R, Namboodiri S, Potti A, Hershfield J, Kirmani B, Jacobowitz DM, Madhavarao CN. Defective myelin lipid synthesis as a pathogenic mechanism of Canavan disease. Adv Exp Med Biol. 2006;576:145–163. doi: 10.1007/0-387-30172-0_10. [DOI] [PubMed] [Google Scholar]
- Pessentheiner et al., 2013.Pessentheiner AR, Pelzmann HJ, Walenta E, Schweiger M, Groschner LN, Graier WF, Kolb D, Uno K, Miyazaki T, Nitta A, Rieder D, Prokesch A, Bogner-Strauss JG. NAT8L (N-acetyltransferase 8-like) accelerates lipid turnover and increases energy expenditure in brown adipocytes. J Biol Chem. 2013;288:36040–36051. doi: 10.1074/jbc.M113.491324. [DOI] [PMC free article] [PubMed] [Google Scholar]
- Surendran et al., 2004.Surendran S, Ezell EL, Quast MJ, Wei J, Tyring SK, Michals-Matalon K, Matalon R. Aspartoacylase deficiency does not affect N-acetylaspartylglutamate level or glutamate carboxypeptidase II activity in the knockout mouse brain. Brain Res. 2004;1016:268–271. doi: 10.1016/j.brainres.2004.05.035. [DOI] [PubMed] [Google Scholar]
- Surendran et al., 2005.Surendran S, Campbell GA, Tyring SK, Matalon R. Aspartoacylase gene knockout results in severe vacuolation in the white matter and gray matter of the spinal cord in the mouse. Neurobiol Dis. 2005;18:385–389. doi: 10.1016/j.nbd.2004.10.014. [DOI] [PubMed] [Google Scholar]
- Traka et al., 2008.Traka M, Wollmann RL, Cerda SR, Dugas J, Barres BA, Popko B. Nur7 is a nonsense mutation in the mouse aspartoacylase gene that causes spongy degeneration of the CNS. J Neurosci. 2008;28:11537–11549. doi: 10.1523/JNEUROSCI.1490-08.2008. [DOI] [PMC free article] [PubMed] [Google Scholar]
- Truckenmiller et al., 1985.Truckenmiller ME, Namboodiri MA, Brownstein MJ, Neale JH. N-Acetylation of L-aspartate in the nervous system: differential distribution of a specific enzyme. J Neurochem. 1985;45:1658–1662. doi: 10.1111/j.1471-4159.1985.tb07240.x. [DOI] [PubMed] [Google Scholar]
- Wang et al., 2009.Wang J, Leone P, Wu G, Francis JS, Li H, Jain MR, Serikawa T, Ledeen RW. Myelin lipid abnormalities in the aspartoacylase-deficient tremor rat. Neurochem Res. 2009;34:138–148. doi: 10.1007/s11064-008-9726-5. [DOI] [PMC free article] [PubMed] [Google Scholar]
- Wiame et al., 2009.Wiame E, Tyteca D, Pierrot N, Collard F, Amyere M, Noel G, Desmedt J, Nassogne MC, Vikkula M, Octave JN, Vincent MF, Courtoy PJ, Boltshauser E, van Schaftingen E. Molecular identification of aspartate N-acetyltransferase and its mutation in hypoacetylaspartia. Biochem J. 2009;425:127–136. doi: 10.1042/BJ20091024. [DOI] [PubMed] [Google Scholar]
- Yaghootfam et al., 2005.Yaghootfam A, Gieselmann V, Eckhardt M. Delay of myelin formation in arylsulphatase A-deficient mice. Eur J Neurosci. 2005;21:711–720. doi: 10.1111/j.1460-9568.2005.03891.x. [DOI] [PubMed] [Google Scholar]
- Zöller et al., 2008.Zöller I, Meixner M, Hartmann D, Büssow H, Meyer R, Gieselmann V, Eckhardt M. Absence of 2-hydroxylated sphingolipids is compatible with normal neural development but causes late-onset axon and myelin sheath degeneration. J Neurosci. 2008;28:9741–9754. doi: 10.1523/JNEUROSCI.0458-08.2008. [DOI] [PMC free article] [PubMed] [Google Scholar]


