

Abstract
The basal forebrain comprises several heterogeneous neuronal subgroupings having modular projection patterns to discrete sets of cortical subregions. Each cortical region forms recurrent projections, via prefrontal cortex, that reach the specific basal forebrain subgroups from which they receive afferents. This architecture enables the basal forebrain to selectively modulate cortical responsiveness according to current processing demands. Theoretically, optimal functioning of this distributed network would be enhanced by temporal coordination among coactive basal forebrain neurons, or the emergence of “cell assemblies.” The present work demonstrates assembly formation in rat basal forebrain neuronal populations during a selective attention task. Neuron pairs exhibited coactivation patterns organized within beta-frequency time windows (55 ms), regardless of their membership within distinct bursting versus nonbursting basal forebrain subpopulations. Thus, the results reveal a specific temporal framework for integration of information within basal forebrain networks and for the modulation of cortical responsiveness.
Keywords: assembly, beta, corticopetal, generalized linear model
Introduction
The basal forebrain (BF) is a powerful determinant of cortical responsiveness (Golmayo et al., 2003; Pinto et al., 2013). Its efferents to the neocortex take at least three neurochemical forms, including GABAergic, cholinergic, and glutamatergic neurons (Brückner et al., 1994; Metherate and Ashe, 1995; Gritti et al., 1997; Zaborszky et al., 1999; Riedel et al., 2002; Sarter and Bruno, 2002; Nelson et al., 2005; Henny and Jones, 2008). This projection system plays a critical role in learning and attention, and its degeneration accompanies impairments in cognition (Baxter et al., 1995; Chiba et al., 1995; Bucci et al., 1998; Sarter et al., 2014).
BF GABAergic and cholinergic neurons are organized into overlapping subgroups each defined by the cortical subregions they target. The cortical subregions targeted by a single group are interconnected with prefrontal cortex subregions forming return connections to the BF (Zaborszky et al., 2015). The discovery of these anatomical features of the BF projection system completes a picture wherein the BF must be considered in the context of distributed cortical-BF networks. The conceptualization of a “modular” BF projection system is consistent with data demonstrating independent control, via distinct BF subgroups, of responsiveness in somatosensory and visual cortex (Golmayo et al., 2003). More recent data also support this conceptualization in revealing that, during a selective attention task, the BF generates a variety of unique task-phase-specific ensemble patterns each paralleled by a similar set of patterns in the parietal cortex (Tingley et al., 2014).
This raises the question as to whether specific temporal dependencies in the activation patterns for pairs of BF neurons exist. Recent work showed that BF neurons having correlated mean firing rate vectors also have correlations in trial-to-trial activity deviations from those means (Tingley et al., 2014), but left open questions concerning the degree of temporal precision in activation/inactivation patterns. We therefore applied a generalized linear model (GLM) analysis to test the hypothesis that BF neurons have fine-scale codependencies in their spiking patterns. Considering past theoretical (Bibbig et al., 2002) and experimental (Quinn et al., 2010) work, we predicted that BF population firing dynamics would be coordinated at a slower time scale than codependencies observed in other brain regions, such as hippocampus (Harris et al., 2003).
The GLM analysis revealed that both bursting and nonbursting BF neurons exhibit codependencies in their spiking activity. Consistent with BF neuron organization into distinct cell assemblies, coordinated spiking occurred primarily over a specific time interval of ∼55 ms, a result consistent with prior work demonstrating the presence of beta-frequency (∼20 Hz) field-potential oscillations in BF (Quinn et al., 2010). The discovery of cell assemblies in the BF adds to the growing evidence that they are fundamental operational units in the brain, as suggested by Hebb (1949). That they are organized within the beta frequency expands the range of frequencies shown to assemble information in this way, and is consistent with theoretical work suggesting that beta frequencies are optimal for long-range information transfer between subcortical and cortical structures (Bibbig et al., 2002).
Materials and Methods
Subjects.
All experimental protocols adhered to AALAC guidelines and were approved by the UCSD Institutional Animal Care and Use Committee and Animal Care Program. Eight adult, male Long–Evans rats served as behavioral subjects. Rats were housed individually and kept on a 12 h light/dark cycle. Before experimentation, the animals were habituated to the colony room and handled daily for a period of 1–2 weeks. After this period, animals were placed on food restriction until they reached 85–90% free-fed weight. Water was available continuously. Rats were required to reach a minimum weight of 350 g before surgery and subsequent experimentation.
Visuospatial attention task.
Each day, animals completed 100 trials of a selective attention task in a circular arena with a 1.2 m diameter (Fig. 1A). Along the circumference of the arena were 36 light ports, located every 10° and standing 6.5 cm above the arena floor. Animals were trained by approximation to remain in a 25 cm circular region in the center of the arena and scan the arena boundary for a light flash (∼150 ms). The trial-to-trial probability of a light flash at any given location was defined by a “center” light that is most probable and one of two normal distributions (1.25 and 3 SD) around the center that described the probabilities of neighboring lights. Only one distribution was used on any given recording day, and across days of testing, a single one of these distributions was repeatedly used such that several neurophysiological recordings could be obtained under asymptotic levels of performance. Once several recordings were obtained under one distribution, the other distribution was used.
Figure 1.
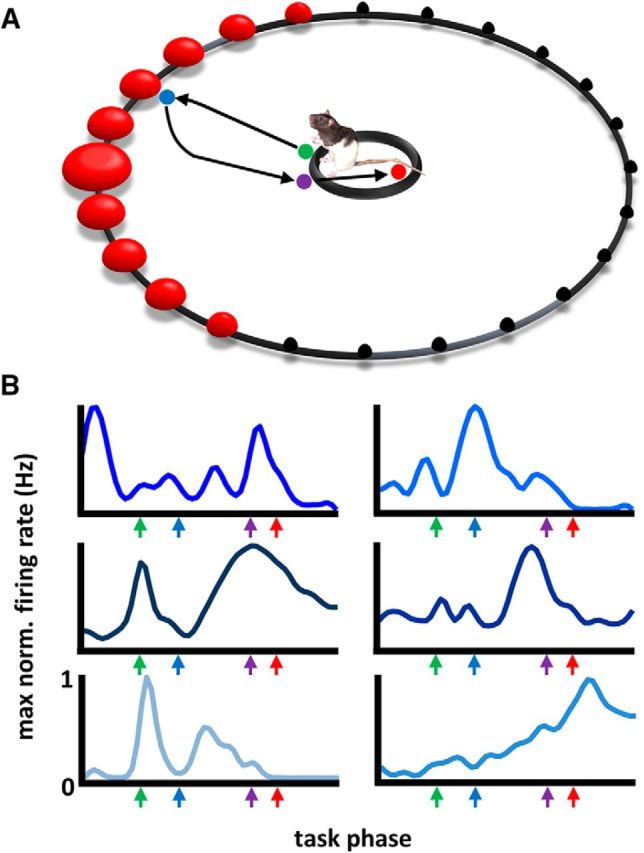
Multiple single-neuron recordings of basal forebrain neurons during performance of a selective-attention task. A, Schematic of the arena used for the selective attention task. A 1.2-m-diameter environment with 46 cm walls, having 36 evenly spaced light sources each 6.5 cm above the surface (red spheres). A trial began when the animal stood upon a 25 cm platform at the arena center with head orientation such that the location of any individual trial's light flash lies somewhere within the 120° space that is centered on the longitudinal axis of the animal's head. A light flash (∼150 ms) from a single location triggers a journey to identify the spatial location of the flash with a nose-poke. Return to the center plate yields 1/2-piece Cheerio reward if the correct light source was identified. The size of the red spheres depicts the approximate trial-to-trial probability for light flash locations (black spheres depict zero probability). B, Mean firing rate vectors from six example neurons. Firing rates were normalized by their maximum firing rate and range from 0 to 1 (y-axes). Colored arrows across the x-axes mark the behavioral events (light flash, nose poke, plate cross, and reward) after a time normalization procedure is used to align events across trials (see Materials and Methods for a full description of the time normalization procedure). For a full description of BF neuron activity during this task, see Tingley et al., 2014.
Light flash initiation only occurred when the animal was in the center ring and oriented such that the light would fall within a 120° space surrounding its longitudinal axis. Thus, the flash location is not always directly in front of the animal, but always within its field-of-view. Upon detection of a light flash, animals were required to travel to the arena perimeter and to identify the spatial location of the light flash with a nose-poke. Upon returning to the arena center animals were rewarded for correct light source identification with a 1/2-piece Honey-Nut Cheerio (General Mills). Incorrect identification yielded no reward. Trials associated with failure to travel to the perimeter following light flash (“no-gos”) constituted <5% of all trials in any animal once asymptotic performance was reached.
After the animal exhibited correct performance on >70% of trials across several days of training, recording experiments were initiated. At this point, the subject underwent surgery for the implantation of chronic BF stereotrode and posterior parietal cortex (PPC) tetrode wires.
Surgery.
Rats were implanted with arrays of eight stereotrodes (25 micrometer tungsten with polyimide insulation; California Fine Wire) built into custom-fabricated microdrives. Three such microdrive arrays were implanted in each animal with two targeting left and right BF (AP 0.2 mm, ML 2.8 mm, V 7.0 mm) and one targeting right PPC (AP −4, ML 2.5, V 0.5, 5 animals) or one targeting right BF and two targeting left and right PPC (2 animals). Dorsal-ventral coordinates were chosen to permit slow movement of the recording wires into the desired BF (V 8–9) and PPC (V 0.8–1.5) target areas across days in which the animal was reintroduced to the task. PPC neurons were analyzed previously and are not examined in the context of this paper (Tingley et al., 2014).
Recordings.
All electrodes were bundled into custom-built microdrives permitting movement in 40 μm increments in the dorsal-ventral axis. Signals were amplified at the level of the headstage connection (20×), again at a pre-amp stage (50×), and then to varying degrees, as appropriate, at the amplifier stager (additional 1–15×). Unit signals were bandpass filtered (450 Hz–8.8 kHz). Candidate spike waveforms (exceeding an amplitude threshold) were recorded using SortClient (Plexon) at a sampling frequency of 40 kHz. Waveform discrimination into individual units was performed manually using Plexon's Offline Sorter software.
The animal's position within the environment was detected from overhead images of the arena at 60 Hz. using Plexon's CinePlex Studio. Tracking software picked up light from two differently colored LEDs clipped to a connector, embedded in the dental acrylic used to fix microdrives to the animal's skull.
Stereotrode bundles were adjusted across days as necessary to maintain collection of large numbers of high-amplitude action potential waveforms (as many as 60/day). Data included in the present set of analyses were, for all individual animals, associated with different depths (minimum 80 μm separation) to greatly minimize the possibility that single neurons could contribute to the full dataset more than once.
Behavioral event analysis.
Position tracking data were analyzed using a custom MATLAB (MathWorks) guided user interface. Each trial was closely examined to identify the position point associated with initial movement to the light source, and the sharp point of trajectory reversal associated with nose poke. The time points at which the animal crossed back over the perimeter of the center plate and at which the animal stopped to consume reward were determined through automated analysis of positional data using MATLAB. Trials in which the animal did not make ballistic, direct runs to and from the site of a nose-poke were not included so that trial-to-trial variability in task epoch durations were kept minimal relative to task epoch mean durations.
Time-normalization and firing rate calculation.
To enable comparison of neuronal activity across all trials and all behavioral epochs, we used a time normalization procedure to align neural data for light-onset, nose-poke, center-plate return, and stop/reward times. Time normalization was accomplished by identifying the average time between light flash to nose-poke, nose-poke to center return, and center return to stop/reward across all trials and animals. On average, it took the rodent 0.69 s to traverse to the light port after the light flash. Animals took a mean of 1.41 s to return to the plate after nose poke and 0.54 s to stop to consume reward after having crossed onto the center plate. We divided these periods into ∼80–90 ms time bins for each trial. There are slight deviations from these averages for all animals across trials, thus, the bin duration was allowed to fluctuate slightly to allow for the behaviorally significant events to consistently occur at the same bin. A 1 s period before light flash and after stop/reward was included in each trial to include stimulus expectation and reward consumption time periods, respectively. By this process, we obtained vectors of time-normalized data in which a prelight flash period composed bins 1–12, light flash to nose-poke in bins 13–20, nose-poke to center-plate return in bins 21–36, center-plate return to stop/reward in bins 37–42, and a post-trial reward period in bins 43–54. For further detail on this time normalization procedure, see Tingley et al., 2014.
Histology.
Animals were perfused with 4% paraformaldehyde under deep anesthesia. Brains were removed, cut into 50 μm sections, and Nissl stained. The point of deepest electrode penetration was used in conjunction with microdrive adjustment records to determine the range of depths sampled for any given stereotrode bundle placement. A schematic summary of final electrode bundle placements and sample histological data are given in Figure 2.
Figure 2.
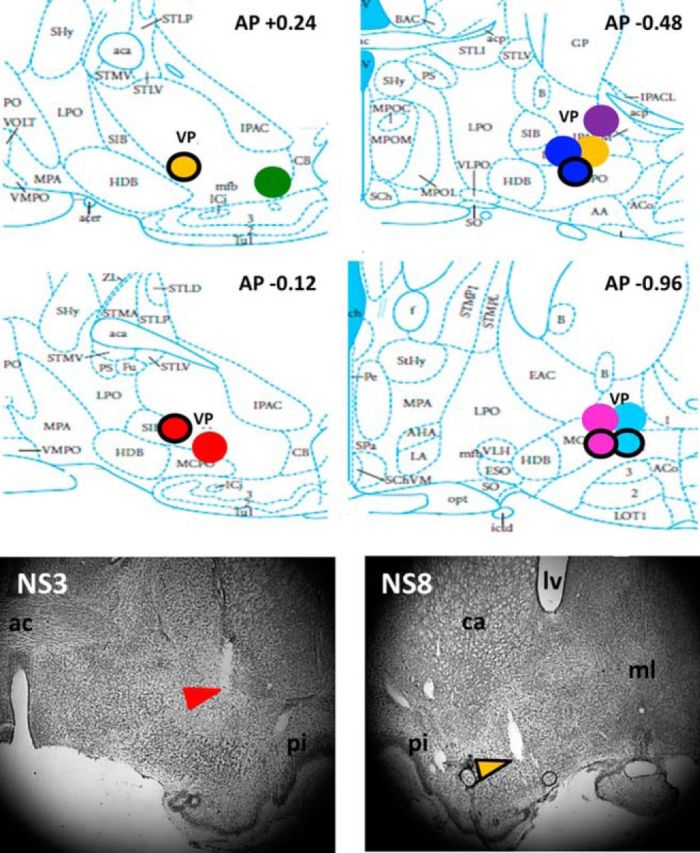
Multiple single neuron recordings in basal forebrain subregions substantia innominata and ventral pallidum. Top, Summary of recording sites (N = 8 rats, 12 stereotrode bundle placements) in subregions ventral pallidum and substantia innominata of the basal forebrain. Differently colored, filled circles represent different animals. Circles with a black ring represent location of recording sites for analogous positions in the left hemisphere. Bottom, Example histology depicting electrode placement for two rats. Colored arrows correspond to red and yellow circles above and point to marker lesions made at final electrode depths. ml, Midline; ac, anterior commissure; ca, caudate; lv, lateral ventricle; pi, piriform cortex.
Interspike interval analysis.
Interspike interval histograms were calculated for each neuron by determining the time differences between adjacent spikes across the entire recording. These histograms were then normalized by the interspike interval bin with the highest count, resulting in histograms ranging from 0 to 1. These histograms were then sorted by their maximal interspike interval frequency (Fig. 3A).
Figure 3.
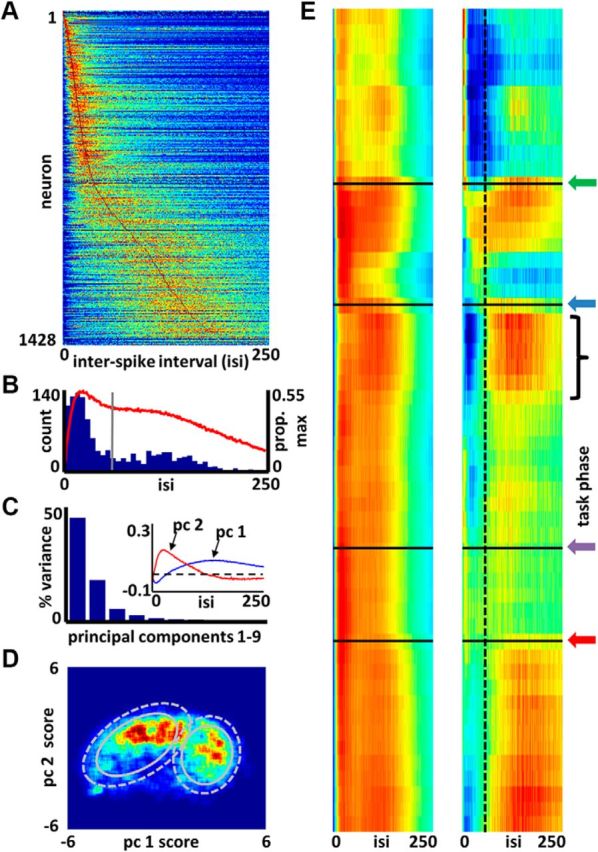
Task-phase-specific biases in firing of basal forebrain bursting and nonbursting neuron subtypes. A, Color map of ISIHs (maximum-normalized; blue, red = 0–1) for all BF neurons. Neurons (y-axis) are sorted according to the time bin (x-axis) associated with the maximum number of spike intervals. B, Frequency distribution for the peak locations (blue bars, left y-axis) for ISIHs of all neurons. Vertical gray line marks the mean of the distribution, effectively splitting the bimodal distribution into bursting and nonbursting neuron types. The red line (right y-axis) is the average of all maximum-normalized ISIHs of A indicating overall balance in burst versus nonburst firing for the population as a whole. C, Principal components analysis derived from the vectors shown in A yields two components (1, 2) that explain much (62%) of the variance in the observed ISIHs. Inset, eigenvectors for these components. D, Cell density map (blue, red = 0–22 neurons) showing that the ISIHs of most BF neurons cluster into one of two categories based on their principal component 1 (nonbursting) and 2 (bursting) scores. A Gaussian mixture model (K = 2) applied to the density map defined two clusters. Ellipses designate their means plus 1 (solid) or 2 (dashed) SD. E, Left, Average normalized ISIH (x-axis) for the subpopulation of neurons showing activity rates >80% of their maximum rate is shown for each task phase (y-axis). Time/task phase proceeds down the y-axis (trial start = top; trial end = bottom), and arrows represent the moments of: light flash (green), nose-poke (blue), plate-cross (purple), and reward obtainment (red). Right, Average ISIH for the same populations of highly active neurons at each task phase but following subtraction of the average overall ISIH for a randomly selected population of neurons (blue, red = −0.1–0.1). This panel reveals deviations from expectation in the proportion of bursting versus nonbursting neurons highly active at any given task phase. Nonbursting neurons, for example, come to dominate the population of active cells as the animal begins the journey back to the center plate (black bracket). Dashed vertical line (x-axis = 65 ms) reflects the mean peak ISIH interval across all cells, also shown as the gray line in B.
A custom clustering algorithm, that uses principal component analysis and a mixture of Gaussians, was then implemented to determine whether classes of interspike interval histograms could be separated by their shapes. Principal component analysis was used to reduce dimensionality, and to quantify the variability in the shapes of all 1428 interspike interval histograms. The first two principal components for the interspike interval histograms (Fig. 3C, inset) together explained 62% of the variance in the data (Fig. 3C).
The two principal component ‘matching’ scores for all 1428 interspike interval histograms are plotted as a density heat map in Figure 3D. The Gaussian mixture model was applied to this full population of values, and defined the centers and SD for two subpopulations of neurons that share characteristic interspike interval shapes.
We next examined the activation patterns of these two groups of cells in relation to the selective attention task (Fig. 3E). For each time-normalized bin across the task (y-axes of Fig. 3E; 54 bins total), we found the subset of neurons at or >80% of their maximal firing rate. For this “active” population of neurons we averaged their interspike interval histograms. This resulted in 54 average ISI histograms, shown across all task phases in Figure 3E (left). Each row in Figure 3E (left) is the average interspike interval histogram of the most active subpopulation of BF neurons at a given phase of the task. In Figure 3E (right), we compare, for each time bin, the observed mean of interspike interval histograms from the set of active neurons to the mean interspike interval histograms for randomly selected subsets of the full set of 1428 interspike interval histograms. The number of randomly selected interspike interval histograms is determined by the number of active cells in each time bin. In this way, we estimate the extent to which bursting versus nonbursting neurons are active relative to what might be expected based on their proportions in the full dataset.
Cell assembly analysis.
Temporal coordination of spike timing among neurons recorded simultaneously from separate stereotrodes was assessed using a generalized linear model approach, based directly on that used in Harris et al. (2003). Spike trains from any given pair of neurons were assessed, across all trials, over a time window of 5 s beginning 1 s before to 4 s after the moment at which the animal began locomotion to the arena perimeter in response to a light flash. Thus, the reference time point used corresponds to the point of maximal firing rate for the population as a whole and includes the entirety of all trials. For any pair of neurons, one was designated the “actual” and one the “predictor” (Fig. 4A).
Figure 4.

Basal forebrain cell assemblies operate at beta frequencies. A, Gray trace at top depicts the spiking activity for a single neuron (the actual) on a single trial. Red traces below depict the spiking activity for a simultaneously recorded neuron, using successively wider temporal smoothing filters. Time on the x-axis is absolute (non-normalized) and taken relative to the time (dashed vertical line) at which the animal accelerates toward the nose-poke following light flash (as determined from position tracking data). B, By use of a generalized linear model, the smoothed vectors (red traces) are used to generate models of the actual neuron's spike train (purple traces, filter sizes given above each). C, Example results from this “cell assembly analysis” of the BF neuron pair shown in A, Black trace is the sum-squared error (y-axis) of each model with different temporal smoothing windows (x-axis). Red trace is the sum-squared error for each model, when trial numbers are randomly shuffled. Fine dashed black and red traces give the mean sum-squared error for each set of models (i.e., randomized and nonrandomized data). D, Scatter plot of the amount of prediction improvement (y-axis) for each neuron pair at that neuron pair's optimal prediction time window (x-axis). The y-axis values reflect, for each pair, the ratio of the black and red arrow lengths in C. Red dot corresponds to the neuron pair used in A–C. Points above a y-axis value of 1 correspond to greater prediction for actual versus trial-randomized spike trains. Vertical full and dashed black lines correspond to the mean (55 ms) ±1 SD, respectively, of the distribution of x-axis values. The prominent collection of points with high prediction values at 55 ms and congregation of optimal prediction windows at 55 ms are both consistent with organization of BF cell assemblies at beta frequencies. Black trace depicts the mean y-axis value for neuron pairs having optimal prediction at each of the time windows. Inset depicts the mean prediction improvement (beyond chance) for each prediction time window and organized into four types of neuron pairs based on their bursting/nonbursting status [green = 1762 nonbursting (actual)/nonbursting (predictor) pairs, red = 1792 bursting/bursting pairs, blue = 1502 bursting/nonbursting pairs, black = 1502 nonbursting/bursting pairs]. Both bursting and nonbursting neurons are temporally organized over the same range of beta frequencies.
For all pairs of simultaneously recorded neurons having highly similar task-phase-specific mean rate vectors (r > 0.6 or < −0.6, N = 8 rats and 6558 neuron pairs), a GLM was created using the spike train of one neuron (the predictor) to predict the spike train for the other neuron (the actual) in each pair. Only neuron pairs recorded on separate stereotrodes were included in the analysis.
Models (501; derived using glmfit.m in MATLAB) were constructed for each neuron pair. Each model attempts to best predict the firing probability of the actual neuron based on the spiking activity of the predictor neuron. The 501 models differ in the extent of the time window over which the predictor neuron's spike train is smoothed (0–500 ms, boxcar smoothing method; Fig. 4B). For each model, a “goodness of fit” is determined by calculating the squared deviation of the actual neuron's spike train from the predicted spike train (i.e., the model). In turn, these values are compared with those expected by chance as determined by implementing the same procedure, using the same data, but with trial order randomized for one of the neurons (Fig. 4C). Two measures are obtained for each analysis: (1) the degree of improvement in spike train prediction above that obtained for randomized data, and (2) the smoothing window associated with the greatest improvement in prediction. The former improvement value evidences the “strength” of cells organized into assemblies, compared with randomized data, and the latter optimal smoothing window has been used to determine the temporal window over which cell assemblies operate (Harris et al., 2003).
Results
BF neuron activity (N = 1428 neurons across 8 rats) from the ventral pallidal and substantia innominata subregions was recorded during performance of a selective attention task. On each trial, the animal perched on a central platform of a circular arena and monitored the interior circumference for a light flash (∼150 ms) that could occur at one of 36 equally spaced light ports (Fig. 1A). Following stimulus presentation, the animal was required to run out to the perimeter of the arena, nose poke the port corresponding to the light source, and then return to the central platform for reward. Thus, the task constructed specific time points that could be precisely identified and examined for BF dynamics relative to light flashes, nose-pokes, and reward attainment. Individual BF neurons exhibited complex task-phase specific responses that formed unique population firing rate vectors across all task phases. (Fig. 1B; for a full description of BF neuronal dynamics, see Tingley et al., 2014).
Published work suggests that BF neurons can be categorized by their bursting or nonbursting firing behavior (Manns et al., 2000a,b) and it has been shown that bursting cell types respond to salient environmental cues (Lin et al., 2006). To determine, during task performance, whether a large population of BF neurons breaks down into clear bursting and nonbursting subtypes, we applied a principal components analysis to the interspike-interval histograms of all recorded BF neurons. Figure 3A depicts the interspike-interval histograms (ISIHs) of the full population of BF neurons and for all spike intervals within a given recording session. The color-mapped values of interval counts are normalized and ordered according to the interval bin containing the maximum count. The blue bars of Figure 3B depict the frequency histogram of the interval bins associated with maximal interval count for the full population (left y-axis). The gray line marks the mean of this distribution at 64 ms. Finally, the red trace depicts the mean, max-normalized ISIH for the full population (right y-axis). Although a fairly wide range of ISIH peak intervals are observed, the plots are both consistent with a potential split of BF neurons into bursting and nonbursting subtypes.
Evidence further supporting such a split is given in Figure 3C,D. Principal components analysis of the full set of ISIHs for all BF neurons (up to 250 ms) yielded two components (Fig. 3C, inset, pc1 and pc2) that together explained 62% of the variance. These first two components clearly reflect the presence of bursting and nonbursting neuron subtypes that have spike interval modes, respectively, of 26 and 140 ms (or ∼38 and 7 Hz). Figure 3D is a density plot of neuron counts according to the scores of their ISIHs on principal components 1 and 2. A Gaussian mixture model was applied to the principal component scores, yielding two populations whose mean + 1 SD and mean + 2 SD are given, respectively, by the solid and dashed gray circles.
Figure 3E (left) depicts the average ISIH for the population of neurons that, at a given task phase, exhibited firing rates at or >80% their maximum rate (i.e., the current set of highly active neurons). A significant degree of specificity is observed when the mean ISIH expected by chance (Fig. 3B, red trace) is subtracted, as shown on the right. Burst firing is minimal in the time period before light flash and subsequent to nose-poke, whereas it is maximal at the time of the light flash and nose-poke. Nonburst firing is maximal near the beginning of journeys to and from the arena perimeter, as well as during the reward consumption period. Nevertheless, subpopulations of both bursting and nonbursting neurons are active across all task phases.
Only a handful of studies have recorded large populations of BF neurons in awake behaving animals (Szymusiak and McGinty, 1986; Wilson and Rolls, 1990a,b; Lin and Nicolelis, 2008) and an examination of codependency in firing of simultaneously recorded neurons has yet to be accomplished. As such, it is possible that a previously unappreciated, but robust temporal organization of BF ensemble firing patterns exists. That is, correlated firing with high temporal resolution of the type expected for a population of neurons organized into cell assemblies has not, to date, been described for BF neuron populations (Hebb, 1949; Harris et al., 2003; Buzsáki and Wang, 2012).
Thus, to determine whether BF ensembles are organized according to a specific temporal framework, a GLM approach was implemented to detect the presence or absence of regularity in the timescale at which pairs of BF spike trains are synchronized. Using this approach, the ability to predict spiking in one neuron based on the activity of a simultaneously recorded peer was assessed. Spike prediction for one neuron, based on the activity of others within a specific time window, has been described and used as a primary form of evidence for participation of those neurons in a cell assembly (Harris et al., 2003; Harris, 2005; Buzsáki and Wang, 2012).
The results of the GLM analysis for all neuron pairs indicate that the spiking activity of BF neurons with similar task-phase-specific firing patterns is organized according to a specific temporal framework. Each point in Figure 4D depicts the degree of predictability in spiking activity relative to that expected by chance (y-axis) for the smoothing window (x-axis) that was associated with the greatest degree of predictability for that neuron pair. The distribution of optimal temporal windows has an overall mean of 55 ms; this indicates that, for most pairs, the spiking activity of any given neuron is best predicted by the spiking activity of another neuron within a beta-frequency time window (∼18 Hz/55 ms in the present case). Moreover, within a window of 1 SD around this mean, the degree of predictability is much greater than that observed for neuron pairs having peak predictability for longer or shorter smoothing windows. In fact, the predictability for most pairs outside of this 28–82 ms window is close to that expected by chance (a y-axis value of 1, as depicted by the dashed line, indicates equal predictability for actual and trial-randomized data).
Finally, consistent with the fact that bursting and nonbursting BF neurons contribute to BF ensemble firing patterns across all task phases, the GLM analysis of codependency in precise spike timing yields the same result for all possible pairings of bursting and nonbursting neurons. The inset to Figure 4C depicts the distributions of smoothing windows associated with maximal spike-timing prediction for all neuron pairs segregated according to whether the paired neurons both fell into the bursting category of firing (red), both fell into the nonbursting category (green), or were mixed (one bursting, one nonbursting; black and blue traces). Strength in prediction was comparable for all cell-pairing types as was the optimal time window for predictions. Thus, organization of BF spiking activity over ∼55 ms time windows applies across distinct subcategories of neuron type defined by fundamental properties of their firing dynamics.
Discussion
The interconnectivity between BF neurons (Zaborszky et al., 1986; Loopuijt and Zahm, 2006), organization of BF neurons into subgroups having similar response fields (Tingley et al., 2014), and covarying activity (Tingley et al., 2014) all point to the existence of specific cell assemblies in BF. Direct evidence for this was found in analyses aimed specifically at determining whether spike times of neurons having similar response fields are predictive of each other and, if so, over what time frame such predictions are optimal. The form of the analyses derived from theoretical work wherein coordination of spiking among interconnected neurons at a specific time frame is considered a necessary condition for comembership in a cell assembly (Hebb, 1949; Harris, 2005; Buzsáki, 2010).
The present data show that coordination of BF spiking activity follows a specific temporal framework, that of a beta frequency. Prediction of one neuron's spiking activity according to that of a peer having a similar response field was maximal over a time range from ∼28 to 82 ms (or 12–37 Hz). The beta-frequency temporal framework applies to the full population of BF neurons, because peak prediction near 55 ms was observed when both neurons were of the bursting subtype (based on their ISIHs), when both were of the nonbursting type, and when one bursting and one nonbursting neuron were paired. That this timescale is observed across the entire population of BF neurons suggests a physiological source for previously reported beta-frequency field-potential oscillations (Quinn et al., 2010).
That the organization of BF spiking activity occurs at a beta frequency offers clues as to the functional role of its cell assemblies and its interactions with afferent sources and efferent targets. Beta frequency time scales are hypothesized to be ideal for coordination of activity among spatially distributed brain regions (Kopell et al., 2000; Bibbig et al., 2002). Thus, the organization of BF neural activity at beta frequencies may reflect optimization in function based on the very nature of its long-range input/output connectivity.
Information processing within the BF demands integration of inputs from a number of spatially distributed cortical and subcortical sources (Semba et al., 1988; Jones and Cuello, 1989; Carnes et al., 1990; Zaborszky et al., 1997; Alam et al., 1999; Fadel and Frederick-Duus, 2008; Zant et al., 2012). The great heterogeneity of BF response fields suggests that many BF neurons are driven to spike by complex combinations of sensory input, motor output, and cognitive state. This implies that BF neurons integrate information over a longer time window than may be necessary for a population of neurons having close proximity (Kopell et al., 2000; Bibbig et al., 2002; Buzsáki, 2010).
BF outputs reach a distributed set of efferent targets and activity in at least some of these targets (e.g., prefrontal and parietal cortices) takes forms similar to that for BF (Gill et al., 2000, Tingley et al., 2014). The expression of such activity is dependent on intact BF input (Gill et al., 2000; Broussard et al., 2009). Thus, the relatively long window over which BF ensemble activity organizes is also the time frame over which it can be expected to modulate activity in its targets, and perhaps allow for synchronization among them. Notably, cortical targets of strong BF input may still operate, internally, at gamma frequencies, a concept consistent with theoretical work considering integration within local networks (Kopell et al., 2000; Bibbig et al., 2002) and the effects of BF stimulation on cortical field potentials (Jiménez-Capdeville et al., 1997; Manns et al., 2000a,b; Bhattacharyya et al., 2013).
Finally, the observed temporal organization of BF ensembles lends insight into how differentiated BF ensemble firing patterns are generated. Beta-frequency time scales are not typically considered as supporting synaptic potentiation. In contrast, gamma-frequency time scales overlap considerably with the optimal time scales for spike-timing-dependent plasticity (STDP) of synaptic efficacy (Bi and Poo, 1998; Dan and Poo, 2004). Yet, BF neurons can quickly develop responsiveness to newly relevant sensory stimuli (Wilson and Rolls, 1990a,b; Tindell et al., 2004; Lin and Nicolelis, 2008). If such responses reflect potentiation of synapses onto BF neurons, then the present findings imply that organization of activity according to beta frequencies may be adequate for STDP. In fact, several studies have shown large LTD responses at frequencies spanning from gamma to slow beta (Feldman, 2000). Thus, it is possible that the window for STDP of BF synapses is relatively wider or that other mechanisms for plasticity are at work. Alternatively, most responses of BF neurons may be secondary to changes within networks generating efferents to BF.
Implications for BF function
With the advent of modern stimulation techniques (e.g., optogenetics) and their potential application to neurological disorders, it is critical to understand how neural dynamics within any given brain region relate to its functional role. This is especially the case for the BF given its implication in a number of disorders, the powerful impact of its efferents, and its role as a point of convergence for neuromodulatory systems (Dringenberg and Vanderwolf, 1997).
The functional role of the BF has been examined primarily through lesion and stimulation studies, complemented sparingly by recordings in task-performing animals. Most such work emphasizes a role for the BF in arousal, attention, learning, neural representation and responsiveness (Buzsáki et al., 1988; Wilson and Rolls, 1990a,b; Chiba et al., 1995; Bakin and Weinberger, 1996; McGaughy et al., 1996; Kilgard and Merzenich, 1998; Szymusiak et al., 2000; Conner et al., 2003; Lee et al., 2004; Holland and Gallagher, 2006; Parikh et al., 2007; Lin and Nicolelis, 2008; Goard and Dan, 2009; Hassani et al., 2009; Bhattacharyya et al., 2013). The present task's structure and obtainment of multiple single neuron recordings were geared toward defining fundamental properties of BF dynamics, their response fields, and forms of temporal organization. Using this approach, the present work provides new insight into how BF may impact processing in its cortical targets according to the environmental demands. Unique populations of both bursting and nonbursting neurons become active at each task phase and their spiking activities share a common temporal framework. From a broader perspective, this suggests synergy in the impact of bursting and nonbursting neurons on their cortical targets and indicates that the BF continuously modulates its cortical targets at a precise temporal scale.
Recent neurophysiological experiments (Lin and Nicolelis, 2008; Tingley et al., 2014) evidence a view of BF function directly consistent with the complexity of its anatomical features. In this view, the currently active set of BF neurons yields enhanced responsiveness among the subset of efferent targets they reach. Here, the greater proportion of neurons having activity peaks in association with salient cues, such as a light flash, simply reflects the need for enhanced responsivity across a larger set of BF targets. The sets of BF neurons activated across task phases are presumably determined by the associated sensory, motor, and cognitive demands of the task.
This interpretation is consistent with the work of Golmayo et al., (2003), demonstrating that differential activation of neighboring BF neurons with efferents reaching different cortical targets yields site-specific enhancement of responses to sensory stimuli. Furthermore, it is more generally consistent with the following: (1) studies demonstrating enhanced responses of cortical neurons following BF stimulation or exposure to ACh or ACh receptor agonists (Zhu and Waite, 1998; Disney et al., 2007; Broussard et al., 2009; Goard and Dan, 2009; Takata et al., 2011; Ma and Luo, 2012), (2) changes in cortical sensory and motor representations associated with the pairing of BF activity and specific sensory stimuli or motor acts (Kilgard and Merzenich, 1998; Dimyan and Weinberger, 1999; Conner et al., 2003), (3) the impairments in cognition associated with BF lesions in humans and animals (Szymusiak and McGinty, 1986; Biggan et al., 1991; Roberts et al., 1992; Muir et al., 1993; Baxter et al., 1995; Chiba et al., 1995; Leanza et al., 1996; Stoehr et al., 1997; Zhu and Waite, 1998; McGaughy et al., 2002), and (4) the organization of cell assemblies at time scales supporting coordination of activity across widely separated brain regions.
Anatomical theories of the BF (Zaborszky, 2002; Zahm, 2006; Muñoz and Rudy, 2014) have placed contrasting emphasis either on a modular organization by which processing units distinctly regulate their neural targets or on processing systems that can convene as a cooperative network. Our recording studies emphasize the ability of the basal forebrain to serve both these functions, through the firing of functional groups across time and task epochs (Tingley et al., 2014) and by the formation of cell assemblies that can provide distinct output or coordinate in the service of global output. Whereas the structure and function of this neuronal territory has been studied in a multitude of experiments across behavioral domains and species, examining the collective function of individual BF neurons serves to elucidate why the integrity of this region remains fundamental to effective sleep, learning, memory, and attention and why degradation of this region in disease states ultimately devastates these functions.
Footnotes
This work was supported by NSF Grants NSF IIS-0910710, NSF IIS-1149718, and NSF SES-0963071. We thank Belinda La, Jennifer Remaklus, and Tina Chan for their expert technical assistance, and Jeffrey Krichmar and Angela Yu for help in experimental design.
References
- Alam MN, Szymusiak R, Gong H, King J, McGinty D. Adenosinergic modulation of rat basal forebrain neurons during sleep and waking: neuronal recording with microdialysis. J Physiol. 1999;521:679–690. doi: 10.1111/j.1469-7793.1999.00679.x. [DOI] [PMC free article] [PubMed] [Google Scholar]
- Bakin JS, Weinberger NM. Induction of a physiological memory in the cerebral cortex by stimulation of the nucleus basalis. Proc Natl Acad Sci U S A. 1996;93:11219–11224. doi: 10.1073/pnas.93.20.11219. [DOI] [PMC free article] [PubMed] [Google Scholar]
- Baxter MG, Bucci DJ, Gorman LK, Wiley RG, Gallagher M. Selective immunotoxic lesions of basal forebrain cholinergic cells: effects on learning and memory in rats. Behav Neurosci. 1995;109:714–722. doi: 10.1037/0735-7044.109.4.714. [DOI] [PubMed] [Google Scholar]
- Bhattacharyya A, Veit J, Kretz R, Bondar I, Rainer G. Basal forebrain activation controls contrast sensitivity in primary visual cortex. BMC Neurosci. 2013;14:55. doi: 10.1186/1471-2202-14-55. [DOI] [PMC free article] [PubMed] [Google Scholar]
- Bi GQ, Poo MM. Synaptic modifications in cultured hippocampal neurons: dependence on spike timing, synaptic strength, and postsynaptic cell type. J Neurosci. 1998;18:10464–10472. doi: 10.1523/JNEUROSCI.18-24-10464.1998. [DOI] [PMC free article] [PubMed] [Google Scholar]
- Bibbig A, Traub RD, Whittington MA. Long-range synchronization of gamma and beta oscillations and the plasticity of excitatory and inhibitory synapses: a network model. J Neurophysiol. 2002;88:1634–1654. doi: 10.1152/jn.2002.88.4.1634. [DOI] [PubMed] [Google Scholar]
- Biggan SL, Beninger RJ, Cockhill J, Jhamandas K, Boegman RJ. Quisqualate lesions of rat NBM: selective effects on working memory in a double Y-maze. Brain Res Bull. 1991;26:613–616. doi: 10.1016/0361-9230(91)90103-Q. [DOI] [PubMed] [Google Scholar]
- Broussard JI, Karelina K, Sarter M, Givens B. Cholinergic optimization of cue-evoked parietal activity during challenged attentional performance. Eur J Neurosci. 2009;29:1711–1722. doi: 10.1111/j.1460-9568.2009.06713.x. [DOI] [PMC free article] [PubMed] [Google Scholar]
- Brückner G, Schütz A, Härtig W, Brauer K, Paulke BR, Bigl V. Projection of non-cholinergic basal forebrain neurons ensheathed with perineuronal nets to rat mesocortex. J Chem Neuroanat. 1994;8:11–18. doi: 10.1016/0891-0618(94)90032-9. [DOI] [PubMed] [Google Scholar]
- Bucci DJ, Holland PC, Gallagher M. Removal of cholinergic input to rat posterior parietal cortex disrupts incremental processing of conditioned stimuli. J Neurosci. 1998;18:8038–8046. doi: 10.1523/JNEUROSCI.18-19-08038.1998. [DOI] [PMC free article] [PubMed] [Google Scholar]
- Buzsáki G. Neural syntax: cell assemblies, synapsembles, and readers. Neuron. 2010;68:362–385. doi: 10.1016/j.neuron.2010.09.023. [DOI] [PMC free article] [PubMed] [Google Scholar]
- Buzsáki G, Bickford RG, Ponomareff G, Thal LJ, Mandel R, Gage FH. Nucleus basalis and thalamic control of neocortical activity in the freely moving rat. J Neurosci. 1988;8:4007–4026. doi: 10.1523/JNEUROSCI.08-11-04007.1988. [DOI] [PMC free article] [PubMed] [Google Scholar]
- Buzsáki G, Wang XJ. Mechanisms of gamma oscillations. Annu Rev Neurosci. 2012;35:203–225. doi: 10.1146/annurev-neuro-062111-150444. [DOI] [PMC free article] [PubMed] [Google Scholar]
- Carnes KM, Fuller TA, Price JL. Sources of presumptive glutamatergic/aspartatergic afferents to the magnocellular basal forebrain in the rat. J Comp Neurol. 1990;302:824–852. doi: 10.1002/cne.903020413. [DOI] [PubMed] [Google Scholar]
- Chiba AA, Bucci DJ, Holland PC, Gallagher M. Basal forebrain cholinergic lesions disrupt increments but not decrements in conditioned stimulus processing. J Neurosci. 1995;15:7315–7322. doi: 10.1523/JNEUROSCI.15-11-07315.1995. [DOI] [PMC free article] [PubMed] [Google Scholar]
- Conner JM, Culberson A, Packowski C, Chiba AA, Tuszynski MH. Lesions of the basal forebrain cholinergic system impair task acquisition and abolish cortical plasticity associated with motor skill learning. Neuron. 2003;38:819–829. doi: 10.1016/S0896-6273(03)00288-5. [DOI] [PubMed] [Google Scholar]
- Dan Y, Poo MM. Spike timing-dependent plasticity of neural circuits. Neuron. 2004;44:23–30. doi: 10.1016/j.neuron.2004.09.007. [DOI] [PubMed] [Google Scholar]
- Dimyan MA, Weinberger NM. Basal forebrain stimulation induces discriminative receptive field plasticity in the auditory cortex. Behav Neurosci. 1999;113:691–702. doi: 10.1037/0735-7044.113.4.691. [DOI] [PubMed] [Google Scholar]
- Disney AA, Aoki C, Hawken MJ. Gain modulation by nicotine in macaque v1. Neuron. 2007;56:701–713. doi: 10.1016/j.neuron.2007.09.034. [DOI] [PMC free article] [PubMed] [Google Scholar]
- Dringenberg HC, Vanderwolf CH. Neocortical activation: modulation by multiple pathways acting on central cholinergic and serotonergic systems. Exp Brain Res. 1997;116:160–174. doi: 10.1007/PL00005736. [DOI] [PubMed] [Google Scholar]
- Fadel J, Frederick-Duus D. Orexin/hypocretin modulation of the basal forebrain cholinergic system: insights from in vivo microdialysis studies. Pharmacol Biochem Behav. 2008;90:156–162. doi: 10.1016/j.pbb.2008.01.008. [DOI] [PubMed] [Google Scholar]
- Feldman DE. Timing-based LTP and LTD at vertical inputs to layer II/III pyramidal cells in rat barrel cortex. Neuron. 2000;27:45–56. doi: 10.1016/S0896-6273(00)00008-8. [DOI] [PubMed] [Google Scholar]
- Gill TM, Sarter M, Givens B. Sustained visual attention performance-associated prefrontal neuronal activity: evidence for cholinergic modulation. J Neurosci. 2000;20:4745–4757. doi: 10.1523/JNEUROSCI.20-12-04745.2000. [DOI] [PMC free article] [PubMed] [Google Scholar]
- Goard M, Dan Y. Basal forebrain activation enhances cortical coding of natural scenes. Nat Neurosci. 2009;12:1444–1449. doi: 10.1038/nn.2402. [DOI] [PMC free article] [PubMed] [Google Scholar]
- Golmayo L, Nuñez A, Zaborszky L. Electrophysiological evidence for the existence of a posterior cortical-prefrontal-basal forebrain circuitry in modulating sensory responses in visual and somatosensory rat cortical areas. Neuroscience. 2003;119:597–609. doi: 10.1016/S0306-4522(03)00031-9. [DOI] [PubMed] [Google Scholar]
- Gritti I, Mainville L, Mancia M, Jones BE. GABAergic and other noncholinergic basal forebrain neurons, together with cholinergic neurons, project to the mesocortex and isocortex in the rat. J Comp Neurol. 1997;383:163–177. doi: 10.1002/(SICI)1096-9861(19970630)383:2<163::AID-CNE4>3.0.CO;2-Z. [DOI] [PubMed] [Google Scholar]
- Harris KD. Neural signatures of cell assembly organization. Nat Rev Neurosci. 2005;6:399–407. doi: 10.1038/nrn1669. [DOI] [PubMed] [Google Scholar]
- Harris KD, Csicsvari J, Hirase H, Dragoi G, Buzsáki G. Organization of cell assemblies in the hippocampus. Nature. 2003;424:552–556. doi: 10.1038/nature01834. [DOI] [PubMed] [Google Scholar]
- Hassani OK, Lee MG, Henny P, Jones BE. Discharge profiles of identified GABAergic in comparison to cholinergic and putative glutamatergic basal forebrain neurons across the sleep–wake cycle. J Neurosci. 2009;29:11828–11840. doi: 10.1523/JNEUROSCI.1259-09.2009. [DOI] [PMC free article] [PubMed] [Google Scholar]
- Hebb DO. Organization of behavior: a neuropsychological theory. New York: Wiley; 1949. [Google Scholar]
- Henny P, Jones BE. Projections from basal forebrain to prefrontal cortex comprise cholinergic, GABAergic and glutamatergic inputs to pyramidal cells or interneurons. Eur J Neurosci. 2008;27:654–670. doi: 10.1111/j.1460-9568.2008.06029.x. [DOI] [PMC free article] [PubMed] [Google Scholar]
- Holland PC, Gallagher M. Different roles for amygdala central nucleus and substantia innominata in the surprise-induced enhancement of learning. J Neurosci. 2006;26:3791–3797. doi: 10.1523/JNEUROSCI.0390-06.2006. [DOI] [PMC free article] [PubMed] [Google Scholar]
- Jiménez-Capdeville ME, Dykes RW, Myasnikov AA. Differential control of cortical activity by the basal forebrain in rats: a role for both cholinergic and inhibitory influences. J Comp Neurol. 1997;381:53–67. doi: 10.1002/(SICI)1096-9861(19970428)381:1<53::AID-CNE5>3.0.CO;2-J. [DOI] [PubMed] [Google Scholar]
- Jones BE, Cuello AC. Afferents to the basal forebrain cholinergic cell area from pontomesencephalic-catecholamine, serotonin, and acetylcholine-neurons. Neuroscience. 1989;31:37–61. doi: 10.1016/0306-4522(89)90029-8. [DOI] [PubMed] [Google Scholar]
- Kilgard MP, Merzenich MM. Cortical map reorganization enabled by nucleus basalis activity. Science. 1998;279:1714–1718. doi: 10.1126/science.279.5357.1714. [DOI] [PubMed] [Google Scholar]
- Kopell N, Ermentrout GB, Whittington MA, Traub RD. Gamma rhythms and beta rhythms have different synchronization properties. Proc Natl Acad Sci U S A. 2000;97:1867–1872. doi: 10.1073/pnas.97.4.1867. [DOI] [PMC free article] [PubMed] [Google Scholar]
- Leanza G, Muir J, Nilsson OG, Wiley RG, Dunnett SB, Bjorklund A. Selective immunolesioning of the basal forebrain cholinergic system disrupts short-term memory in rats. Eur J Neurosci. 1996;8:1535–1544. doi: 10.1111/j.1460-9568.1996.tb01616.x. [DOI] [PubMed] [Google Scholar]
- Lee MG, Manns ID, Alonso A, Jones BE. Sleep–wake related discharge properties of basal forebrain neurons recorded with micropipettes in head-fixed rats. J Neurophysiol. 2004;92:1182–1198. doi: 10.1152/jn.01003.2003. [DOI] [PubMed] [Google Scholar]
- Lin SC, Gervasoni D, Nicolelis MA. Fast modulation of prefrontal cortex activity by basal forebrain noncholinergic neuronal ensembles. J Neurophysiol. 2006;96:3209–3219. doi: 10.1152/jn.00524.2006. [DOI] [PubMed] [Google Scholar]
- Lin SC, Nicolelis MA. Neuronal ensemble bursting in the basal forebrain encodes salience irrespective of valence. Neuron. 2008;59:138–149. doi: 10.1016/j.neuron.2008.04.031. [DOI] [PMC free article] [PubMed] [Google Scholar]
- Loopuijt LD, Zahm DS. Synaptologic and fine structural features distinguishing a subset of basal forebrain cholinergic neurons embedded in the dense intrinsic fiber network of the caudal. J Comp Neurol. 2006;498:93–111. doi: 10.1002/cne.21044. [DOI] [PubMed] [Google Scholar]
- Ma M, Luo M. Optogenetic activation of basal forebrain cholinergic neurons modulates neuronal excitability and sensory responses in the main olfactory bulb. J Neurosci. 2012;32:10105–10116. doi: 10.1523/JNEUROSCI.0058-12.2012. [DOI] [PMC free article] [PubMed] [Google Scholar]
- Manns ID, Alonso A, Jones BE. Discharge profiles of juxtacellularly labeled and immunohistochemically identified GABAergic basal forebrain neurons recorded in association with the electroencephalogram in anesthetized rats. J Neurosci. 2000a;20:9252–9263. doi: 10.1523/JNEUROSCI.20-24-09252.2000. [DOI] [PMC free article] [PubMed] [Google Scholar]
- Manns ID, Alonso A, Jones BE. Discharge properties of juxtacellularly labeled and immunohistochemically identified cholinergic basal forebrain neurons recorded in association with the electroencephalogram in anesthetized rats. J Neurosci. 2000b;20:1505–1518. doi: 10.1523/JNEUROSCI.20-04-01505.2000. [DOI] [PMC free article] [PubMed] [Google Scholar]
- McGaughy J, Kaiser T, Sarter M. Behavioral vigilance following infusions of 192 IgG-saporin into the basal forebrain: selectivity of the behavioral impairment and relation to cortical AChE-positive fiber density. Behav Neurosci. 1996;110:247–265. doi: 10.1037/0735-7044.110.2.247. [DOI] [PubMed] [Google Scholar]
- McGaughy J, Dalley JW, Morrison CH, Everitt BJ, Robbins TW. Selective behavioral and neurochemical effects of cholinergic lesions produced by intrabasalis infusions of 192 IgG-saporin on attentional performance in a five-choice serial reaction time task. J Neurosci. 2002;22:1905–1913. doi: 10.1523/JNEUROSCI.22-05-01905.2002. [DOI] [PMC free article] [PubMed] [Google Scholar]
- Metherate R, Ashe JH. Synaptic interactions involving acetylcholine, glutamate, and GABA in rat auditory cortex. Exp Brain Res. 1995;107:59–72. doi: 10.1007/BF00228017. [DOI] [PubMed] [Google Scholar]
- Muir JL, Page KJ, Sirinathsinghji DJ, Robbins TW, Everitt BJ. Excitotoxic lesions of basal forebrain cholinergic neurons: effects on learning, memory and attention. Behav Brain Res. 1993;57:123–131. doi: 10.1016/0166-4328(93)90128-D. [DOI] [PubMed] [Google Scholar]
- Muñoz W, Rudy B. Spatiotemporal specificity in cholinergic control of neocortical function. Curr Opin Neurobiol. 2014;26:149–160. doi: 10.1016/j.conb.2014.02.015. [DOI] [PMC free article] [PubMed] [Google Scholar]
- Nelson CL, Sarter M, Bruno JP. Prefrontal cortical modulation of acetylcholine release in posterior parietal cortex. Neuroscience. 2005;132:347–359. doi: 10.1016/j.neuroscience.2004.12.007. [DOI] [PubMed] [Google Scholar]
- Parikh V, Kozak R, Martinez V, Sarter M. Prefrontal acetylcholine release controls cue detection on multiple timescales. Neuron. 2007;56:141–154. doi: 10.1016/j.neuron.2007.08.025. [DOI] [PMC free article] [PubMed] [Google Scholar]
- Pinto L, Goard MJ, Estandian D, Xu M, Kwan AC, Lee SH, Harrison TC, Feng G, Dan Y. Fast modulation of visual perception by basal forebrain cholinergic neurons. Nat Neurosci. 2013;16:1857–1863. doi: 10.1038/nn.3552. [DOI] [PMC free article] [PubMed] [Google Scholar]
- Quinn LK, Nitz DA, Chiba AA. Learning-dependent dynamics of beta-frequency oscillations in the basal forebrain of rats. Eur J Neurosci. 2010;32:1507–1515. doi: 10.1111/j.1460-9568.2010.07422.x. [DOI] [PubMed] [Google Scholar]
- Riedel A, Härtig W, Seeger G, Gärtner U, Brauer K, Arendt T. Principles of rat subcortical forebrain organization: a study using histological techniques and multiple fluorescence labeling. J Chem Neuroanat. 2002;23:75–104. doi: 10.1016/S0891-0618(01)00142-9. [DOI] [PubMed] [Google Scholar]
- Roberts AC, Robbins TW, Everitt BJ, Muir JL. A specific form of cognitive rigidity following excitotoxic lesions of the basal forebrain in marmosets. Neuroscience. 1992;47:251–264. doi: 10.1016/0306-4522(92)90241-S. [DOI] [PubMed] [Google Scholar]
- Sarter M, Bruno JP. The neglected constituent of the basal forebrain corticopetal projection system: GABAergic projections. Eur J Neurosci. 2002;15:1867–1873. doi: 10.1046/j.1460-9568.2002.02004.x. [DOI] [PubMed] [Google Scholar]
- Sarter M, Lustig C, Howe WM, Gritton H, Berry AS. Deterministic functions of cortical acetylcholine. Eur J Neurosci. 2014;39:1912–1920. doi: 10.1111/ejn.12515. [DOI] [PMC free article] [PubMed] [Google Scholar]
- Semba K, Reiner PB, McGeer EG, Fibiger HC. Brainstem afferents to the magnocellular basal forebrain studied by axonal transport, immunohistochemistry, and electrophysiology in the rat. J Comp Neurol. 1988;267:433–453. doi: 10.1002/cne.902670311. [DOI] [PubMed] [Google Scholar]
- Stoehr JD, Mobley SL, Roice D, Brooks R, Baker LM, Wiley RG, Wenk GL. The effects of selective cholinergic basal forebrain lesions and aging upon expectancy in the rat. Neurobiol Learn Mem. 1997;67:214–227. doi: 10.1006/nlme.1997.3768. [DOI] [PubMed] [Google Scholar]
- Szymusiak R, Alam N, McGinty D. Discharge patterns of neurons in cholinergic regions of the basal forebrain during waking and sleep. Behav Brain Res. 2000;115:171–182. doi: 10.1016/S0166-4328(00)00257-6. [DOI] [PubMed] [Google Scholar]
- Szymusiak R, McGinty D. Sleep suppression following kainic acid-induced lesions of the basal forebrain. Exp Neurol. 1986;94:598–614. doi: 10.1016/0014-4886(86)90240-2. [DOI] [PubMed] [Google Scholar]
- Takata N, Mishima T, Hisatsune C, Nagai T, Ebisui E, Mikoshiba K, Hirase H. Astrocyte calcium signaling transforms cholinergic modulation to cortical plasticity in vivo. J Neurosci. 2011;31:18155–18165. doi: 10.1523/JNEUROSCI.5289-11.2011. [DOI] [PMC free article] [PubMed] [Google Scholar]
- Tindell AJ, Berridge KC, Aldridge JW. Ventral pallidal representation of Pavlovian cues and reward: population and rate codes. J Neurosci. 2004;24:1058–1069. doi: 10.1523/JNEUROSCI.1437-03.2004. [DOI] [PMC free article] [PubMed] [Google Scholar]
- Tingley D, Alexander AS, Kolbu S, de Sa VR, Chiba AA, Nitz DA. Task-phase-specific dynamics of basal forebrain neuronal ensembles task-phase-specific dynamics of basal forebrain neuronal ensembles. Front Syst Neurosci. 2014;8:174. doi: 10.3389/fnsys.2014.00174. [DOI] [PMC free article] [PubMed] [Google Scholar]
- Wilson FA, Rolls ET. Neuronal responses related to the novelty and familiarity of visual stimuli in the substantia innominata, diagonal band of Broca and periventricular region of the primate basal forebrain. Exp Brain Res. 1990a;80:104–120. doi: 10.1007/BF00228852. [DOI] [PubMed] [Google Scholar]
- Wilson FA, Rolls ET. Neuronal responses related to reinforcement in the primate basal forebrain. Brain Res. 1990b;509:213–231. doi: 10.1016/0006-8993(90)90546-N. [DOI] [PubMed] [Google Scholar]
- Zaborszky L. The modular organization of brain systems. Basal forebrain: the last frontier. Prog Brain Res. 2002;136:359–372. doi: 10.1016/S0079-6123(02)36030-8. [DOI] [PubMed] [Google Scholar]
- Zaborszky L, Heimer L, Eckenstein F, Leranth C. GABAergic input to cholinergic forebrain neurons: an ultrastructural study using retrograde tracing of HRP and double immunolabeling. J Comp Neurol. 1986;250:282–295. doi: 10.1002/cne.902500303. [DOI] [PubMed] [Google Scholar]
- Zaborszky L, Gaykema RP, Swanson DJ, Cullinan WE. Cortical input to the basal forebrain. Neuroscience. 1997;79:1051–1078. doi: 10.1016/S0306-4522(97)00049-3. [DOI] [PubMed] [Google Scholar]
- Zaborszky L, Pang K, Somogyi J, Nadasdy Z, Kallo I. The basal forebrain corticopetal system revisited. Ann N Y Acad Sci. 1999;877:339–367. doi: 10.1111/j.1749-6632.1999.tb09276.x. [DOI] [PubMed] [Google Scholar]
- Zaborszky L, Csordas A, Mosca K, Kim J, Gielow MR, Vadasz C, Nadasdy Z. Neurons in the basal forebrain project to the cortex in a complex topographic organization that reflects corticocortical connectivity patterns: an experimental study based on retrograde tracing and 3D reconstruction. Cereb Cortex. 2015;25:118–137. doi: 10.1093/cercor/bht210. [DOI] [PMC free article] [PubMed] [Google Scholar]
- Zahm DS. The evolving theory of basal forebrain functional-anatomical “macrosystems.”. Neurosci Biobehav Rev. 2006;30:148–172. doi: 10.1016/j.neubiorev.2005.06.003. [DOI] [PubMed] [Google Scholar]
- Zant JC, Rozov S, Wigren HK, Panula P, Porkka-Heiskanen T. Histamine release in the basal forebrain mediates cortical activation through cholinergic neurons. J Neurosci. 2012;32:13244–13254. doi: 10.1523/JNEUROSCI.5933-11.2012. [DOI] [PMC free article] [PubMed] [Google Scholar]
- Zhu XO, Waite PM. Cholinergic depletion reduces plasticity of barrel field cortex. Cereb Cortex. 1998;8:63–72. doi: 10.1093/cercor/8.1.63. [DOI] [PubMed] [Google Scholar]