

Abstract
Molecular genetic changes in acute myeloid leukemia (AML) play crucial roles in leukemogenesis, including recurrent chromosome translocations, epigenetic/spliceosome mutations and transcription factor aberrations. Six1, a transcription factor of the Sine oculis homeobox (Six) family, has been shown to transform normal hematopoietic progenitors into leukemia in cooperation with Eya. However, the specific role and the underlying mechanism of Six1 in leukemia maintenance remain unexplored. Here, we showed increased expression of SIX1 in AML patients and murine leukemia stem cells (c‐Kit+ cells, LSCs). Importantly, we also observed that a higher level of Six1 in human patients predicts a worse prognosis. Notably, knockdown of Six1 significantly prolonged the survival of MLL‐AF9‐induced AML mice with reduced peripheral infiltration and tumor burden. AML cells from Six1‐knockdown (KD) mice displayed a significantly decreased number and function of LSC, as assessed by the immunophenotype, colony‐forming ability and limiting dilution assay. Further analysis revealed the augmented apoptosis of LSC and decreased expression of glycolytic genes in Six1 KD mice. Overall, our data showed that Six1 is essential for the progression of MLL‐AF9‐induced AML via maintaining the pool of LSC.
Keywords: acute myeloid leukemia, glycolysis, leukemia stem cell, MLL‐rearranged leukemia, Six1
1. INTRODUCTION
Acute myeloid leukemia (AML) is a life‐threatening malignancy characterized by the unlimited expansion and blockade of differentiation of hematopoietic stem/progenitor cells (HSPCs).1 Heterogeneity of AML is manifested by multiple oncogenic proteins, including mixed‐lineage leukemia (MLL) fusions/t(v;11q23), PML‐RARα/t(15;17), AML1‐ETO/t(8;21) and CBFB‐MYH11/(inv16).2, 3 AML with MLL rearrangement/t(v;11q23) is a specific subtype due to its poor clinical prognosis. The MLL gene encodes a H3K4 methyltransferase that is critical for development and hematopoiesis. Chromosomal rearrangements involving the MLL gene are associated with high‐risk infant, pediatric, adult and therapy‐induced acute leukemia.4, 5 To date, over 79 different MLL fusions have been identified in acute leukemia patients.6 The most common MLL fusion partners include AF4, AF9, ENL, AF10 and ELL, which together account for over 80% of MLL‐rearranged AML7, 8 and 4% of all AML patients.9 These most recurrent MLL fusions share a similar downstream pathway, including aberrant upregulated expression of MLL target genes and histone modification genes, as shown by several studies.10, 11, 12, 13, 14
Studies have demonstrated that enforced expression of MLL‐AF9 fusion protein could transform the non–self‐renewing granulocyte/macrophage progenitors (GMP) into leukemia stem cells (LSC) by activating the expression of Hox proteins.15 Consistently, the coexpression of Homeobox proteins Hoxa9/Meis1 or Meis1/Pbx3 is sufficient to immortalize hematopoietic progenitor cells (HPC) and induce leukemogenesis,16, 17, 18, 19 indicating a bridge/mediator role of transcription factors in MLL fusion‐induced leukemic transformation and progression.
Transcription factor Sine oculis homeobox 1 (Six1) belongs to the Six family, a subfamily of homeodomain protein, which is characterized by a DNA‐binding homeodomain (HD, 60 amino acids) and Six‐domain (SD, 110‐115 amino acids).20 Six1 plays an important role in the development of several organs.21 Six1‐knockout (KO) mice die shortly after birth and KO embryos show defective development in several organs and tissues.22, 23, 24, 25 Six family members could mediate the DNA‐binding specificity and transcriptionally activate their target genes via the recruitment of EYA protein, which contains transactivation and phosphatase domains.26, 27
Six1 is overexpressed in various cancers, such as breast cancer, liver cancer and colorectal cancer.21, 28, 29, 30, 31 Importantly, increased SIX1 expression predicts poor clinical outcomes in solid tumors.21 Although Six1 alone cannot transform HPC, it was shown to collaborate with Eya1 in hematopoietic transformation assays in vitro.30 In addition to its role in leukemia initiation, the specific role of Six1 in leukemia progression remains unexplored.
In the present study, we demonstrated that Six1 is overexpressed in several AML, and its high expression is significantly correlated with a poor prognosis. The specific functional role of Six1 in leukemia maintenance in vivo and in LSC pool maintenance, as well as the underlying mechanism were also explored.
2. MATERIALS AND METHODS
2.1. Mice
C57BL/6J mice were bred at a specific pathogen‐free animal facility of SKLEH. All animal research was approved by the Institutional Animal Care and Use Committee of SKLEH. MLL‐AF9 or MLL‐NRIP3 leukemic mice were generated by transplantation of leukemia cells carrying MLL‐AF9 or MLL‐NRIP3 fusion genes32 into sub‐lethally irradiated (4 Gy) mice, respectively. MLL‐NRIP3 (MN3) is a recently reported MLL translocation and was demonstrated to be able to induce AML in mice in previous studies.33, 34
2.2. Plasmid construction
shRNA targeting Six1 were designed using online software (http://dharmacon.gelifesciences.com). The top 2 shRNA were selected; a 116‐bp fragment harboring mir30 and shRNA flanked by XhoI and EcoRI was synthesized and cloned into a basic PUC57‐simple vector by Genomics Company. DNA containing shRNA were subcloned into the SF‐LV‐BFP vector between 5′mir30 and 3′mir30 with XhoI and EcoRI, and single clones were picked and verified by Sanger sequencing as follows: Sh‐Six‐a: TAACCTAGCCACTATTCTC, targeting the 3′UTR; sh‐Six‐b: AACGACCACAAGAACCTGC, targeting the ORF.
2.3. Generation of scramble and Six1 knockdown leukemia mouse models
For lentivirus production, 293T cells were transfected with shRNA containing SF‐LV‐BFP plasmids and the helper plasmid pMD.G and psPAX2 with Lipofectamine 2000. Virus‐containing supernatant medium was collected 2 days after transfection. MLL‐AF9 leukemia cells32 were pre–stimulated overnight with 10 ng/mL of mIL3 and mIL6 and 50 ng/mL of mSCF (Peprotech, Rocky Hill, NJ, USA) and were then transduced with scramble or shRNA lentivirus supernatant. After 2 days of culture, the transduced cells were collected and transplanted into lethally irradiated (9.5 Gy) mice.
2.4. Colony‐forming unit assay
Cells were placed in M3231 (Stem Cell Technologies, Vancouver, Canada) methylcellulose with 10 ng/mL of mIL3, 10 ng/mL of mIL6, 10 ng/mL of GM‐CSF, 50 ng/mL of SCF (Peprotech), and 50 U/mL of penicillin/streptomycin (Gibco, Invitrogen, Grand Island, NY, USA) and were then plated in 24‐well plates to ensure 500 cells per well. The colonies were counted after 7 days of culture.
2.5. Flow cytometry, apoptosis and cell cycle analysis
Bone marrow cells were flushed with 2 mmol/L EDTA and 2% FBS containing PBS and were then stained with antibodies at the appropriate proper dilution (Table S1). Flow cytometric analysis of c‐Kit+ or L‐GMP (Lin−c‐Kit+IL‐7R−Sca‐1−CD16/32+CD34+) cells was performed as previously described.32 For L‐GMP, the lineage cocktail (Lin) contains Gr‐1, Ter119, B220, CD3, CD4 and CD8. The analyses were performed using a BD Canto II or LSR Fortessa flow cytometer (BD Biosciences, San Jose, CA, USA).
2.6. Western blotting analysis
Bone marrow leukemia cells were lysed with RIPA buffer and then were resolved by 10% SDS‐PAGE and transferred to a PVDF membrane (Merck Millipore, Carrigtwohill, Ireland), as previously described.35 The antibodies used are listed in Table S1.
2.7. qRT‐PCR
Total RNA was extracted using the RNeasy Kit (QIAGEN, Hilden, Germany), and cDNA was synthesized using the PrimeScript RT Reagent Kit with gDNA Eraser (TAKARA, Kusatsu, Japan) according to the manufacturer's instructions. Quantitative RT‐PCR was performed in triplicate using a QuantStudio 5 (ThermoFisher, Singapore) and the Fast SYBR Green Master Mix (Roche, Mannheim, Germany), as previously described.36 All primers used in this study are listed in Table S2.
2.8. Pyruvate assays, lactate assays and ATP assays
Cellular pyruvate, lactate or ATP were measured with a pyruvate colorimetric assay kit, a lactate colorimetric assay kit or an ATP fluorometric assay kit (Biovision, Milpitas, CA, USA), correspondingly. Briefly, cells (2 × 10⁶) were collected and washed with cold PBS once and were then extracted with 200 μL of the assay buffer of the corresponding kit assisted with pipetting. The lysates were centrifuged at 14 000 g for 10 minutes at 4°C to remove insoluble material. The proper volume of supernatant was assayed using the corresponding assay kit according to the manufacturer's protocols (Biovision).
2.9. Histology analysis
Tissue samples were fixed in 4% formaldehyde for over 12 hrs, embedded in paraffin, sectioned at 8‐μm thickness and then stained with H&E as previously described.32
2.10. Limiting dilution assay
GFP+ leukemic cells were collected from bone marrow of sh‐Six‐a, sh‐Six‐b or scramble mice and subjected to a limiting dilution series, creating populations of 10 000, 1000, 100 and 10 cells separately. The different populations were transplanted into sub‐lethally irradiated recipient mice. The number of recipients that developed leukemia and died was recorded. Recipients surviving 3 months post‐transplantation with no detectable GFP+ cells in the blood, spleen and bone marrow were considered to be non–responders. The frequencies of LSC were calculated according to Poisson statistics using ELDA software.37 The χ2‐test was employed (*P < 0.05, **P < 0.01).
2.11. Statistical analysis
Student's t test was used to compare the 2 groups. One‐way ANOVA was used to compare more than 2 groups. The absence of * in the graphs indicates no significant difference between the groups. Analyses were carried out using GraphPad Prism 7.
3. RESULTS
3.1. High expression of SIX1 predicts a poor prognosis in acute myeloid leukemia patients
To explore the potential role of SIX1 in leukemia, we assessed its expression pattern in the existing clinical databases (the HemaExplorer database).38 We found that SIX1 was highly expressed in AML cells in patients compared with that in granulocyte‐macrophage progenitors (GMP) (Figure 1A), which are considered a major cell type that contributes to malignant transformation and leukemia maintenance in MLL fusion leukemia.16 We noticed that AML with MLL translocation/t (v;11q23) showed the highest expression of SIX1 among all types of AML in the clinical database (Figure 1A). The differential expression patterns were further confirmed in MLL fusion‐induced AML mice and normal mice. Indeed, the expression of Six1 in leukemia stem cell (LSC)‐enriched groups (c‐Kit+ and Lin−c‐Kit+IL‐7R−Sca‐1−CD16/32+CD34+ marked as L‐GMP) was much higher than that of their normal counterparts (Figure 1B,C). In addition, analysis of the published clinical data collected by PrognoScan39 revealed that high expression levels of SIX1 are significantly correlated with a worse survival in 2 different cohorts (Figure 1D,E). Furthermore, we found that in the MLL‐r group, the patients with high expression levels of SIX1 have a tendency of worse survival (Figure 1F). However, in the non–MLL‐r group, the survival curve was similar between Six1‐high and Six1‐low groups (Figure 1G). These data indicate that SIX1 may play an important role in MLL‐r leukemia maintenance and/or progression.
Figure 1.
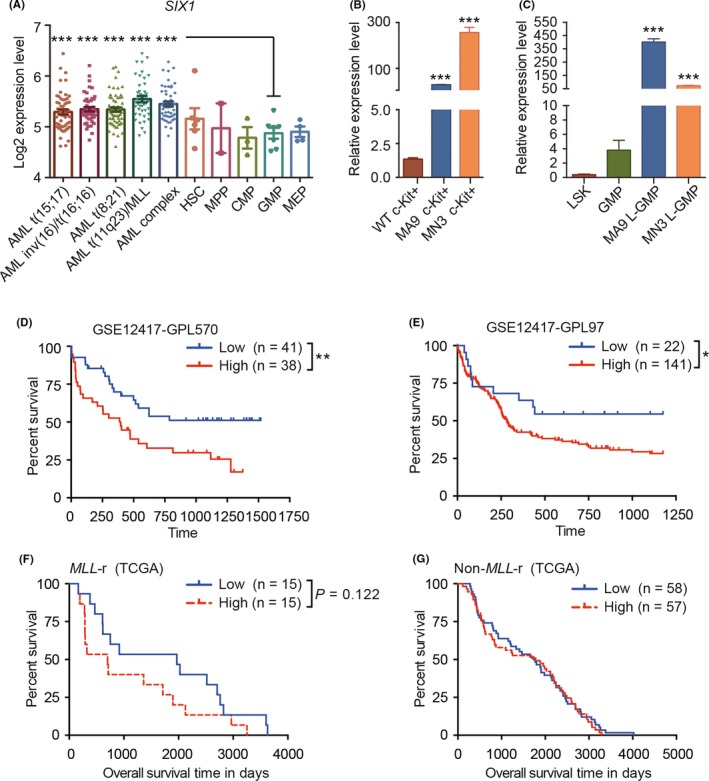
SIX1 expression patterns and its correlation with the acute myeloid leukemia (AML) patient prognosis. A, The expression level of SIX1 in normal and malignant human blood cells (the data were obtained from bloodspot specimens); one‐way ANOVA; ***P < 0.001. B and C, The expression pattern of Six1 in murine normal and leukemic stem and progenitor‐rich cells (defined as c‐Kit+ cells in panel B and LSK (Lin−c‐Kit+ Sca‐1+) and GMP (granulocyte‐macrophage progenitors) for normal hematopoietic stem/progenitor cell (HSPC)s, and L‐GMP for leukemic stem cells in panel C, respectively). MA9, MLL‐AF9; MN3, MLL‐NRIP3; n = 3, mean ± SD; one‐way ANOVA; ***P < 0.001. D and E, Overall survival between AML patients with higher or lower expression levels of SIX1 (n = 79, GSE12417‐GPL570 for panel D and n = 163, GSE12417‐GPL97 for panel E, analyzed data from PrognoScan). F and G, Overall survival between AML patients with (F) or without (G) MLL‐r with higher or lower expression levels of SIX1 (n = 30, for panel F and n = 115, for panel G analyzed data from TCGA). For panels D‐G, Mantel‐Cox test; minimal P‐value: *P < 0.05; **P < 0.01
3.2. Establishing the Six1‐knockdown acute myeloid leukemia murine model
To further investigate that the high level of Six1 is essential for leukemia maintenance, we reduced Six1 expression in MLL‐AF9 leukemia models using a lentivirus‐shRNA‐mediated knockdown (KD) system. We designed 2 different shRNA targeting the 3′ UTR (sh‐Six1‐a) and ORF (sh‐Six1‐b) of Six1, respectively, and cloned them into the SF‐LV‐BFP vector containing blue‐fluorescence protein (BFP) driven by the spleen focus forming promoter (SFFV) (Figure 2A). BM c‐Kit+ cells were transduced with retrovirus containing the MLL‐AF9 fusion gene, and these cells were transplanted into lethally irradiated recipients to generate the MLL‐AF9 leukemia model. After serial transplantations, cells from tertiary recipients were further infected with shSix1 viruses and were then transplanted into lethally irradiated recipients to establish the Six1‐KD leukemia mouse model, and Six1‐KD AML cells were transplanted serially to stabilize the knockdown effect (the sh‐scramble leukemia mouse model was established and transplanted in parallel) (Figure 2B). The knockdown efficiency of Six1 in AML cells from the secondary recipients were assessed by quantitative PCR with reverse transcription (qRT‐PCR) (Figure 2C) and by western blotting analysis (Figure 2D,E). Both the RNA level and the protein level of Six1 are decreased by shRNA, and sh‐Six‐b showed a higher knockdown efficiency than sh‐Six‐a. Thus, we established a Six1‐KD leukemia mouse model that facilitated the further investigation of the role of Six1 in leukemia in vivo.
Figure 2.
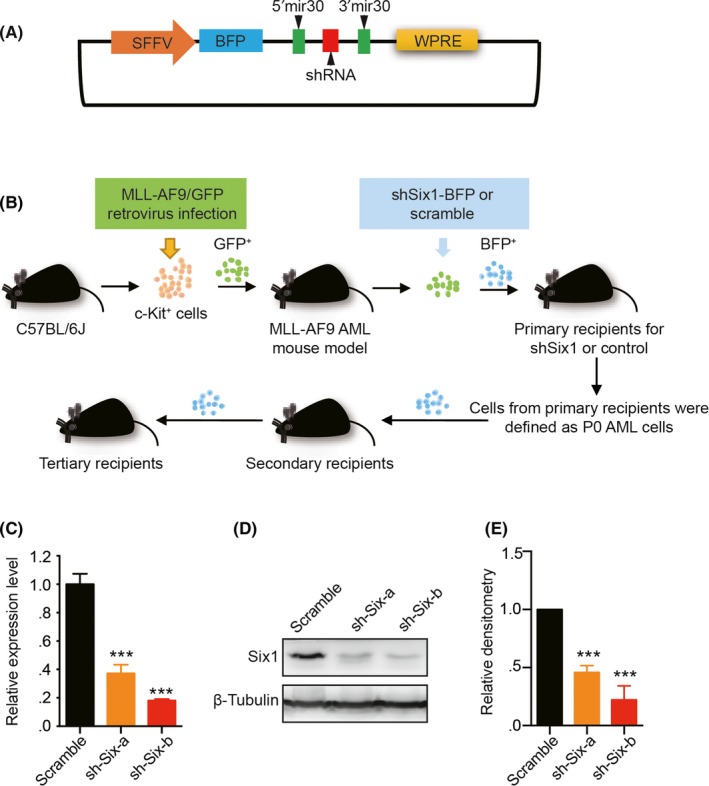
Establishment of the Six1‐knockdown acute myeloid leukemia (AML) murine model. A, Schematic outline of the structure of the vector used for knockdown (KD) Six1. B, Diagram establishing the mixed‐lineage leukemia (MLL) fusion‐induced and Six1‐KD MLL‐AF9 AML mouse models. C, Quantitative RT‐PCR analysis of the KD efficiency of Six1 with 2 different shRNA (sh‐Six‐a and sh‐Six‐b) compared with scramble in GFP+BFP+ bone marrow (BM) cells; n = 3, mean ± SD; one‐way ANOVA; ***P < 0.001. D, Western blot analysis of the GFP+BFP+ cells from the secondary recipient mouse BM. E, Densitometry of the amount of Six1 in panel D (normalized to β‐tubulin, quantified by ImageJ). n = 3, mean ± SD; one‐way ANOVA; ***P < 0.001
3.3. Knockdown of Six1 prolongs leukemia mouse survival and reduces their leukemia cell burden
Leukemia is characterized by the increased cellularity of peripheral white blood cells (WBC), mild anemia and thrombocytopenia. We observed a notable decrease in WBC in Six1‐KD groups compared with that in controls (Figure 3A). In addition, we noticed a slightly elevated number of red blood cells (RBC) (Figure 3B) and platelets (PLT) (Figure 3C) in Six1‐KD groups than that in controls. These peripheral parameters suggest the relief of the leukemia cell burden in Six1‐KD mice. Consistent with these findings, the survival of AML mice transplanted with 2 × 10⁴ primary GFP+BFP+ Six1‐KD cells was significantly longer than that of AML mice transplanted with control cells (Figure 3D). In addition, we characterized the phenotypical and pathological features of AML mice with Six1‐KD. Compared with the controls, the Six1‐KD AML recipients had smaller spleens (SP), decreased SP weights and cellularity (Figure 3E‐G) but similar BM cellularity (Figure 3H). Similar BM cellularity between Six1‐KD AML recipients and control mice was probably due to the fixed volume of the BM cavity that limits the expansion of AML blast cells. Morphology analyses of BM AML blasts revealed that Six1‐KD AML cells had more segmented and less condensed nuclei (Figure 3I), suggesting increased differentiation of AML cells in Six1‐KD leukemia mice. Furthermore, histology analysis of the brain, lung, liver and kidney isolated from leukemia mice showed less leukemia blast infiltration in Six1‐KD groups (Figure S1). Taken together, we conclude that the knockdown of Six1 suppressed leukemia progression and prolonged AML mouse survival with reduced leukemia blast cell burden.
Figure 3.
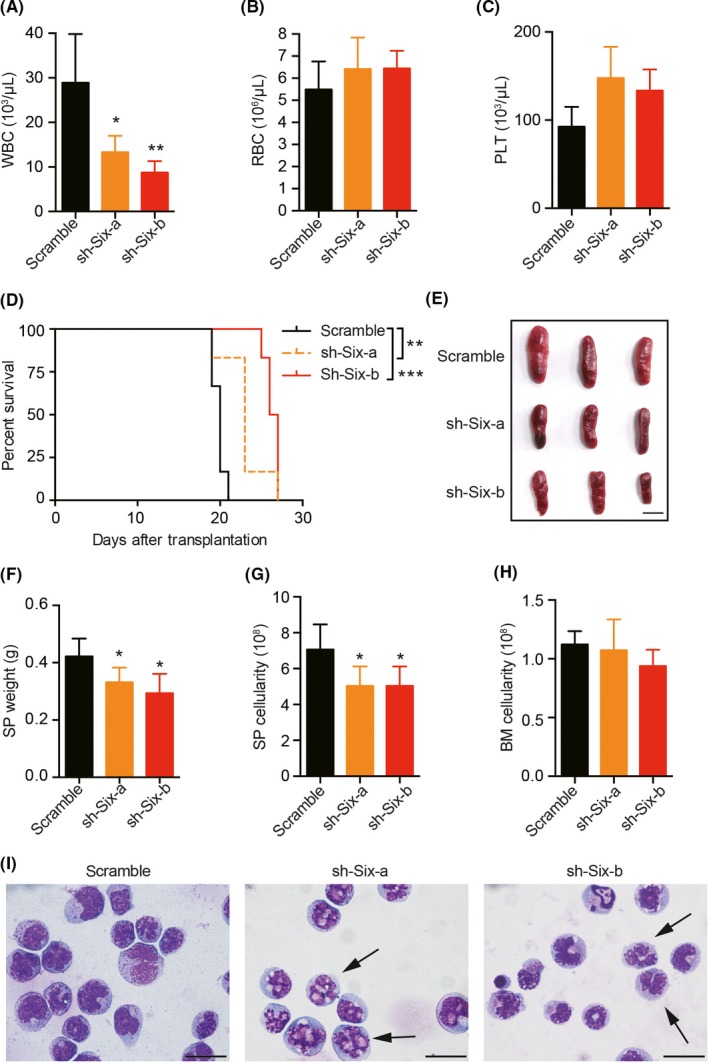
Prolonged survival and reduced leukemic cell burden in Six1‐KD mice. A‐C, Peripheral blood (PB) count analysis of moribund secondary recipient mice transplanted with primary Six1‐KD acute myeloid leukemia (AML) cells or controls; A, white blood cells (WBC); B, red blood cells (RBC); C, platelets (PLT); n = 6, mean ± SD; one‐way ANOVA; *P < 0.05; **P < 0.01. D, Kaplan‐Meier survival curve of the secondary recipient mice (2 × 10⁴ GFP+BFP+ primary leukemic cells per group). The median survival was 20 d of control, 23 d of sh‐Six‐a groups and 26.5 d of sh‐Six‐b groups, respectively; n = 6, Mantel‐Cox test; **P < 0.01; ***P < 0.001. E, Representative image of spleens from secondary recipient mice. Scale bar = 1 cm. F, Spleen (SP) weight of secondary recipient mice. G, Spleen cellularity from secondary recipients. H, Bone marrow (BM) cellularity from secondary recipients. For panels F‐H, n = 6, mean ± SD; one‐way ANOVA, *P < 0.05. I, Wright‐Giemsa staining of the cytospin of BM cells from secondary recipients. Arrowheads show segmented nuclei in AML cells; Scale bar = 20 μm. n = 6, 2 independent experiments for Figure 3
3.4. Six1 knockdown decreases the frequency and absolute number of leukemia stem cells
Leukemia stem cells were responsible for leukemia initiation and leukemia maintenance. The high expression level of Six1 in LSC suggests the potential role of Six1 in regulating LSC. Therefore, we first analyzed the frequency of c‐Kit+ cells (enriched with LSC) in secondary recipient mice. As expected, a significantly lower level of LSC frequency and absolute number in BM with Six1‐KD mice were observed compared with control mice (Figure 4A,B). When another set of well‐established cell surface markers, L‐GMP (Lin−c‐Kit+IL‐7R−Sca‐1−CD16/32+CD34+), was employed, a similar trend was observed in BM and SP (Figure 4C‐F and Figure S2). In addition, we assessed the function of LSC using the colony‐forming unit assay and observed a slight reduction in the total number of colonies in the sh‐Six1‐b group, indicating a lower number of LSC in Six1‐KD groups (Figure 4G). Furthermore, according to the colony classification described earlier by Lavau et al40 and Johnson et al,41 fewer type A (consisted of immature myeloid cells) but more type B colonies (also containing differentiated cells) were observed in the Six1‐KD groups (Figure 4G). In addition, limiting dilution assays showed approximately fourfold decrease of functional LSC numbers in Six1‐KD AML cells from secondary recipients as observed 1 in 178 (±SEM 1/400‐1/79.8) in scramble AML cells in comparison with 1 in 678 (±SEM 1/1594‐1/386) and 1 in 784 (±SEM 1/1357‐1/339) in Six1‐KD AML cells (Figure 4H,I). These data confirmed that knockdown of Six1 in AML cells reduces the frequency of functional LSC.
Figure 4.
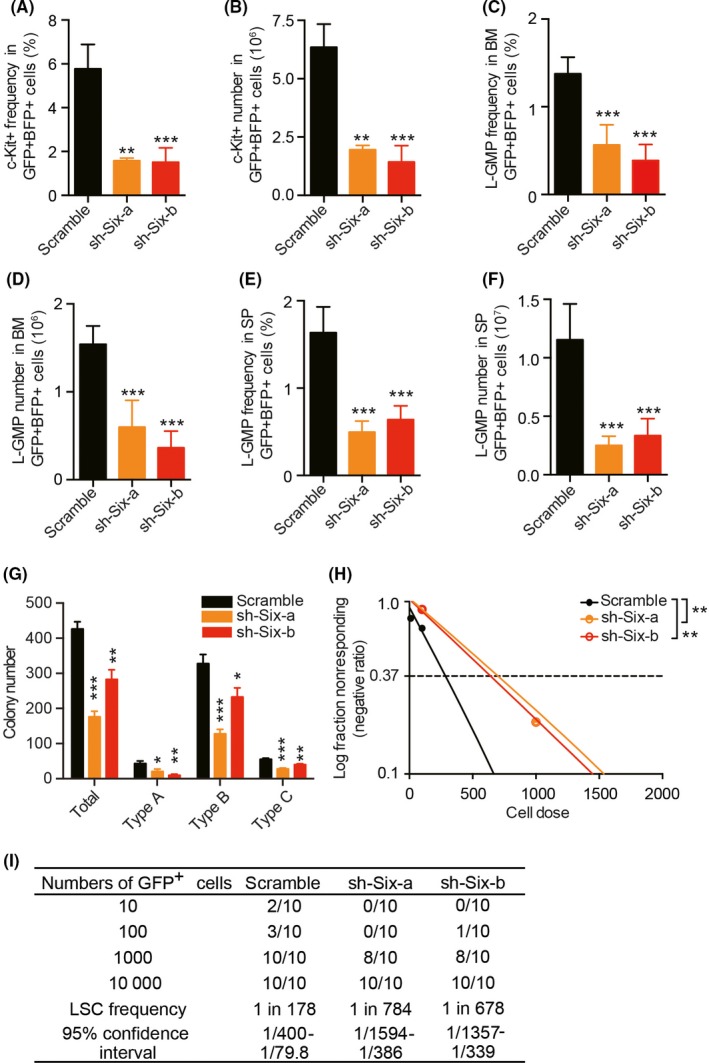
Decreased frequency and absolute number of leukemic stem cells (LSC) in Six1‐KD mice. A and B, c‐Kit+ frequency (A) and absolute number (B) among GFP+BFP+ bone marrow (BM) leukemic cells. C and D, L‐GMP (Lin−IL‐7R−Sca‐1−c‐Kit+CD16/32+CD34+) frequency (C) and absolute number (D) among GFP+BFP+ BM leukemic cells. E and F, L‐GMP frequency (E) and absolute number (F) among GFP+BFP+ SP leukemic cells. For A‐D, the leukemic cells were collected from the femur, tibia and ilium, and live cells were counted with trypan blue exclusion; For A‐F, n = 5, 2 independent experiments; mean ± SD; one‐way ANOVA, **P < 0.01; ***P < 0.001. G, Colony‐forming assay of leukemic BM cells. In total, 500 live cells were plated per well in a 24‐well plate. n = 4, mean ± SD; one‐way ANOVA, *P < 0.05; **P < 0.01; ***P < 0.001. H and I, Limiting dilution assay analyzing the frequency of functional leukemia stem cells (LSC) in Six1‐KD and scramble groups. Logarithmic plot showing the percentage of negative recipients transplanted with different cell doses of GFP+ BM cells isolated from secondary recipients. Frequencies of LSC were evaluated on the website http://bioinf.wehi.edu.au/software/elda/
3.5. Six1‐KD increases cell apoptosis and changes the glycolytic gene expression
To further explore the underlying cellular mechanisms that might contribute to there being fewer LSC, we analyzed the apoptosis ratio and cell cycle of LSC in Six1‐KD and control groups. As shown in Figure 5A‐C, the LSC showed both increased early apoptosis and late apoptosis in the Six1 KD groups compared with that in the control group. Consistently, a higher protein level of activated Caspase 3 (cleaved Caspase 3) was observed in Six1‐KD cells (Figure 5D). In addition, we found that G0, G1 and S/G2/M phases with Ki67 and Hoechst staining were similar between the Six1‐KD and control groups (Figure S3A,B). Although increased expression of p21, a key suppressor of the cell cycle,42 and decreased expression of Ccnd1, a classic Six1 target,43, 44 were observed, most of the cell cycle regulators examined remained unaltered between the Six1‐KD and control groups (Figure S3C). In addition, the expression of classic targets of MLL‐AF9, such as Hoxa9, Hoxa10 and Meis1, remained unchanged (Figure 5E).
Figure 5.
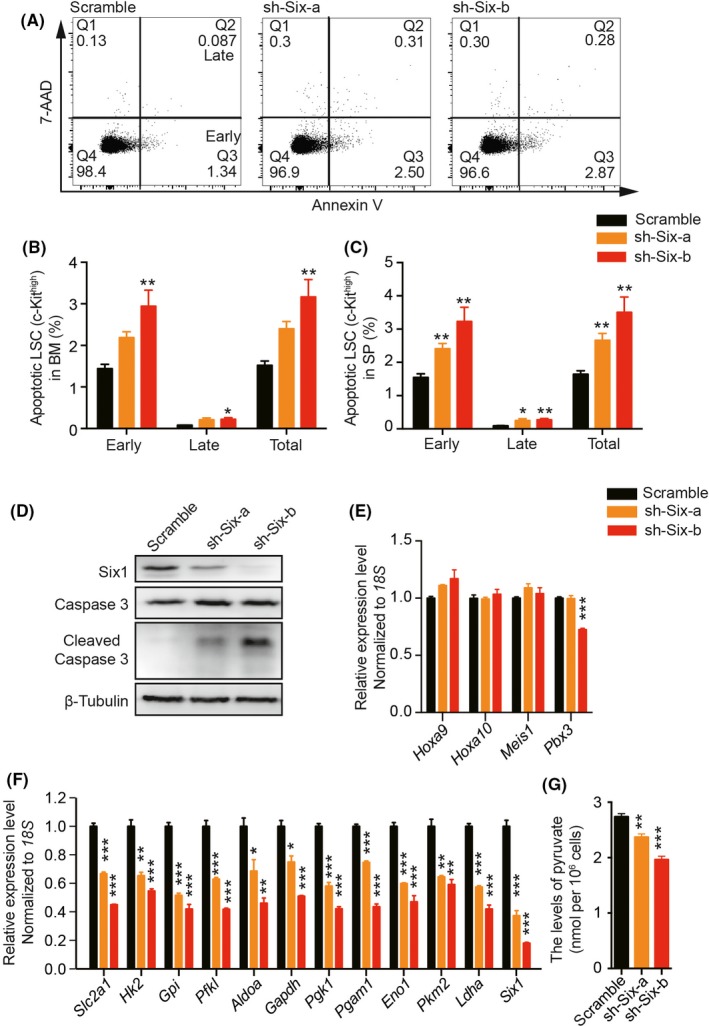
Increased apoptosis and altered glycolytic gene expression of leukemic stem cells (LSC) in Six1‐KD mice. A, Representative flow cytometric gating of the apoptosis of c‐Kithigh leukemic cells. B and C, Quantification of apoptotic c‐Kithigh bone marrow (BM) (B) or spleen (SP) (C) leukemic cells, and Annexin V+7‐AAD− represents early apoptosis, while Annexin V+7‐AAD+ represents late apoptosis; n = 5, mean ± SD; one‐way ANOVA, *P < 0.05; **P < 0.01; ***P < 0.001. D, Western blot analysis of the Caspase 3 and cleaved Caspase 3 level in the BM cells from Six1‐KD and control cells; n = 3. E, Quantitative RT‐PCR of classic genes involved in leukemia initiation and/or maintenance. F, Quantitative RT‐PCR analysis of glycolytic genes and Six1. G, Cellular level of pyruvate in Six1‐KD and control cells. For panels E‐G, n = 3, one‐way ANOVA, *P < 0.05; **P < 0.01; ***P < 0.001
Because recent reports showed that Six1 functions as a key upstream regulator of glycolysis, and thus regulates solid tumor survival,44 we next analyzed the expression of glycolytic genes in Six1‐KD AML cells. Consistent with their findings, we also detected a reduction in the expression of glycolytic genes (Figure 5F) as well as a decrease in cellular levels of pyruvate and lactate in Six1‐KD AML cells (Figure 5G and Figure S4A). However, the cellular level of ATP was similar between scramble and Six1‐KD groups (Figure S4B). Taken together, these data suggest that Six1 maintains the number of functional LSC by anti–apoptosis and blockage of differentiation, possibly mediated by regulating glycolysis.
4. DISCUSSION
In this study, we characterized the biological role of Six1 in regulating AML progression in vivo. Homeodomain‐containing transcription factor Six1 was reported to be expressed in various tissues throughout embryogenesis.21 Moreover, Six1 is overexpressed in various solid tumors, such as cervical cancer,31, 45 hepatocellular carcinoma28, 44 and Wilms tumors.46, 47 We also observed the highly increased expression of Six1 in AML patients, especially in MLL‐rearranged AML. Taken together, these studies suggest an oncogenic role of Six1 in various cancers. In addition, SIX1 was reported to be correlated with a poor prognosis in several cancers. Here, we found that high expression of SIX1 predicts a poor prognosis in AML patients, implicating an independent role of SIX1 as a biomarker for poor outcome prediction.
To further explore the role of Six1 in leukemia progression, we established a Six1‐knockdown AML murine model. We observed a significantly prolonged survival of leukemia mice with Six1 KD. Compared with control mice, Six1‐KD leukemia mice showed reduced numbers of peripheral white blood cells, mild relief of anemia and thrombocytopenia, and less tissue infiltration, accompanied with more differentiated leukemia blast cells in BM, suggesting an overall reduction of the leukemia cell burden.
As has been shown previously, leukemia initiation and maintenance were driven by LSC. The existence of LSC is also responsible for the relapse and drug resistance. In consideration of this, the number and function of LSC in Six1 KD mice were further examined. The frequency and cellularity of both c‐Kit+ and L‐GMP cells were both decreased with Six1 KD compared with those of controls. Moreover, Six1 KD significantly reduced the overall number of type A colonies in colony‐forming unit assays that were used to estimate the myeloid clonogenic ability of LSC.40, 41 In addition, our limiting dilution assay confirmed that the frequency of functional LSC were significantly reduced by approximately fourfold with Six1‐KD. These data demonstrated that Six1 regulates leukemia progression through maintenance of the frequency of functional LSC.
Further investigation of the mechanism of reduced LSC numbers revealed that both increased LSC apoptosis and induction of differentiation may contribute to the phenotypes in the Six1‐KD mouse model. However, it is difficult to discern which of the 2 biological changes has a more significant role in repressing LSC, and further mechanistic studies are required to answer this question. Cell cycle regulation had no obvious contribution in regulating LSC numbers. The G1/S phase depends on cyclin D1 and cyclin E and is negatively regulated by the cyclin‐dependent kinase inhibitor p21, which is associated with cell cycle arrest in the G1 phase.42, 48 Although the expression of Ccnd1, a classic target of Six1, is downregulated, and the cell cycle blocker p21 is upregulated in Six1 KD mice, the cell cycle was similar between control and Six1 KD groups. This might be due to the slight increase of Ccne1, which could promote the G1 to S phase transition.
Aberrant glucose metabolism has now been widely accepted as a hallmark of cancer, as characterized by the high level of glycolysis even in the presence of abundant oxygen.49 In addition to the transcription factor hypoxia‐inducible factor 1 α (HIF‐1α)50, 51, 52 and oncogenic factor c‐Myc,53, 54, 55, 56 Six1 is a newly characterized transcription factor that regulates glycolysis in solid tumors.44 It was shown that SIX1 directly binds to the promoter region of most glycolytic genes and increases the expression of these genes in solid tumors, thus promoting glycolysis and tumor growth in vitro and in vivo.44 Increased glycolysis is overall observed in multiple hematological malignancies,57 including AML,58 ALL,59 CLL60 and multiple myeloma.61 In AML, highly glycolytic AML blasts were more resistant to apoptosis induced by chemotherapeutic drugs ARTA (all‐trans‐retinoic acid) and/or ATO (arsenic trioxide) in vitro, suggesting potential resistance to induction chemotherapy.58 Deletion of either pyruvate kinase isoform (PKM2) or lactate dehydrogenase A (LDHA), both of which catalyzed the final steps in glycolysis, could significantly attenuate the initiation and maintenance of murine CML and AML.62 In our study, we found that Six1 also plays a role in regulating glycolysis in AML. We observed significant changes in the glycolytic gene expression and decreased cellular levels of pyruvate and lactate in Six1‐KD AML mice. However, to our surprise, the ATP level between scramble and Six1‐KD cells was similar, suggesting that ATP production might be compensated by oxidative phosphorylation in Six1‐KD AML cells.63 These observations indicate that Six1 may provide a carbon source for leukemia cells through aerobic glycolysis. However, further investigation is needed for Six1 in glycolysis in relation to leukemia progression.
Taken together, Six1 is not only differentially expressed during normal hematopoiesis or leukemogenesis but is also a key transcription factor that regulates LSC pools and the expression of glycolytic genes. Thus, it may be a good choice as a therapeutic target in AML treatment.
DISCLOSURE
All authors declare no conflict of interest.
Supporting information
ACKNOWLEDGMENTS
We thank Dr Xing Chen for proofreading the manuscript.
Chu Y, Chen Y, Li M, et al. Six1 regulates leukemia stem cell maintenance in acute myeloid leukemia. Cancer Sci. 2019;110:2200–2210. 10.1111/cas.14033
Yajing Chu, Yangpeng Chen, and Mengke Li contributed equally to this work.
Contributor Information
Jun Shi, Email: shijun@ihcams.ac.cn.
Weiping Yuan, Email: wpyuan@ihcams.ac.cn.
REFERENCES
- 1. Testa U. Leukemia stem cells. Ann Hematol. 2011;90:245‐271. [DOI] [PubMed] [Google Scholar]
- 2. Cancer Genome Atlas Research N , Ley TJ, Miller C, et al. Genomic and epigenomic landscapes of adult de novo acute myeloid leukemia. N Engl J Med. 2013;368:2059‐2074. [DOI] [PMC free article] [PubMed] [Google Scholar]
- 3. Miller CA, Wilson RK, Ley TJ. Genomic landscapes and clonality of de novo AML. N Engl J Med. 2013;369:1473. [DOI] [PMC free article] [PubMed] [Google Scholar]
- 4. Marschalek R. MLL leukemia and future treatment strategies. Arch Pharm (Weinheim). 2015;348:221‐228. [DOI] [PubMed] [Google Scholar]
- 5. Harper DP, Aplan PD. Chromosomal rearrangements leading to MLL gene fusions: clinical and biological aspects. Cancer Res. 2008;68:10024‐10027. [DOI] [PMC free article] [PubMed] [Google Scholar]
- 6. Meyer C, Hofmann J, Burmeister T, et al. The MLL recombinome of acute leukemias in 2013. Leukemia. 2013;27:2165‐2176. [DOI] [PMC free article] [PubMed] [Google Scholar]
- 7. Krivtsov AV, Armstrong SA. MLL translocations, histone modifications and leukaemia stem‐cell development. Nat Rev Cancer. 2007;7:823‐833. [DOI] [PubMed] [Google Scholar]
- 8. Meyer C, Kowarz E, Hofmann J, et al. New insights to the MLL recombinome of acute leukemias. Leukemia. 2009;23:1490‐1499. [DOI] [PubMed] [Google Scholar]
- 9. Dohner H, Estey E, Grimwade D, et al. Diagnosis and management of AML in adults: 2017 ELN recommendations from an international expert panel. Blood. 2017;129:424‐447. [DOI] [PMC free article] [PubMed] [Google Scholar]
- 10. Tsai CT, So CW. Epigenetic therapies by targeting aberrant histone methylome in AML: molecular mechanisms, current preclinical and clinical development. Oncogene. 2017;36:1753‐1759. [DOI] [PMC free article] [PubMed] [Google Scholar]
- 11. Bitoun E, Oliver PL, Davies KE. The mixed‐lineage leukemia fusion partner AF4 stimulates RNA polymerase II transcriptional elongation and mediates coordinated chromatin remodeling. Hum Mol Genet. 2007;16:92‐106. [DOI] [PubMed] [Google Scholar]
- 12. Mueller D, Bach C, Zeisig D, et al. A role for the MLL fusion partner ENL in transcriptional elongation and chromatin modification. Blood. 2007;110:4445‐4454. [DOI] [PMC free article] [PubMed] [Google Scholar]
- 13. Zhang W, Xia X, Reisenauer MR, Hemenway CS, Kone BC. Dot1a‐AF9 complex mediates histone H3 Lys‐79 hypermethylation and repression of ENaCalpha in an aldosterone‐sensitive manner. J Biol Chem. 2006;281:18059‐18068. [DOI] [PMC free article] [PubMed] [Google Scholar]
- 14. Deshpande AJ, Deshpande A, Sinha AU, et al. AF10 regulates progressive H3K79 methylation and HOX gene expression in diverse AML subtypes. Cancer Cell. 2014;26:896‐908. [DOI] [PMC free article] [PubMed] [Google Scholar]
- 15. Krivtsov AV, Twomey D, Feng Z, et al. Transformation from committed progenitor to leukaemia stem cell initiated by MLL‐AF9. Nature. 2006;442:818‐822. [DOI] [PubMed] [Google Scholar]
- 16. Wang Y, Krivtsov AV, Sinha AU, et al. The Wnt/beta‐catenin pathway is required for the development of leukemia stem cells in AML. Science. 2010;327:1650‐1653. [DOI] [PMC free article] [PubMed] [Google Scholar]
- 17. Li Z, Zhang Z, Li Y, et al. PBX3 is an important cofactor of HOXA9 in leukemogenesis. Blood. 2013;121:1422‐1431. [DOI] [PMC free article] [PubMed] [Google Scholar]
- 18. Li Z, Chen P, Su R, et al. PBX3 and MEIS1 cooperate in hematopoietic cells to drive acute myeloid leukemias characterized by a core transcriptome of the MLL‐rearranged disease. Cancer Res. 2016;76:619‐629. [DOI] [PMC free article] [PubMed] [Google Scholar]
- 19. Garcia‐Cuellar MP, Steger J, Fuller E, Hetzner K, Slany RK. Pbx3 and Meis1 cooperate through multiple mechanisms to support Hox‐induced murine leukemia. Haematologica. 2015;100:905‐913. [DOI] [PMC free article] [PubMed] [Google Scholar]
- 20. Kawakami K, Sato S, Ozaki H, Ikeda K. Six family genes–structure and function as transcription factors and their roles in development. BioEssays. 2000;22:616‐626. [DOI] [PubMed] [Google Scholar]
- 21. Wu W, Ren Z, Li P, et al. Six1: a critical transcription factor in tumorigenesis. Int J Cancer. 2015;136:1245‐1253. [DOI] [PubMed] [Google Scholar]
- 22. Laclef C, Souil E, Demignon J, Maire P. Thymus, kidney and craniofacial abnormalities in Six 1 deficient mice. Mech Dev. 2003;120:669‐679. [DOI] [PubMed] [Google Scholar]
- 23. Xu PX, Zheng W, Huang L, Maire P, Laclef C, Silvius D. Six1 is required for the early organogenesis of mammalian kidney. Development. 2003;130:3085‐3094. [DOI] [PMC free article] [PubMed] [Google Scholar]
- 24. Laclef C, Hamard G, Demignon J, Souil E, Houbron C, Maire P. Altered myogenesis in Six1‐deficient mice. Development. 2003;130:2239‐2252. [DOI] [PubMed] [Google Scholar]
- 25. El‐Hashash AH, Al Alam D, Turcatel G, et al. Six1 transcription factor is critical for coordination of epithelial, mesenchymal and vascular morphogenesis in the mammalian lung. Dev Biol. 2011;353:242‐258. [DOI] [PMC free article] [PubMed] [Google Scholar]
- 26. Blevins MA, Towers CG, Patrick AN, Zhao R, Ford HL. The SIX1‐EYA transcriptional complex as a therapeutic target in cancer. Expert Opin Ther Targets. 2015;19:213‐225. [DOI] [PMC free article] [PubMed] [Google Scholar]
- 27. Liu Y, Han N, Zhou S, et al. The DACH/EYA/SIX gene network and its role in tumor initiation and progression. Int J Cancer. 2016;138:1067‐1075. [DOI] [PubMed] [Google Scholar]
- 28. Ng KT, Lee TK, Cheng Q, et al. Suppression of tumorigenesis and metastasis of hepatocellular carcinoma by shRNA interference targeting on homeoprotein Six1. Int J Cancer. 2010;127:859‐872. [DOI] [PubMed] [Google Scholar]
- 29. Coletta RD, Christensen KL, Micalizzi DS, Jedlicka P, Varella‐Garcia M, Ford HL. Six1 overexpression in mammary cells induces genomic instability and is sufficient for malignant transformation. Cancer Res. 2008;68:2204‐2213. [DOI] [PubMed] [Google Scholar]
- 30. Wang QF, Wu G, Mi S, et al. MLL fusion proteins preferentially regulate a subset of wild‐type MLL target genes in the leukemic genome. Blood. 2011;117:6895‐6905. [DOI] [PMC free article] [PubMed] [Google Scholar]
- 31. Liu D, Li L, Zhang XX, et al. SIX1 promotes tumor lymphangiogenesis by coordinating TGFβ signals that increase expression of VEGF‐C. Cancer Res. 2014;74:5597‐5607. [DOI] [PubMed] [Google Scholar]
- 32. Guo H, Chu Y, Wang L, et al. PBX3 is essential for leukemia stem cell maintenance in MLL‐rearranged leukemia. Int J Cancer. 2017;141:324‐335. [DOI] [PubMed] [Google Scholar]
- 33. Zhu X, He F, Zeng H, et al. Identification of functional cooperative mutations of SETD2 in human acute leukemia. Nat Genet. 2014;46:287‐293. [DOI] [PMC free article] [PubMed] [Google Scholar]
- 34. Balgobind BV, Zwaan CM, Meyer C, et al. NRIP3: a novel translocation partner of MLL detected in a pediatric acute myeloid leukemia with complex chromosome 11 rearrangements. Haematologica. 2009;94:1033. [DOI] [PMC free article] [PubMed] [Google Scholar]
- 35. Chu Y, Gomez Rosso L, Huang P, et al. Liver Med23 ablation improves glucose and lipid metabolism through modulating FOXO1 activity. Cell Res. 2014;24:1250‐1265. [DOI] [PMC free article] [PubMed] [Google Scholar]
- 36. Chu Y, Zhao Z, Sant DW, et al. Tet2 regulates osteoclast differentiation by interacting with Runx1 and maintaining genomic 5‐Hydroxymethylcytosine (5hmC). Genomics Proteomics Bioinformatics. 2018;16:172‐186. [DOI] [PMC free article] [PubMed] [Google Scholar]
- 37. Hu Y, Smyth GK. ELDA: extreme limiting dilution analysis for comparing depleted and enriched populations in stem cell and other assays. J Immunol Methods. 2009;347:70‐78. [DOI] [PubMed] [Google Scholar]
- 38. Bagger FO, Rapin N, Theilgaard‐Monch K, et al. HemaExplorer: a Web server for easy and fast visualization of gene expression in normal and malignant hematopoiesis. Blood. 2012;119:6394‐6395. [DOI] [PubMed] [Google Scholar]
- 39. Mizuno H, Kitada K, Nakai K, Sarai A. PrognoScan: a new database for meta‐analysis of the prognostic value of genes. BMC Med Genomics. 2009;2:18. [DOI] [PMC free article] [PubMed] [Google Scholar]
- 40. Lavau C, Szilvassy SJ, Slany R, Cleary ML. Immortalization and leukemic transformation of a myelomonocytic precursor by retrovirally transduced HRX‐ENL. EMBO J. 1997;16:4226‐4237. [DOI] [PMC free article] [PubMed] [Google Scholar]
- 41. Johnson JJ, Chen W, Hudson W, et al. Prenatal and postnatal myeloid cells demonstrate stepwise progression in the pathogenesis of MLL fusion gene leukemia. Blood. 2003;101:3229‐3235. [DOI] [PubMed] [Google Scholar]
- 42. Abbas T, Dutta A. p21 in cancer: intricate networks and multiple activities. Nat Rev Cancer. 2009;9:400‐414. [DOI] [PMC free article] [PubMed] [Google Scholar]
- 43. Li Z, Tian T, Lv F, et al. Six1 promotes proliferation of pancreatic cancer cells via upregulation of cyclin D1 expression. PLoS ONE. 2013;8:e59203. [DOI] [PMC free article] [PubMed] [Google Scholar]
- 44. Li L, Liang Y, Kang L, et al. Transcriptional regulation of the Warburg effect in cancer by SIX1. Cancer Cell. 2018;33:368‐385 e7. [DOI] [PubMed] [Google Scholar]
- 45. Tan J, Zhang C, Qian J. Expression and significance of Six1 and Ezrin in cervical cancer tissue. Tumour Biol. 2011;32:1241‐1247. [DOI] [PubMed] [Google Scholar]
- 46. Wegert J, Ishaque N, Vardapour R, et al. Mutations in the SIX1/2 pathway and the DROSHA/DGCR46 miRNA microprocessor complex underlie high‐risk blastemal type Wilms tumors. Cancer Cell. 2015;27:298‐311. [DOI] [PubMed] [Google Scholar]
- 47. Walz AL, Ooms A, Gadd S, et al. Recurrent DGCR47, DROSHA, and SIX homeodomain mutations in favorable histology Wilms tumors. Cancer Cell. 2015;27:286‐297. [DOI] [PMC free article] [PubMed] [Google Scholar]
- 48. Chang BD, Watanabe K, Broude EV, et al. Effects of p21Waf1/Cip1/Sdi1 on cellular gene expression: implications for carcinogenesis, senescence, and age‐related diseases. Proc Natl Acad Sci USA. 2000;97:4291‐4296. [DOI] [PMC free article] [PubMed] [Google Scholar]
- 49. Liberti MV, Locasale JW. The Warburg effect: how does it benefit cancer cells? Trends Biochem Sci. 2016;41:211‐218. [DOI] [PMC free article] [PubMed] [Google Scholar]
- 50. Simsek T, Kocabas F, Zheng J, et al. The distinct metabolic profile of hematopoietic stem cells reflects their location in a hypoxic niche. Cell Stem Cell. 2010;7:380‐390. [DOI] [PMC free article] [PubMed] [Google Scholar]
- 51. Takubo K, Goda N, Yamada W, et al. Regulation of the HIF‐1alpha level is essential for hematopoietic stem cells. Cell Stem Cell. 2010;7:391‐402. [DOI] [PubMed] [Google Scholar]
- 52. Semenza GL. HIF‐1 mediates metabolic responses to intratumoral hypoxia and oncogenic mutations. J Clin Invest. 2013;123:3664‐3671. [DOI] [PMC free article] [PubMed] [Google Scholar]
- 53. Miller DM, Thomas SD, Islam A, Muench D, Sedoris K. c‐Myc and cancer metabolism. Clin Cancer Res. 2012;18:5546‐5553. [DOI] [PMC free article] [PubMed] [Google Scholar]
- 54. Shim H, Dolde C, Lewis BC, et al. c‐Myc transactivation of LDH‐A: implications for tumor metabolism and growth. Proc Natl Acad Sci USA. 1997;94:6658‐6663. [DOI] [PMC free article] [PubMed] [Google Scholar]
- 55. Osthus RC, Shim H, Kim S, et al. Deregulation of glucose transporter 1 and glycolytic gene expression by c‐Myc. J Biol Chem. 2000;275:21797‐21800. [DOI] [PubMed] [Google Scholar]
- 56. Kim JW, Gao P, Liu YC, Semenza GL, Dang CV. Hypoxia‐inducible factor 1 and dysregulated c‐Myc cooperatively induce vascular endothelial growth factor and metabolic switches hexokinase 2 and pyruvate dehydrogenase kinase 1. Mol Cell Biol. 2007;27:7381‐7393. [DOI] [PMC free article] [PubMed] [Google Scholar]
- 57. Jiang Y, Nakada D. Cell intrinsic and extrinsic regulation of leukemia cell metabolism. Int J Hematol. 2016;103:607‐616. [DOI] [PMC free article] [PubMed] [Google Scholar]
- 58. Herst PM, Howman RA, Neeson PJ, Berridge MV, Ritchie DS. The level of glycolytic metabolism in acute myeloid leukemia blasts at diagnosis is prognostic for clinical outcome. J Leukoc Biol. 2011;89:51‐55. [DOI] [PubMed] [Google Scholar]
- 59. Boag JM, Beesley AH, Firth MJ, et al. Altered glucose metabolism in childhood pre‐B acute lymphoblastic leukaemia. Leukemia. 2006;20:1731‐1737. [DOI] [PubMed] [Google Scholar]
- 60. Kominsky DJ, Klawitter J, Brown JL, et al. Abnormalities in glucose uptake and metabolism in imatinib‐resistant human BCR‐ABL‐positive cells. Clin Cancer Res. 2009;15:3442‐3450. [DOI] [PubMed] [Google Scholar]
- 61. Maiso P, Huynh D, Moschetta M, et al. Metabolic signature identifies novel targets for drug resistance in multiple myeloma. Cancer Res. 2015;75:2071‐2082. [DOI] [PMC free article] [PubMed] [Google Scholar]
- 62. Wang YH, Israelsen WJ, Lee D, et al. Cell‐state‐specific metabolic dependency in hematopoiesis and leukemogenesis. Cell. 2014;158:1309‐1323. [DOI] [PMC free article] [PubMed] [Google Scholar]
- 63. Shestov AA, Liu X, Ser Z, et al. Quantitative determinants of aerobic glycolysis identify flux through the enzyme GAPDH as a limiting step. Elife. 2014;3:e03342. [DOI] [PMC free article] [PubMed] [Google Scholar]
Associated Data
This section collects any data citations, data availability statements, or supplementary materials included in this article.
Supplementary Materials