Abstract
Using a continuous glucose monitor (CGM) improves glycemic control in patients with type 1 diabetes. The ambulatory glucose profile (AGP) has been recommended as a standard method for reporting CGM data. However, in recently developed automated insulin delivery (AID) systems, a standard format for reporting data has not yet been developed. Instead, reports are specific to each system being used. Currently, the only FDA approved AID system is a hybrid closed-loop insulin pump. In these systems, the patient is still required to announce a meal, respond to alerts, and keep the system in automated insulin delivery. The integrated pump and sensor information provides insights into how the system is performing, and how to make changes to tunable parameters, such as carbohydrate to insulin ratios. The reports also offer a window into human behavior related to performing diabetes tasks, responding to alarms, reasons for exiting HCL, and how glycemic goals are being met. This article reviews the pump and CGM data provided by several of the current closed-loop systems with a focus on systems that are currently approved in the United States (MiniMed™ 670G, Tandem Basal:IQ) and those used by patients using do-it-yourself systems. A step-wise approach to reviewing the nuances of these systems is provided. The comparison may reinforce the importance of the continued need for streamlining a standard report for providers to be able to interpret the CGM data of these systems.
Keywords: type 1 diabetes, continuous glucose monitoring system, closed loop, MiniMed 670G, Tandem Basal IQ, do-it-yourself
The long-term benefits of intensive glycemic control in patients with type 1 diabetes (T1D) have been proven;1-3 however, most patients continue to have suboptimal glycemic control, and do not meet the American Diabetes Association’s recommended goals of a hemoglobin A1C level < 7% for adults and < 7.5% for children.4 Suboptimal glycemic control increases the risk of both short-term complications such as seizures, loss of consciousness or diabetic ketoacidosis, as well as long-term microvascular and macrovascular complications leading to visual loss, renal failure and cardiovascular events.1 One of the main barriers to intensive glycemic management is the increased risk of hypoglycemia which can occur in attempts to lower glucose levels.5-7 Hypoglycemia is particularly a concern overnight.8
HbA1c is a well-established marker to evaluate glycemic outcomes in clinical practice and research settings. HbA1c measurements, however, are affected by ethnicity, red blood cell life span,9 and people can have significant differences in their HbA1c levels with similar mean glucose levels.9-13 HbA1c measurements also do not inform the patient or provider about glucose variability, time spent in hypoglycemia, duration of hypoglycemic events, or the effects changes in basal infusions or meal or correction boluses. To understand these, the patient and clinician require the information provided in an integrated pump and glucose sensor download.
Despite the benefits, CGM technology is significantly underutilized.14 From the clinician’s point of view, the complexity of the data interpretation and the previous lack of standardization in data reporting might be among the limiting factors. The retrospective analysis of data requires prior training of providers, patient education, and details about dosing history (pump downloads), meals, exercise, and illness. In this article we provide a review of CGM data analysis, with a focus on automated insulin delivery (AID) system data interpretation.
Standardization of Glucose Reporting: The Ambulatory Glucose Profile (AGP)
Currently, there is not one standardized way of data presentation, interpretation or comparison between glucose profiles. Reporting measures and reporting format vary between system manufacturers. Guidelines have been developed for reporting measures of glycemic control in closed loop studies.15 Percentage time in range (70-180 mg/dL),16,17 hypoglycemia (<70 mg/dl and <54mg/dl), glycemic variability (coefficient of variation, CV), hyperglycemia (>180 mg/dl and >250 mg/dl), and time blocks for reporting nighttime (midnight to 6AM) and daytime results are among the key metrics for CGM based analysis.18-20 The minimum recommended data collection is 14 days.17 Visualizing metrics is important to highlight day versus night patterns, meal-related glucose excursions, patterns of overtreatment as well as hypo or hyperglycemic trends.21
The ambulatory glucose profile (AGP), developed by the International Diabetes Center, is one standard for CGM data presentation. It has yet to be universally adopted by industry, but the hope is that it becomes a uniform way of reporting both glycemic metrics and providing a graphic modal day.22 AGP includes three sections: statistical summary (patient’s information and glucose exposure), visual display (presents a 14-day modal day), and condensed daily views of glycemic excursions over the 14 days. There is published data on the advantages of using this profile16 (Figure 1S).
Captūr AGP™ statistically and visually represents glycemic exposure, variability, and time in range over a period of time using CGM or meter blood glucose (MBG) data,22 and is designed to provide helpful data that would allow clinicians to evaluate glycemic control—ideally when the patient is also viewing the report. Reporting CGM data in a standardized way, such as the AGP, in conjunction with an HbA1c will optimize clinical care.
Retrospective Analysis of the CGM Data
Retrospective analysis of CGM data by providers and patients provides benefit to clinical decision-making and settings adjustments such as insulin-carb ratios and sensitivity factors.23
Statistical Summary
The initial step is to review the time in range with a goal of 70% of readings between 70-180 mg/dl, and hypoglycemic risk with a goal of less than 4% of readings <70 mg/dl and <1% of readings <54 mg/dl.17 Other important metrics are mean sensor glucose (SG) with a goal of about 154 mg/dl, and the coefficient of variation with a goal of <36%. If the CV is high, or there is a high daily glycemic variability, day-by-day analysis will assist in finding the cause for the variability. Hypoglycemia risk due to high variability needs to be addressed as one of the first adjustments in treatment. If there is a day-by-day inconsistency, lifestyle and patient behaviors need to be discussed, and several causes need to be considered: irregular meal intake, sleep or work schedule, physical activity, late or missed meal boluses, inaccurate insulin dose calculations, illness, eating in restaurants, insulin leakage, or insulin delivery into subcutaneous sites with lipohypertrophy.24,25
Trend Graphs
One should assess a two week overview of glucose trends which are graphed over a 24-hour day, such as the ambulatory glucose profile which provides the median, the 25th and 75th percentiles, and the 10th and 90th percentiles. This provides a good overview of overnight glycemic control, and problem areas for hyper and hypoglycemia, which often can be related to particular meal or snack times.
Next, analyze the daily details. These are ideally provided for a single day with the integration of CGM values, basal insulin delivery (or AID), meal boluses, and correction doses (manually given or given by AID) and MBG values. To be valuable, the daily detail report should have a significantly long time axis (x-axis) so that late meal boluses and missed meal boluses can be easily identified and it is easy to evaluate for the effectiveness of a correction dose.
CGM Interpretation of Automated Insulin Delivery (AID) systems
With the introduction of the Medtronic MiniMed™ 670G in 2017, Medtronic modified CareLink reports including metrics describing AID. In June 2018 the 670G received FDA approval down to age 7,26-28 and in fall 2018 received approval for release in Europe28 and Canada. Tandem’s Basal:IQ predictive low glucose suspend (PLGS) system was also approved by FDA for patients older than six years of age in June 2018.29 Tandem aims for approval of their Control:IQ HCL system in the second half of 2019.
Interpreting CGM reports of pumps with AID offers a few novel challenges that providers should familiarize themselves with. Currently, there are a few commercial data review options: Medtronic’s CareLink and Tandem’s t:connect® Diabetes Management Application. Tidepool supports both Medtronic and Tandem downloads. Glooko and Diasend do not currently support the AID systems. There is also an increasing number of patients using do-it-yourself closed-loop systems.30 Nightscout provides multiple excellent reports for these patients.
Review of AID pump reports should start like CGM review of non-AID systems. A stepwise approach is offered that encompasses the above, with a few steps unique to AID reports. Start with a summary report such as an AGP or dashboard:
– Assess duration of report. 14-day windows are a standard default.
– Assess % sensor use. Large gaps in sensor wear limit the usefulness of the summary statistics
– Assess % time in range (70-180 mg/dl, 3.9-10 mmol/L, goal ≥70%), % <70 mg/dl (3.9 mmol/L, goal ≤4%), % < 54 mg/dl (3.0 mmol/L, goal ≤ 1%)
– Assess mean glucose (mg/dl or mmol/L)
– Assess glucose variability with coefficient of variation (goal < 36%)31
– If available on AID pump reports, assess time in HCL (goal >80%)
– If available on AID pump reports, assess reasons listed for HCL exits
– If available on AID pump reports, assess average basal delivery in HCL vs preset basal rates (units)
– If available on AID pump reports, assess frequency and patterns of basal suspensions
– If available on AID pump reports, assess frequency of correction boluses
- – If available on AID pump reports, assess use of setpoint changes for activity or sleep
- – Medtronic 670G: temp target of 150 mg/dl
- – Tandem X2 with Control:IQ: Exercise or Sleep mode with modified target range
If there is too much hyperglycemia or hypoglycemia, assess the following:
– Is the hyper- or hypoglycemia meal-related or basal-related?
- – Are the root causes of the glucose control modifiable on the pump?
- – The 670G tuning parameters in HCL are limited to Insulin-Carb Ratio and Bolus Speed. The Duration of Insulin Action is adjustable, but only affects calculations for correction doses. Sensitivity Factor and Basal Rates are controlled by the algorithm in HCL.
- – The upcoming Tandem HCL pump with Control:IQ will allow modification of sensitivity factor and basal rates in HCL, but not duration of insulin action
– Is the patient experiencing rebound hyperglycemia? Patients will often need to reduce the amount of carbohydrates consumed to treat hypoglycemia when a hypoglycemic event is preceded by an hour or more of basal suspension. Investigators in the study of the 640G concluded that PLGS works best when subjects allow the algorithm to do the work. Biester et al recommend that patients do not need take oral carbohydrates to prevent hypoglycemia unless the active insulin on board is more than the sum of 2 hours of basal insulin.32 We instruct patients to consume half their standard carb treatment for lows when PLGS (or Basal IQ) is active, and they are <70 mg/dl.
– Are the reasons for users exiting HCL modifiable? Appropriate (but not too closely spaced, ie, more than a half hour apart) sensor calibrations and prolonged hyperglycemia are common reasons for HCL exit with the 670G. Prolonged hyperglycemia often relates to missed or late meal boluses, but may also require more aggressive carbohydrate to insulin ratios.
– Are there obvious missed meal boluses? No AID system is currently fully closed-loop. Thus meal boluses must still be given, ideally 10-15 minutes prior to eating. Patient education is necessary regarding the need for prebolusing for meals, and the algorithm ’s limited ability to compensate for missed meal boluses.
– How often are correction doses being given, and how well are correction doses working? The 670G calculates its own ISF, but it can be user adjusted for periods when the patient is not in Auto Mode.
Next is an overview of reports specific to the systems currently available with notes unique to each.
Interpreting Medtronic CareLink Reports for the MiniMed 670G
Medtronic has updated its CareLink software to allow review of the 670G’s Auto Mode, their name for HCL mode. CareLink Personal (carelink.minimed.com) and CareLink Pro (carelink.medtronic.com) both have options for 670G reports. While the interface for uploading the pump is different on each site, the reports are the same (Figure 2-5S). Table 1 offers a comparison of the different iterations of Medtronic’s CareLink.
Table 1.
A comparison of the different iterations of Medtronic’s CareLink Versus t:connect and Nightscout
| CareLink Personal | CareLink Pro | Tidepool | Carelink Trials | t:connect | Nightscout | |
|---|---|---|---|---|---|---|
| Website | Carelink.minimed.com | Carelink.medtronic.com | Tidepool.org | Trials.minimed.com | tconnect.tandemdiabetes.com | Each patient will have a unique URL:
PATIENTNAME.azurewebsites.net or PATIENTNAME.herokuapp.com |
| Available to public | Yes | No | Yes | Limited | Yes | Yes |
| 670G Compatible | Yes | Yes | Yes | Yes | No | CGM data only, no basal info |
| Daily detail reports | Coming Summer 2019* | Summer 2019* | Yes | Yes | Yes | Yes |
| Java software required | No | No | No | Yes | Yes | No |
| Mac compatible | Yes | Yes | Yes | Only with MacOS 10.11 or older, Safari 10 or older | Yes | Yes |
| Data table report | No | Only as Excel .cvs file | No | Yes | Yes | Yes, “Treatments” tab |
| Infusion set change shown on graph | Yes | Yes | Yes | No | Yes | No |
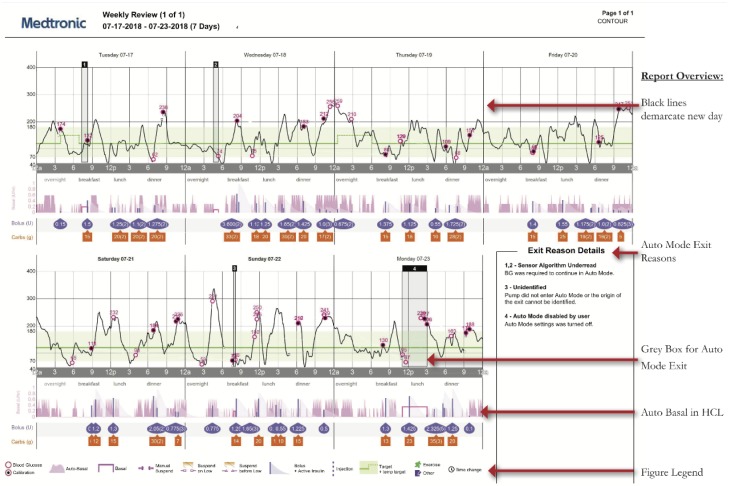
The Weekly Review provides 7 days of graphs with sensor and insulin delivery on an page in landscape format.
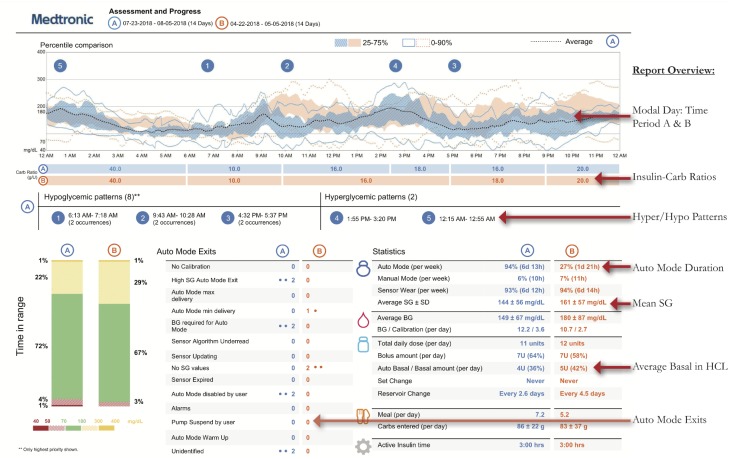
Medtronic created two reports unique to the 670G, the Assessment and Progress Report (Figure 1) and Weekly Review (Figure 2). The Assessment and Progress report provides a modal day with many metrics similar to an AGP. Highlights of this report include:
Figure 1.
Assessment and Progress Report.
Figure 2.
Weekly Review report.
– Time Period Comparisons: Blue and orange tracings represent two different time periods which can be customized. Time in Range bars also compare these periods, which is useful when comparing results before and after start of HCL and the effect of user changes
- – Auto Mode Exits: Provides a list of reasons the patient is exiting Auto Mode, including the frequency of each. Analyzing this list provides topics to counsel patients on how to achieve greater time in HCL, and greater Time in Range with fewer alarms.23
- – Time i-n HCL
- – Mean Sensor Glucose, Glucose SD, Time in Ranges
- – Hyperglycemia and Hypoglycemia Patterns
- – Insulin-Carb Ratio (ICR) by Time of Day
The Weekly Review report (Figure 2) shows seven days compressed onto one page. In practice, this often makes the nuance of AID systems difficult to determine. If possible, we recommend getting daily detail reports. However, the Weekly Review report can be used to visually assess the following:
– Gray shaded boxes represent Auto Mode exits which can be used to determine time of day patterns
– A box in the right corner provides detail on each exit (greater detail is found in Data Table reports)
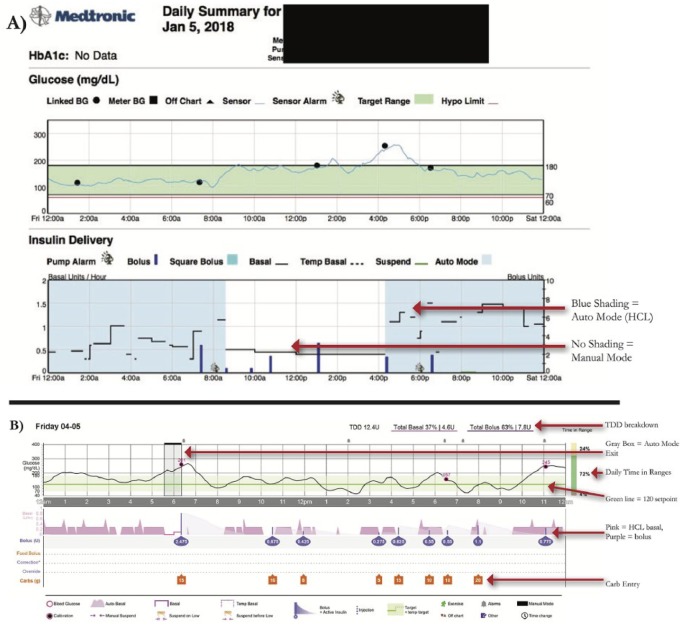
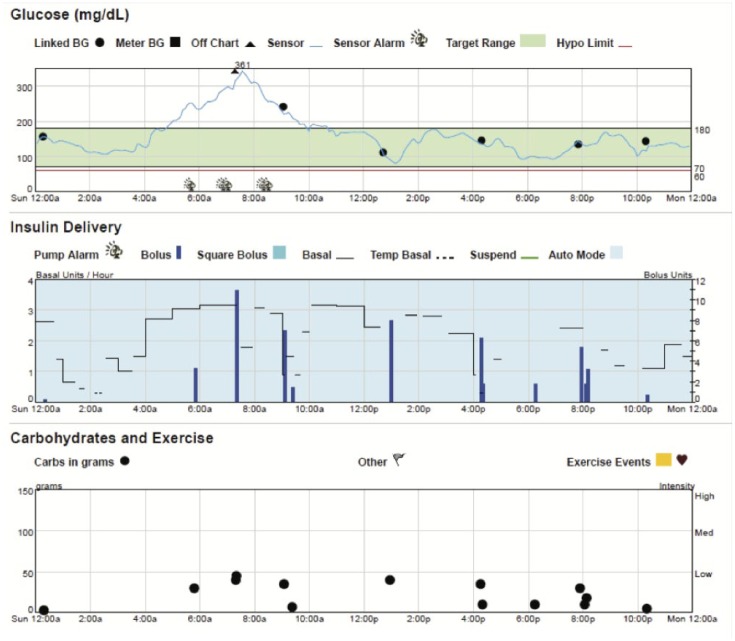
Medtronic also has a Daily Report and Data Table for the 670G, but these were not available across all Carelink versions. As of spring 2019 they are rolling out an updated 670G daily report interface on all Carelink versions. We provide an overview using the existing reports (Figure 3A), and highlight lessons learned for Auto Mode which can also be applied to the updated daily reports (Figure 3B).
Figure 3.
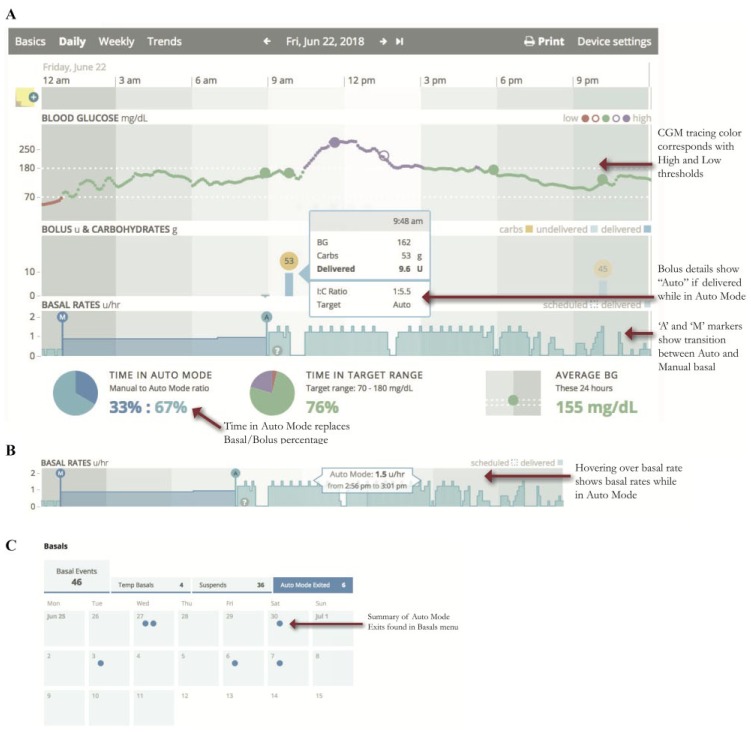
Daily detail graphs with Auto Mode versus Manual Mode. A) Existing Daily report. B) Upcoming Daily report
– Blue shading in the Insulin Delivery charts represents when the patient is in HCL, and there is no shading when patient is in Manual Mode.
– Basal Rate modulation by Auto Mode is depicted by the black line in the Insulin Delivery chart.
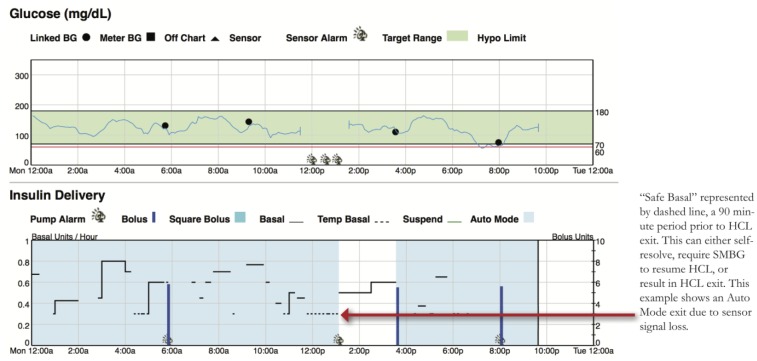
– Dotted basal rate patterns indicate Safe Basal, or the 90 minutes prior to a patient exiting HCL (Figure 4). Safe Basal is determined by insulin delivery requirements while in Auto Mode and may be lower or higher than their preprogrammed basal rates used in manual mode.
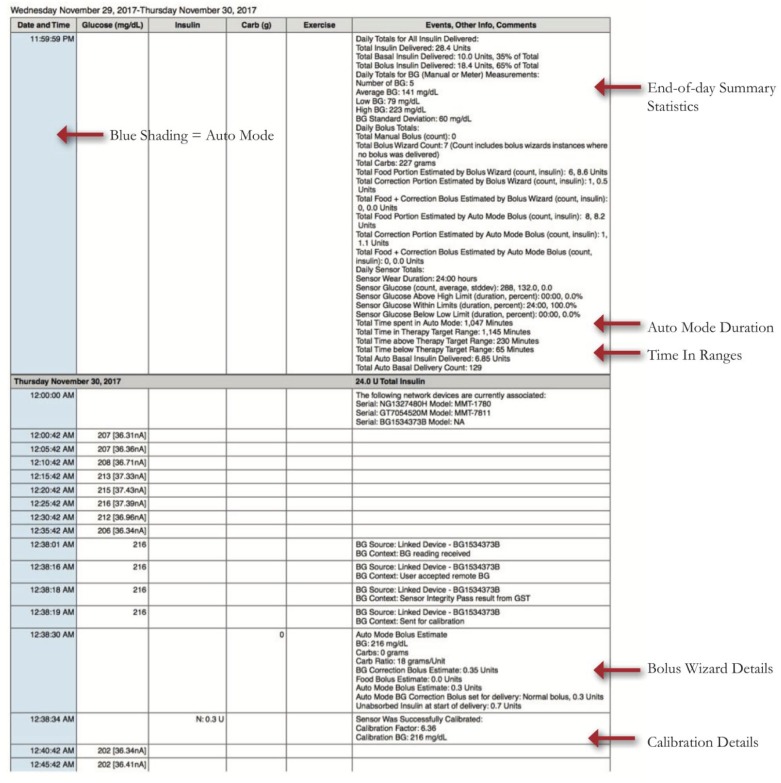
– The Data Table (Figure 5) shows data from every 5-minute step in CGM readings with corresponding alarms and user inputs. Currently, an Excel CSV file can be exported from Carelink which contains the same data. This report contains a lot of detail and is not routinely reviewed during clinic visits. The report contains details that cannot be found elsewhere and can help in analyzing reasons for alarms and reasons for exiting Auto Mode. It also provides calibration errors and total time in Auto Mode per day in minutes rather than as a percentage of readings.
Figure 4.
Safe Basal.
Figure 5.
Data Table with more detail on boluses, Auto Mode exits, and calibrations.
Key Items to Assess When Reviewing 670G Reports:
Auto Mode Duration (percentage and hours/day, goal ≥ 80%)
- Reasons for Auto Mode Exits: Important to analyze to see if settings changes or patient education is warranted:
- High SG Auto Mode Exit (> 250 mg/dl for 3 hours or >300 mg/dl for 1 hour): If consistently postmeal, assess meal dosing patterns (carb counting accuracy, bolus timing, and consider ICR changes)
- Auto Mode Max Delivery (>4 hours of algorithm-defined max basal): Assess for missed or late meal boluses and basal patterns. Instruct patients regarding SMBG>150 mg/dl bolus corrections.
- Auto Mode Minimum Delivery (>2.5 hours of minimum basal): Assess frequency and patterns, if occurring frequently overnight, may indicate residual insulin secretion (partial honeymoon). Also, assess for patterns of hypoglycemia
- Calibration and BG alerts: Advise on good calibration habits. Calibrate when BG stable, at least every 12 hours, ideally 3-4 times a day for greatest accuracy. If calibration not accepted, avoid repeating until sensor asks for new calibration. Calibration issues have been reduced with a firmware update to the Medtronic CGM transmitter, released in early 2019.
Comparing Programmed Basals to HCL Basal Delivery
Providers should make regular assessments of average basal delivery while in HCL (Assessments and Progress; Figure 1), and compare that to the programmed total daily basal. Day-by-day breakdown is found in Daily Detail summaries (Figure 6). Consider whether changes to programmed basals may be necessary. This is especially true for periods of changing insulin requirements, such as puberty.
Figure 6.
Assessing total basal insulin when in HCL and comparing it to preset basal total.
Assessing Sensor Accuracy
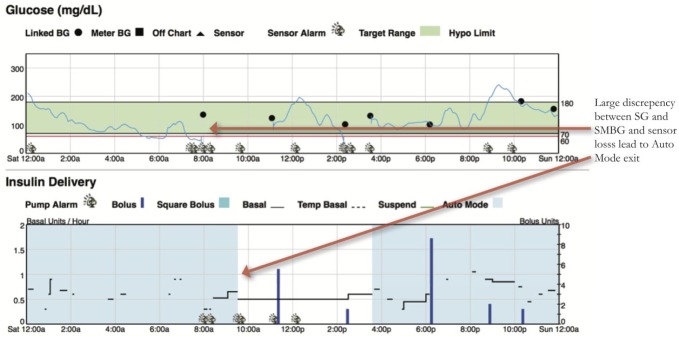
Since the 670G is titrating basal delivery to a target SG of 120 mg/dl, it is important to gauge the discrepancy between SMBGs and SG. Areas of mismatch raise concern for an inaccurate or poorly calibrated sensor. Greater than a 35% discrepancy between SMBG and SG is one criteria for Auto Mode exit. Periods of greater caution include the initial 24 hours of sensor wear, near the end of sensor life (6th-7th day), and periods of compression artifacts on SG33 (Figure 7).
Figure 7.
Be mindful of sensor accuracy when judging success of HCL.
Fake Carbs or Correction?
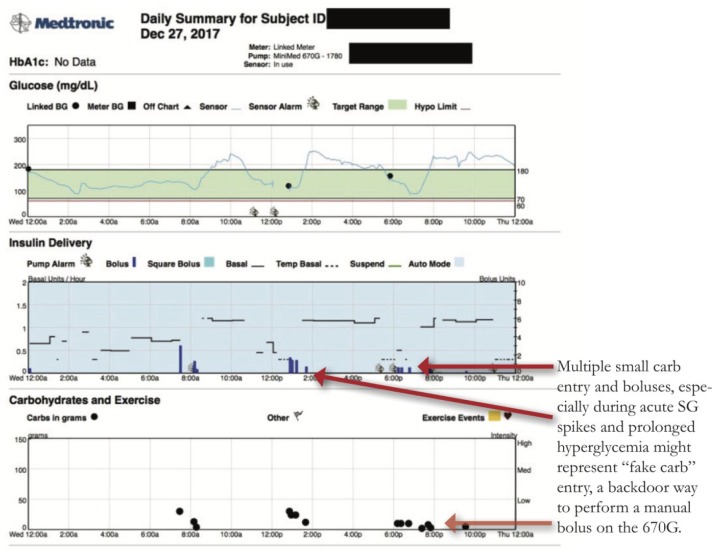
When in Auto Mode, the 670G does not offer the ability to enter a manual bolus. All boluses must coincide with carbohydrate entry or correction for hyperglycemia. In order to recreate the ability to manual bolus and override insulin on board safety constraints, users will sometimes enter a carb amount in the Bolus Wizard that corresponds to a desired unit amount of insulin. Interpreting what is a real food bolus versus a “fake carb” or “ghost carb” bolus requires looking at the timing of the bolus and the prevailing glucose. Examples of fake carbs boluses can be seen in the below examples:
Multiple carb entries post meal bolus, while BG is elevated might be additional boluses to help lower glucose. Inquire whether this was continued snacking or attempts to dose additional insulin. (Figure 8)
Carb entries during sleeping hours.
Figure 8.
Fake Carbs.
Sensor Backfill
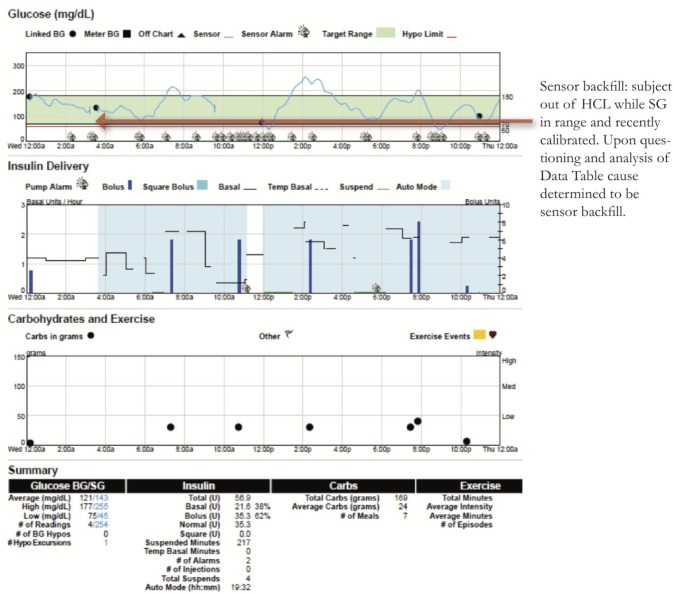
Sensor backfill occurs when the pump is too far from the CGM transmitter’s communication range, and SG data is stored on the transmitter and then filled back on the pump screen when the devices are within range again. When the lack of CGM data causes an Auto Mode exit, this may not be obvious when retrospectively looking at reports because the missing SG data has been backfilled. Figure 9 is an example from midnight to 4 am where the patient has SG in target range and a recent accurate calibration, yet still not in Auto Mode. Discussions with the patient revealed this to be sensor backfill. On CareLink the only way to determine sensor backfill is to use the Data Table or a CSV export, where sensor backfill is listed as a detail.
Figure 9.
Sensor backfill.
When stumped—go back to the basics
Figure 10 shows a patient in Auto Mode (blue shading) with rising SG overnight. Upon questioning, the patient indicated that the infusion set had been ripped out overnight, and replaced. Infusion set replacements are not depicted in CareLink graphs. It’s important to remember that HCL pumping is only as successful as the patency of the infusion set delivering the insulin, and accuracy of the CGM.
Figure 10.
Patients should inspect infusion sets with prolonged SG>300 mg/dl while in HCL.
Interpreting Tandem t:connect® reports for Tandem’s Basal:IQ34,35
Tandem uses the t:connect Uploader software (http://tconnect.tandemdiabetes.com) which allows clinics and patients to upload Tandem pumps, including paired Dexcom CGM and glucose meter data (Figure 3S). t:connect has added a few updates to its reports for Basal:IQ. These changes give a peak at what we will see with the next t:connect update for the release of their hybrid closed-loop system, T:Slim X2 with Control:IQ.
t:connect® has several reports available with modifiable date ranges including:
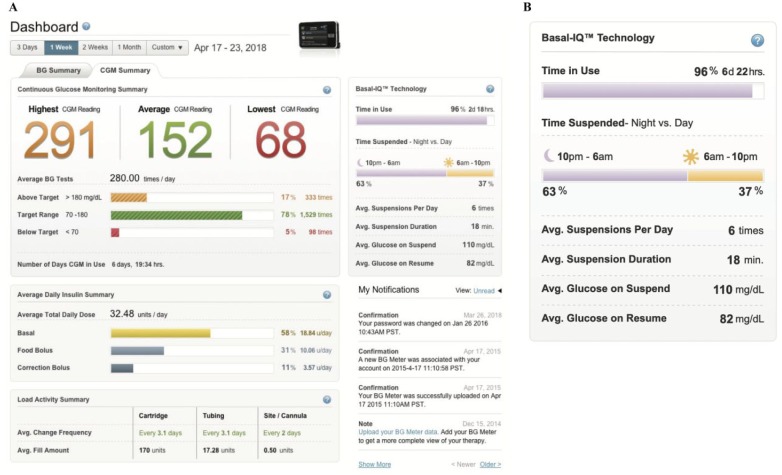
- – Dashboard (Figure 11A)—Snapshot including the highest and lowest blood glucose (BG), averages for both BG and SG readings, daily insulin summary, and a Basal:IQ section which shows (Figure 11B):
- percentage of time Basal:IQ is used
- percentage of time suspensions occur by day versus night
- average duration of suspensions
- average glucose levels before and after suspension.
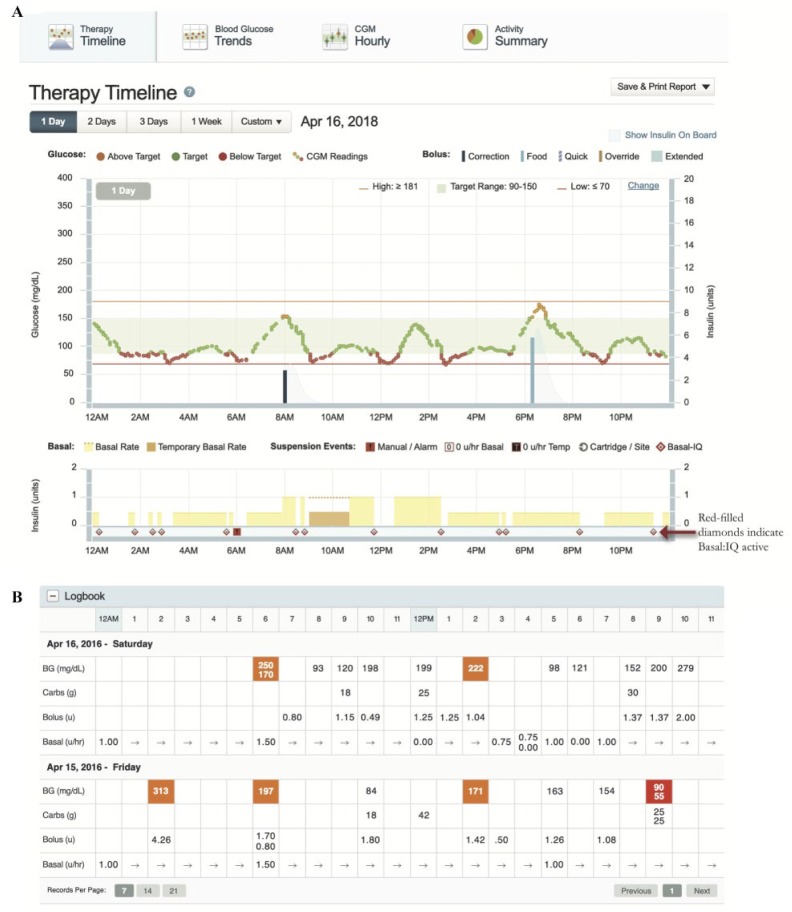
- – Therapy Timeline (Figure 12A)—Tandem’s daily detail report of BG and SG and pump delivery including Basal:IQ suspensions (indicated by a half-red diamond). Use this report to identify patterns of basal suspensions. Pay attention to the legend of this report as different types of basal and bolus details are included. (Figure 12A and B)
- When Control:IQ is released, more detail will be added to this report. This report can be of great utility to identify patterns where the algorithm is intervening and where attention may be needed.
– BG Trends (Figure 13A)—This is a modal day report restricted to BG meter data. Daily view reveals if there is a consistent pattern on specific days (Figure 13B). It has not received any updates for Basal:IQ. If available, we recommend using the CGM Hourly Report.
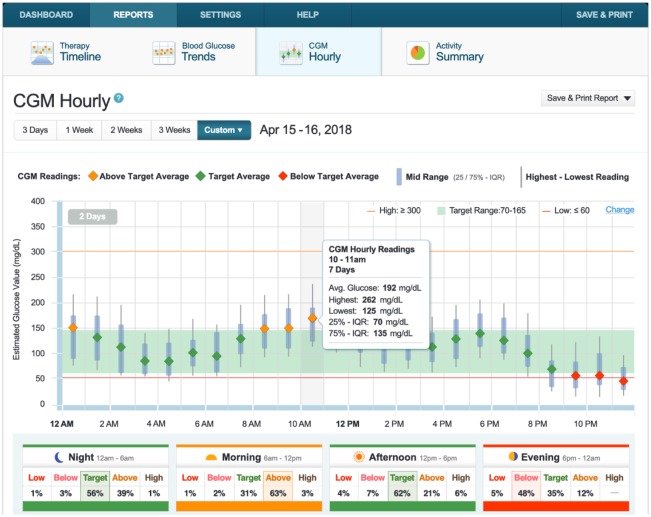
- – CGM Hourly Report (Figure 14A)—Tandem’s version of a CGM modal day report. Hourly summary of CGM with interquartile range. Users can hover over hours to see hourly details. Time of Day Boxes help assess various time segments of a day, broken into Morning, Afternoon, Evening and Night (Figure 14B).
- Logbook: For those who want more detail into Basal:IQ’s PLGS, the Logbook can be found at the bottom of this and other reports. The various basal modulations per hour are shown. A straight arrow in a time block indicates that no adjustment was made to the hourly basal rate . (Figure 12B)
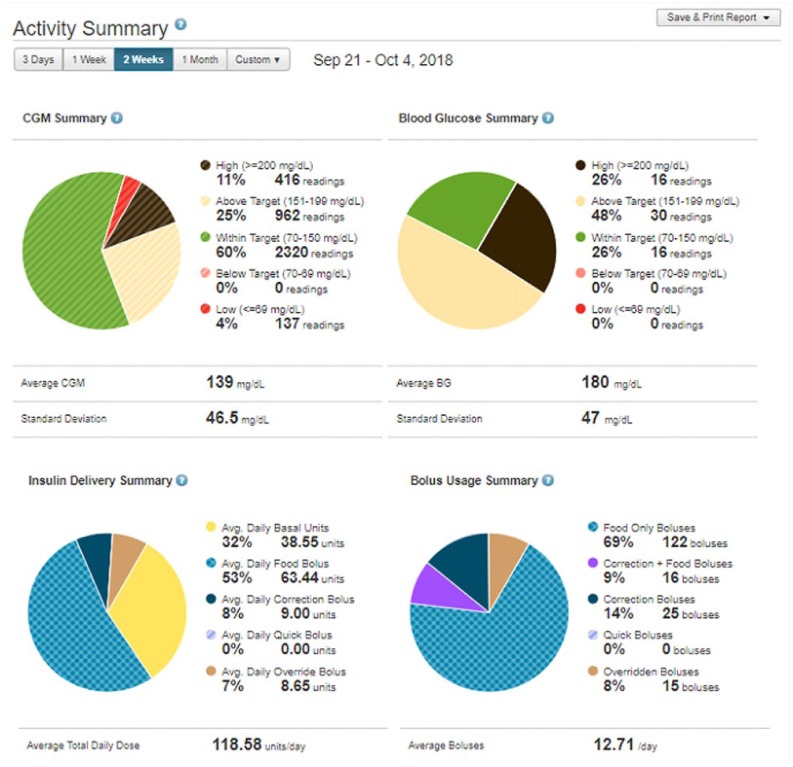
– Activity Summary (Figure 15)—Four pie chart reports provide a breakdown of CGM readings, BG values, insulin delivery, and bolus usage summaries. Reports do not include any Basal:IQ detail.
Figure 11.
The dashboard on t:connect. (A) The dashboard. (B) The Basal:IQ section.
Figure 12.
Therapy Timeline Report. (A) Therapy detail. Types of bolus and basal are displayed as colored bars on this report: Food Bolus (light blue bar), Correction Bolus (dark blue bar), Basal (yellow area), Temporary Basal (orange area). (B) Log Book. Data including date and time, BG, carb amount, and insulin delivery.
Figure 13.
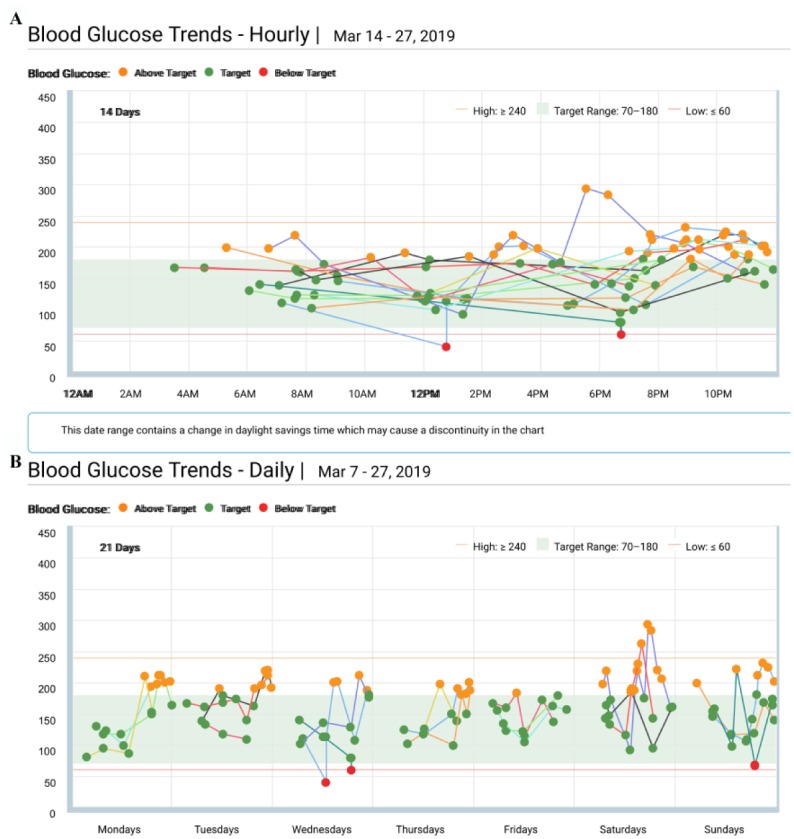
Blood Glucose Trends Report. (A) Hourly View. (B) Daily View.
Figure 14.
CGM Hourly Report and Time of Day Boxes.
Figure 15.
Activity Summary.
With the release of Control:IQ, Tandem intends to update the Dashboard and Therapy Timeline reports. Updates will include:
– Time in HCL
– Time using Exercise or Sleep mode
– Correction boluses in HCL (automated vs manual)
– Basal profile comparisons between preset basal rates and HCL delivery
Tidepool and the 670G and Tandem’s Basal:IQ
Until August 2018, patients using the Medtronic 670G were required to use Medtronic’s CareLink to download data. In August 2018, Tidepool added the ability to download Medtronic 630G, 640G, and 670G pumps with support for Auto Mode and PLGS.36 In October 2018 Tidepool launched support for Tandem’s Basal:IQ data. Tidepool displays the basal suspensions as well as Dexcom data from the t:slim X2 pump.37
Tidepool Benefits include:
– User-friendly interface
– Daily detailed reports
– Mac compatibility
– Share features with clinics
– One interface compatible with multiple pump manufacturers
For clinicians using Tidepool, the addition of closed-loop system compatibility provides a second option with perhaps wider operating system compatibility for patients (Figures 16 and 17).
Figure 16.
Tidepool reports with the 670G in Auto Mode. (A) Daily Detail view. (B) Basal rate delivery interface. (C) Auto Mode exit interface.
Figure 17.
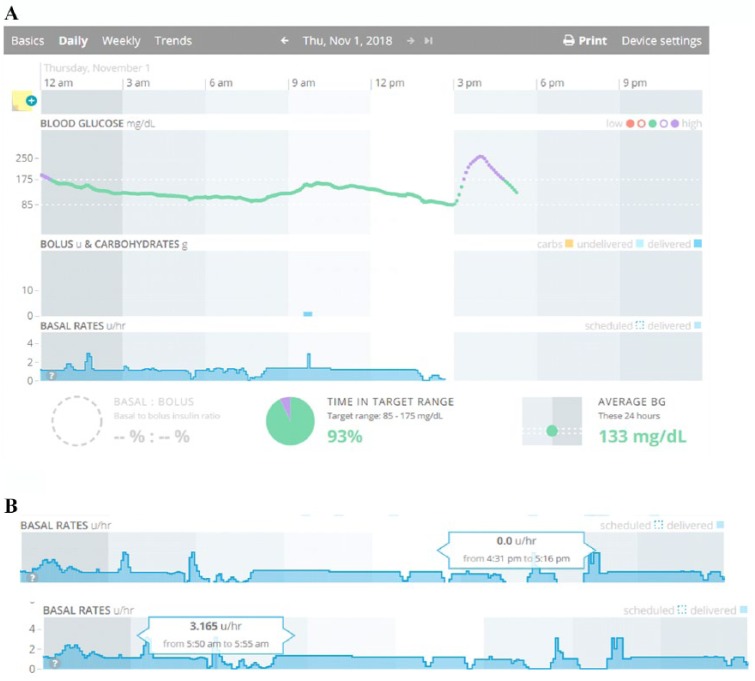
Tidepool reports with the Tandem Basal:IQ. (A) Daily Detail view and time in range. (B) Basal rate delivery interface.
Monitoring the Do-It-Yourself Closed-Loop Community
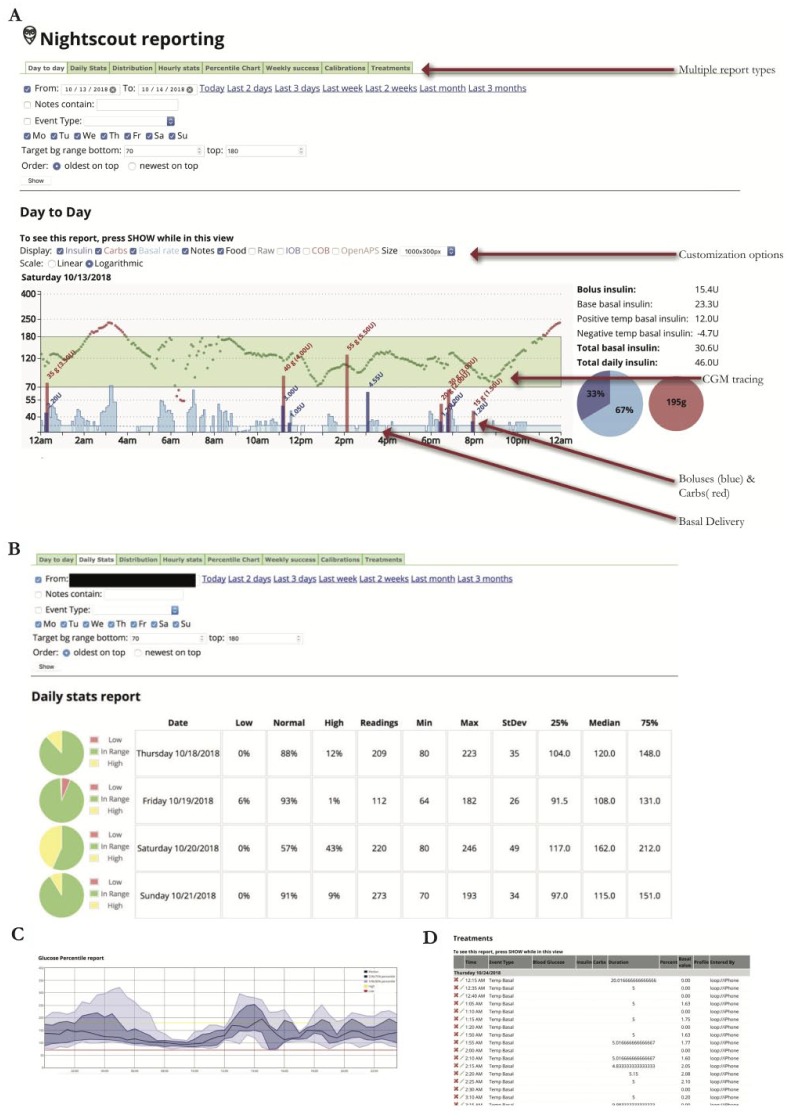
With JDRF announcing its support for Open Protocol Automated Insulin Delivery Devices,38 do-it-yourself (DIY) closed-loop pump users continue to increase in number. Providers may see patients running such systems in their practice. The current systems, OpenAPS39 and Loop40 and AndroidAPS41 use older generation Medtronic Paradigm pumps, Bluetooth-enabled pumps (Dana or Accu-Chek Combo), or Omnipod pumps, and connect them via radio frequency and Bluetooth to an app on a smart phone, which runs an algorithm allowing patients to setup their own home-made AID system if they have the required devices and technical know-how. DIY systems are not currently compatible with CareLink. At time of publication, Tidepool has released a beta version of its mobile app which will organize data from Loop and Apple HealthKit and makes pump and CGM data reviewable on its desktop platform. While there is no commercial support, users have been able to use the Nightscout platform to build websites which act as remote data repositories. Providers with patients using the Nightscout platform with their DIY systems should ask patients to share their Nightscout sites during clinic visits to review reports. The figures show example reports available on Nightscout with the use of Loop (Figure 18A-D).
Figure 18.
Nightscout report for DIY closed-loop pump. (A) Day-to-day report and AID basal (blue) seen in daily report. (B) Daily stats. (C) Percentile chart (modal day). (D) Treatments.
Day to Day: depicts CGM tracing, meal boluses and carb entry, and the variable basal rates with AID
Daily Stats: Time in ranges, and standard deviation
Percentile chart: Modal day with interquartile range
Treatments: Detail of every action sent to the pump, similar to Data Table
Conclusion
This review focuses on the CGM analysis of the first AID systems. Table 1 compares Medtronic’s Carelink with Tidepool, Tandem, t:connect, and Nightscout. A step-by-step method for reviewing AID pump and CGM reports is offered that provides a framework for reviewing reports from different manufacturers. Moving forward, lessons from the current systems can be extrapolated to the review of CGM of future AID pumps. Those include careful comparisons between AID driven basal patterns versus the preprogrammed basal rate, investigating reasons for exiting closed-loop, patterns of automated correction doses or the use of a fake carb bolus in lieu of corrections, and being mindful for sensor-calibration mismatch. As more systems come to market in the future, there is continued need for streamlining of reports between device manufacturers and for providers to be able to interpret reports of these systems.
Supplemental Material
Supplemental material, Supplemental_Figures for A Review of Continuous Glucose Monitoring Data Interpretation in the Age of Automated Insulin Delivery by Laya Ekhlaspour, Ideen Tabatabai and Bruce Buckingham in Journal of Diabetes Science and Technology
Acknowledgments
All the figures are from the downloads of our patients’ devices. Permission to reproduce Figure 1S was obtained from the International Diabetes Center.
Footnotes
Abbreviations: AGP, ambulatory glucose profile; SMBG; Self Monitoring of Blood Glucose; AID, automated insulin delivery; CGM, continuous glucose monitor; HCL, hybrid closed loop; PLGS, predictive low glucose suspend; SG, sensor glucose; MBG, Meter Blood Glucose,.
Declaration of Conflicting Interests: The author(s) declared the following potential conflicts of interest with respect to the research, authorship, and/or publication of this article: LE and IT have none. BB has research support from the NIH (DP3DK104059, DP3DK101055, DK-14-024), Helmsley Foundation, Medtronic Diabetes, Insulet, Dexcom, and Tandem. He is on advisory boards for Convatec, Medtronic, and Tidepool, and has consulted for Tandem. Diabetes.
Funding: The author(s) received no financial support for the research, authorship, and/or publication of this article.
Supplemental Material: Supplemental material for this article is available online.
ORCID iD: Laya Ekhlaspour  https://orcid.org/0000-0002-3263-1419
References
- 1. Diabetes Control and Complications Trial Research Group, Nathan DM, Genuth S, et al. The effect of intensive treatment of diabetes on the development and progression of long-term complications in insulin-dependent diabetes mellitus. N Engl J Med. 1993;329:977-986. [DOI] [PubMed] [Google Scholar]
- 2. Writing Team for the Diabetes Control, Complications Trial/Epidemiology of Diabetes Interventions, Complications Research Group. Effect of intensive therapy on the microvascular complications of type 1 diabetes mellitus. JAMA 2002;287:2563-2569. [DOI] [PMC free article] [PubMed] [Google Scholar]
- 3. Nathan DM, Cleary PA, Backlund JY, et al. Intensive diabetes treatment and cardiovascular disease in patients with type 1 diabetes. N Engl J Med. 2005;353:2643-2653. [DOI] [PMC free article] [PubMed] [Google Scholar]
- 4. Beck RW, Tamborlane WV, Bergenstal RM, et al. The T1D Exchange clinic registry. J Clin Endocrinol Metab. 2012;97:4383-4389. [DOI] [PubMed] [Google Scholar]
- 5. Cryer PE. Hypoglycaemia: the limiting factor in the glycaemic management of type i and type ii diabetes. Diabetologia. 2002;45:937-948. [DOI] [PubMed] [Google Scholar]
- 6. Cryer PE, Davis SN, Shamoon H. Hypoglycemia in diabetes. Diabetes Care. 2003;26:1902-1912. [DOI] [PubMed] [Google Scholar]
- 7. Leese GP, Wang J, Broomhall J, et al. Frequency of severe hypoglycemia requiring emergency treatment in type 1 and type 2 diabetes: a population-based study of health service resource use. Diabetes Care. 2003;26:1176-1180. [DOI] [PubMed] [Google Scholar]
- 8. Barnard KD, Wysocki T, Allen JM, et al. Closing the loop overnight at home setting: psychosocial impact for adolescents with type 1 diabetes and their parents. BMJ Open Diabetes Res Care. 2014;2:e000025. [DOI] [PMC free article] [PubMed] [Google Scholar]
- 9. Beck RW, Connor CG, Mullen DM, Wesley DM, Bergenstal RM. The fallacy of average: how using HbA1c alone to assess glycemic control can be misleading. Diabetes Care. 2017;40:994-999. [DOI] [PMC free article] [PubMed] [Google Scholar]
- 10. Juvenile Diabetes Research Foundation Continuous Glucose Monitoring Study Group, Wilson DM, Xing D, et al. Hemoglobin A1c and mean glucose in patients with type 1 diabetes: analysis of data from the Juvenile Diabetes Research Foundation continuous glucose monitoring randomized trial. Diabetes Care. 2011;34:540-544. [DOI] [PMC free article] [PubMed] [Google Scholar]
- 11. Bergenstal RM, Gal RL, Connor CG, et al. Racial differences in the relationship of glucose concentrations and hemoglobin A1c levels. Ann Intern Med. 2017;167:95-102. [DOI] [PubMed] [Google Scholar]
- 12. Shipman KE, Jawad M, Sullivan KM, Ford C, Gama R. Ethnic/racial determinants of glycemic markers in a UK sample. Acta Diabetol. 2015;52:687-692. [DOI] [PubMed] [Google Scholar]
- 13. Wolffenbuttel BH, Herman WH, Gross JL, Dharmalingam M, Jiang HH, Hardin DS. Ethnic differences in glycemic markers in patients with type 2 diabetes. Diabetes Care. 2013;36:2931-2936. [DOI] [PMC free article] [PubMed] [Google Scholar]
- 14. Wong JC, Foster NC, Maahs DM, et al. Real-time continuous glucose monitoring among participants in the T1D Exchange clinic registry. Diabetes Care. 2014;37:2702-2709. [DOI] [PMC free article] [PubMed] [Google Scholar]
- 15. Maahs DM, Buckingham BA, Castle JR, et al. Outcome measures for artificial pancreas clinical trials: a consensus report. Diabetes Care. 2016;39:1175-1179. [DOI] [PMC free article] [PubMed] [Google Scholar]
- 16. Bergenstal RM, Ahmann AJ, Bailey T, et al. Recommendations for standardizing glucose reporting and analysis to optimize clinical decision making in diabetes: the ambulatory glucose profile (AGP). Diabetes Technol Ther. 2013;15:198-211. [DOI] [PubMed] [Google Scholar]
- 17. Danne T, Nimri R, Battelino T, et al. International consensus on use of continuous glucose monitoring. Diabetes Care. 2017;40:1631-1640. [DOI] [PMC free article] [PubMed] [Google Scholar]
- 18. Rodbard D. Continuous glucose monitoring: a review of successes, challenges, and opportunities. Diabetes Technol Ther. 2016;18(suppl 2):S3-S13. [DOI] [PMC free article] [PubMed] [Google Scholar]
- 19. Rodbard D. Continuous glucose monitoring: a review of recent studies demonstrating improved glycemic outcomes. Diabetes Technol Ther. 2017;19(S3):S25-S37. [DOI] [PMC free article] [PubMed] [Google Scholar]
- 20. Rodbard D. New and improved methods to characterize glycemic variability using continuous glucose monitoring. Diabetes Technol Ther. 2009;11:551-565. [DOI] [PubMed] [Google Scholar]
- 21. Fonseca VA, Grunberger G, Anhalt H, et al. Continuous glucose monitoring: a consensus conference of the American Association of Clinical Endocrinologists and American College of Endocrinology. Endocr Pract. 2016;22:1008-1021. [DOI] [PubMed] [Google Scholar]
- 22. Mazze RS, Strock E, Wesley D, et al. Characterizing glucose exposure for individuals with normal glucose tolerance using continuous glucose monitoring and ambulatory glucose profile analysis. Diabetes Technol Ther. 2008;10:149-159. [DOI] [PubMed] [Google Scholar]
- 23. Messer LH, Forlenza GP, Sherr JL, et al. Optimizing hybrid closed-loop therapy in adolescents and emerging adults using the MiniMed 670G system. Diabetes Care. 2018;41:789-796. [DOI] [PMC free article] [PubMed] [Google Scholar]
- 24. Joubert M, Baillot-Rudoni S, Catargi B, et al. Indication, organization, practical implementation and interpretation guidelines for retrospective CGM recording: A French position statement. Diabetes Metab. 2015;41:498-508. [DOI] [PubMed] [Google Scholar]
- 25. Scheiner G. CGM Retrospective data analysis. Diabetes Technol Ther. 2016;18(suppl 2):S214-S222. [DOI] [PMC free article] [PubMed] [Google Scholar]
- 26. Forlenza GP, Pinhas-Hamiel O, Liljenquist DR, et al. Safety evaluation of the MiniMed 670G system in children 7-13 years of age with type 1 diabetes. Diabetes Technol Ther. 2019;21:11-19. [DOI] [PMC free article] [PubMed] [Google Scholar]
- 27. Wood MA, Shulman DI, Forlenza GP, et al. In-clinic evaluation of the MiniMed 670G system “Suspend Before Low” feature in children with type 1 diabetes. Diabetes Technol Ther. 2018;20:731-737. [DOI] [PubMed] [Google Scholar]
- 28. FDA News Release. Available at: https://www.fda.gov/NewsEvents/Newsroom/PressAnnouncements/ucm611475.htm.
- 29. Forlenza GP, Li Z, Buckingham BA, et al. Predictive low-glucose suspend reduces hypoglycemia in adults, adolescents, and children with type 1 diabetes in an at-home randomized crossover study: results of the PROLOG Trial. Diabetes Care. 2018;41:2155-2161. [DOI] [PubMed] [Google Scholar]
- 30. Lewis D. History and perspective on DIY closed looping [published online ahead of print October 22, 2018]. J Diabetes Sci Technol. doi: 10.1177/1932296818808307. [DOI] [PMC free article] [PubMed] [Google Scholar]
- 31. Monnier L, Colette C, Wojtusciszyn A, et al. Toward defining the threshold between low and high glucose variability in diabetes. Diabetes Care. 2017;40:832-838. [DOI] [PubMed] [Google Scholar]
- 32. Biester T, Kordonouri O, Holder M, et al. “Let the Algorithm Do the Work”: reduction of hypoglycemia using sensor-augmented pump therapy with predictive insulin suspension (SmartGuard) in pediatric type 1 diabetes patients. Diabetes Technol Ther. 2017;19:173-182. [DOI] [PMC free article] [PubMed] [Google Scholar]
- 33. Baysal N, Cameron F, Buckingham BA, et al. A novel method to detect pressure-induced sensor attenuations (PISA) in an artificial pancreas. J Diabetes Sci Technol. 2014;8:1091-1096. [DOI] [PMC free article] [PubMed] [Google Scholar]
- 34. Agrawal P, Zhong A, Welsh JB, Shah R, Kaufman FR. Retrospective analysis of the real-world use of the threshold suspend feature of sensor-augmented insulin pumps. Diabetes Technol Ther. 2015;17:316-319. [DOI] [PMC free article] [PubMed] [Google Scholar]
- 35. t:connect Diabetes Management Application User Guide: Tandem Diabetes Care. Available at: https://www.tandemdiabetes.com/docs/default-source/product-documents/tconnect-application/tconnect_patient_user_guide.pdf?sfvrsn=73553bd7_24.
- 36. Look H. Available at: https://tidepool.org/tidepool-supports-medtronic-630g-640g-and-670g/.
- 37. C. S. My first month running Basal:IQ. Available at: https://tidepool.org/blog/my-first-month-running-basal-iq.
- 38. JDRF Announces New Initiative to Pave Way for Open Protocol Automated Insulin Delivery Systems. Available at: https://www.jdrf.org/press-releases/jdrf-announces-new-initiative-to-pave-way-for-open-protocol-automated-insulin-delivery-systems/.
- 39. Welcome to OpenAPS’s Documentation! Available at: https://openaps.readthedocs.io/en/2017-05-21/index.html.
- 40. Welcome to Loop. Available at: https://loopkit.github.io/loopdocs/.
- 41. Welcome to the Android APS documentation. Available at: https://androidaps.readthedocs.io/en/latest/EN/.
Associated Data
This section collects any data citations, data availability statements, or supplementary materials included in this article.
Supplementary Materials
Supplemental material, Supplemental_Figures for A Review of Continuous Glucose Monitoring Data Interpretation in the Age of Automated Insulin Delivery by Laya Ekhlaspour, Ideen Tabatabai and Bruce Buckingham in Journal of Diabetes Science and Technology


