

Abstract
Minimal hepatic encephalopathy (MHE) is epidemic in cirrhosis but testing strategies often have poor concordance. Altered gut/salivary microbiota occur in cirrhosis and could be related to MHE.
Aim:
Determine microbial signatures of individual cognitive tests and define the role of microbiota in diagnosis of MHE.
Methods:
Cirrhotic outpatients underwent stool collection and MHE testing with Psychometric hepatic encephalopathy score(PHES), Inhibitory control test(ICT) and EncephalApp Stroop. A subset gave saliva. MHE diagnosis/concordance between tests were compared. Stool/salivary microbiota were analyzed using 16srRNA sequencing. Microbial profiles were compared between patients with/without MHE on individual tests. Logistic regression was used to evaluate clinical and microbial predictors of MHE diagnosis.
Results:
247 cirrhotics (123 prior overt HE, MELD 13) underwent stool and PHES; 175 underwent ICT and 125 Stroop testing. 112 patients also gave saliva. 59%−82% of patients had MHE depending on the modality. Inter-test Kappa for MHE was 0.15–0.35. Stool and salivary microbiota profiles in MHE were different from those without MHE. Individual microbiota signatures were associated with MHE in specific modalities. However, stool and salivary Lactobacillaceae relative abundance was higher in MHE regardless of modality used while autochthonous Lachnospiraceae were higher in those without MHE, especially on PHES. On logistic regression stool and salivary Lachnospiraceae genera (Ruminococcus, Clostridium XIVb) were associated with good cognition independent of clinical variables.
Conclusions:
Specific stool and salivary microbial signatures exist for individual cognitive strategies in MHE. Presence of specific taxa associated with good cognitive function regardless of modality could potentially be used to circumvent MHE testing.
INTRODUCTION:
Hepatic encephalopathy (HE) is one of the leading causes of morbidity and mortality in cirrhotic patients(1, 2). The spectrum of neuro-cognitive impairment in cirrhosis ranges from the subtle covert HE through disorientation, stupor and coma known as overt HE (OHE)(2). Covert HE, which includes minimal HE (MHE), is associated with medical outcomes such as progression to OHE, hospitalizations and death; as well as psycho-social outcomes such as impaired driving ability, a lower health-related quality of life and socio-economic status(3). Therefore, the diagnosis of MHE is important but is rarely made because MHE diagnostic tests are often associated with poor inter-test agreement(4–7). In addition, testing strategies for MHE interrogate different brain regions and are differentially associated with ammonia and systemic inflammation(8–10).
Underlying this spectrum of cognitive impairment is an altered gut-liver-brain axis. The components of these alterations include an unfavorable gut microbiota composition, increased local and systemic inflammation and impaired immune response(11–13). However, to date there has been limited study of the association between gut microbiota profiles with differing MHE testing strategies and the potential practical use of specific microbial profiles to diagnose MHE.
Our aim was to (a) Determine gut and salivary microbial profiles of patients with and without MHE based on several approved tests and (b) Define a profile of gut and salivary microbiota whose presence is associated with cognitive dysfunction in cirrhosis independent of clinical variables.
METHODS:
The overall study is a prospective enrollment of outpatients with cirrhosis who underwent cognitive testing and stool and saliva collection for characterization of the microbiota and MHE status. We enrolled outpatients with cirrhosis from hepatology clinics at the Virginia Commonwealth University and Richmond VA Medical Center after written informed consent. Patients were diagnosed with cirrhosis based on any of the following, liver biopsy, transient elastography, evidence of varices, nodular contour of liver or thrombocytopenia in a patient with chronic liver disease or frank decompensation of cirrhosis. We excluded patients with an unclear cirrhosis history, those unable to provide consent, grade 1 HE, patients with current alcohol or illegal drug abuse, those on anti-psychotic, anti-seizure, older anti-depressants or benzodiazepine usage, those with recent TIPS (<3 months), with recent changes in opioid medications (over the last 3 months) and those with recent (<1month) hospitalizations. We included patients on stable SSRI or SNRI anti-depressants and those on stable doses of opioid therapy (for >3 months).
Every patient was administered the mini-mental status exam (MMSE) and only those with a score of ≥25 were given the specialized cognitive tests. Patients underwent testing with the following validated strategies for MHE (a) Psychometric hepatic encephalopathy score (PHES)(14) (b) Inhibitory Control test (ICT)(15) and (c) EncephalApp Stroop(16) during the same sitting in this order. We administered PHES to everyone, while a subset also underwent ICT and EncephalApp Stroop testing. MHE was diagnosed on US-based norms(17).
Cognitive testing details:
PHES consists of 5 tests, the standard deviations of which are compared against healthy controls and the total sum is added. A low total score against the reference control population indicates poor performance. EncephalApp Stroop has two sections, an easier Off state where the subject has to recognize the color of the # signs appropriately and touch the screen at the corresponding color, and a more difficult On state where the words meaning specific colors are presented in discordant colors. The time to complete 5 correct runs in each state are added with the total time, OffTime, OnTime and the number of runs required to complete 5 states. A higher time required indicates poor performance. ICT is a computer-based in which subjects are shown a series of letters and are asked to respond by pressing a mouse key when an X is followed by a Y or a Y is followed by an X (alternating presentation, termed targets). Patients are instructed not to respond to X following X or Y following Y (non-alternating presentation, termed lures). High lure and low target response indicate poor psychometric performance. The ICT is administered as a practice test followed by a series of 6 similar 2-minute runs, separated by breaks to allow the subjects to rest. There are total of 212 targets and 40 lures scattered throughout the test. Weighted lures are lures divided by the square of target accuracy/100(18). While all patients underwent PHES, the ICT and EncephalApp Stroop administration varied based on availability of the test and logistics at the time of the sample collection, and exclusions for the test including red-green color blindness. None of the patients were systematically excluded from taking any specific cognitive test. All patients also underwent a dietary history with recall over the last three days focusing on caloric intake, protein intake and intake of meat vs vegetarian diets.
Microbiota analysis:
In addition, patients provided a stool sample and a subset also provided salivary samples using published techniques on the same day(19). 16srRNA microbiota analysis was performed using Multitag sequencing on an Ion Torrent PGM as previously published (20). The main objectives were to determine the microbial taxa that differentiated between patients who had MHE on individual modalities compared to the rest in the entire group and the subset without prior OHE. All analyses were performed separately for stool and salivary microbiota. We used LEFSe (Linear Discriminant Analysis Effect Size) to determine the taxa that differentiated the groups(21).
Model building to predict cognitive impairment with and without clinical variables:
Ultimately, microbial taxa that were significantly different on LEFSe between groups were then introduced into a logistic regression model with clinical variables of defining cognitive impairment. Variables significant at p<0.20 on univariate analysis were introduced into the final models and backward logistic regression models were used to predict specific cognitive impairments.
The clinical variables used were age, gender, education, prior OHE (for the entire cirrhosis group), proton pump inhibitor (PPI) use and MELD score. In the no-OHE group, all the above clinical variables were input apart from prior OHE. Microbiota families were input one phylum at a time for data reduction and specific families that were p<0.20 were input with the clinical variables for the final model.
Lastly, to interrogate the specific taxa at a deeper level, for bacterial families that emerged significant in the prediction of the logistic regression models, we further analyzed them at the genus level to determine the specific genera associated with specific cognitive impairments or with normal cognitive function.
RESULTS:
We enrolled 267 patients with cirrhosis, all of whom underwent PHES testing and stool collection. Of these patients 123 had prior HE (118 on lactulose and 77 on rifaximin). 175 patients underwent additional ICT and 125 were also given EncephalApp Stroop tests. A subset of patients (n=112) also gave saliva. The details of MHE diagnosis using the individual modalities in patients who underwent stool and saliva collection are shown in figures 1A and B.
Figure 1:
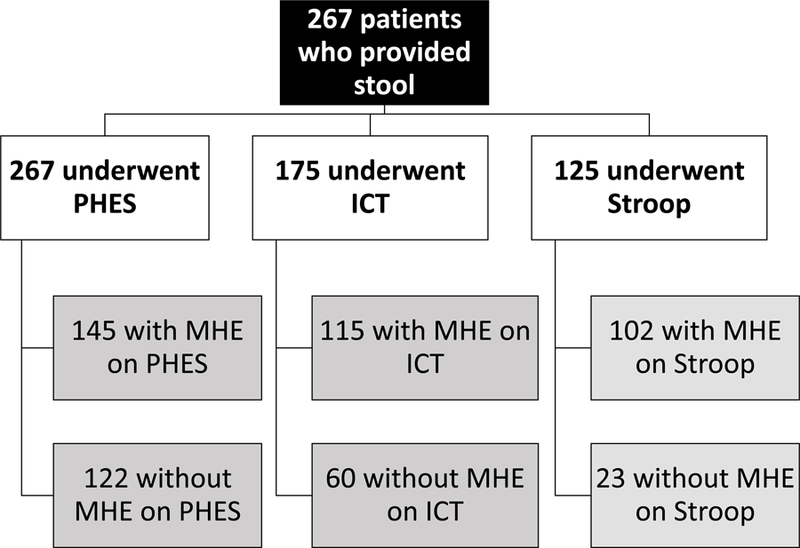

Flowchart of patients. MHE: minimal hepatic encephalopathy, ICT: inhibitory control test, PHES: psychometric hepatic encephalopathy score
Figure 1A: Flow of patients who had stool collected and testing results for minimal hepatic encephalopathy using the specific modalities
Figure 1B: Flow of patients who had saliva collected and testing results for minimal hepatic encephalopathy using the specific modalities
As shown in table 1, patients with OHE were more likely to be men, be on PPI, have a higher MELD score and worse cognitive performance than patients without prior OHE. Most patients with prior OHE were on lactulose and rifaximin and none of the patients without prior OHE were on any of these medications. Details of patients who gave saliva are shown in table 2.
Table 1:
Details of patients with stool collection and PHES scoring
| No prior Overt HE (n=144) |
Prior Overt HE (n=123) |
P value | |
|---|---|---|---|
| Age (years) | 59.2±7.1 | 59.1±7.3 | 0.91 |
| Education (years) | 13.7±2.2 | 13.4±2.3 | 0.26 |
| Gender (male) | 96 (67%) | 110 (89%) | <0.0001 |
| Proton Pump Inhibitor use | 58 (41%) | 74 (60%) | 0.001 |
| Alcoholic etiology of cirrhosis | 39 (27%) | 30 (24%) | 0.42 |
| MELD score | 10.7±5.5 | 15.6±6.1 | <0.0001 |
| Lactulose | − | 118 | − |
| Rifaximin | − | 77 | − |
| MHE (yes/no) | |||
| PHES (n=267 total) | 63 (44%) | 82 (67%) | <0.0001 |
| ICT (n=175 total) | 54 of 87 (62%) | 61 of 88 (69%) | 0.31 |
| Stroop (n=125 total) | 35 of 49 (71%) | 67 of 76 (88%) | 0.02 |
| PHES components | |||
| Number connection A (seconds) | 38.0±17.4 | 57.6±36.0 | <0.0001 |
| Number connection B (seconds) | 97.3±48.6 | 174.0±127.0 | <0.0001 |
| Digit Symbol (seconds) | 53.4±17.6 | 39.2±14.9 | <0.0001 |
| Line tracing time (seconds) | 101.0±35.5 | 128.6±77.8 | <0.0001 |
| Line tracing errors (number) | 28.9±24.9 | 42.9±34.2 | <0.0001 |
| Serial dotting test (seconds) | 64.7±22.7 | 92.0±44.2 | <0.0001 |
| PHES total score (+4 to −15, median IQR) | −2 (5.25) | −7 (9.00) | <0.0001 |
| ICT components (n=175) | |||
| Lures (number incorrect, max=40) | 12.5±8.9 | 14.4±9.1 | 0.13 |
| Targets (% correct) | 96.1±5.9 | 89.5±14.5 | <0.0001 |
| Weighted lures (number) | 14.1±11.4 | 22.4±22.6 | <0.0001 |
| EncephalApp components (n=125) | |||
| OffTime (seconds) | 85.6±24.6 | 103.0±29.4 | 0.001 |
| OnTime (seconds) | 102.7±33.9 | 131.0±51.3 | <0.0001 |
| OffTime+OnTime (seconds) | 187.0±52.6 | 234.0±79.0 | <0.0001 |
| OnTime-OffTime (seconds) | 12.5±8.5 | 28.1±27.4 | <0.0001 |
| Number of runs Off (number) | 5.7±1.0 | 6.1±1.5 | 0.02 |
| Number of runs On (number) | 6.3±1.6 | 6.8±4.0 | 0.28 |
Data is presented as mean±SD unless mentioned otherwise. Comparisons performed using unpaired t-tests or Mann-Whitney tests as appropriate. MHE: minimal hepatic encephalopathy, ICT: inhibitory control test, PHES: psychometric hepatic encephalopathy score. A high score on Stroop components, ICT lures, ICT weighted lures and Digit symbol indicates poor performance and a low score in the remaining cognitive tests indicate poor performance.
Table 2:
Details of patients with saliva collection
| No prior Overt HE (n=73) |
Prior Overt HE (n=49) |
P value | |
|---|---|---|---|
| Age (years) | 59.4±6.6 | 60.6.1±7.1 | 0.31 |
| Education (years) | 13.5±2.5 | 13.6±2.3 | 0.87 |
| Gender (male) | 51 (69%) | 42 (86%) | 0.05 |
| Proton Pump Inhibitor use | 28 (38%) | 31 (63%) | 0.01 |
| Alcoholic etiology of cirrhosis | 21(28%) | 15 (30%) | 0.52 |
| MELD score | 9.8±6.5 | 15.6±6.5 | <0.0001 |
| Lactulose | − | 47 | − |
| Rifaximin | − | 30 | − |
| MHE (yes/no) | |||
| PHES (n=122 total) | 13 (18%) | 29 (59%) | <0.0001 |
| ICT (n=113 total) | 31 of 47 (66%) | 39 of 66 (59%) | 0.36 |
| Stroop (n=70 total) | 24 of 42 (57%) | 23 of 28 (82%) | 0.03 |
| PHES components | |||
| Number connection A (seconds) | 36.4±20.1 | 52.6±35.1 | 0.005 |
| Number connection B (seconds) | 91.6±48.3 | 159.0±116.0 | <0.0001 |
| Digit Symbol (seconds) | 52.6±20.0 | 42.3±15.1 | 0.002 |
| Line tracing time (seconds) | 98.5±38.2 | 112.9±66.2 | 0.17 |
| Line tracing errors (number) | 29.7±26.8 | 42.6±30.2 | 0.02 |
| Serial dotting test (seconds) | 64.5±24.4 | 81.1±39.0 | 0.01 |
| PHES total score (+4 to −15, median IQR) | −1 (5.0) | −4 (7.5) | 0.005 |
| ICT components (n=113) | |||
| Lures (number incorrect, max=40) | 12.1±9.4 | 12.6±8.2 | 0.78 |
| Targets (% correct) | 96.5±5.8 | 91.6±14.1 | 0.03 |
| Weighted lures (number) | 12.7±10.4 | 20.1±22.6 | 0.04 |
| EncephalApp components (n=70) | |||
| OffTime (seconds) | 88.2±26.2 | 94.6±32.3 | 0.40 |
| OnTime (seconds) | 104.2±32.1 | 117.5±52.1 | 0.24 |
| OffTime+OnTime (seconds) | 192.3±56.4 | 212.0±83.6 | 0.29 |
| OnTime-OffTime (seconds) | 14.0±9.1 | 22.9±22.9 | 0.07 |
| Number of runs Off (number) | 5.9±0.8 | 6.2±1.6 | 0.12 |
| Number of runs On (number) | 6.3±1.4 | 7.0±2.8 | 0.23 |
Data is presented as mean±SD unless mentioned otherwise. Comparisons performed using unpaired t-tests or Mann-Whitney tests as appropriate. MHE: minimal hepatic encephalopathy, ICT: inhibitory control test, PHES: psychometric hepatic encephalopathy score. A high score on Stroop components, ICT lures, ICT weighted lures and Digit symbol indicates poor performance and a low score in the remaining cognitive tests indicate poor performance.
Minimal HE diagnosis:
In the entire group, using PHES, 145 (54%) of patients had MHE, in those given Stroop (total n=125), 102 (81%) had MHE, while in patients administered the ICT (n=175), 115 (65%) had MHE (Table 3). In the 125 patients of these that underwent both Stroop and PHES, 43 (34%) were discordant (p<0.0001 Chi-square). In the 175 patients that had both ICT and PHES, 70 (39%) were discordant (p=0.001) and in the 99 who had both Stroop and ICT, discordant results were seen in 29 (29%, p=0.01). There were no significant demographic or cirrhosis-related differences between patients who received one, two or all three tests (Supplementary tables 1 and 2 for patients who provided stool and saliva samples respectively). The reasons for patients not being administered the Stroop were largely related to the availability of the test which was developed after ICT and PHES and red-green color blindness in potential patients, while reasons for not being able to administer ICT were logistical related to time and availability of the program at the time of the stool, saliva and serum collection.
Table 3:
Patients with MHE on PHES compared to those without MHE in all patients
| Patients who provided stool | Subset who also provided saliva | |||||
|---|---|---|---|---|---|---|
| No minimal HE (n=122) |
Minimal HE (n=145) |
P value | No Minimal HE (n=78) |
Minimal HE (n=42) |
P value | |
| Age (years) | 59.4±9.1 | 60.1±7.0 | 0.07 | 59.5±6.1 | 61.4±8.2 | 0.21 |
| Education (years) | 13.8±2.3 | 13.4±2.2 | 0.20 | 13.8±2.5 | 13.1±2.1 | 0.10 |
| Gender (male) | 85 | 122 | 0.003 | 54 | 38 | 0.006 |
| Proton Pump Inhibitor use | 54 | 77 | 0.11 | 36 | 22 | 0.07 |
| MELD score | 14.3±7.1 | 11.3±4.7 | <0.0001 | 15.7±7.1 | 10.2±3.9 | <0.0001 |
| Prior OHE | 42 | 82 | <0.0001 | 20 | 29 | <0.0001 |
| Lactulose | 38 | 80 | <0.0001 | 19 | 28 | 0.001 |
| Rifaximin | 22 | 55 | <0.0001 | 12 | 18 | <0.0001 |
Data is presented as mean±SD unless mentioned otherwise. Comparisons performed using unpaired t-tests or Mann-Whitney tests as appropriate. OHE: overt hepatic encephalopathy
In patients without prior OHE who gave stool, there were 63 (of 144, 44%) that were positive for MHE on PHES, 54 (of 87, 62%) positive for ICT and 35 (of 49, 71%) positive for Stroop MHE. these patients only 61 patients were MHE positive and for both PHES and Stroop (Table 4). When MHE positivity was compared, 83 (58%) were discordant between ICT and PHES, 69 (47%) were discordant between Stroop and PHES and 54 (38%) were discordant between ICT and Stroop.
Table 4:
Patients with MHE on PHES compared to those without MHE in those without prior OHE
| Patients who provided stool | Subset who also provided saliva | |||||
|---|---|---|---|---|---|---|
| No minimal HE (n=80) |
Minimal HE (n=63) |
P value | No minimal HE (n=58) |
Minimal HE (n=13) |
P value | |
| Age (years) | 59.2±7.0 | 59.9±7.5 | 0.58 | 65.0±8.5 | 59.8±6.44 | 0.06 |
| Education (years) | 13.9±2.4 | 13.6±2.2 | 0.56 | 13.8±2.5 | 13.1±2.1 | 0.09 |
| Gender (male) | 51 | 44 | 0.34 | 39 | 11 | 0.19 |
| Proton Pump Inhibitor use | 35 | 19 | 0.11 | 23 | 5 | 0.52 |
| MELD score | 10.3±4.7 | 10.2±4.5 | 0.93 | 9.3±3.7 | 11.4±3.8 | 0.09 |
Data is presented as mean±SD unless mentioned otherwise. Comparisons performed using unpaired t-tests or Mann-Whitney tests as appropriate. OHE: overt hepatic encephalopathy
Ultimately, there was poor kappa agreement between the modalities (PHES vs ICT=0.15, PHES vs Stroop=0.35, Stroop vs ICT=0.20 for the diagnosis in those who had more than one testing modality used.
Dietary analysis showed that all patients were non-vegetarian and largely followed a Western diet. The mean±SD daily caloric intake and proportion of calories from protein over the last 3 days on dietary recall was statistically similar between those with and without MHE on PHES (no-MHE 2318±230 Kcal vs. 2295±429 Kcal, p=0.62 and 28±10% vs 26±13% protein, p=0.19)
Microbiota changes
We obtained stool samples from all 267 patients while saliva was obtained from 122 patients (49 prior OHE and 73 without OHE). The entire group was first evaluated from the salivary and stool microbiota perspective based on MHE on the three individual modalities.
We then evaluated MHE on PHES in patients without prior OHE on stool and same for ICT and Stroop. Shannon diversity indices are shown in table 5.
Table 5:
Diversity indices between groups
| Stool microbiota diversity | All patients | Patients without prior OHE | ||
|---|---|---|---|---|
| MHE | No-MHE | MHE | No-MHE | |
| MHE on PHES | 1.9±0.7 | 2.2±0.6* | 1.9±0.7 | 2.2±0.6* |
| MHE on ICT | 2.0±0.7 | 2.1±0.6 | 2.2±0.6 | 2.1±0.8 |
| MHE on Stroop | 1.9±0.6 | 2.1±0.6* | 1.7±0.6 | 2.2±0.6* |
| Salivary microbiota diversity | All patients | Patients without prior OHE | ||
| MHE | No-MHE | MHE | No-MHE | |
| MHE on PHES | 2.0±0.4 | 2.3±0.4* | 2.0±0.5 | 2.5±0.3* |
| MHE on ICT | 2.1±0.5 | 2.1±0.5 | 2.2±0.3 | 2.3±0.3 |
| MHE on Stroop | 2.0±0.5 | 2.3±0.4* | 2.1±0.4 | 2.2±0.2 |
MHE: minimal hepatic encephalopathy, OHE: overt hepatic encephalopathy. ICT: inhibitory control test, PHES: psychometric hepatic encephalopathy score. MHE diagnosis made according to US-based norms.
LEFSe in the entire group:
Stool changes (Figure 2A):
Figure 2:
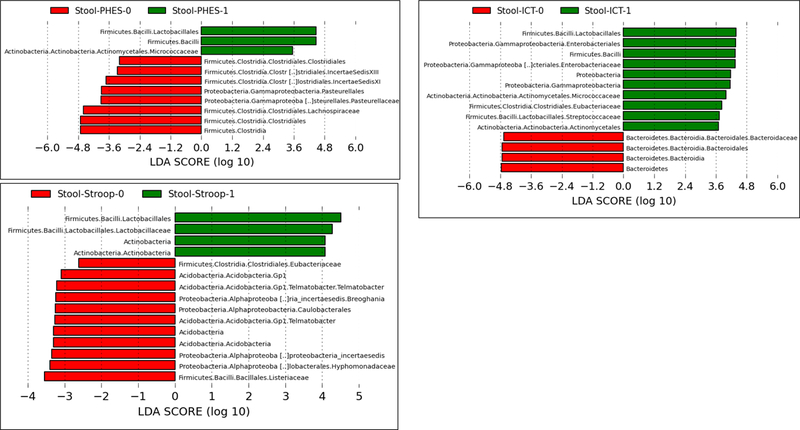
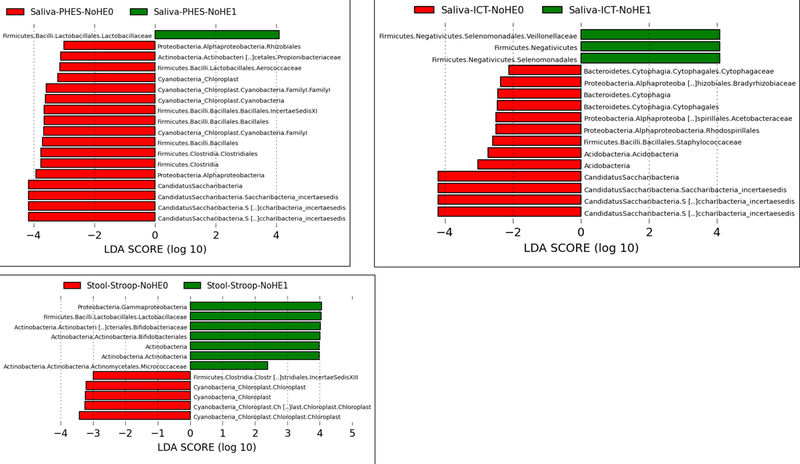
Linear discriminant effect size (LEFSe) changes in stool and saliva of patients with and without minimal hepatic encephalopathy. Bars in red represent bacterial taxa that were higher in patients who tested negative for MHE while those in green represents bacterial taxa that were higher in patients who tested positive for MHE using that specific modality. MHE: minimal hepatic encephalopathy, ICT: inhibitory control test, PHES: psychometric hepatic encephalopathy score.
Figure 2A: Stool changes in all patients (regardless of prior overt hepatic encephalopathy) ICT-1: MHE present on ICT, ICT-0: No MHE on ICT, PHES-0: MHE present on PHES, PHES-0: No MHE on PHES, Stroop-0: MHE present on Stroop, Stroop-0: No MHE on Stroop
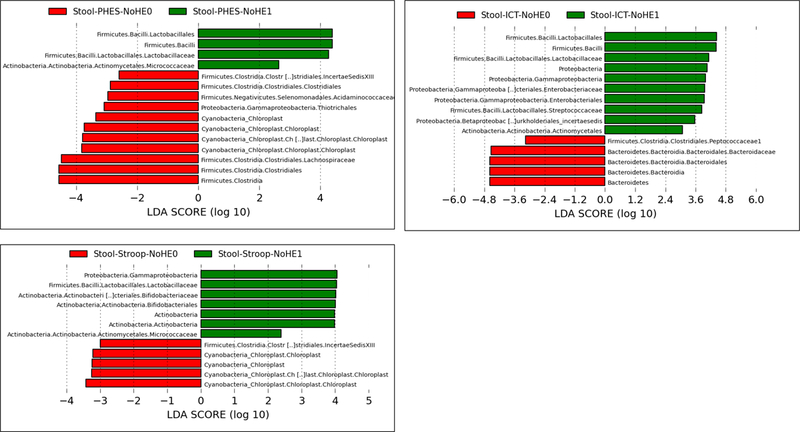
Figure 2B: Stool changes in all patients without prior overt hepatic encephalopathy ICT-1: MHE present on ICT, ICT-0: No MHE on ICT, PHES-0: MHE present on PHES, PHES-0: No MHE on PHES, Stroop-0: MHE present on Stroop, Stroop-0: No MHE on Stroop
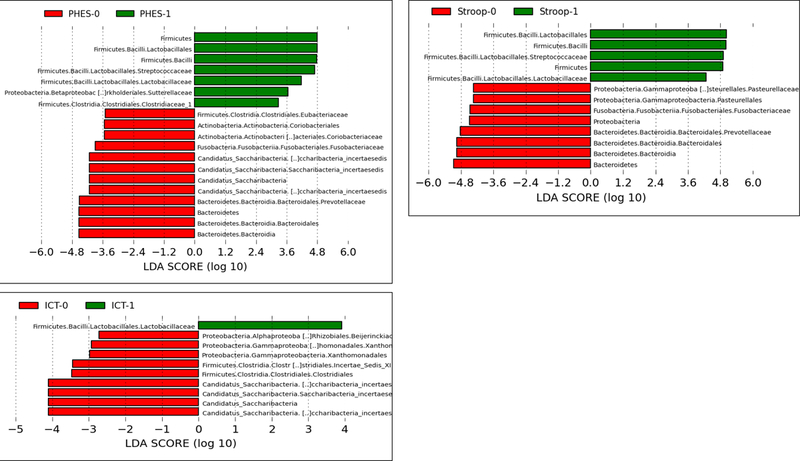
Figure 2C: Salivary changes in all patients (regardless of prior overt hepatic encephalopathy) ICT-1: MHE present on ICT, ICT-0: No MHE on ICT, PHES-0: MHE present on PHES, PHES-0: No MHE on PHES, Stroop-0: MHE present on Stroop, Stroop-0: No MHE on Stroop
Figure 2D: Salivary changes in all patients without prior overt hepatic encephalopathy ICT-1: MHE present on ICT, ICT-0: No MHE on ICT, PHES-0: MHE present on PHES, PHES-0: No MHE on PHES, Stroop-0: MHE present on Stroop, Stroop-0: No MHE on Stroop
Using PHES as the definition of MHE, there was a higher relative abundance of Lactobacillales and Micrococcaceae with lower Lachnospiraceae, Clostridiales Incertae Sedis XI and XIII and Pasteurellaceae in those with MHE. Similarly, using ICT, there was a higher relative abundance of Enterobacteriaceae, Streptocococcaceae, Micrococcaceae and Eubacteriaceae and lower Bacteroidaceae in those with MHE. When Stroop was used here was a higher relative abundance of Lactobacillales with lower Eubacteriaceae, Telmatobacter and taxa belonging to Proteobacteria in those with MHE was noted.
Salivary changes (Figure 2C):
In patients with MHE on PHES, salivary Lactobacillaceae, Streptococcaceae, Sutterellaceae and Clostridiaceae were higher while a lower relative abundance of Prevotellaceae, Saccharibacteria, Fusobacteriaceae and Eubacteriaceae was seen. Using ICT, again there was a higher relative abundance of Lactobacillaceae with lower Saccharibacteria, and constituents of Proteobacteria in those with MHE. On Stroop, in those with MHE again a higher relative abundance of Lactobacillaceae, Streptococcaceae and lower Proteobacterial, Fusobacteria and Prevotellaceae relative abundance was observed in those with MHE.
LEFSe in patients without prior OHE:
Stool changes (Figure 2B):
Patients with MHE on PHES had a higher Lactobacillaceae and Micrococcaceae and a lower relative abundance of Lachnospiraceae, Acidaminococcacaeae and Cyanobacteria compared to those without MHE. Using ICT, there were again higher Lactobacillaceae, Enterobacteriaceae and Streptococcaceae and lower Bacteroidaceae and Peptococcaceae in those with MHE. When Stroop was used, there was a higher relative abundance of Lactobacillaceae, Bifidobacteriaceae, Micrococcaeae and Gammaproteobacteria and lower Cyanobacteria and Clostridiales Cluster XIII in those with MHE.
Salivary changes (Figure 2D):
PHES-associated MHE was associated with higher Lactobacillaceae and lower Proteobacteria, Chloroplast and several members of the Firmicutes phylum. Using Stroop, there was a higher relative abundance of Lactobacillaeae and Streptococcaceae and lower Proteobacteria in those with MHE. Patients with MHE on ICT had higher Veillonellacaeae and lower Proteobacteria, Staphylococcaceae and Acetobacteriaceae compared to those without MHE.
Logistic regression:
As shown in table 6, several microbial families in the stool and saliva were associated with MHE independent of the clinical variables input. Specifically, Lachnospiraceae were associated with protection from MHE on PHES and Stroop while Veillonellaceae were associated with ICT-associated MHE. In the saliva, Streptococcaceae and Corobacteriaceae were associated with MHE on the three modalities while Clostridalies cluster XI and Prevotellaceae were associated with protection against MHE.
Table 6:
Logistic regression results for stool and salivary microbiota at the family level
| Stool microbiota and clinical variables | All patients | Patients without prior OHE | ||
|---|---|---|---|---|
| Higher in MHE | Higher in no-MHE | Higher in MHE | Higher in no-MHE | |
| MHE on PHES | MELD, age, male gender | Lachnospiraceae | MELD, age, male gender | Lachnospiraceae, |
| MHE on ICT | Veillonellaceae | − | Veillonellaceae | − |
| MHE on Stroop | Male gender | Lachnospiraceae | Male gender | Eubacteriaceae |
| Salivary microbiota | All patients | Patients without prior OHE | ||
| Higher in MHE | Higher in no-MHE | Higher in MHE | Higher in no-MHE | |
| MHE on PHES | Age, prior OHE, MELD, Streptococcaceae | − | Lactobacillaceae | − |
| MHE on ICT | Coriobacteriaceae | − | Coriobacteriaceae | Clostridiales clusterXI, Aerococcaceae |
| MHE on Stroop | Streptococcaceae | − | Male Gender | Prevotellaceae |
MHE: minimal hepatic encephalopathy, OHE: overt hepatic encephalopathy. ICT: inhibitory control test, PHES: psychometric hepatic encephalopathy score. MHE diagnosis made according to US-based norms. Clinical variables studied were age, gender, MELD score, prior OHE (in the entire group), PPI use and education in years.
Genus-level changes in taxa found on logistic regression:
In stool in all subjects, the specific genera in Lachnospiraceae associated with protection from MHE as assessed by PHES were Blautia, Dorea, Roseburia, Clostridium XIVb, Robinsiella, Coprococcus and Ruminococcus, due to ICT were the genera were Ruminococcus, Clostridium XIVb and Cellulosilyticum; and due to Stroop were Clostridium XIVb and Lachnospira. In the stool in patients only without prior OHE, the similar Lachnospiraceae genera were higher in those without MHE based on PHES and Stroop assessment, while Veillonella was the genus higher in ICT-associated MHE.
In saliva, Streptococcus was the genus associated with MHE associated with Stroop and PHES assessment in the entire group. In those without prior OHE, Lactobacillus and Paralactobacillus were higher in MHE determined by PHES and Prevotella was higher in those with MHE based on Stroop performance. In those without MHE determined by ICT Abiotrophia from Aeroccocaceae and Clostridium XIVb of Lachnospiraceae were in greater relative abundance.
DISCUSSION:
The current study results demonstrate that patients with cirrhosis and MHE defined according to specific cognitive assessment strategies have unique microbial signatures in the stool and saliva. These microbial changes are associated with the diagnosis of MHE independent of clinical criteria and the presence of specific bacterial taxa is indicative of normal cognition in this population.
Patients with cirrhosis and MHE suffer from a poor health-related quality of life, a greater likelihood to progress to OHE, increased need for hospitalization, and have a worse survival compared to those without MHE (22, 23). These patients are often difficult to diagnose due to logistic concerns related to the available cognitive assessment methodologies including the relatively poor diagnostic agreement between these tests(24). Consistent with the literature we found a similar discordance between PHES, Stroop and ICT in our patient population(4–6). These tests interrogate different parts of the brain with psychomotor speed being a common denominator between the tests. PHES places a strong demand on a subject’s visual-motor coordination and abstraction ability(14). In contrast with the PHES the EncephalApp Stroop emphasizes cognitive flexibility; with the ICT assessing working memory and response inhibition(25, 26). Given that each of the three cognitive methods used in this paper emphases differing cognitive skill sets it is not surprising that MHE classification, based on individual test results compared with locally derived norms, would vary(27). However, the specific underlying factors associated with these neurobehavioral changes in MHE patients remains uncertain.
An altered gut-liver-brain axis is believed to be a central pathogenic factor accounting for the spectrum of cognitive impairment in cirrhosis, and indeed most HE-related therapies are focused on the gut(2, 28). Therefore, the changes in brain function underlying impaired performances on these tests could be related to alterations in gut microbiota. Changes in microbiota in cirrhosis have been shown in the stool, intestinal mucosa, serum and saliva(7, 29–32). This is likely related to changes in underlying immune function in cirrhosis that allows these alterations in microbiota to occur(13, 33). Patients with cirrhosis, especially those with advanced cirrhosis and OHE, have lower relative abundance of autochthonous bacterial taxa and higher potentially pathogenic ones(11). These are also associated with salivary bacterial changes(19). Therefore, specific microbial signatures that were found in our study that are linked to specific microbiota are intriguing.
We found that Shannon diversity indices varied according to the test used and patients who were positive on PHES and Stroop, but not ICT, had lower diversity in the stool and salivary microbiota. This trend continued to a large extent in those without prior OHE and was despite similar dietary practices between the groups with and without MHE(34). This could be a function of liver disease severity as patients with MHE on PHES in the entire group had a higher MELD score compared to the rest. However, there are likely other factors at play because the MELD score was similar in patients without prior OHE who were positive on PHES and yet their diversity was lower. Regardless, the basic concept of diversity of the microbiota already showed differentiating features between the three modes of MHE diagnosis.
Specific bacterial taxa in the stool and saliva differentiated between patients with and without MHE, but Lactobacillaceae were over-represented in the MHE group(30). In the stool Lactobacillaceae are associated with the use of lactulose, which was prescribed to the majority of prior OHE patients. However, we found a higher relative abundance of Lactobacillaceae in the stool of patients without prior OHE who had MHE and in the saliva as well. Since patients without OHE were not treated with lactulose and were not on specific probiotics, it is highly unlikely that this was an iatrogenic change. In prior studies based on 16srRNA and metagenomic sequencing, Lactobacillaceae have been associated with more advanced liver disease and to be linked with ammonia-associated changes on brain MRI(9, 35). In animal models of cirrhosis, lactic acid has been associated with cerebral edema(36). In the logistic regression both Lactobacillus and Paralactobacillus genera were found to be higher in saliva of patients with MHE due to PHES. The intriguing aspect is that this increase in relative abundance of Lactobacillaceae was greater in the group without prior OHE and was found to be higher in patients with MHE regardless of the modality used. While there have been studies evaluating the role of Lactobacillus-only probiotics in cirrhosis, they have not consistently resulted in cognitive improvement(37). Also, there are several species within Lactobacillus genus that are associated with pathogenic outcomes in addition to being probiotic in nature(38). Lactobacillus spp have been also associated with super-infections with other organisms and can increase after immunosuppressive therapy(39, 40). While Lactobacillaceae changes did not remain significant after logistic regression, these relatively consistent differences are intriguing and further analyses of the role of these microbes in gut-brain axis alterations in cirrhosis is needed.
On the other hand, genera belonging to Lachnospiraceae were present in greater relative abundance in patients without MHE in the stool in those with PHES and Stroop, even on logistic regression independent of clinical factors. Specific genera included Blautia, Roseburia, Clostridium XIVb and Ruminococcus. These taxa are associated with intestinal barrier integrity and short-chain fatty acid production and are usually found in higher relative abundances in patients with good cognition in prior studies(31, 41, 42). Specific Clostridia are responsible for synthesizing the neuro-protective 3-indole propionic acid as well(43). The interesting aspect is that the presence of these taxa especially Clostridium XIVb and Ruminococcus indicates better cognitive function on all three testing strategies and could be a method to exclude significant cognitive dysfunction in patients with cirrhosis. However, further prospective studies are needed to confirm these findings in other populations.
In the saliva, apart from the Lactobacillaceae changes, there was a higher relative abundance of Veillonella and Streptococcus in patients with cognitive impairment, even on logistic regression. Streptoccocaceae are associated with production of ammonia via urease activity, which could be associated with cognitive dysfunction and were found in greater relative abundance when the entire group was studied rather than those without OHE(44). Interestingly, these oral-origin taxa were not consistently higher in the stool of patients with MHE, likely due to the similar proportion of PPI use across the groups with and without MHE (45).
The association of altered biological processes in the determination of brain dysfunction in cirrhosis is relevant from a clinical and patho-physiological perspective. In prior studies, PHES and EEG have been separately linked with systemic inflammation and ammonia metabolism in patients with cirrhosis(8). Both modalities were independently associated with poor outcomes regardless of the pathogenesis. There is published evidence that changes in microbial composition can be associated with hospitalizations, HE episodes, death and recovery of brain function post-transplant(46–49). Prior reports have also focused differentially on specific gut microbiota and associated ammonia-related and inflammation-related consequences on brain MRI in cirrhosis(9). A prior study from China has found a higher stool Streptococcaccae relative abundance linked with ammonia in patients with cognitive impairment on paper pencil tests(44). The current results extend these results further by including the entire spectrum of cognitive dysfunction, using multiple methods of cognitive impairment to define MHE and by using salivary microbiota.
Our study is limited by its cross-sectional design and by relative small numbers of patients who underwent Stroop compared to other modalities. We also had relatively smaller number of salivary microbiota analyses compared to the stool. Also due to logistic concerns, not all patients underwent all MHE testing modalities or salivary collection. We did not focus on differentiating prior OHE compared to those without prior OHE in this analysis because those data have been published extensively and are usually confounded by disease severity and therapeutic options for OHE that can affect the microbiota.
We conclude that there is a specific microbial signature in the stool and salivary microbiota that is associated with individual cognitive impairment in patients with cirrhosis. These microbial changes are associated with cognitive impairment independent of clinical factors. Specific microbial taxa are associated with good cognitive function regardless of MHE testing modality and could potentially be used to circumvent MHE testing as a beneficial biomarker of a healthy gut-liver-brain axis in cirrhosis.
Supplementary Material
STUDY HIGHLIGHTS.
- What is current knowledge
- Minimal hepatic encephalopathy (MHE) is an epidemic neuro-cognitive disorder in cirrhosis with serious medical and psychosocial consequences
- Several tests such as PHES, ICT and EncephalApp Stroop, that are used to diagnose MHE, have poor concordance, which makes it difficult to diagnose MHE routinely.
- Cirrhotic patients have an altered gut-brain axis, but the individual microbial signatures related to specific MHE tests and potential use of microbiota to evaluate normal cognition is uncertain.
- What is new here
- In outpatients with cirrhosis, there were different microbial signatures in stool and saliva of patients who tested positive for MHE based on individual modalities
- Lactobacillaceae were higher in relative abundance in patients with MHE regardless of modality in stool and saliva.
- Specific genera belonging to autochthonous Lachnospiraceae were associated with normal cognition independent of clinical variables and regardless of MHE testing modality, and could potentially be used as a beneficial biomarker of a healthy gut-liver-brain axis in cirrhosis.
Acknowledgments
Financial Support: Partly supported by R21TR0202024 and VA Merit Review I0CX001076 and McGuire Research Institute Funds to JSB. The sponsors had no role in study design, data analysis or decision to publish.
Footnotes
Conflict of Interest/Study Support
Guarantor of the article: JSB is the guarantor
Potential competing interests: None
References:
- 1.Stepanova M, De Avila L, Afendy M, et al. Direct and Indirect Economic Burden of Chronic Liver Disease in the United States. Clin Gastroenterol Hepatol 2016. [DOI] [PubMed]
- 2.Vilstrup H, Amodio P, Bajaj J, et al. Hepatic encephalopathy in chronic liver disease: 2014 Practice Guideline by the American Association for the Study of Liver Diseases and the European Association for the Study of the Liver. Hepatology 2014;60:715–35. [DOI] [PubMed] [Google Scholar]
- 3.Bajaj JS, Cordoba J, Mullen KD, et al. Review article: the design of clinical trials in hepatic encephalopathy--an International Society for Hepatic Encephalopathy and Nitrogen Metabolism (ISHEN) consensus statement. Aliment Pharmacol Ther 2011;33:739–47. [DOI] [PMC free article] [PubMed] [Google Scholar]
- 4.Montagnese S, Balistreri E, Schiff S, et al. Covert hepatic encephalopathy: agreement and predictive validity of different indices. World J Gastroenterol 2014;20:15756–62. [DOI] [PMC free article] [PubMed] [Google Scholar]
- 5.Goldbecker A, Weissenborn K, Hamidi Shahrezaei G, et al. Comparison of the most favoured methods for the diagnosis of hepatic encephalopathy in liver transplantation candidates. Gut 2013;62:1497–504. [DOI] [PubMed] [Google Scholar]
- 6.Lauridsen MM, Jepsen P, Vilstrup H. Critical flicker frequency and continuous reaction times for the diagnosis of minimal hepatic encephalopathy: a comparative study of 154 patients with liver disease. Metab Brain Dis 2011;26:135–9. [DOI] [PubMed] [Google Scholar]
- 7.Iebba V, Guerrieri F, Di Gregorio V, et al. Combining amplicon sequencing and metabolomics in cirrhotic patients highlights distinctive microbiota features involved in bacterial translocation, systemic inflammation and hepatic encephalopathy. Sci Rep 2018;8:8210. [DOI] [PMC free article] [PubMed] [Google Scholar]
- 8.Montagnese S, Biancardi A, Schiff S, et al. Different biochemical correlates for different neuropsychiatric abnormalities in patients with cirrhosis. Hepatology 2011;53:558–66. [DOI] [PubMed] [Google Scholar]
- 9.Ahluwalia V, Betrapally NS, Hylemon PB, et al. Impaired Gut-Liver-Brain Axis in Patients with Cirrhosis. Sci Rep 2016;6:26800. [DOI] [PMC free article] [PubMed] [Google Scholar]
- 10.Shawcross DL, Davies NA, Williams R, et al. Systemic inflammatory response exacerbates the neuropsychological effects of induced hyperammonemia in cirrhosis. J Hepatol 2004;40:247–54. [DOI] [PubMed] [Google Scholar]
- 11.Bajaj JS, Betrapally NS, Gillevet PM. Decompensated cirrhosis and microbiome interpretation. Nature 2015;525:E1–2. [DOI] [PMC free article] [PubMed] [Google Scholar]
- 12.Bajaj JS, Heuman DM, Hylemon PB, et al. Altered profile of human gut microbiome is associated with cirrhosis and its complications. J Hepatol 2014;60:940–7. [DOI] [PMC free article] [PubMed] [Google Scholar]
- 13.Albillos A, Lario M, Alvarez-Mon M. Cirrhosis-associated immune dysfunction: distinctive features and clinical relevance. J Hepatol 2014;61:1385–96. [DOI] [PubMed] [Google Scholar]
- 14.Weissenborn K, Ennen JC, Schomerus H, et al. Neuropsychological characterization of hepatic encephalopathy. J Hepatol 2001;34:768–73. [DOI] [PubMed] [Google Scholar]
- 15.Bajaj JS, Hafeezullah M, Franco J, et al. Inhibitory control test for the diagnosis of minimal hepatic encephalopathy. Gastroenterology 2008;135:1591–1600 e1. [DOI] [PubMed] [Google Scholar]
- 16.Bajaj JS, Heuman DM, Sterling RK, et al. Validation of EncephalApp, Smartphone-Based Stroop Test, for the Diagnosis of Covert Hepatic Encephalopathy. Clin Gastroenterol Hepatol 2014. [DOI] [PMC free article] [PubMed]
- 17.Allampati S, Duarte-Rojo A, Thacker LR, et al. Diagnosis of Minimal Hepatic Encephalopathy Using Stroop EncephalApp: A Multicenter US-Based, Norm-Based Study. Am J Gastroenterol 2016;111:78–86. [DOI] [PubMed] [Google Scholar]
- 18.Amodio P, Ridola L, Schiff S, et al. Improving the inhibitory control task to detect minimal hepatic encephalopathy. Gastroenterology 2010;139:510–8, 518 e1–2. [DOI] [PubMed] [Google Scholar]
- 19.Bajaj JS, Betrapally NS, Hylemon PB, et al. Salivary microbiota reflects changes in gut microbiota in cirrhosis with hepatic encephalopathy. Hepatology 2015;62:1260–71. [DOI] [PMC free article] [PubMed] [Google Scholar]
- 20.Hamady M, Knight R. Microbial community profiling for human microbiome projects: Tools, techniques, and challenges. Genome Res 2009;19:1141–52. [DOI] [PMC free article] [PubMed] [Google Scholar]
- 21.Segata N, Izard J, Waldron L, et al. Metagenomic biomarker discovery and explanation. Genome Biol 2011;12:R60. [DOI] [PMC free article] [PubMed] [Google Scholar]
- 22.Ampuero J, Simón M, Montoliú C, et al. Minimal Hepatic Encephalopathy and Critical Flicker Frequency Are Associated With Survival of Patients With Cirrhosis. Gastroenterology;149:1483–1489. [DOI] [PubMed] [Google Scholar]
- 23.Patidar KR, Thacker LR, Wade JB, et al. Covert hepatic encephalopathy is independently associated with poor survival and increased risk of hospitalization. Am J Gastroenterol 2014;109:1757–63. [DOI] [PMC free article] [PubMed] [Google Scholar]
- 24.Bajaj JS. Diagnosing Minimal Hepatic Encephalopathy: From the Ivory Tower to the Real World. Gastroenterology 2015;149:1330–3. [DOI] [PubMed] [Google Scholar]
- 25.Garavan H, Ross TJ, Stein EA. Right hemispheric dominance of inhibitory control: an event-related functional MRI study. Proc Natl Acad Sci U S A 1999;96:8301–6. [DOI] [PMC free article] [PubMed] [Google Scholar]
- 26.Pardo JV, Pardo PJ, Janer KW, et al. The anterior cingulate cortex mediates processing selection in the Stroop attentional conflict paradigm. Proc Natl Acad Sci U S A 1990;87:256–9. [DOI] [PMC free article] [PubMed] [Google Scholar]
- 27.Felipo V, Urios A, Gimenez-Garzo C, et al. Non invasive blood flow measurement in cerebellum detects minimal hepatic encephalopathy earlier than psychometric tests. World J Gastroenterol 2014;20:11815–25. [DOI] [PMC free article] [PubMed] [Google Scholar]
- 28.Kang DJ, Betrapally NS, Ghosh SA, et al. Gut microbiota drive the development of neuroinflammatory response in cirrhosis in mice. Hepatology 2016;64:1232–48. [DOI] [PMC free article] [PubMed] [Google Scholar]
- 29.Santiago A, Pozuelo M, Poca M, et al. Alteration of the serum microbiome composition in cirrhotic patients with ascites. Sci Rep 2016;6:25001. [DOI] [PMC free article] [PubMed] [Google Scholar]
- 30.Bajaj JS, Ridlon JM, Hylemon PB, et al. Linkage of gut microbiome with cognition in hepatic encephalopathy. Am J Physiol Gastrointest Liver Physiol 2012;302:G168–75. [DOI] [PMC free article] [PubMed] [Google Scholar]
- 31.Bajaj JS, Hylemon PB, Ridlon JM, et al. Colonic mucosal microbiome differs from stool microbiome in cirrhosis and hepatic encephalopathy and is linked to cognition and inflammation. Am J Physiol Gastrointest Liver Physiol 2012;303:G675–85. [DOI] [PMC free article] [PubMed] [Google Scholar]
- 32.Chen Y, Yang F, Lu H, et al. Characterization of fecal microbial communities in patients with liver cirrhosis. Hepatology 2011;54:562–72. [DOI] [PubMed] [Google Scholar]
- 33.Patel VC, Shawcross DL. Salivary microbiota-immune profiling in cirrhosis: Could this be the noninvasive strategy that will revolutionize prognostication in hepatology? Hepatology 2015;62:1001–3. [DOI] [PubMed] [Google Scholar]
- 34.Bajaj JS, Idilman R, Mabudian L, et al. Diet affects gut microbiota and modulates hospitalization risk differentially in an international cirrhosis cohort. Hepatology 2018;68:234–247. [DOI] [PubMed] [Google Scholar]
- 35.Dubinkina VB, Tyakht AV, Odintsova VY, et al. Links of gut microbiota composition with alcohol dependence syndrome and alcoholic liver disease. Microbiome 2017;5:141. [DOI] [PMC free article] [PubMed] [Google Scholar]
- 36.Bosoi CR, Zwingmann C, Marin H, et al. Increased brain lactate is central to the development of brain edema in rats with chronic liver disease. J Hepatol 2014;60:554–60. [DOI] [PubMed] [Google Scholar]
- 37.Bajaj JS, Heuman DM, Hylemon PB, et al. Randomised clinical trial: Lactobacillus GG modulates gut microbiome, metabolome and endotoxemia in patients with cirrhosis. Aliment Pharmacol Ther 2014;39:1113–25. [DOI] [PMC free article] [PubMed] [Google Scholar]
- 38.Salminen MK, Rautelin H, Tynkkynen S, et al. Lactobacillus bacteremia, clinical significance, and patient outcome, with special focus on probiotic L. rhamnosus GG. Clin Infect Dis 2004;38:62–9. [DOI] [PubMed] [Google Scholar]
- 39.Reynolds LA, Smith KA, Filbey KJ, et al. Commensal-pathogen interactions in the intestinal tract: lactobacilli promote infection with, and are promoted by, helminth parasites. Gut Microbes 2014;5:522–32. [DOI] [PMC free article] [PubMed] [Google Scholar]
- 40.Xu X, Zhang X. Effects of cyclophosphamide on immune system and gut microbiota in mice. Microbiol Res 2015;171:97–106. [DOI] [PubMed] [Google Scholar]
- 41.Rios-Covian D, Sanchez B, Salazar N, et al. Different metabolic features of Bacteroides fragilis growing in the presence of glucose and exopolysaccharides of bifidobacteria. Front Microbiol 2015;6:825. [DOI] [PMC free article] [PubMed] [Google Scholar]
- 42.Morrison DJ, Preston T. Formation of short chain fatty acids by the gut microbiota and their impact on human metabolism. Gut Microbes 2016;7:189–200. [DOI] [PMC free article] [PubMed] [Google Scholar]
- 43.Wikoff WR, Anfora AT, Liu J, et al. Metabolomics analysis reveals large effects of gut microflora on mammalian blood metabolites. Proc Natl Acad Sci U S A 2009;106:3698–703. [DOI] [PMC free article] [PubMed] [Google Scholar]
- 44.Zhang Z, Zhai H, Geng J, et al. Large-scale survey of gut microbiota associated with MHE Via 16S rRNA-based pyrosequencing. Am J Gastroenterol 2013;108:1601–11. [DOI] [PubMed] [Google Scholar]
- 45.Bajaj JS, Acharya C, Fagan A, et al. Proton Pump Inhibitor Initiation and Withdrawal affects Gut Microbiota and Readmission Risk in Cirrhosis. Am J Gastroenterol 2018. [DOI] [PubMed]
- 46.Bajaj JS, Betrapally NS, Hylemon PB, et al. Gut Microbiota Alterations can predict Hospitalizations in Cirrhosis Independent of Diabetes Mellitus. Sci Rep 2015;5:18559. [DOI] [PMC free article] [PubMed] [Google Scholar]
- 47.Chen Y, Guo J, Qian G, et al. Gut dysbiosis in acute-on-chronic liver failure and its predictive value for mortality. J Gastroenterol Hepatol 2015. [DOI] [PubMed]
- 48.Bajaj JS, Fagan A, Sikaroodi M, et al. Liver transplant modulates gut microbial dysbiosis and cognitive function in cirrhosis. Liver Transpl 2017;23:907–914. [DOI] [PubMed] [Google Scholar]
- 49.Bajaj JS, Vargas HE, Reddy KR, et al. Association Between Intestinal Microbiota Collected at Hospital Admission and Outcomes of Patients with Cirrhosis. Clin Gastroenterol Hepatol 2018. [DOI] [PubMed]
Associated Data
This section collects any data citations, data availability statements, or supplementary materials included in this article.