Abstract
Access to DNA packaged in nucleosomes is critical for gene regulation, DNA replication and repair. In humans, the UV-DDB complex detects ultraviolet light induced pyrimidine dimers throughout the genome, yet it remains unknown how these lesions are recognised in chromatin, where nucleosomes restrict DNA access. Here we report cryo-electron microscopy structures for UV-DDB bound to nucleosomes bearing a 6-4 pyrimidine-pyrimidone dimer, and a DNA damage mimic at a variety of positions. We find that UV-DDB binds UV damaged nucleosomes at lesions located in the solvent-facing minor groove without affecting the overall nucleosome architecture. For buried lesions facing the histone core, UV-DDB changes the predominant translational register of the nucleosome, and selectively binds the lesion in an accessible, exposed, position. These findings explain how UV-DDB detects occluded lesions in strongly positioned nucleosomes. We identify slide-assisted site-exposure (SAsSE) as a mechanism for high-affinity DNA-binding proteins to access otherwise occluded sites in nucleosomal DNA.
Chromatin occludes DNA, impeding DNA repair1,2. Exposure of DNA to ultraviolet light (UV) induces formation of pyrimidine dimers, such as 6-4 pyrimidine-pyrimidone photoproducts (6-4PPs) and cyclobutane-pyrimidine dimers (CPDs), in all regions of the chromatinised mammalian genome3. Nucleosome core particles comprise 145 bp to 147 bp of B-form DNA wrapped in 1.6-1.7 lefthanded turns around the histone octamer protein core that is formed by two copies of H2A, H2B, H3 and H44,5. This configuration leaves only a fraction of the nucleosomal DNA accessible to binding factors.
In the global genome repair branch of the nucleotide excision repair pathway, UV-lesions are primarily detected by the protein complexes XPC-RAD23-CETN2, and UV-DDB6. UV-DDB, which is composed of the proteins DDB1 and DDB2, operates in conjunction with the DDB1-associated cullin-RING E3 ubiquitin ligase CUL4A/B7. Following UV-damage recognition, the CUL4A/B ubiquitin ligase is activated8 and nearby proteins including histones are ubiquitinated9. All available data suggest that UV-DDB binding precedes binding of the chromatin remodelling machinery and XPC10–12, and that DDB2 engages DNA lesions irrespective of their location in nucleosomes or linker regions13,14. The DDB2 gene is specifically mutated in patients belonging to the genetic complementation group E of xeroderma pigmentosum (XP)15, a rare congenital DNA repair disorder characterised by extreme UV sensitivity and an approximately 10,000-fold increased incidence of skin cancer16.
Although the structural basis of UV DDB binding to UV-damaged double stranded DNA is well understood14,17,18, it is currently unclear how UV-lesions in the nucleosome are recognised given the access restrictions imposed by the nucleosomal architecture. Two possibilities have been suggested: DNA recognition after DNA looping off from the histone octamer in a process termed site-exposure19, and access mediated by ATP-driven nucleosome remodelling1. Accessing nucleosomal DNA is not only fundamental for DNA repair, but concerns all proteins that bind DNA in a chromatinised genome, such as pioneer transcription factors20. We set out to understand how UV-lesions at varied positions in nucleosomal DNA are recognised by UV-DDB, and define the principles for protein access to chromatinised DNA templates.
Results
Read-out of an exposed UV-lesion
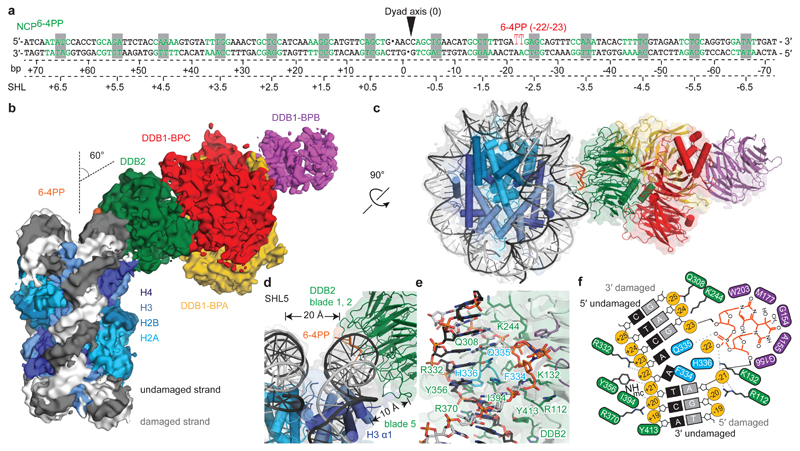
To determine structures of UV-DDB in complex with nucleosomes containing pyrimidine dimers, we assembled octameric nucleosome core particles (NCPs) from synthetic 145 bp human α-satellite DNA and the human core histone proteins H2A, H2B, H3.1, and H4. The forward DNA strand contained either a single 6-4PP lesion (Fig. 1a) or a damage mimic comprising two consecutive tetrahydrofuran nucleotide abasic sites (THF2), which is a known UV-DDB ligand21,22. We prepared a 6-4PP nucleosome with the lesion -22/-23 bp from the dyad axis (NCP6-4PP) to maximise the UV-DDB affinity22 The complex of NCP6-4PP and full-length recombinant human UV-DDB (NCP6-4PP-UV-DDB) resulted in a 4.3 Å resolution single-particle cryo-EM reconstruction (Fig. 1b, c and Extended Data Fig. 1a-g). The 6-4PP lesion is situated next to histone H3 α-helix α1 near residues 64-84 (Extended Data Fig. 1h, i). The primary contacts were between the DDB2 propeller and the nucleosome minor groove at superhelix locations (SHLs) -2 and -3 with DDB2 angled ~60° in respect to a plane parallel to the nucleosomal disc (Fig. 1b), while the DDB2 N-terminal region (residues 1-54) was disordered (Extended Data Fig. 1j, k)18. DDB1 projects away from the nucleosome core and does not interact with the nucleosome (Fig. 1b-d).
Figure 1. Cryo-EM structure of the NCP6-4PP-UV-DDB complex.
a, DNA sequence with a 6-4PP placed -22/-23 bp from the dyad axis. b, NCP6-4PP-UV-DDB cryo-EM map at 4.3 Å resolution. c, d, NCP6-4PP-UV-DDB domain architecture (cartoon). DDB2 blade 1 (residues 150-156), blade 2 (residues 195-200) and blade 3 (residues 360-370). e, Close-up of the DDB2 β-hairpin loop (cyan) and 6-4PP lesion (orange), with damaged (light grey) and undamaged (dark grey) DNA strands shown. c, d, e Surface depiction of the 4.3 Å resolution cryo-EM map (Extended Data Fig. 4a, b). f, Schematic representation.
Applying focused refinement methods, we obtained an improved map at 4.2 Å resolution by masking out DDB1 (Extended Data Fig. 1d). Sidechains of positively charged residues in DDB2 (Arg112, Arg332, Arg370, Lys132 and Lys244) engage the DNA backbone over 6 bp (-20 bp to -25 bp from the dyad axis) together with hydrogen bonding and hydrophobic stacking interactions by Gln308, Tyr356, Ile394 and Tyr413 (Fig. 1e, f). DDB2 binds the minor groove around the lesion and inserts the β-hairpin loop composed of residues Phe334-Gln335-His336 as part of its recognition mechanism17. Insertion of the β-hairpin requires the 6-4PP to be extruded into an extra-helical conformation, with DDB2 residues Gln335 and His336 stabilising the two orphaned bases opposite the extruded lesion (adenines 50 and 51)14,17 (Fig. 1e, f and Extended Data Fig. 1i). UV-DDB binding triggers local DNA distortions around the lesion17 that are not found for NCP6-4PP in isolation (Extended Data Fig. 2a-f).
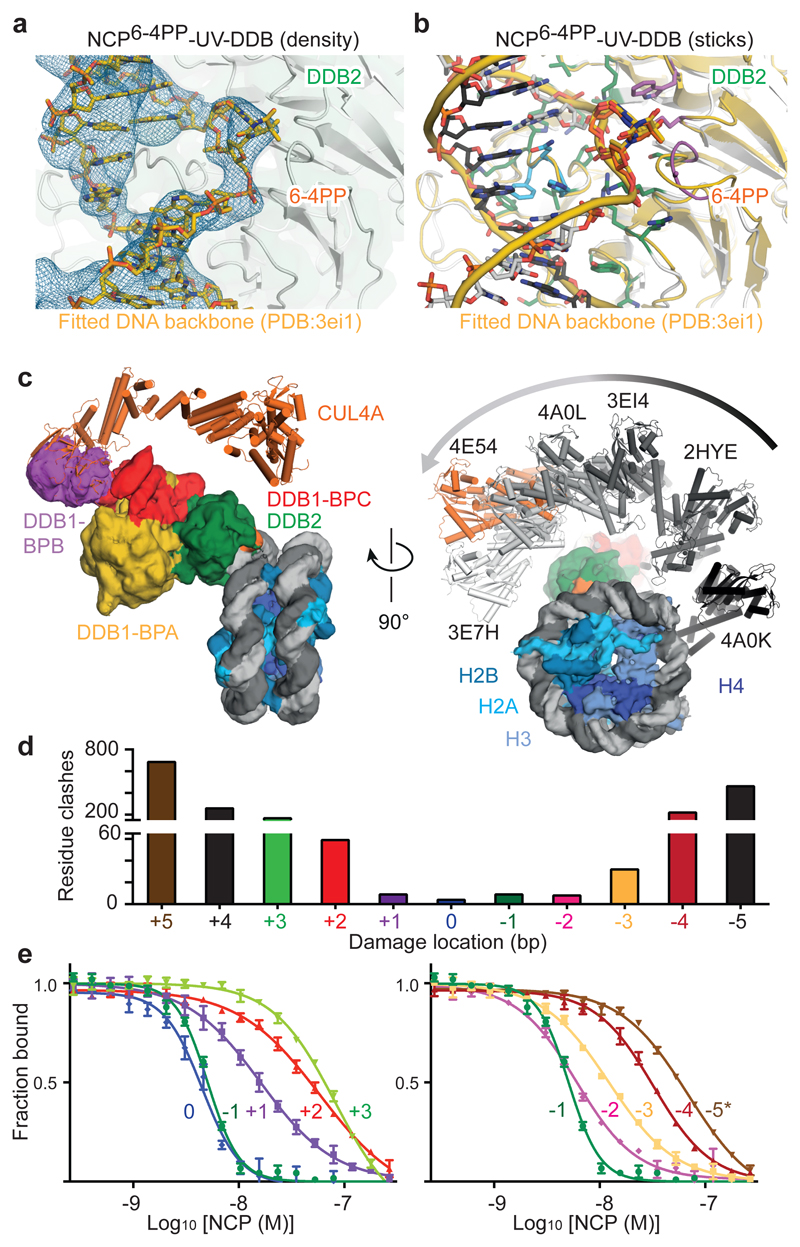
Comparison of UV-DDB bound to a 6-4PP-containing nucleosome and an isolated 6 4PP-containing DNA duplex17 (Fig. 2a), revealed that most UV-DDB/DNA contacts are conserved between the two structures. Furthermore, the mechanism of recognition for UV-damaged nucleosomes does not differ from that found for isolated DNA duplexes harbouring pyrimidine dimers14 (Fig. 2b).
Figure 2. Mechanism of damage recognition.
a, b Overlay of the NCP6-4PP-UV-DDB cryo-EM structure and a crystal structure of DDB2-bound 6 4PP DNA (PDB entry 3EI1)14. c, Model showing the rotation of the CRL4DDB2 E3 ligase around the nucleosome (NCP6-4PP) based on different DDB1 structures (PDB entries indicated). d, Clash scores calculated from predicted UV-DDB-human α-satellite nucleosome complexes (Methods). e, Fluorescence polarisation competition dose response curves. Labelled DNA is competed off with increasing amounts of unlabelled nucleosome (position -5* corresponds to THF2 at -16/-17, Methods). All data include three technical replicates (n = 3) and are shown as mean ± s.d..
UV-DDB recognises CPD, 6-4PP and abasic sites through a shared mechanism14,17,21. Our 3.9 Å resolution structure of UV-DDB bound to a nucleosome containing a THF2 at position -22/-23 (NCPTHF2-UV-DDB) describes a configuration that is essentially indistinguishable from NCP6-4PP-UV-DDB (map-correlation coefficient 0.94) (Extended Data Fig. 3a-h and Extended Data Fig. 4a-c). Because UV-DDB also detects CPDs in nucleosomes (NCPCPD) (Extended Data Fig. 3i, j), we expect UV-DDB to recognise nucleosomal CPDs in the same manner as 6-4PP and THF2.
The DDB1 B-domain, which is the second of the three WD40 propeller domains in the protein, is partially disordered in our nucleosome structure, as expected given its rotational mobility14,17. The features in the cryo-EM map for the DDB1 B-domain blades 1, 2, 3, 6, and 7 were sufficiently defined to place a coordinate model of this domain. This in turn allowed positioning of the CUL4 ligase arm, leading to a model of the CRL4DDB2 E3 ligase complex bound to a nucleosome (Fig. 2c). The rotation of the ligase around the nucleosome core explains the ubiquitination of nearby histone tails and diverse core histones as reported previously9,14,17,23,24.
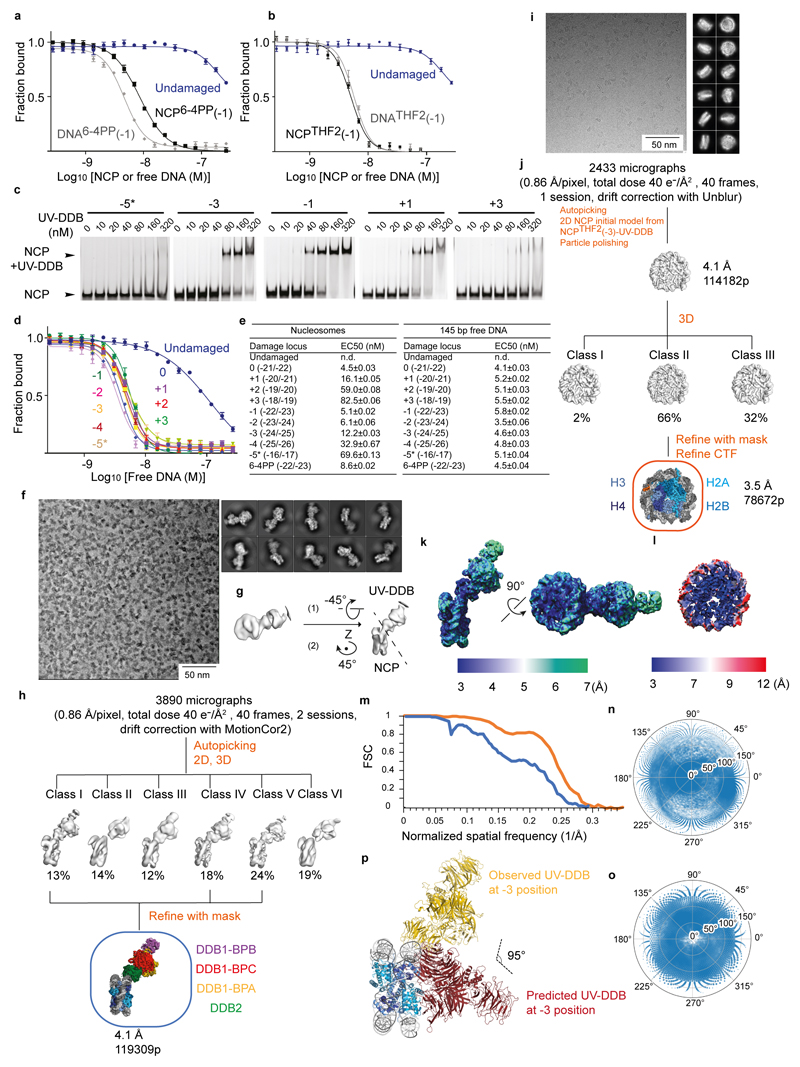
To quantify UV-DDB binding to nucleosomes, we developed a fluorescence polarisation (FP) competition assay, in which 10 nM Cy5-labelled 15 bp oligonucleotide with a single THF abasic nucleotide damage site (Cy5-15-bp-DNATHF) was incubated by 10 nM UV-DDB. The complex of UV-DDB with the labelled DNA was then competed off with increasing amounts of unlabelled nucleosomes. Using this assay, we found that UV-DDB binds nucleosomes carrying 6-4PP at position -22/-23 with a half maximum effective concentration (EC50) that is only 1.9-fold lower than the affinity between UV-DDB and the identical nucleosome-free DNA (Extended Data Fig. 5a). Additionally, UV-DDB had indistinguishable apparent affinities for nucleosome-free 145 bp DNA or nucleosomal DNA containing an THF2 double abasic site mimic (Extended Data Fig. 5b). DNA damage recognition by UV-DDB at these solvent-exposed nucleosomal positions is therefore not obstructed by the nucleosome.
Read-out of occluded UV-lesions
To examine the expected UV-DDB accessibility to damaged loci beyond the exposed minor groove position -22/-23, we modelled UV-DDB binding to the fraction of nucleosomal DNA covering SHL-1.5 to SHL-2.5 and calculated the extent of steric clashes between UV-DDB and the nucleosome (Fig. 2d, see Methods). The overall distribution of clash scores along the superhelix segment (SHL-1.5 to SHL-2.5) has a U-shaped profile, with UV-DDB best accommodated at the solvent-facing minor groove, as described by its cryo-EM structure (Fig. 1). Severe steric clashes are predicted when the lesion is positioned away from the solvent face towards the nucleosome core. We define the high-accessibility locus at the centroid of the U-shaped profile (-21/-22) as position 0 and subsequently refer to the neighbouring -22/-23 position used for structure determination (Fig. 1) as the -1 position.
We next examined THF2 lesions at different sites proceeding and succeeding SHL-2 using electrophoretic mobility shift assays (EMSAs) (Extended Data Fig. 5c) and fluorescence polarisation competition (Fig. 2e and Extended Data Fig. 5d, e). Nucleosomes with lesions positioned 1 bp to 4 bp upstream or downstream of the -1 position retained UV-DDB binding, albeit with decreasing binding strength (EC50) up to 20-fold, as the lesion is moved away from the solvent-exposed locus towards the histone core (Fig. 2e and Extended Data Fig. 5e). The highest affinity site was the 0 position, which also had the highest predicted accessibility (Fig. 2d). On the other hand, UV-DDB showed no relative difference in binding affinities for THF2 sites located on a free 145 bp DNA duplex (Extended Data Fig. 5d, e). Nucleosomes thereby render inward-facing lesions less accessible to DDB2, in line with predicted steric clashes (Fig. 2d), although UV-DDB binding still occurs at these sites.
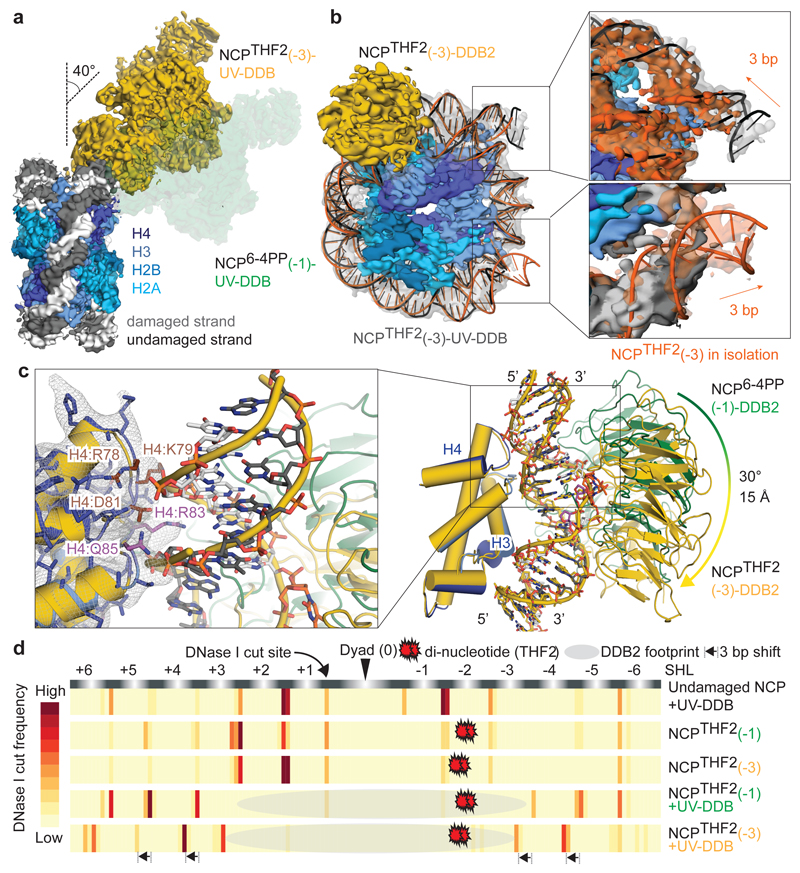
To elucidate how UV-DDB accommodates these clashes and achieves damage recognition at inward-facing sites, we set out to determine cryo-EM structures of an isolated NCP with THF2 located at position -3 (NCPTHF2(-3)) and its complex with UV-DDB (NCPTHF2(-3)-UV-DDB). The resulting cryo-EM maps were calculated at 3.5 Å and 4.1 Å resolution, respectively (Extended Data Fig. 5f-o). In NCPTHF2(-3)-UV-DDB, DDB2 binds the damaged nucleosome without clashing with the core histones or the two DNA gyres (Fig. 3a). UV-DDB, however, approaches the nucleosome at an angle that differs from a predicted model by ~95° (Extended Data Fig. 5p). Furthermore, the DDB2 position in NCPTHF2(-3)-UV-DDB did not match the expected DNA register for the human α-satellite DNA repeat we observed earlier (Fig. 1b, c). Notably, the 145 bp DNA in NCPTHF2(-3)-UV-DDB is not wrapped symmetrically around the dyad axis of the nucleosome, with 72 bp on either side of 1 bp sitting on the axis. Instead, the DNA in NCPTHF2(-3)-UV-DDB shows an asymmetric 69 bp and 75 bp divide of the human α-satellite repeat bisected by the nucleosome dyad axis (Fig. 3b). In the repositioned DNA register, the lesion at position -3 (-24/-25 from the dyad axis) instead corresponds to UV-DDB located -21/-22 bp from the dyad axis. Repositioning of the DNA register avoids predicted clashes between UV-DDB and the nucleosome and allows binding (Fig. 2d, e). Intriguingly, the lesion in the repositioned register coincides with the high-affinity/high-accessibility 0 position locus.
Figure 3. DNA register of the -3 nucleosome shifts in the presence of UV-DDB.
a, Superposition of NCPTHF2(-3)-UV-DDB (yellow) and NCP6-4PP(-1)-UV-DDB (green). b, Overlay of NCPTHF2(-3)-UV-DDB (grey) and the isolated NCPTHF2(-3) (orange) nucleosome highlighting the 3 bp translational DNA register shift. c, Overlay of NCP6 4PP(-1)-UV-DDB (green, DNA as white and black sticks) with NCPTHF2(-3)-UV-DDB (yellow, DNA as yellow cartoon and sticks). d, DNase I footprinting assays coupled to single molecule DNA sequencing show DNase I accessible sites are shifted by 3 bp for NCPTHF2(-3) in the presence of UV-DDB in solution. Data are the mean of two replicates.
To understand whether the presence of the THF2 damage itself is sufficient to trigger the 3 bp translation of the human α-satellite DNA repeat, or whether the shift by 3 bp in the DNA/nucleosome register is promoted by UV-DDB binding, we compared the structures of the isolated NCPTHF2(-3) and its complex with UV-DDB (Fig. 3b). The 3 bp shift was only observed in the presence of UV-DDB. Beyond the lesion, all major DNA-histone contacts are maintained but are register shifted by precisely three nucleotides so that interactions between histones and nucleotides (n) are replaced by nucleotides (n-3) in the presence of UV-DDB (Fig. 3c).
UV-DDB shifts nucleosome DNA registers
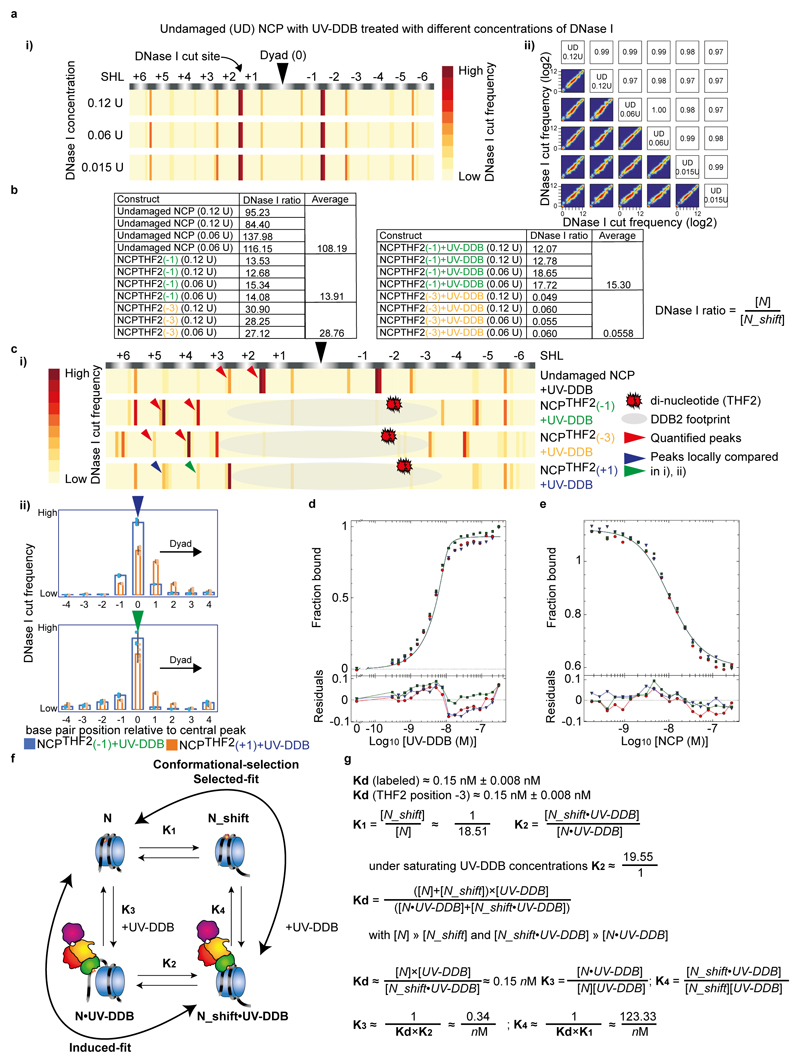
We next used an orthologues approach to examine the effect of UV-DDB on the THF2 nucleosome register in solution. DNase I digestion of lesion containing NCPs in the presence and absence of UV-DDB followed by next-generation sequencing allowed to define and count all nucleosome registers within the sample. As predicted from our structural studies, no register shift was observed for UV-DDB binding to the THF2(-1) nucleosome relative to the free THF2(-1) nucleosome (Fig. 3d and Extended Data Fig. 6a-c). Adding UV-DDB to the THF2(-3) nucleosome, on the other hand, produced a 3 bp register shift. Sequencing further enabled counting reads in different registers to determine the population ratio of unshifted (N) to register-shifted nucleosomes (N_shift). This revealed, for example, that the lesion itself has a small but measurable effect on phasing the DNA sequence (Extended Data Fig. 6b, f). The quantification further showed that in the presence of UV-DDB >96% of -3 nucleosomes adopt a shifted nucleosome register in solution, whereas only <5% of the free -3 nucleosomes assume this register shift in the absence of UV-DDB (see Extended Data Fig. 6d-g for thermodynamic dissection). In the presence of UV-DDB, a repositioning mechanism exists that moves predominantly occluded, histone-facing lesions into a rotational setting compatible with DDB2 read-out.
Register equilibrium at occluded sites
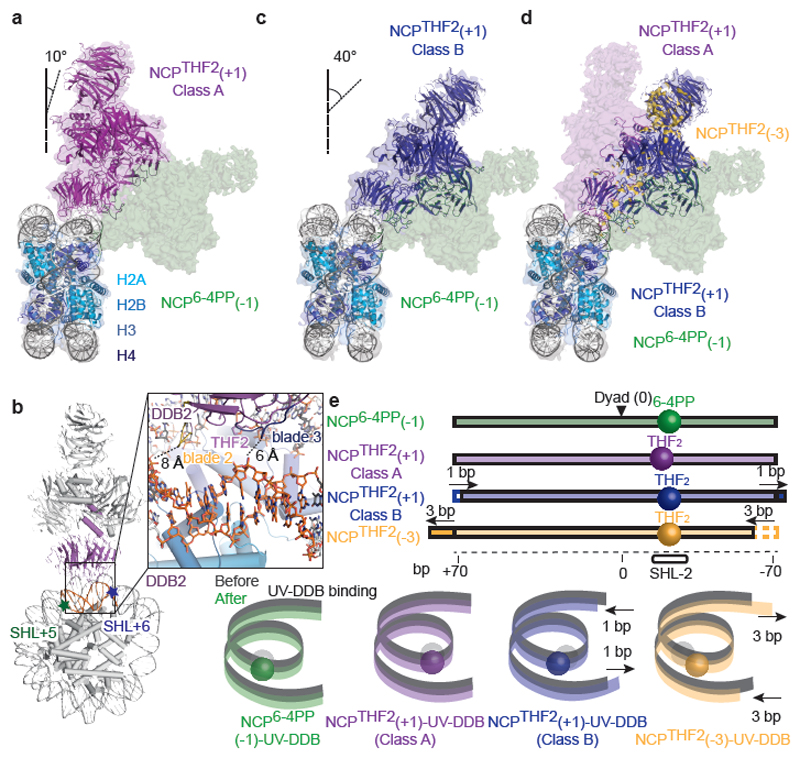
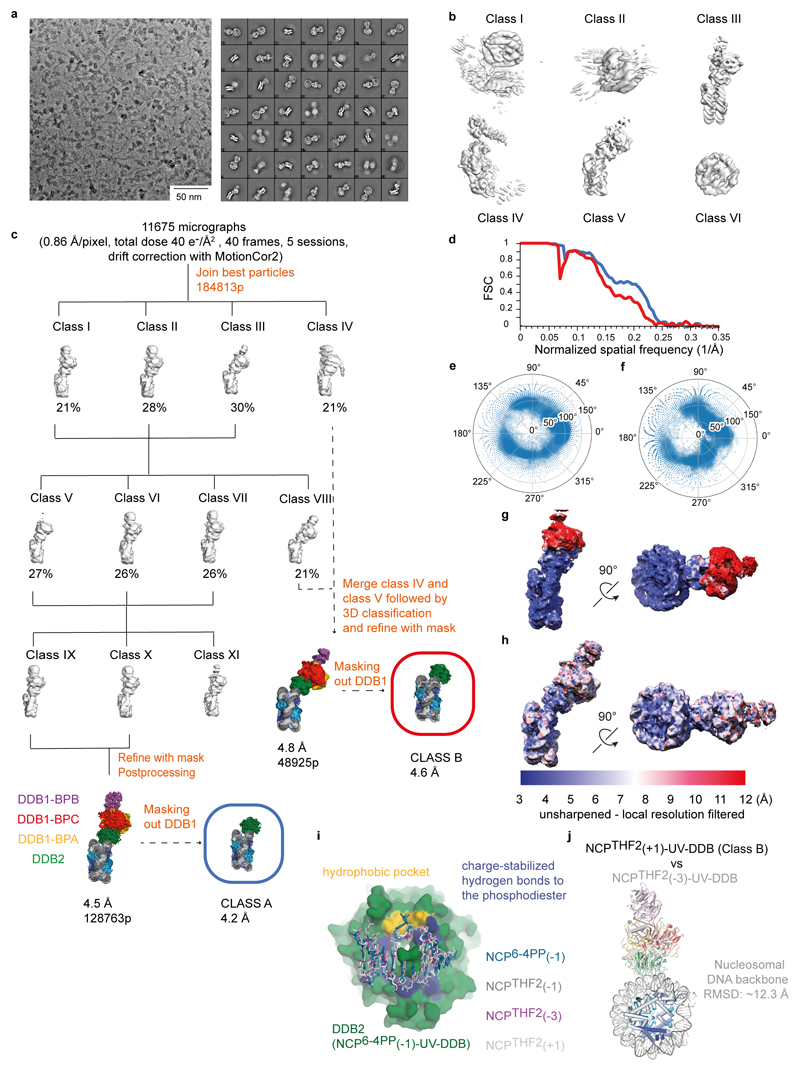
We next investigated a cryo-EM structure of UV-DDB bound to a nucleosome with THF2 lesion at position +1 (NCPTHF2(+1)-UV-DDB; -20/-21 from the dyad axis). Single-particle cryo-EM analysis including 3D classification led to two 3D reconstructions, referred to as NCPTHF2(+1)-UV-DDB Class A and NCPTHF2(+1)-UV-DDB Class B (Extended Data Fig. 7a-h), which describe two distinct conformations. In the final reconstruction, NCPTHF2(+1)-UV-DDB Class A includes ~2.6 × more particles than NCPTHF2(+1)-UV-DDB Class B, and its estimated resolution was 4.5 Å (4.2 Å after focused refinement) (Extended Data Fig. 7c). UV-DDB binds the minor groove at the +1-position tilted ~10° relative to the histone octamer disc (Fig. 4a). This places DDB2 blade 1 (residues 150-156) and blade 2 (residues 195-200) in very close proximity (6-8 Å) to the neighbouring DNA (Fig. 4b). The NCPTHF2(+1)-UV-DDB Class A binding mode agrees well with the predicted model (Fig. 2d) and did not require a DNA register shift.
Figure 4. Subpopulations of translational settings revealed by UV-DDB binding.
a, Structure of NCPTHF2(+1)-UV-DDB Class A (magenta) (Extended Data Fig. 7) superimposed on NCP6-4PP(-1)-UV-DDB (green). b, Close-up of NCPTHF2(+1)-UV-DDB Class A showing the proximity of DDB2 to DNA between SHL5 and SHL6 (orange). c, Comparison of NCPTHF2(+1)-UV-DDB Class B (blue) and NCP6-4PP(-1)-UV-DDB (green). d, Superimposition of NCPTHF2(+1)-UV-DDB (Class A and Class B), NCPTHF2(-3)-UV-DDB (yellow), and NCP6-4PP(-1)-UV-DDB, showing bidirectional register shifting towards a common locus. e, Schematic representation of DNA with lesions indicated by spheres (sequences in Extended Data Fig. 8a).
The smaller subpopulation of particles used to calculate the NCPTHF2(+1)-UV-DDB Class B model led to a 4.8 Å resolution cryo-EM structure (4.6 Å after focused refinement) (Fig. 4c and Extended Data Fig. 7c). Superposition of NCPTHF2(+1)-UV-DDB Classes A and B revealed a difference in the translational setting of the nucleosomal DNA by +1 bp to account for the well-defined-DDB2 (Fig. 4d). Thus, UV-DDB in NCPTHF2(+1)-UV-DDB Class B is present in an apparent 0 register (-21/-22 bp from the dyad axis). The translational setting in NCPTHF2(+1)-UV-DDB Class B matches the one in the repositioned NCPTHF2(-3)-UV-DDB structure (Extended Data Fig. 7i, j). UV-DDB exists in an equilibrium between the +1-position (NCPTHF2(+1)-UV-DDB Class A), and a register-shifted population with the lesion in the highly accessible 0 position (NCPTHF2(+1)-UV-DDB Class B) (Fig. 2d). The DNase I assay on the UV-DDB bound +1 nucleosome also identified an increased population of α-satellite DNA molecules shifted by 1 bp towards the dyad axis compared to the -1 nucleosome (Extended Data Fig. 6c), consistent with the register shifted subpopulation seen by cryo-EM.
In NCPTHF2(-3)-UV-DDB, the DNA register moved by 3 bp towards the dyad axis in respect to the NCPTHF2(-1)-UV-DDB structure, whereas for NCPTHF2(+1)-UV-DDB Class B the register moved 1 bp away from the dyad axis (Fig. 4e and Extended Data Fig. 8a). The precise nucleosome register stabilised by UV-DDB and the bidirectional DNA movement thus depend on the position of the lesion.
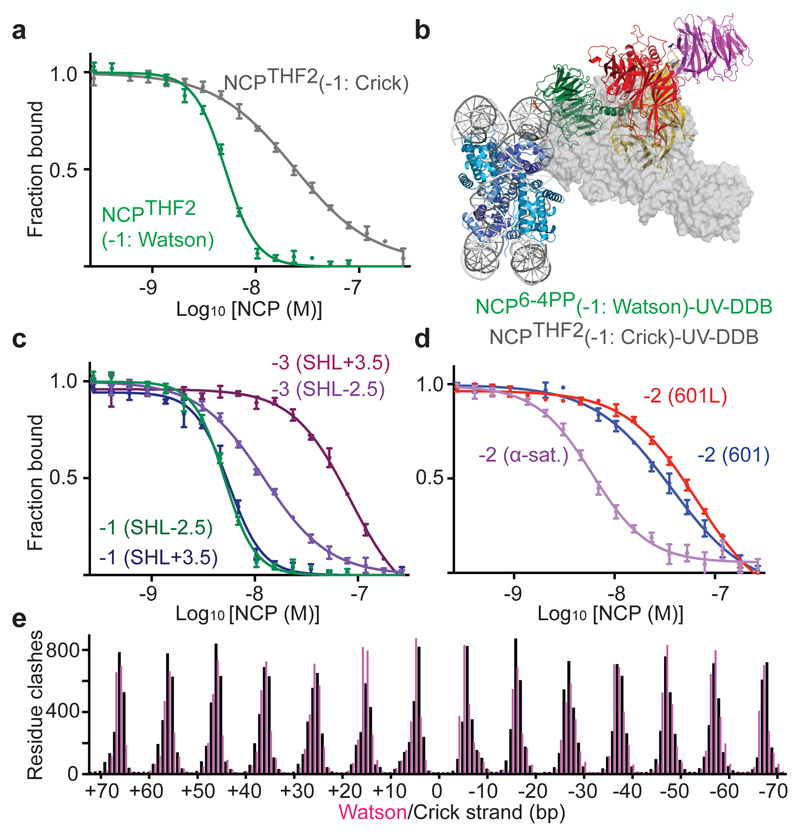
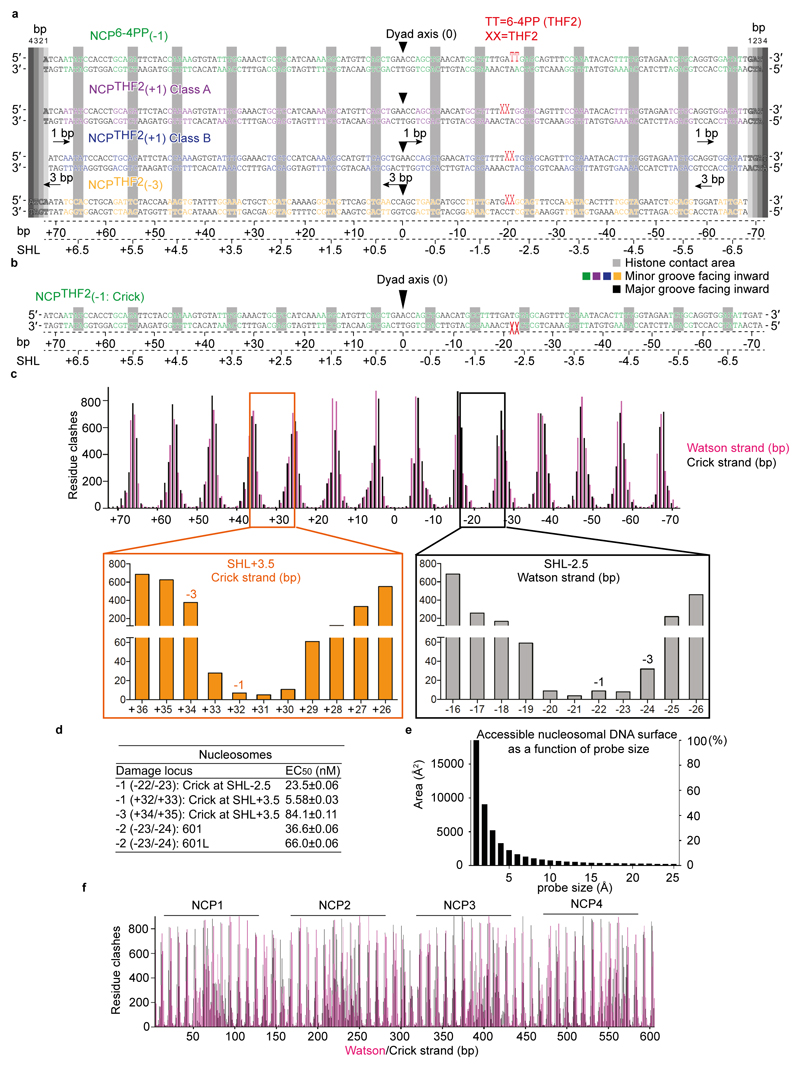
We next investigated whether the UV-DDB affinity for nucleosomes is sensitive to the strand on which a DNA lesion is situated. Previously, we used only nucleosomes with DNA lesions on the Watson strand. UV-DDB bound nucleosomes containing a -1-position THF2 on the Crick rather than Watson strand with a ~4.7-fold lower EC50, indicating weakened binding (Fig. 5a, b and Extended Data Fig. 8d). Accordingly, a THF2 modelled on the Crick strand binds UV-DDB by ~180° relative to the -1 structure and translates it more closely towards the histone octamer (Fig. 5a, b and Extended Data Fig. 8b). We also examined the effect of transpositioning lesions from the Watson strand in SHL-2.5 to the reverse complement Crick strand in SHL+3.5. The -1-position lesions had indistinguishable accessibility and affinities in SHL-2.5 and SHL+3.5, the -3 positions, on the other hand, had lower relative affinity and more predicted clashes in SHL+3.5 than in SHL-2.5 (Fig. 5c and Extended Data Fig. 8c, d). We also examined the impact of the nucleosomal positioning strength. In the 601 and 601L positioning sequences, both more strongly positioning than α-satellite25, a lesion at the predicted -2 position in 601/601L was less tightly bound than its α-satellite counterpart (Fig. 5d and Extended Data Fig. 8d). The local environment, the accessibility of the lesions, and the strength of nucleosome–DNA contacts thus govern the affinity of UV-DDB for damage in chromatin.
Figure 5. Principles governing DNA damage recognition in chromatin.
a, As in Fig. 3c, dose response curves for NCPTHF2(-1) with a THF2 on opposing strands. b, Model of NCPTHF2(-1)-UV-DDB with THF2 on opposing Crick strand. c, As in a, but with the THF2 at position -1 or -3 in SHL+3.5 on the Crick strand versus SHL-2.5 on the Watson strand and d, with a position -2 THF2 in α-satellite versus 601 or 601L DNA. Data are technical replicates (n = 3) shown as mean ± s.d.. e, Predicted UV-DDB docking clashes on the Watson (pink) and Crick (black) nucleosomal DNA strands (Methods).
Discussion
The nucleosomal architecture, with two DNA gyres wrapped around a histone octamer core, imposes a spatial barrier that severely restricts protein access to DNA-embedded pyrimidine dimers (Extended Data Fig. 8e).
In chromatinised DNA, nucleosomal pyrimidine dimers show a slight positional preference for solvent-exposed minor grooves26,27, where they are also more rapidly repaired28. We demonstrate that UV-DDB can identify these lesions directly with high affinity. On the other hand, lesions at inward-facing positions inaccessible to solvent are also recognised although with one or two orders of magnitude lower apparent affinity. In nucleosomes, accessible lesions are bound by UV-DDB directly whereas occluded sites require additional steps to select for a predominantly register shifted form of the nucleosome. A nucleosome with a THF2 lesion at the inward-facing -3 position (Fig. 3a, c), for example, is present predominantly in an unshifted, canonical α-satellite DNA register in the absence of UV-DDB, and only translates into a predominantly 3-bp-shifted register in its presence (Extended Data Fig. 6f). Partially accessible lesions, for example cases where DDB2 binds but is placed in close proximity to the nucleosome with potential repulsive interactions, as found for NCPTHF2(+1)-UV-DDB, are present in an equilibrium between shifted and unshifted registers.
Exploiting nucleosome register dynamics29,30, UV-DDB binding enforces a nucleosomal register in a bidirectional manner. Detecting occluded nucleosomal lesions by UV-DDB occurs in manner that is independent of ATP-driven chromatin remodellers in vitro and does not require octamer disassembly or looping off of nucleosomal DNA (site exposure)19. Instead, UV-DDB overcomes the intrinsic phasing power of the strongly positioned human α-satellite DNA repeat and after sliding helps stabilise the lesion in an accessible locus. We designate this mechanism of DNA damage read-out slide-assisted site-exposure (SAsSE).
For lesions located around SHL-2 we find a preferred SAsSE repositioning locus at position 0 (-20/-21 bp from the dyad axis), where less accessible lesions downstream and upstream reposition when bound by UV-DDB. The same principles seem to apply to SHL+3. We hypothesise that each superhelix segment, with its U-shaped predicted accessibility profile, has a favoured low-energy locus within its outward-facing minor groove to which lesions reposition through SAsSE to minimise steric clashes (Extended Data Fig. 8c). In what is likely attributable to the local asymmetry of nucleosomes, we find that changing the strand (Fig. 5a, b and Extended Data Fig. 8b, d), or the location of a lesion from one SHL to another (Fig. 5c and Extended Data Fig. 8c, d), affects UV-DDB accessibility, the extent of SAsSE and the apparent affinity. A similar SAsSE mechanism can also be invoked for damage recognition of pyrimidine dimers in the context of multiple nucleosomes (Extended Data Fig. 8f).
We envisage SAsSE activity to be shared by other high-affinity DNA-binding proteins. A transcription factor able to bind a nucleosomal site with sufficient affinity should similarly be able to enforce its binding register. Whereas remodeller-mediated nucleosome eviction, and nucleosome dynamic based site-exposure20 (Extended Data Fig. 6f) are established mechanisms for accessing nucleosomal DNA, our findings point to SAsSE as an additional strategy whereby occluded loci can be accessed through translational register changes. Our work presents a structural and mechanistic framework for UV-damage recognition in chromatin and further explains how other DNA-binding proteins, such as transcription factors, in principle access nucleosomal DNA.
Methods
Human histone preparation
Human histones were expressed and purified as described previously22. A DNA fragment encoding the histone H2B/T122C mutant, in which Thr122 was replaced by cysteine using site-directed mutagenesis, was prepared as described previously22. Reconstitution of the H2A-H2B/T122C complex, the H3.1-H4 complex, and the histone octamer were performed as described previously22. Lyophilized histones were mixed equally in 20 mM Tris-HCl pH 7.5) buffer, containing 7 M guanidine hydrochloride and 20 mM 2-mercaptoethanol. Samples were dialysed against 2 M NaCl, 10 mM Tris-HCl pH 7.5, 1 mM EDTA, 2 mM 2-mercaptoethanol. The resulting histone complexes were purified by size exclusion chromatography (Superdex 200; GE Healthcare).
DNA preparation
Oligonucleotides containing 6-4 photoproduct (6-4PP) or cyclobutane-pyrimidine dimer (CPD) were synthesised from 6-4PP31 or CPD building block (Glen Research). Oligonucleotides containing tetrahydrofuran (THF) were purchased from Sigma. By mixing with complementary oligonucleotides in 1:1 ratio, damaged double strand DNA was formed. After heating to 95°C for 5 min, the DNA was annealed by slow cooling down to RT, damaged and undamaged DNA duplexes were then ligated by T4 DNA ligase (New England BioLabs)22. Ligated DNA was purified by native polyacrylamide gel electrophoresis using a Prep Cell (Bio-Rad) in TE buffer (10 mM Tris-HCl pH 7.5 and 100 μM EDTA). The damage location of these DNAs is described in Fig. 1a. The -5 position in SHL-2 (-26/-27) is structurally equivalent to the +5 position at the -16/-17 position in SHL-1. Because -26/-27 could not be stably assembled, we used -16/-17 in the neighbouring SHL instead (designated -5*).
Nucleosome assembly
The DNA and histone octamer complex were mixed in a 1:1.5 molar ratio in the presence of 2 M KCl. The samples were dialysed against refolding buffer (RB) high (10 mM Tris-HCl pH 7.5, 2 M KCl, 1 mM EDTA, and 1 mM DTT). The KCl concentration was gradually reduced from 2 M to 0.25 M using a peristaltic pump with RB low (10 mM Tris-HCl (pH 7.5), 250 mM KCl, 1 mM EDTA, and 1 mM DTT) at 4°C. Samples were further dialysed against RB low buffer at 4°C overnight. Reconstituted nucleosomes were incubated at 55°C for 2 h followed by purification on native polyacrylamide gel electrophoresis using a Prep Cell apparatus (Bio-Rad) in TCS buffer (10 mM Tris-HCl (pH 7.5) and 250 μM TCEP) to remove non-specific complexes formed between free DNA and histones.
UV-DDB preparation
Human wild-type DDB1, wild-type DDB2, and a DDB2 variant lacking amino acids 1-40 (ΔN(DDB2)) were subcloned into pAC-derived vectors32. The complex of DDB1 and ΔN(DDB2) is referred to as UV-DDB/ΔN. Recombinant proteins were expressed in 8 L cultures of Trichoplusia ni High Five cells using the Bac-to-Bac system (Thermo Fischer). Cells were cultured at 27°C, harvested 2 days after infection, resuspended in lysis buffer (50 mM Tris-HCl pH 8.0, 500 mM NaCl, 100 μM phenylmethylsulfonyl fluoride, 1 × protease inhibitor cocktail (Sigma), 250 μM TCEP), and lysed by sonication. After centrifugation the supernatant was harvested and the UV-DDB protein complex was extracted by Streptactin affinity chromatography (IBA) exploiting N-terminal Strep-tags on both DDB1 and DDB2, and then purified by POROS S ion exchange chromatography (GE Healthcare). UV-DDB was further purified by size exclusion chromatography (Superdex 200; GE Healthcare) in GF buffer (50 mM HEPES pH 7.4, 150 mM NaCl, 250 μM TCEP). Purified protein was concentrated and stored at -80°C.
Fluorescent labelling of the H2A-H2B complex
This assay follows the labelling methodology previously described in22. The reaction was conducted in the presence of H2A-H2B/T122C (104 μM) with Alexa Flour 488 C5 Maleimide (558 μM (1 mg) dissolved in 200 µl DMSO) (Thermo Fisher), at room temperature for 2 h, in a reaction solution containing 10 mM Tris-HCl pH 7.5, 2 M NaCl, 1 mM EDTA, 1 mM TCEP. The reaction was terminated by the addition of 159 mM 2-mercaptoethanol, followed by dialysis against 10 mM Tris-HCl pH 7.5 buffer containing 2 M NaCl, 1 mM EDTA, and 5 mM 2-mercaptoethanol.
Electrophoretic mobility shift assays
Fluorescent labelled nucleosome (40 nM) was mixed with UV-DDB (0, 10, 20, 40, 80, 160 and 320 nM). The reactions were conducted in BB buffer (20 mM Tris-HCl pH 7.5), containing 150 mM NaCl, 3.4 mM MgCl2, 1.4 mM EDTA, 0.014% Triton X-100, 0.1 mg/ml BSA, and 1 mM DTT and incubated on ice for 30 min. After the incubation, the samples were analysed by electrophoresis on a 6% non-denaturing polyacrylamide gel (acrylamide:bis = 37.5:1) in 0.5 × TGE buffer (12.5 mM Tris base, 96 mM glycine, and 500 μM EDTA), and the bands were visualised with a Typhoon imaging analyser (GE Healthcare).
Fluorescence polarisation (FP) assays
Cy5-labelled 15 bp damaged DNA (5’-AATGAATXAAGCAGG-3’ and 5’-CCTGCTTTATTCATT-3’: X=THF) was used as a fluorescent tracer. Increasing amounts of UV-DDB (0.3-200 nM) were mixed with tracer (10 nM final concentration) in a 384-well microplate (Greiner, 784076) and incubated for 5 min at room temperature. The interaction was measured in a buffer containing 50 mM HEPES pH 7.4, 250 μM TCEP, 150 mM NaCl, 0.1% (v/v) pluronic acid. Change in FP was monitored by a PHERAstar microplate reader (BMG Labtech) equipped with a FP filter unit. The polarisation units were converted to fraction bound as described previously33. The fraction bound versus UV-DDB concentration was plotted and fitted assuming a one-to-one binding model to determine the dissociation constant (Kd) using Prism (GraphPad).
For the competitive titration assays the UV-DDB bound to the fluorescent oligo tracer was back-titrated with nucleosomes containing different lesions at different sites. The competitive titration experiments were carried out by 10 nM mixing tracer, 10 nM UV-DDB and increasing concentrations of different nucleosomes or DNA (0.27 nM to 267 nM). The fraction bound versus the nucleosome concentration and EC50 values were plotted, and the data fitted assuming a one-to-one binding model in Prism (GraphPad). Kd values were fitted by numerical integration as implemented in DynaFit34. Three technical replicates were measured for each reaction.
Kd determination for interaction of UV-DDB with NCPTHF2(-3)-UV-DDB
The experimental set-up was identical to that of Cy5 competitive titrations, exploiting the Cy5 fluorescence polarization signal. In brief, 10 nM UV-DDB with the labelled oligo (Cy5-15-bp-DNATHF) was titrated to saturation with increasing concentrations of UV-DDB. The curves were numerically fitted to a model describing the binding isotherm as implemented in Dynafit34. For fitting, we fixed the concentration of UV-DDB and the label, and refined the Kd value, the offset and the fluorescence gain. We then set-up the competitive titration using 10 nM Cy5-15-bp-DNATHF and UV-DDB and titrated the complex with increasing concentrations of NCPTHF2(-3)-UV-DDB. The two isotherms, for UV-DDB binding to the label and that for UV-DDB engaging the unlabelled complex competing off the label, was implemented in Dynafit35. Numerical fitting was carried out with the Kd value for Cy5-15-bp-DNATHF fixed, and the Kd values for the NCPTHF2(-3)-UV-DDB complex, as well as gain and offset, were fitted. Given the tight binding of the UV-DDB to Cy5-15-bp-DNATHF with affinity constants ~10-fold lower than the concentration of the label, these values need to be viewed as an estimation, in line with the literature36.
DNase I nucleosome footprinting assay
Reconstituted nucleosome core particles (NCPs) with undamaged α-satellite DNA or carrying THF2 at position -1, -3 or +1 and purified human UV-DDB were mixed in a 1:1 molar ratio in GF buffer (50 mM HEPES pH 7.4, 50 mM NaCl and 250 μM TCEP) and incubated on ice for 30 min. NCP-UV-DDB complexes were treated with a titration (0.12 U, 0.06 U, 0.015 U) of DNase I (NEB M0303S) in the presence of 2.5 mM MgCl2 and 0.5 mM CaCl2 (for 5 min at 37°C. The reaction was stopped by adding an equal volume of Stop Buffer (200 mM NaCl, 30 mM EDTA, 1% SDS) and chilled on ice for 10 min. Samples were treated with Proteinase K (10 μg) for 2 h and DNA retrieved using Ampure Beads (A63881). DNA was used for sequence library preparation (NEBNext ChIP-seq, E6240S) with Dual indexing and sequenced on an Illumina MiSeq (300 bp paired-end). Sequences were mapped to the human α-satellite sequence (145 bp) using QuasR with default settings37. The start position of mapped reads corresponding to the DNase I cut site was extracted and the counts were binned into 1 bp bins across the length of the α-satellite sequence. Plots and comparisons were done using 60,000 reads per replicate. To quantify the equilibrium between N and a 3 bp shift (N_Shift) in the α-satellite DNA register, the ratio between a DNase I high frequency cut site and the counts at a base-pair position -3 bp was calculated for two positions 10 bp apart and averaged for each replicate and then averaged again across two replicates and enzyme concentrations.
Negative stain EM
NCPs carrying THF2 at position -1 (-22/-23 from the nucleosome dyad position) and purified human UV-DDB were mixed in a 1:2 molar ratio and purified by gel filtration (Superdex 200; GE Healthcare) in 50 mM HEPES pH 7.4, 50 mM NaCl and 250 μM TCEP (GF buffer). Purified NCPTHF2(-1)-UV-DDB was diluted to ~0.03 mg/ml and applied to glow discharged Quantifoil grids (S7/2+2 nm C, Cu 400 mesh, Quantifoil Micro Tools), blotted, and stained with 2% (w/v) uranyl acetate. Data were collected using a Tecnai T12 electron microscope (Thermo Fischer) operating at 100 kV with a pixel size of 3.08 Å at the specimen level. Images were recorded with a TVIPS TemCam F416 with varying defocus (-0.5 µm to -2.0 μm). All particles (12774) were selected using e2boxer.py38 and processed with SPARX39. After two-dimensional (2D) classification with iterative stable alignment and classification in SPARX, the best 115 2D class averages were used for 3D ab initio model generation with sxviper.py from SPARX.
Cryo-EM data acquisition
For structure determination of the NCPTHF2(-1)-UV-DDB complex, after gel filtration a 3 μl sample (~0.5 mg/ml) was applied to Lacey carbon grids (Ted Pella). All other NCP-UV-DDB assemblies were reconstituted by mixing NCP and UV-DDB in a 1:1 molar ratio in GF buffer. After 30 min incubation on ice, a 3 μl sample (~1 mg/ml - ~2.5 mg/ml) was applied to either R 1.2/1.3 UltrAuFoil Quantifoil grids (Quantifoil Micro Tools) or R2/2 Quantifoil holey carbon grids (Quantifoil Micro Tools). Glow discharging was carried out in a Solarus plasma cleaner (Gatan) for 12 sec in a H2/O2 environment. After 2-3 sec blotting and 1 sec post-blot incubation, the grids were vitrified using a Leica EM GP plunger (Leica Microsystems) operated at 4°C and 85% humidity. Data were collected automatically with EPU (Thermo Fischer) on a Cs-corrected (CEOS GmbH, Heidelberg, Germany) Titan Krios (Thermo Fischer) electron microscope at 300 kV. Zero-energy loss micrographs were recorded using a Gatan K2 summit direct electron detector (Gatan) located after a Quantum-LS energy filter (slit width of 20 eV). For the NCPTHF2(-1)-UV-DDB complex acquisition was performed in EFTEM super-resolution mode at a nominal magnification of 105,000× yielding a pixel size of 0.55 Å at the specimen level. For all other datasets the acquisition was performed in EFTEM counting mode at a nominal magnification of 130,000× yielding a pixel size of 0.86 Å at the specimen level. Except for the NCP carrying THF2 at position -3 (-24/-25) and NCP-UV-DDB with THF2 at position -1 (-22/-23), all other datasets where collected with a Volta phase plate (VPP). The C2 aperture was 50 μm and, for non VPP data, the objective aperture was 100 μm. Data for different NCPs and NCP-UV-DDB assemblies have been recorded with dose rates between 3.5-5 e-/(px·s) and total doses of 40 e-/Å2 – 60 e-/Å2 (details in Extended Data Tables 1 and 2). The exposures were fractionated into 40 frames. The targeted defocus values ranged from -0.5 μm to -3 μm for non VPP datasets and from -0.4 μm to -0.6 μm from VVP datasets. The phase plate position was changed regularly every 80-100 exposures to target phase shifts between 20° and 130°.
Cryo-EM image processing
Real-time evaluation together with acquisition by EPU (Thermo Fischer) was performed with CryoFlare (in house development; www.cryoflare.org). This pre-processing step includes drift correction of micrograph stacks, contrast transfer function (CTF) determination and particles autopicking. Drift correction was performed either with Unblur40 or MotionCor241. For MotionCor2, a sum of all 40 frames was generated with and without applying a dose weighting scheme and CTF was fitted using GCTF42 on the non-dose-weighted sums. Particles were picked using Gautomatch (Dr Kai Zhang, Cambridge) on the dose-weighted sums. For Unblur, the motion-corrected averages obtained after whole-image drift correction were used for CTF estimation (GCTF) and further processing included particle polishing in RELION43. In this case, movie processing was performed and the number of frames included in the final reconstructions was chosen to target a total dose ~28 e-/Å2. Details of image processing for all samples are in Extended Data Figs. 1, 2, 3, and 7 and Extended Data Tables 1 and 2.
The resolution values reported for all reconstructions are based on the gold-standard Fourier shell correlation curve (FSC) at 0.143 criterion43,44 and all the related FSC curves are corrected for the effects of soft masks using high-resolution noise substitution45. The final maps were corrected for the modulation transfer function of the K2 detector, and negative B-factor sharpened automatically in PHENIX (phenix.auto_sharpen)46. Before sharpening, all maps were filtered based on local resolution (localdeblur part of XMIPP) estimated with MonoRes (XMIPP)47.
Initial NCP-UV-DDB model generation
The negative stain model obtained from SPARX, as described above, was used as initial model for cryo-EM processing for NCP-UV-DDB structures with 6-4PP or THF2 damaged site at position -1 (-22/-23 from the nucleosome dyad axis) the. The dataset for the NCP-UV-DDB complex carrying the damage at -3 (-24/-25) was processed using an initial model generated by the stochastic gradient descent algorithm within RELION. The initial model used for 3D processing of the NCP-UV-DDB complex with the damage at site +1 (-20/-21) was generated with cisTEM48.
Model building and refinement
A nucleosome template model extracted from the PDB entry 4ZUX for subsequent interpretation of the cryo-EM maps was identified as having highest correlation with the cryo-EM map of the NCP in a search of all available nucleosome models in the PDB49. Despite containing 145 bp Widom 601 DNA rather than 145 bp α-satellite DNA as in our nucleosomes, the model derived from PDB entry 4ZUX fit our NCP cryo-EM map substantially better (as judged by cross correlation coefficient calculated with PHENIX) than all available α-satellite nucleosomes models (such as the PDB entry 2NZD50). After sequence reassignment, DNA secondary structure restraints were generated for use in COOT51 and REFMAC52. Initial rigid body docking of the template models into the cryo-EM maps, and model building was carried out interactively with COOT. The whole refinement pipeline included three steps. First, an initial refinement of the coordinates was carried out with phenix.real_space_refine from the PHENIX suite46. Second, REFMAC was used to refine the DNA, applying restraints for planarity and hydrogen bonding. Third, final refinement was performed with phenix.real_space_refine with supplemental restraints for secondary structure and to reference models for UV-DDB derived from PDB entries 4E54 and 3EI1 after re -refinement. MOLPROBITY53 was used for model validation. Owing to two-fold rotational ambiguity in our cryo-EM reconstructions without UV-DDB, we modelled the DNA damage regions in the NCP6-4PP and NCPTHF2(-3) structures (Extended Data Figures 2b and 5j) symmetrically across the nucleosome dyad axis assuming a superposition of damaged and undamaged DNA at equal occupancy. Data collection and refinement statistics are in Extended Data Tables 1 and 2.
Density maps segmentation, figure preparation
Cryo-EM maps were segmented using phenix.map_box from the PHENIX suite. Structural figures were produced with PyMOL (The PyMOL Molecular Graphics System, Version 2.0 Schrödinger, LLC).
Clash scores and contact surface area calculation
Clash scores for NCP-UV-DDB models were calculated using a PyMOL script developed locally (available from https://doi.org/10.6084/m9.figshare.7969655.v4). In brief, a UV-DDB probe containing an appropriately positioned DNA fragment for superimposing on a nucleosome template model was placed in all possible binding positions, and the clash score for each taken as total number of residues in UV-DDB containing atoms closer than 1 Å to nucleosome atoms. Accessible contact surface area calculations were carried out using AREAIMOL from the CCP4 suite54, assuming an inward-facing probe sphere.
Extended Data
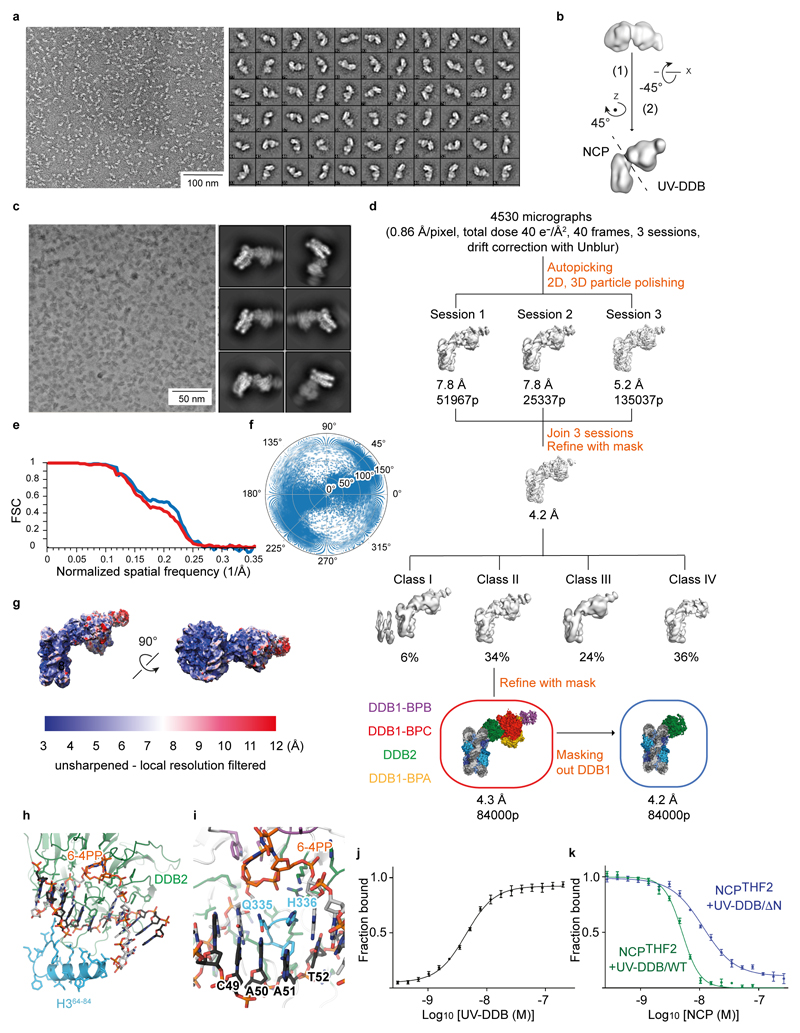
Extended Data Figure 1. Classification and refinement procedures for NCP6-4PP-UV-DDB.
a, Representative negative stain micrograph and reference-free 2D class averages obtained with sxisac.py (SPARX) for the NCPTHF2(-1)-UV-DDB complex. b, Ab initio model generated with sxviper.py in SPARX for the complex shown in a. c, Representative Volta phase plate (VPP) cryo-EM micrographs and reference-free 2D class averages for NCP6-4PP-UV-DDB. d, Classification and refinement procedures for the cryo-EM reconstruction of NCP6-4PP-UV-DDB. Three different microscope sessions (4530 micrographs) were collected under identical imaging conditions and processed independently before merging the best particles to obtain the final high-resolution reconstruction. For each session, a small dataset was manually selected to obtain 2D class averages that were used for particle autopicking with RELION. Several rounds of 2D and 3D classification were necessary to obtain homogeneous datasets. The model shown in b was low-pass filtered to 60 Å and used as initial model for the first round of 3D classification of each session. Given the total dose of 40 e-/Å2 over 40 frames, only frames 1 to 28 were included for movie refinement and particle polishing in RELION. To improve the resolution, the best particles from the three sessions were pooled and subjected to 3D classification into four classes. Refinement of the particles included in class II using a soft mask around the entire complex produced a 4.3 Å resolution map. Refinement of the same set of particles with a soft mask that excluded DDB1 produced a 4.2 Å resolution map. e, Gold-standard Fourier shell correlation curves (FSCs) for NCP6-4PP-UV-DDB (red) and for the same complex after masking out DDB1 (blue). f, Angular distribution of the particles included in the final models. g, Local-resolution filtered map for NCP6-4PP-UV-DDB coloured by resolution (MonoRes47). h, The 6-4PP lesion is located next to H3 α–helix α1. i, Orphaned bases are stabilised by β-hairpin loop insertion. j, Fluorescence polarisation (FP) dose response curves using 10 nM Cy5-labelled 15 bp oligonucleotide with a single THF damage site (Cy5-15-bp-DNATHF) mixed with UV-DDB (0.3 - 200 nM) and the interaction measured and plotted as described in Methods. All data include three technical replicates (n = 3) and are shown as mean ± s.d.. k, 10 nM of a Cy5-15-bp-DNATHF were mixed with 10 nM wild-type UV-DDB or the UV-DDB/ΔN variant lacking residues 1-40 of DDB2, and counter titrated with NCPTHF2(-1). Although the DDB2 N-terminal region (residues 1-40) contributes to nucleosome binding in biochemical assays, we did not find interpretable density for this segment, and also did find evidence of UV-DDB dimerisation in our cryo-EM structures18.
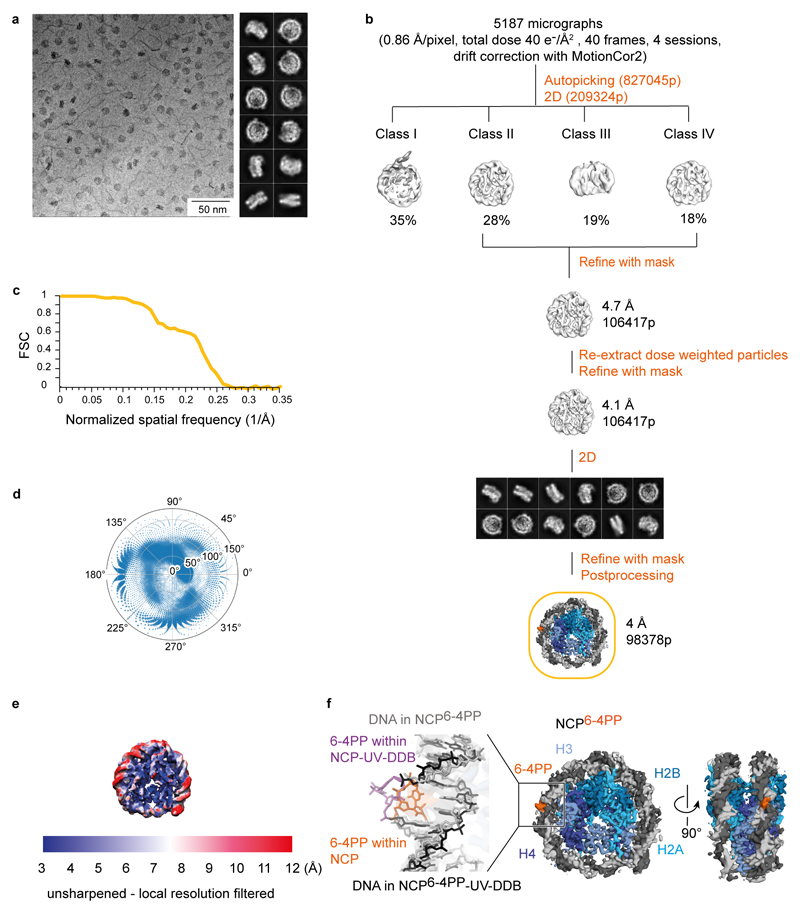
Extended Data Figure 2. Classification and refinement procedures for NCP6-4PP.
a, Representative VPP cryo-EM micrograph and reference-free 2D class averages for NCP6-4PP. b, Four microscope sessions with a total of 5187 micrographs were collected under identical imaging conditions. All dose-fractionated micrograph stacks were subjected to beam-induced motion correction with MotionCor255. Initial processing was carried out with unweighted MotionCor2-corrected sums (including all frames). A small dataset was manually selected to obtain initial 2D class averages used for autopicking in RELION. A few rounds of 2D classification led to a dataset with 209,324 particles. A nucleosome map cut out from the 4.2 Å resolution map shown in Extended Data Fig. 1d was low-pass filtered to 60 Å and used as initial model. Three-dimensional classification into four classes allowed to discard 54% of the particles (Class I and Class III). The remaining 106,417 particles were refined to 4.7 Å resolution. Re-extraction of the particles from dose-weighted micrographs and re-refinement with a mask led to a 4.1 Å resolution map. Particles were subjected to a final round of 2D classification before the last refinement to obtain a map at 4 Å resolution. c, Gold-standard Fourier shell correlation curve (FSC). d, Angular distribution for the particles included in the final model. e, Local resolution filtered map for NCP6-4PP. f, Middle and right, the 4 Å resolution cryo-EM map of NCP6-4PP shown in two different views, with the 6-4PP (orange) tentatively assigned. Left, cryo-EM density (grey surface) of NCP6-4PP fitted with the cryo-EM structure of NCP6-4PP-UV-DDB, illustrating the undistorted nature of the nucleosome. At this resolution, the α-satellite nucleosome carrying the damage is pseudo-symmetrical. Both SHL+2 and SHL-2 loci show continuous density around the expected site of the lesion. Whereas both half-sites are likely averaged in the process of classification, the continuous density in both loci suggests that the 6-4PP lesion is present predominantly in an apparent helical, non-extruded conformation.
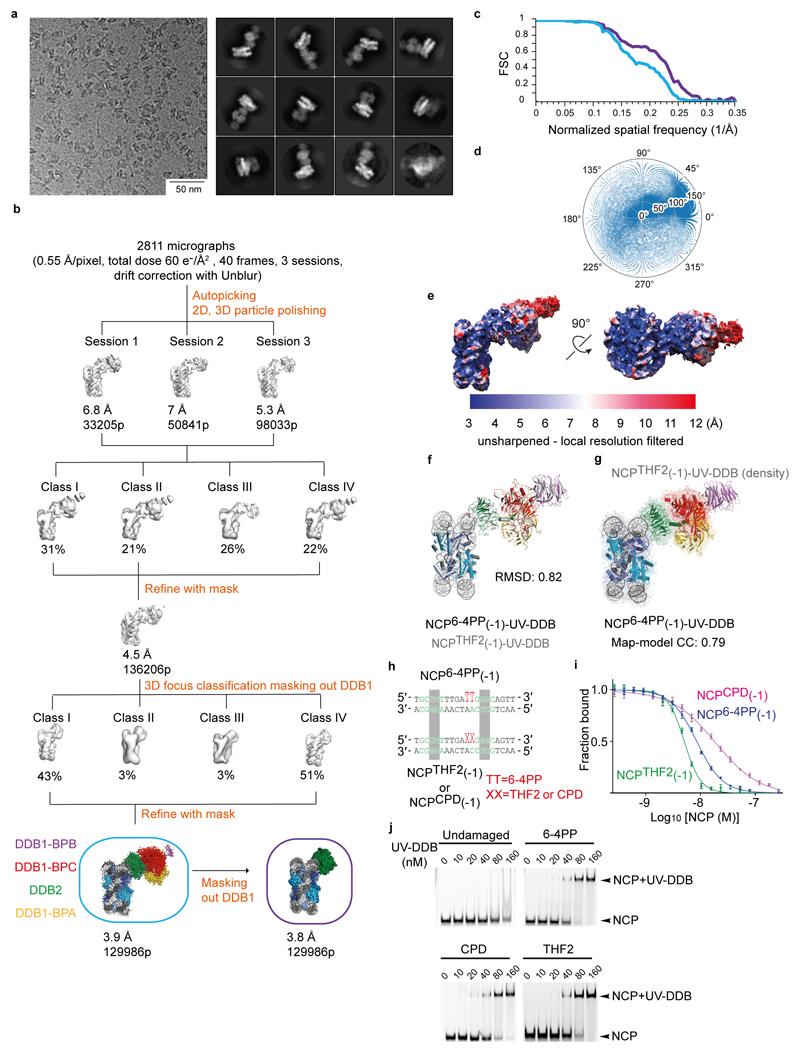
Extended Data Figure 3. Classification and refinement procedures for NCPTHF2(-1)-UV-DDB.
a, Representative cryo-EM micrograph and reference-free 2D class averages for the NCPTHF2(-1)-UV-DDB complex. b, A total of 2811 micrographs were collected over three sessions using identical imaging conditions. For each session, the model shown in Extended Data Fig. 1b was low-pass filtered to 60 Å and used as initial model for the first round of 3D classification. For each session, a small dataset was manually picked to obtain initial 2D class averages used for autopicking in RELION. Several rounds of 2D and 3D classification were necessary to obtain homogeneous datasets. Given the accumulated dose of 60 e-/Å2 equally distributed over 40 frames, frames 1 to 18 were retained during movie refinement and particle polishing in RELION. The best particles from each session were pooled and subjected to 3D classification into four classes. Refinement of Class I, II and IV led to a 4.5 Å resolution map. Further 3D classification into four models was performed by masking out DDB1. Next the particles included in Class I and Class IV were pulled together and subjected to refinement with a mask around the entire complex leading to a 3.9 Å resolution map. Refinement with a mask that excluded DDB1 led to an improved 3.8 Å resolution map. c, Gold-standard Fourier shell correlation curves (FSCs) for the 3.9 Å (blue) and 3.8 Å (purple) resolution map, respectively. d, Angular distribution of the particles included in the final models. e, Local filtered resolution maps for NCP6-4PP-UV-DDB and NCPTHF2(-1)-UV-DDB coloured by resolution (MonoRes47). f and g, The NCP6-4PP-UV-DDB model fitted into the NCPTHF2(-1)-UV-DDB cryo-EM map illustrating that the two models are structurally identical given the resolution. h, Damage location and sequence of NCPTHF2(-1)-UV-DDB and NCPCPD(-1)-UV-DDB are indicated. i, As in Extended Data Fig. 1k with increasing amounts of competing nucleosomes containing 6-4PP, THF2, or CPD. All data include three technical replicates (n = 3) and is shown as mean ± s.d.. j, Gel electrophoretic mobility shift assays (EMSAs) were carried out with 40 nM Alexa 488-labelled undamaged nucleosome or nucleosomes containing 6-4PP, THF2, or CPD lesions. Gels were imaged using the Alexa 488 signal with a Typhoon Image Analyzer (GE healthcare).
Extended Data Figure 4. Representative NCP-UV-DDB cryo-EM map segments.
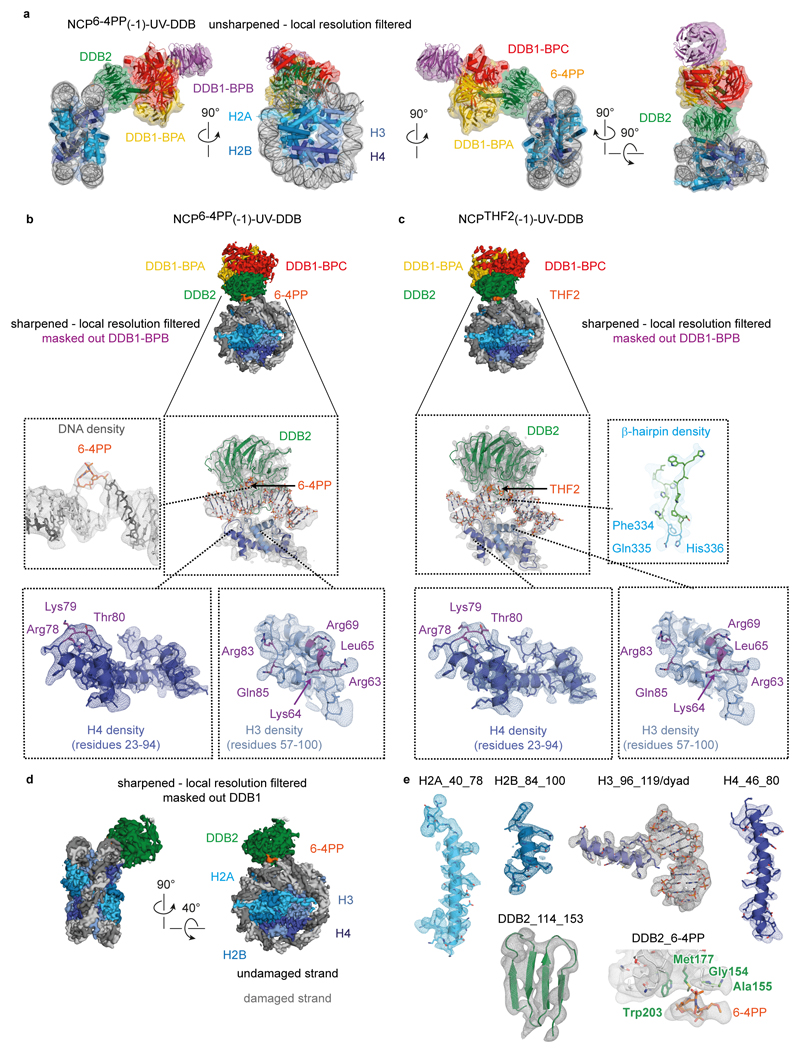
a, Different views for the unsharpened local resolution filtered map of the NCP6-4PP-UV-DDB complex. Together with the class averages (Extended Data Fig. 1a), this argues that the density observed is fully accounted for by a single UV-DDB complex engaged with a single damaged nucleosome. b, c, Representative, sharpened local-resolution filtered maps of the NCP6-4PP(-1)-UV-DDB complex for which the central DDB1 B-domain features were masked out, showing map segments for the damaged DNA duplex, the DDB2-DNA-histone H3. interface, and H3/H4 position surrounding the damage, and the DDB2 β-hairpin loop involved in damage recognition. c, As in b but with map segments from NCPTHF2(-1)-UV-DDB. d, Sharpened local resolution filtered map obtained for NCP6-4PP-UV-DDB with DDB1 masked out. e, Segments of H2A, H2A, H3, H4, DDB2 β-sheet, and DDB2-6-4PP interface excised from the 4.2 Å resolution NCP6-4PP-DDB2 map shown in d.
Extended Data Figure 5. Biochemical and biophysical characterisation of NCP-UV-DDB, and classification and refinement procedures for NCPTHF2(-3) and NCPTHF2(-3)-UV-DDB.
a and b, 10 nM of a Cy5-15-bp-DNATHF were mixed with 10 nM UV-DDB and counter titrated with nucleosome or 145 bp DNA containing 6-4PP a or THF2 b at the -1 (-22/-23) position. Undamaged 145 bp DNA was used as a negative control. All data include three technical replicates (n = 3) and are shown as mean ± s.d.. c, EMSAs were carried out by mixing 40 nM of nucleosomes containing THF2 at different positions, -5* (-16/-17) to +3 (-18/-19), with increasing amounts of UV-DDB (0 to 320 nM). Gels were imaged by Alexa 488 with Typhoon Image Analyzer. d, As in b, but counter titrated with different 145 bp DNA containing THF2 at -5* (-16/-17) to +3 (-18/-19) position. e, EC50 estimation from the counter titration experiments shown in a and b, Fig. 2e. All data include three technical replicates (n = 3) and are shown as mean ± s.d.. Lesions placed at position 0 show the highest binding affinity, with an EC50 ~1.1-fold higher than the -1 (-22/-23) position used for structure determination in Fig. 1. However, the EC50 decreased ~2.5-fold for nucleosomes with THF2 at the +1 (-20/-21) site, ~8-fold at +2 (-19/-20) and ~15-fold at +3 (-18/-19). A similar drop in affinity is found for lesions placed successively in the other direction from -2 (-23/-24) through -3 (-24/-25) to -4 (-25/-26) (Fig. 2e). f, Representative VPP cryo-EM micrographs and reference-free 2D class averages for the NCPTHF2(-3)-UV-DDB complex. g, Ab initio model generated with RELION for the complex shown in f. h, Two different microscope datasets were collected under identical imaging conditions leading to 3890 micrographs. All dose-fractionated micrograph stacks were subjected to beam-induced motion correction with MotionCor255. All frames (1 to 40) were included during this step. Further processing was carried out using MotionCor2-corrected sums that were filtered according to exposure dose (1 e-/Å2 per frame). A small dataset was manually picked to obtain 2D class averages used for autopicking within RELION. The model shown in g was low-pass filtered to 60 Å and used as initial model for the first round of 3D classification. Several rounds of 2D and 3D classification were necessary to obtain homogeneous datasets. The last 3D classification divided the dataset into six models. Refinement of the best particles with a soft mask around the entire complex led to a 4.1 Å resolution map. i, Representative conventional (no VPP) cryo-EM micrograph and reference-free 2D class averages for the isolated NCPTHF2(-3). j, A total of 2433 micrographs were collected and a small dataset was manually picked to obtain initial 2D class averages followed by autopicking in RELION. Four rounds of 2D classification led to a homogeneous dataset. The density for UV-DDB was removed from the model shown in g. The resulting map was low-pass filtered to 60 Å and used as initial model for the first round of 3D refinement leading to a map at 4.1 Å resolution after polishing. Given the accumulated dose of 40 e-/Å2 spanning 40 frames, frames 1 to 28 were included during movie refinement and particle polishing in RELION. To improve the resolution, we performed 3D classification into three classes. Refinement with a mask of Class II led to a 3.6 Å resolution map. Per particle CTF refinement improved the map to 3.5 Å resolution. k and l, Local resolution filtered map for NCPTHF2(-3)-UV-DDB and NCPTHF2(-3). m, Gold-standard Fourier shell correlation curves (FSCs) for NCPTHF2(-3)-UV-DDB (blue) and NCPTHF2(-3) (orange). n and o, Angular distribution for NCPTHF2(-3)-UV-DDB and NCPTHF2(-3). p, Overlay of the predicted NCPTHF2(-3)-UV-DDB model (red) with the cryo-EM structure (yellow), the difference between the two is reconciled by nucleosomal register shifting.
Extended Data Fig. 6. Thermodynamic dissection of UV-DDB binding with slide-assisted site-exposure (SAsSE).
a, DNase I digestion of undamaged (UD) nucleosomes with a range of enzyme concentrations (0.12 U to 0.015 U) show identical sensitive sites (i, data shown is the average of two replicates (n = 2) per enzyme concentration) and are highly reproducible across replicates (ii). Note that an example of the data reproducibility is shown for the UD construct, but the data for all constructs were highly reproducible (Person correlations of R = >0.95). b, Ratio of counts at position n versus n-3 for undamaged NCP, NCPTHF2(-1), NCPTHF2(-3) in the absence and presence of UV-DDB. c, i) Peaks for UD NCP, NCPTHF2(-1), NCPTHF2(-3) and NCPTHF2(+1) in the presence of UV-DDB used to quantify the register shift ratios (n=2). Note that in the case of NCPTHF2(+1) we expect only 30-40% of molecules to shift by maximal 1 bp. Our data are consistent with an increased population of α-satellite DNA in the +1 nucleosome shifted by 1 bp towards the dyad axis compared to the -1 nucleosome (ii, n = 4, mean ± s.d.), however, the width and the overlap of the shifted/unshifted peak prevented further detailed analysis. d, titration 10 nM of a Cy5-15-bp-DNATHF with increasing concentrations of UV-DDB. The resulting curve was fitted with Dynafit resulting in a Kd~ 0.15 nM. Given the tight Kd relative to the high concentration of the Cy5-15-bp-DNATHF label, the value should be viewed as estimate. These are in line, however, with previous experiments34. All data include three technical replicates (n = 3) and are shown as mean ± s.d.. e, Complex of 10 nM Cy5-15-bp-DNATHF and UV-DDB, was back titrated with NCPTHF2 (-3) and the data fitted numerically in Dynafit. All data include three technical replicates (n = 3) and are shown as mean ± s.d.. f, Thermodynamic binding scheme invoking induced fit binding, in which the register shift is induced on UV-DDB binding, and a conformational preselection branch (selected-fit), in which a preequilibrium exists that is pulled by UV-DDB binding. g, Equations describing the thermodynamic binding process, and approximations used to derive K1, K2, K3 and K4.
Extended Data Figure 7. Classification and refinement procedures for NCPTHF2(+1)-UV-DDB.
a, Representative VPP cryo-EM micrograph and reference-free 2D class averages obtained with cisTEM48 for NCPTHF2(+1)-UV-DDB. b, Six ab initio models were generated with cisTEM. c, Five datasets were collected with VPP under identical imaging conditions obtaining a total of 11675 micrographs. All dose-fractionated micrograph stacks were subjected to beam-induced motion correction with MotionCor255. Further processing was carried out using dose-weighted MotionCor2-corrected sums (including all frames, 1 e-/Å2 per frame). A small dataset was manually selected to obtain 2D class averages and used for autopicking in RELION. Class III shown in b was low-pass filtered to 60 Å and used as initial model for the first round of 3D classification for all five sessions independently. Several rounds of 2D and 3D classification were necessary to obtain homogeneous datasets. The best particles from each session were pooled and subjected to 3D classification into four models, revealing two different conformations for the complex. Thus, additional rounds of 3D classification were necessary to obtain a homogeneous subset of particles. Particles included in Class I, Class II and Class III were merged and divided into four 3D classes. Owing to their structural similarity, particles in Class V, Class VI and Class VII were pooled and divided into 3D classes. A homogeneous dataset was obtained after merging particles in Class IX and Class X, leading to a 4.2 Å resolution map (Class A) with a mask that excluded DDB1. Particles in Class IV and Class VIII were pooled and subjected to 3D classification. The best particles led to a 4.6 Å resolution map after masking out DDB1 (Class B). d, Gold-standard Fourier shell correlation curves (FSCs) for Class A (blue) and Class B (red) respectively. e and f, Angular distribution for the particles included in Class A and B respectively. g and h, Local resolution filtered maps for Class A and B respectively (MonoRes47). i, Close-up view showing the interactions between DDB2 (green) and different cryo-EM models demonstrating that essentially identical interactions between the protein and the DNA are maintained despite different type of lesions and rotational settings. j, Superimposition of atomic models for the repositioned NCPTHF2(+1)-UV-DDB (Class B) and the repositioned NCPTHF2(-3)-UV-DDB (light grey, Extended Data Fig. 5h,k) illustrating repositioning to a common position.
Extended Data Figure 8. Placing the damage on the opposite strand exposes UV-DDB to a different binding environment.
a, DNA sequences and position of all complex structures with different lesions as shown in Fig. 4a. The relative translational register shift is indicated. b, DNA sequence for NCPTHF2(-1)-UV-DDB with THF2 placed at position -22/-23 bp from the dyad axis on the reverse strand (3’ to 5’). c, Comparison of clash scores between SHL-2.5 (Watson, grey) and SHL+3.5 (Crick, orange) shown in Fig. 5e. d, EC50 estimation from the counter titration experiments shown in Fig. 5a, c, d. All data include three technical replicates (n = 3) and are shown as mean ± s.d.. e, Accessible contact surface area for nucleosomal DNA calculated as indicated across a range of probe radii. Most of the DNA surface (>93%) is inaccessible to probes with radii exceeding 4 Å. f, A mechanism invoking UV-DDB-induced nucleosome register shifting is also conceivable for damage recognition of pyrimidine dimers in multiple nucleosomes. Modelling of available di- and tetra-nucleosome structures suggests that UV-DDB can access a substantial fraction of the outward-facing minor grooves in these more heterochromatic model substrates56, with similar predicted accessibility to corresponding positions in mono-nucleosomes (Fig. 5e).
Extended Data Table 1. NCP-UV-DDB complex cryo-EM data collection, refinement and validation statistics.
| NCP6-4PP-UV-DDB (EMD-4762) (PDB 6R8Y) |
NCPTHF2(-1)-UV-DDB (EMD-4763) (PDB 6R8Z) |
NCPTHF2(-3)-UV-DDB (EMD-4765) (PDB 6R91) |
NCPTHF2(+1)-UV-DDB class A (EMD-4764) (PDB 6R90) |
NCPTHF2(+1)-UV-DDB class B (EMD-4766) (PDB 6R92) |
|
|---|---|---|---|---|---|
| Data collection and processing | |||||
| Magnification | 130,000 | 105,000 | 130,000 | 130,000 | 130,000 |
| Voltage (kV) | 300 | 300 | 300 | 300 | 300 |
| Electron exposure (e−/Å2) | 40 | 60 | 40 | 40 | 40 |
| Defocus range (µm) | -0.4 – -0.7 | -1.0 – -3.0 | -0.4 – -0.7 | -0.4 – -0.7 | -0.4 – -0.7 |
| Pixel size (Å) | 0.86 | 0.55 (super resolution) | 1.72 (data 2 x binned) | 0.86 | 0.86 |
| Symmetry imposed | C1 | C1 | C1 | C1 | C1 |
| Initial particle images (no.) | 1,355,846 | 511,505 | 719,698 | 1,078,133 | 1,078,133 |
| Final particle images (no.) | 84,000 | 129,986 | 119,309 | 128,763 | 48,925 |
| Map resolution (Å) | 4.3 | 3.9 | 4.2 | 4.5 | 4.8 |
| FSC threshold | 0.143 | 0.143 | 0.143 | 0.143 | 0.143 |
| Map resolution range (Å) | 3.0−12 | 3.0−12 | 4.0−7 | 4.0−12 | 4.0−12 |
| Refinement | |||||
| Initial models used (PDB codes) | 4ZUX, 5Y0C, 4E54, 3EI4 | 4ZUX, 5Y0C, 4E54, 3EI4 | 4ZUX, 5Y0C, 4E54, 3EI4 | 4ZUX, 5Y0C, 4E54, 3EI4 | 4ZUX, 5Y0C, 4E54, 3EI4 |
| Model resolution (Å) | 3.9 | 3.8 | 4.4 | 4.2 | 4.5 |
| FSC threshold | 0.143 | 0.143 | 0.143 | 0.143 | 0.143 |
| Map sharpening B factor (Å2) | -120 | -233 | -180 | -160 | -200 |
| Model composition | |||||
| Non-hydrogen atoms | 21,717 | 21,617 | 21,477 | 21,268 | 21,500 |
| Protein residues | 1996 | 1984 | 1969 | 1944 | 1974 |
| Nucleotides | 288 | 288 | 288 | 288 | 288 |
| B factors (Å2) | |||||
| Protein | 85 | 118 | 257 | 156 | 261 |
| DNA | 73 | 90 | 264 | 155 | 244 |
| DNA damage | 64 | 74 | 229 | 143 | 249 |
| R.m.s. deviations | |||||
| Bond lengths (Å) | 0.012 | 0.009 | 0.005 | 0.005 | 0.007 |
| Bond angles (°) | 1.301 | 0.932 | 0.944 | 0.873 | 1.107 |
| Validation | |||||
| MolProbity score | 1.44 | 1.48 | 1.43 | 1.41 | 1.58 |
| Clashscore | 2.71 | 1.98 | 2.15 | 2.00 | 4.28 |
| Poor rotamers (%) | 0.47 | 0.18 | 0.65 | 0.24 | 0.36 |
| Ramachandran plot | |||||
| Favored (%) | 94.0 | 95.0 | 95.0 | 96.6 | 94.7 |
| Allowed (%) | 5.7 | 4.6 | 4.6 | 3.1 | 5.0 |
| Disallowed (%) | 0.3 | 0.4 | 0.5 | 0.3 | 0.4 |
| Model-to-data fit* | |||||
| CCmask | 0.76 | 0.75 | 0.52 | 0.72 | 0.70 |
| CCbox | 0.78 | 0.79 | 0.64 | 0.76 | 0.83 |
| CCpeaks | 0.68 | 0.71 | 0.47 | 0.61 | 0.60 |
| CCvolume | 0.74 | 0.74 | 0.53 | 0.71 | 0.71 |
Extended Data Table 2. NCP cryo-EM data collection, refinement and validation statistics.
| NCP6-4PP (EMD-4767) (PDB 6R93) |
NCPTHF2(-3) (EMD-4768) (PDB 6R94) |
|
|---|---|---|
| Data collection and processing | ||
| Magnification | 130,000 | 130,000 |
| Voltage (kV) | 300 | 300 |
| Electron exposure (e–/Å2) | 40 | 40 |
| Defocus range (µm) | -0.4 – -0.7 | -1.0 – -3.0 |
| Pixel size (Å) | 0.86 | 0.86 |
| Symmetry imposed | C1 | C1 |
| Initial particle images (no.) | 827,045 | 266,180 |
| Final particle images (no.) | 98,387 | 78,672 |
| Map resolution (Å) | 4.0 | 3.5 |
| FSC threshold | 0.143 | 0.143 |
| Map resolution range (Å) | 3.1–12 | 3.0–12 |
| Refinement | ||
| Initial models used (PDB codes) | 4ZUX, 5Y0C | 4ZUX, 5Y0C |
| Model resolution (Å) | 3.8 | 3.4 |
| FSC threshold | 0.143 | 0.143 |
| Map sharpening B factor (Å2) | -110 | -140 |
| Model composition | ||
| Non-hydrogen atoms | 12,844 | 12,372 |
| Protein residues | 775 | 803 |
| Nucleotides | 290 | 290 |
| B factors (Å2) | ||
| Protein | 63 | 68 |
| DNA | 99 | 111 |
| DNA damage | 103 | 118 |
| R.m.s. deviations | ||
| Bond lengths (Å) | 0.008 | 0.008 |
| Bond angles (°) | 1.238 | 1.012 |
| Validation | ||
| MolProbity score | 1.15 | 1.15 |
| Clashscore | 2.04 | 1.07 |
| Poor rotamers (%) | 0.00 | 0.00 |
| Ramachandran plot | ||
| Favored (%) | 97.0 | 97 |
| Allowed (%) | 2.5 | 3.0 |
| Disallowed (%) | 0.5 | 0.4 |
| Model-to-data fit* | ||
| CCmask | 0.67 | 0.69 |
| CCbox | 0.73 | 0.74 |
| CCpeaks | 0.62 | 0.66 |
| CCvolume | 0.66 | 0.70 |
Supplementary Material
Acknowledgements
We thank Drs A. Osakabe and Y. Arimura for discussion and histone preparation.
This work was supported by the Novartis Research Foundation and received funding from the Swiss National Science Foundation through Sinergia Grant Number CRSII3_160734/1 to N.H.T., and the European Research Council under the European Union’s Horizon 2020 research and innovation programme grant agreement, Grant Number 666068 to N.H.T., Grant Number 667951 to D.S., and innovation programme under the Marie Sklodowska-Curie Grant Number 705354 and an EMBO Long-Term fellowship to R.S.G., and in part by Uehara Memorial Foundation to S.M., and by JSPS KAKENHI Grant Number JP18H05534 to H.K. and JP16H06307 to K.S., and the Platform Project for Supporting Drug Discovery and Life Science Research (BINDS) from AMED under Grant Number JP18am0101076 to H.K..
Footnotes
Data availability Atomic coordinates and cryo-EM maps are deposited in the Protein Data Bank (PDB) and Electron Microscopy Data Bank (EMDB) under accession codes 6R8Y and EMD-4762 (NCP6-4PP-UV-DDB); 6R8Z and EMD-4763 (NCPTHF2(-1)-UV-DDB); 6R91 and EMD-4765 (NCPTHF2(-3)-UV-DDB); 6R90 and 4764 (NCPTHF2(+1)-UV-DDB class A); 6R92 and EMD-4766 (NCPTHF2(+1)-UV-DDB class B); 6R93 and EMD-4767 (NCP6-4PP); 6R94 and EMD-4768 (NCPTHF2(-3)).
Author contributions S.M, S.C., and N.H.T. conceived and planned the experiments. S.M. prepared samples for biochemical and structural studies and performed EMSA and FP assays. S.C. performed cryo-EM microscopy and analysis. R.D.B. interpreted the cryo-EM structures and prepared the atomic models with S.C. providing input. R.D.B, and N.H.T. analysed the structures. A.P. and J.R. helped develop the FP assays, S.M. carried out the functional experiments, and J.R, S.M and N.H.T. analysed the results. A.D.S. contributed to cryo-EM processing and developed cryoFLARE. S.I. and J.Y. synthesised 6-4PP containing oligonucleotides. S.M. performed biochemical analysis with guidance from K.S. and H.K.. R.S.G. developed and analysed the DNAse I footprinting assay with guidance from D.S.. Research was directed by N.H.T., and all authors contributed to writing the manuscript.
Reprints and permissions information is available at www.nature.com/reprints.
Competing interests: none declared.
References
- 1.Thoma F. Repair of UV lesions in nucleosomes--intrinsic properties and remodeling. DNA repair. 2005;4:855–869. doi: 10.1016/j.dnarep.2005.04.005. [DOI] [PubMed] [Google Scholar]
- 2.Rodriguez Y, Hinz JM, Smerdon MJ. Accessing DNA damage in chromatin: Preparing the chromatin landscape for base excision repair. DNA repair. 2015;32:113–119. doi: 10.1016/j.dnarep.2015.04.021. [DOI] [PMC free article] [PubMed] [Google Scholar]
- 3.Hanawalt PC, Spivak G. Transcription-coupled DNA repair: two decades of progress and surprises. Nature reviews. Molecular cell biology. 2008;9:958–970. doi: 10.1038/nrm2549. [DOI] [PubMed] [Google Scholar]
- 4.Luger K, Mader AW, Richmond RK, Sargent DF, Richmond TJ. Crystal structure of the nucleosome core particle at 2.8 A resolution. Nature. 1997;389:251–260. doi: 10.1038/38444. [DOI] [PubMed] [Google Scholar]
- 5.Tan S. Nucleosome Structure and Function. Chemical Reviews. 2014;10:2255–2273. doi: 10.1021/cr500373h. [DOI] [PMC free article] [PubMed] [Google Scholar]
- 6.Sugasawa K, et al. UV-induced ubiquitylation of XPC protein mediated by UV-DDB-ubiquitin ligase complex. Cell. 2005;121:387–400. doi: 10.1016/j.cell.2005.02.035. [DOI] [PubMed] [Google Scholar]
- 7.Groisman R, et al. The ubiquitin ligase activity in the DDB2 and CSA complexes is differentially regulated by the COP9 signalosome in response to DNA damage. Cell. 2003;113:357–367. doi: 10.1016/s0092-8674(03)00316-7. [DOI] [PubMed] [Google Scholar]
- 8.Cavadini S, et al. Cullin-RING ubiquitin E3 ligase regulation by the COP9 signalosome. Nature. 2016;531:598–603. doi: 10.1038/nature17416. [DOI] [PubMed] [Google Scholar]
- 9.Wang H, et al. Histone H3 and H4 ubiquitylation by the CUL4-DDB-ROC1 ubiquitin ligase facilitates cellular response to DNA damage. Molecular cell. 2006;22:383–394. doi: 10.1016/j.molcel.2006.03.035. [DOI] [PubMed] [Google Scholar]
- 10.Lehmann AR. DNA repair-deficient diseases, xeroderma pigmentosum, Cockayne syndrome and trichothiodystrophy. Biochimie. 2003;85:1101–1111. doi: 10.1016/j.biochi.2003.09.010. [DOI] [PubMed] [Google Scholar]
- 11.Luijsterburg MS, et al. Dynamic in vivo interaction of DDB2 E3 ubiquitin ligase with UV-damaged DNA is independent of damage-recognition protein XPC. Journal of cell science. 2007;120:2706–2716. doi: 10.1242/jcs.008367. [DOI] [PubMed] [Google Scholar]
- 12.Naegeli H. Chromatin retention of DNA damage sensors DDB2 and XPC through loss of p97 segregase causes genotoxicity. Nature communications. 2014;5 doi: 10.1038/ncomms4695. [DOI] [PMC free article] [PubMed] [Google Scholar]
- 13.Fei J, et al. Regulation of nucleotide excision repair by UV-DDB: prioritization of damage recognition to internucleosomal DNA. PLoS biology. 2011;9:e1001183. doi: 10.1371/journal.pbio.1001183. [DOI] [PMC free article] [PubMed] [Google Scholar]
- 14.Fischer ES, et al. The molecular basis of CRL4DDB2/CSA ubiquitin ligase architecture, targeting, and activation. Cell. 2011;147:1024–1039. doi: 10.1016/j.cell.2011.10.035. [DOI] [PubMed] [Google Scholar]
- 15.Chu G, Chang E. Xeroderma pigmentosum group E cells lack a nuclear factor that binds to damaged DNA. Science (New York, N.Y.) 1988;242:564–567. doi: 10.1126/science.3175673. [DOI] [PubMed] [Google Scholar]
- 16.Lehmann AR, McGibbon D, Stefanini M. Xeroderma pigmentosum. Orphanet journal of rare diseases. 2011;6:70. doi: 10.1186/1750-1172-6-70. [DOI] [PMC free article] [PubMed] [Google Scholar]
- 17.Scrima A, et al. Structural basis of UV DNA-damage recognition by the DDB1-DDB2 complex. Cell. 2008;135:1213–1223. doi: 10.1016/j.cell.2008.10.045. [DOI] [PMC free article] [PubMed] [Google Scholar]
- 18.Yeh JI, et al. Damaged DNA induced UV-damaged DNA-binding protein (UV-DDB) dimerization and its roles in chromatinized DNA repair. Proceedings of the National Academy of Sciences of the United States of America. 2012;109:E2737–2746. doi: 10.1073/pnas.1110067109. [DOI] [PMC free article] [PubMed] [Google Scholar]
- 19.Li G, Levitus M, Bustamante C, Widom J. Rapid spontaneous accessibility of nucleosomal DNA. Nature structural & molecular biology. 2005;12:46–53. doi: 10.1038/nsmb869. [DOI] [PubMed] [Google Scholar]
- 20.Zhu F, et al. The interaction landscape between transcription factors and the nucleosome. Nature. 2018;562:76–81. doi: 10.1038/s41586-018-0549-5. [DOI] [PMC free article] [PubMed] [Google Scholar]
- 21.Wittschieben BO, Iwai S, Wood RD. DDB1-DDB2 (xeroderma pigmentosum group E) protein complex recognizes a cyclobutane pyrimidine dimer, mismatches, apurinic/apyrimidinic sites, and compound lesions in DNA. The Journal of biological chemistry. 2005;280:39982–39989. doi: 10.1074/jbc.M507854200. [DOI] [PubMed] [Google Scholar]
- 22.Osakabe A, et al. Structural basis of pyrimidine-pyrimidone (6-4) photoproduct recognition by UV-DDB in the nucleosome. Scientific reports. 2015;5 doi: 10.1038/srep16330. 16330. [DOI] [PMC free article] [PubMed] [Google Scholar]
- 23.Lan L, et al. Monoubiquitinated histone H2A destabilizes photolesion-containing nucleosomes with concomitant release of UV-damaged DNA-binding protein E3 ligase. The Journal of biological chemistry. 2012;287:12036–12049. doi: 10.1074/jbc.M111.307058. [DOI] [PMC free article] [PubMed] [Google Scholar]
- 24.Kapetanaki MG, et al. The DDB1-CUL4ADDB2 ubiquitin ligase is deficient in xeroderma pigmentosum group E and targets histone H2A at UV-damaged DNA sites. Proceedings of the National Academy of Sciences of the United States of America. 2006;103:2588–2593. doi: 10.1073/pnas.0511160103. [DOI] [PMC free article] [PubMed] [Google Scholar]
- 25.Vasudevan D, Chua EYD, Davey CA. Crystal structures of nucleosome core particles containing the '601' strong positioning sequence. Journal of molecular biology. 2010;403:1–10. doi: 10.1016/j.jmb.2010.08.039. [DOI] [PubMed] [Google Scholar]
- 26.Pich O, et al. Somatic and Germline Mutation Periodicity Follow the Orientation of the DNA Minor Groove around Nucleosomes. Cell. 2018;175:1074–1087.e1018. doi: 10.1016/j.cell.2018.10.004. [DOI] [PubMed] [Google Scholar]
- 27.Brown AJ, Mao P, Smerdon MJ, Wyrick JJ, Roberts SA. Nucleosome positions establish an extended mutation signature in melanoma. PLoS genetics. 2018;14:e1007823. doi: 10.1371/journal.pgen.1007823. [DOI] [PMC free article] [PubMed] [Google Scholar]
- 28.Mao P, Smerdon MJ, Roberts SA, Wyrick JJ. Chromosomal landscape of UV damage formation and repair at single-nucleotide resolution. Proceedings of the National Academy of Sciences of the United States of America. 2016;113:9057–9062. doi: 10.1073/pnas.1606667113. [DOI] [PMC free article] [PubMed] [Google Scholar]
- 29.Bilokapic S, Strauss M, Halic M. Structural rearrangements of the histone octamer translocate DNA. Nature communications. 2018;9 doi: 10.1038/s41467-018-03677-z. 1330. [DOI] [PMC free article] [PubMed] [Google Scholar]
- 30.Kitevski-LeBlanc JL, et al. Investigating the Dynamics of Destabilized Nucleosomes Using Methyl-TROSY NMR. J Am Chem Soc. 2018;140:4774–4777. doi: 10.1021/jacs.8b00931. [DOI] [PubMed] [Google Scholar]
- 31.Iwai S, Shimizu M, Kamiya H, Ohtsuka E. Synthesis of a Phosphoramidite Coupling Unit of the Pyrimidine (6–4) Pyrimidone Photoproduct and Its Incorporation into Oligodeoxynucleotides. Journal of the American Chemical Society. 1996;118:7642–7643. doi: 10.1021/ja9603158. [DOI] [Google Scholar]
- 32.Abdulrahman W, et al. A set of baculovirus transfer vectors for screening of affinity tags and parallel expression strategies. Analytical biochemistry. 2009;385:383–385. doi: 10.1016/j.ab.2008.10.044. [DOI] [PubMed] [Google Scholar]
- 33.Marks BD, et al. Multiparameter analysis of a screen for progesterone receptor ligands: comparing fluorescence lifetime and fluorescence polarization measurements. Assay and drug development technologies. 2005;3:613–622. doi: 10.1089/adt.2005.3.613. [DOI] [PubMed] [Google Scholar]
- 34.Kuzmic P. DynaFit--a software package for enzymology. Methods in enzymology. 2009;467:247–280. doi: 10.1016/s0076-6879(09)67010-5. [DOI] [PubMed] [Google Scholar]
- 35.Thomä N, Goody RS. Kinetic Analysis of Macromolecules. A practical approach. Oxford University Press; 2003. pp. 153–170. [Google Scholar]
- 36.Reardon JT, et al. Comparative analysis of binding of human damaged DNA-binding protein (XPE) and Escherichia coli damage recognition protein (UvrA) to the major ultraviolet photoproducts: T[c,s]T, T[t,s]T, T[6-4]T, and T[Dewar]T. The Journal of biological chemistry. 1993;268:21301–21308. [PubMed] [Google Scholar]
- 37.Gaidatzis D, Lerch A, Hahne F, Stadler MB. QuasR: quantification and annotation of short reads in R. Bioinformatics (Oxford, England) 2015;31:1130–1132. doi: 10.1093/bioinformatics/btu781. [DOI] [PMC free article] [PubMed] [Google Scholar]
- 38.Tang G, et al. EMAN2: an extensible image processing suite for electron microscopy. Journal of structural biology. 2007;157:38–46. doi: 10.1016/j.jsb.2006.05.009. [DOI] [PubMed] [Google Scholar]
- 39.Hohn M, et al. SPARX, a new environment for Cryo-EM image processing. Journal of structural biology. 2007;157:47–55. doi: 10.1016/j.jsb.2006.07.003. [DOI] [PubMed] [Google Scholar]
- 40.Grant T, Grigorieff N. Measuring the optimal exposure for single particle cryo-EM using a 2.6 A reconstruction of rotavirus VP6. eLife. 2015;4:e06980. doi: 10.7554/eLife.06980. [DOI] [PMC free article] [PubMed] [Google Scholar]
- 41.Li X, et al. Electron counting and beam-induced motion correction enable near-atomic-resolution single-particle cryo-EM. Nature methods. 2013;10:584–590. doi: 10.1038/nmeth.2472. [DOI] [PMC free article] [PubMed] [Google Scholar]
- 42.Zhang K. Gctf: Real-time CTF determination and correction. Journal of structural biology. 2016;193:1–12. doi: 10.1016/j.jsb.2015.11.003. [DOI] [PMC free article] [PubMed] [Google Scholar]
- 43.Scheres SH. RELION: implementation of a Bayesian approach to cryo-EM structure determination. Journal of structural biology. 2012;180:519–530. doi: 10.1016/j.jsb.2012.09.006. [DOI] [PMC free article] [PubMed] [Google Scholar]
- 44.Rosenthal PB, Henderson R. Optimal determination of particle orientation, absolute hand, and contrast loss in single-particle electron cryomicroscopy. Journal of molecular biology. 2003;333:721–745. doi: 10.1016/j.jmb.2003.07.013. [DOI] [PubMed] [Google Scholar]
- 45.Chen S, et al. High-resolution noise substitution to measure overfitting and validate resolution in 3D structure determination by single particle electron cryomicroscopy. Ultramicroscopy. 2013;135:24–35. doi: 10.1016/j.ultramic.2013.06.004. [DOI] [PMC free article] [PubMed] [Google Scholar]
- 46.Adams PD, et al. PHENIX: a comprehensive Python-based system for macromolecular structure solution. Acta crystallographica Section D, Biological crystallography. 2010;66:213–221. doi: 10.1107/s0907444909052925. [DOI] [PMC free article] [PubMed] [Google Scholar]
- 47.de la Rosa-Trevin JM, et al. Xmipp 3.0: an improved software suite for image processing in electron microscopy. Journal of structural biology. 2013;184:321–328. doi: 10.1016/j.jsb.2013.09.015. [DOI] [PubMed] [Google Scholar]
- 48.Grant T, Rohou A, Grigorieff N. cisTEM, user-friendly software for single-particle image processing. eLife. 2018;7 doi: 10.7554/eLife.35383. [DOI] [PMC free article] [PubMed] [Google Scholar]
- 49.Morgan MT, et al. Structural basis for histone H2B deubiquitination by the SAGA DUB module. Science (New York, N.Y.) 2016;351:725–728. doi: 10.1126/science.aac5681. [DOI] [PMC free article] [PubMed] [Google Scholar]
- 50.Ong MS, Richmond TJ, Davey CA. DNA stretching and extreme kinking in the nucleosome core. Journal of molecular biology. 2007;368:1067–1074. doi: 10.1016/j.jmb.2007.02.062. [DOI] [PubMed] [Google Scholar]
- 51.Emsley P, Cowtan K. Coot: model-building tools for molecular graphics. Acta crystallographica Section D, Biological crystallography. 2004;60:2126–2132. doi: 10.1107/s0907444904019158. [DOI] [PubMed] [Google Scholar]
- 52.Nicholls RA, Long F, Murshudov GN. Low-resolution refinement tools in REFMAC5. Acta crystallographica Section D, Biological crystallography. 2012;68:404–417. doi: 10.1107/s090744491105606x. [DOI] [PMC free article] [PubMed] [Google Scholar]
- 53.Chen VB, et al. MolProbity: all-atom structure validation for macromolecular crystallography. Acta crystallographica Section D, Biological crystallography. 2010;66:12–21. doi: 10.1107/s0907444909042073. [DOI] [PMC free article] [PubMed] [Google Scholar]
- 54.Winn MD, et al. Overview of the CCP4 suite and current developments. Acta crystallographica Section D, Biological crystallography. 2011;67:235–242. doi: 10.1107/s0907444910045749. [DOI] [PMC free article] [PubMed] [Google Scholar]
- 55.Zheng SQ, et al. MotionCor2: anisotropic correction of beam-induced motion for improved cryo-electron microscopy. Nature methods. 2017;14:331–332. doi: 10.1038/nmeth.4193. [DOI] [PMC free article] [PubMed] [Google Scholar]
- 56.Ekundayo B, Richmond TJ, Schalch T. Capturing Structural Heterogeneity in Chromatin Fibers. Journal of molecular biology. 2017;429:3031–3042. doi: 10.1016/j.jmb.2017.09.002. [DOI] [PubMed] [Google Scholar]
Associated Data
This section collects any data citations, data availability statements, or supplementary materials included in this article.


