

Abstract
Background:
Previous neuroimaging studies have detected markers of neuroinflammation in patients with Myalgic Encephalomyelitis/Chronic Fatigue Syndrome (ME/CFS). Magnetic Resonance Spectroscopy (MRS) is suitable for measuring brain metabolites linked to inflammation, but has only been applied to discrete regions of interest in ME/CFS. We extended the MRS analysis of ME/CFS by capturing multi-voxel information across the entire brain. Additionally, we tested whether MRS-derived brain temperature is elevated in ME/CFS patients.
Methods:
Fifteen women with ME/CFS and 15 age- and gender-matched healthy controls completed fatigue and mood symptom questionnaires and whole-brain echo-planar spectroscopic imaging (EPSI). Choline (CHO), myo-inositol (MI), lactate (LAC), and N-acetylaspartate (NAA) were quantified in 47 regions, expressed as ratios over creatine (CR), and compared between ME/CFS patients and controls using independent-samples t-tests. Brain temperature was similarly tested between groups.
Results:
Significant between-group differences were detected in several regions, most notably elevated CHO/CR in the left anterior cingulate (p < 0.001). Metabolite ratios in seven regions were correlated with fatigue (p < 0.05). ME/CFS patients had increased temperature in the right insula, putamen, frontal cortex, thalamus, and the cerebellum (all p < 0.05), which was not attributable to increased body temperature or differences in cerebral perfusion. Brain temperature increases converged with elevated LAC/CR in the right insula, right thalamus, and cerebellum (all p < 0.05).
Conclusions:
We report metabolite and temperature abnormalities in ME/CFS patients in widely distributed regions. Our findings may indicate that ME/CFS involves neuroinflammation.
Keywords: Neuroinflammation, Chronic Fatigue Syndrome, Magnetic Resonance Spectroscopy, anterior cingulate, brain temperature, metabolites
1. Introduction
Myalgic Encephalomyelitis/Chronic Fatigue Syndrome (ME/CFS) is a heterogeneous and multisystem disease characterized by profound recurring fatigue that is not alleviated by rest. Individuals with ME/CFS also often experience widespread pain, profound malaise after exertion, tender lymph nodes, and cognitive impairment (Fukuda et al., 1994).
The pathophysiology of ME/CFS is still uncertain, as dysregulations in several body systems have been identified in the literature (Rimbaut, Van Gutte, Van Brabander, & Vanden Bossche, 2016). One hypothesis is that ME/CFS represents a state of chronic, low-level neuroinflammation (Komaroff, 2017). The term “low-level” neuroinflammation is used here to distinguish it from meningitis or encephalitis, or other medically emergent or neurodegenerative conditions such as traumatic brain injury, stroke, and multiple sclerosis. Many of the core ME/CFS symptoms are also seen in the classic sickness response that results from the release of pro-inflammatory cytokines by microglia in the brain (McCusker & Kelley, 2013; Poon, Ho, Chiu, Wong, & Chang, 2015). Moreover, several studies have provided evidence of central inflammation in ME/CFS. Analyses of cerebrospinal fluid from lumbar punctures have found elevated levels of pro-inflammatory cytokines, and decreased anti-inflammatory cytokines, in ME/CFS patients (Hornig et al., 2017; Natelson, Weaver, Tseng, & Ottenweller, 2005; Peterson et al., 2015). More directly, positron emission tomography (PET) of the 18kDa translocator protein (TSPO) receptor has shown elevated uptake in several cortical, subcortical, and brain stem regions in ME/CFS patients compared to healthy controls (Nakatomi et al., 2014). Because TSPO binding is increased when microglia are in a pro-inflammatory state, increased PET binding is used as a marker of neuroinflammation (Alam, Lee, & Lee, 2017; Dupont et al., 2017).
Brain inflammation in ME/CFS has also been explored via magnetic resonance spectroscopy (MRS). MRS can be used to measure the levels of several metabolites related to neuroinflammation, including choline-containing compounds (CHO), myo-inositol (MI), lactate (LAC), and N-acetylaspartate (NAA). A few studies employing single-voxel MRS have identified metabolite abnormalities in the brains of individuals with ME/CFS. Increased CHO has been reported in the occipital cortex (Puri et al., 2002), frontal white matter (Tomoda et al., 2000), and basal ganglia (Chaudhuri, Condon, Gow, Brennan, & Hadley, 2003). Other studies have detected elevated LAC in the cerebral ventricles of ME/CFS patients (Mathew et al., 2009; Murrough et al., 2010; Natelson, Mao, et al., 2017; Natelson, Vu, et al., 2017; Shungu et al., 2012). Brooks and colleagues (2000) reported reduced levels of the axonal marker NAA in the hippocampus of ME/CFS patients. The idea that MRS is suitable for detecting inflammation-related changes in the brain is also supported by animal studies demonstrating changes in MRS-derived metabolite concentrations following acute administration of lipopolysaccharide – a known inflammatory stimulus (Moshkin et al., 2014). MRS metabolites have also been used to monitor the progression of known inflammatory disorders, such as multiple sclerosis (Kirov et al., 2017; Kocevar et al., 2018), and have been shown to correlate with cerebrospinal fluid markers of inflammation (Anderson et al., 2015) and with pathology in human and animal tissue samples (Bitsch et al., 1999; Bjartmar, Battistuta, Terada, Dupree, & Trapp, 2002; Omori et al., 1997).
One limitation of previous ME/CFS studies employing MRS is that they have analyzed small regions of the brain. Therefore, in this study, we proposed to extend the MRS analysis of ME/CFS by capturing multi-voxel information across the entire brain. 3D echo-planar spectroscopic imaging (EPSI) allows whole-brain imaging by obtaining metabolite spectra and their spatial location in the brain simultaneously (Ebel & Maudsley, 2003). This approach does not require a priori hypotheses regarding the location of pathology, and allows information from multiple voxels to be averaged for increased confidence in concentration estimates.
In addition to acquiring whole-brain MRS information, we attempted to extend previous studies by adding a measure of brain temperature. Temperature is calculated from the location of the temperature-variant water resonance peak relative to the Creatine (CR) peak, which resonates at 3.0 ppm, regardless of temperature. Regional brain temperature has been used as a proxy for measuring neuroinflammation, with the observation that microglia activation can increase metabolic demands (Orihuela, McPherson, & Harry, 2016), potentially leading to excess heat. Elevated brain temperature has been found in several neuroinflammatory conditions (Karaszewski et al., 2013; Rumana, Gopinath, Uzura, Valadka, & Robertson, 1998), but has not been tested in ME/CFS.
In this study, we utilized EPSI to acquire whole-brain metabolite levels and temperature in individuals with ME/CFS and age-matched controls. To our knowledge, it is the first whole-brain MRS study conducted in individuals with ME/CFS. We hypothesized that the ME/CFS group would show elevated CHO, MI, LAC, higher brain temperature, and lower NAA than the control group. Support for those hypotheses would be consistent with the presence of brain inflammation in ME/CFS.
2. Material and Methods
2.1. Participants
Potential participants were identified via the laboratory’s database of 1,200 individuals who had expressed an interest in research participation, and screened for inclusion criteria by members of the research team. Seventeen women with ME/CFS and 17 age-matched women were invited to participate. In order to standardize diagnostic criteria and severity of the condition in our sample, participants with ME/CFS had to meet the following inclusion criteria: (i) age between 18–55 years; (ii) met Fukuda case definition criteria for ME/CFS (Fukuda et al., 1994), without the Reeves et al. (2005) modifications but with additional criteria proposed by Jason et al. (2010); and (iii) average self-reported daily fatigue rating of ≥ 6 on an 11-point scale. A physician diagnosis of ME/CFS was not required, due to the variations in diagnostic criteria applied in clinical practice. Control participants were also aged between 18–55 years, were matched within two years of participants with ME/CFS, and reported average daily fatigue ratings of ≤ 2 on an 11-point scale. Exclusion criteria for both groups included: (i) MRI safety contraindications; (ii) diagnosed neurological, major psychiatric, autoimmune, rheumatologic, or inflammatory disorders; (iii) psychostimulant or opioid use; (iv) smoking; or (v) regular use of non-steroidal anti-inflammatory drugs (NSAIDs; e.g. acetaminophen, ibuprofen, naproxen, aspirin). Although occasional use of NSAIDs was permitted, participants were instructed not to use these within 24 hours of participating in this study. All study procedures were approved by the Institutional Review Board at the University of Alabama at Birmingham (UAB).
2.2. Study Protocol
On the day of the study, written consent was obtained from all participants before research procedures were undertaken. Participants were then asked to complete questionnaires (described below), and body temperature was measured in the left and right ear using Braun Pro 4000 ThermoScan thermometer. Following MRI acquisition (approximately 45 minutes), body temperature measurements were repeated and participants were compensated upon completion of the session.
2.3. Symptom Questionnaires
In order to assess the severity of symptoms associated with ME/CFS, the Fatigue Severity Scale; FSS (Krupp, LaRocca, Muir-Nash, & Steinberg, 1989), and the Hospital Anxiety and Depression Scale; HADS (Zigmond & Snaith, 1983) were administered. The FSS consists of nine questions and uses a seven-point (1–7) Likert scale (ranging from strongly disagrees to strongly agrees) and is designed to assess the connection between fatigue intensity and functional disability. The HADS is divided into an Anxiety subscale (HADS-A) and a Depression subscale (HADS-D), both containing seven items on a four-point (0–3) scale, and was used to measure states of anxiety and depression.
2.4. Image Acquisition
Data were collected at the Civitan International Neuroimaging Laboratory at UAB, using a 3.0T Siemens Magnetom Prisma System (Siemens Medical Solutions, Erlangen, Germany) and a 20-channel head/neck coil. A T1-weighted image was acquired for segmentation and anatomical reference using a magnetization prepared rapid gradient echo (MPRAGE) sequence: repetition time (TR) = 2000 ms; echo time (TE) = 2.51 ms; flip angle = 8°; 208 slices; slice thickness = 0.9 mm; field of view (FOV) = 230 × 230 mm; matrix = 256 × 256; acquisition time (TA) = 5 min; voxel resolution = 0.9 × 0.9 × 0.9 mm.
Whole-brain MRSI data were acquired using a 3D EPSI sequence (Ebel & Maudsley, 2003): TR = 1550 ms; TE = 17.6 ms; lipid inversion nulling with inversion time (TI) = 198 ms; spin-echo excitation with selection of a 135 mm axial slab covering the cerebrum; flip angle = 71°; FOV = 280 × 280 × 180 mm; matrix = 50 × 50 × 18; generalized autocalibrating partially parallel acquisitions (GRAPPA) factor = 1.3; TA = 18 min; voxel resolution = 5.6 × 5.6 × 10 mm.
To characterize any differences in cerebral perfusion that may contribute to metabolic abnormalities, a 2D arterial spin labeling (ASL) scan was acquired using a Proximal Inversion with Control of Off-Resonance Effects (PICORE) labeling scheme: TR = 2500ms; T E= 16.18 ms; TI = 1800 ms; 12 slices; FOV = 256 × 256 mm; matrix = 64 × 64 mm; TA = 5 min; voxel resolution = 4 × 4 × 8 mm. Sixty pairs of axial label/control images were collected.
2.5. Image Processing
MRSI data were processed using the fully automated MRSI processing pipeline within the Metabolite Imaging and Data Analysis System (MIDAS) software package (Maudsley et al., 2009). Images were reconstructed, corrected for spatially-dependent B0 shifts, interpolated to 64 × 64 × 32 points, and smoothed with a Gaussian kernel (5mm in plane; 7mm through plane). Following spatial smoothing, the effective voxel volume was 1.5 ml. The resultant maps were registered to high-resolution structural images. Automated spectral fitting was carried out in FITT2 using Gaussian line shapes for all resonances and then normalized to institutional units using tissue water as a reference, which was acquired using a non-water-suppressed acquisition that was interleaved with the metabolite measurement. Maps of the tissue distribution that corresponded to the spectroscopic image resolution spatial response function were obtained following segmentation of the T1-weighted MRI using FSL/FAST (Zhang, Brady, & Smith, 2001). A non-linear spatial transform was then applied to register all metabolite ratios and tissue distribution images to Montreal Neurological Institute (MNI) space at 2 mm isotropic voxel resolution. A modified version of the Automated Anatomical Labeling (AAL) atlas was used as the spatial reference (Tzourio-Mazoyer et al., 2002), which delineated 47 anatomical structures suitable for lower resolution MRSI data by combining smaller regions of interest (ROIs). The ROI-based approach was used because it provides improved signal-to-noise ratio compared to a voxel-wise analysis, and reduces the total number of statistical tests (and corresponding false positives). To corroborate previous findings of elevated ventricular LAC, (Brooks et al., 2000; Mathew et al., 2009; Murrough et al., 2010; Natelson, Mao, et al., 2017; Natelson, Vu, et al., 2017; Shungu et al., 2012), the lateral ventricles were also delineated as a region of interest.
2.6. Data Analysis
MRS data were analyzed using the Project Review and Analysis (PRANA) and Map Integrated Spectrum (MINT) modules within MIDAS. Prior to statistical tests, voxels were excluded based on the following quality criteria: (i) fitted metabolite linewidth > 13 Hz; (ii) having an outlying value > 2.5 times the standard deviation of all valid voxels over the image; and (iii) having a Cramér-Rao Lower Bounds (CRLB) for fitting of CR of > 40%; and (iv) having > 30% CSF contribution to the voxel volume. The inverse spatial transform was then applied to generate atlas-defined regions of interest in subject space; spectral averaging was performed in MINT to obtain images for NAA, CR, CHO, MI, and LAC in each region of interest. Metabolites were expressed as ratios of CR to allow for more direct comparisons across different studies. CR is often used as an internal reference for other metabolites as its levels are assumed to be relatively constant. However, some reports have suggested that CR is not homogeneously distributed across the brain and the assumption that levels remain constant may be incorrect under both normal and pathological states (Jansen, Backes, Nicolay, & Kooi, 2006). Therefore, we tested levels of CR (area under the curve) in each region between groups.
Brain temperature maps were generated using the frequency difference between the water and CR peaks using the following formula: T= −102.61 ×∆ water-CR + 206.1°C (Maudsley, Goryawala, & Sheriff, 2017).
ASL data were processed using ASLtbx (Wang et al., 2008) for SPM12 (Wellcome Trust Centre for Neuroimaging, London, UK) within MATLAB (MathWorks, Natick, MA, USA). Image pairs were realigned to the mean of all control images to correct for head movements, and spatially smoothed with a 3D isotropic Gaussian kernel with full-width at half-maximum of 6 mm to decrease noise for subsequence image subtraction. Each label/control pair was subtracted for quantification of cerebral blood flow (CBF) in ml/100g/min. Mean CBF maps were first registered to high-resolution structural space using the affine registration implemented in SPM12, and then further registered to MNI space using non-linear warps from structural-to-standard registrations in FSL/FNIRT (Andersson et al., 2010). Mean CBF was quantified in each ROI from the modified AAL atlas.
2.7. Statistics
Main analyses were conducted using univariate independent samples t-tests and a significance threshold of p < 0.05 (uncorrected) to compare metabolite ratios and brain temperature between the ME/CFS and control groups in each ROI. Dependent variables were: (i) CHO/CR; (ii) MI/CR; (iii) LAC/CR; (iv) NAA/CR; and (v) brain temperature. An additional false discovery rate (FDR) of 0.01 was used to correct for the number of regions of interest tests (equivalent to uncorrected p < 0.0023). Equivalent independent samples t-tests were used to compare mean CBF values between ME/CFS patients and controls in each ROI.
To determine the relationship between metabolite ratios, brain temperature, and fatigue in ME/CFS patients, regions that showed significant differences in metabolite ratios or temperature were tested (two-tailed) for associations with fatigue severity using Spearman’s rho (rs) and a significance threshold of p < 0.05. We also obtained Spearman correlations between anxiety (HADS-A) and depression (HADS-D) and metabolite ratios in the same brain regions.
3. Results
3.1. Participants
Data from four participants in the ME/CFS (n = 2) and control group (n = 2) were excluded due to visible movement during acquisition, leaving data from 15 participants in each group. The most common comorbid medical conditions in the ME/CFS group were gastrointestinal disorders (n=3), hypothyroidism (controlled; n=3), fibromyalgia (n=2), and asthma (n=2). The most common medications used by ME/CFS patients were antidepressants (n=10), asthma and allergy medications (n=4), proton-pump inhibitors (n=4); sleep medications (n=4), thyroid hormone (n=3), and occasional NSAIDs (n=3). Refer to Online Resource 1 for a complete list of comorbid medical conditions and medications in the ME/CFS group.
Group means and results from between-groups t-tests comparing the clinical and questionnaire data are displayed in Table 1. Overall, the groups did not differ significantly in age; however, as expected, participants in the ME/CFS group reported higher fatigue severity, as well as higher anxiety and depression subscales on the HADS. Anxiety (mean = 9.67) and depressed mood (mean = 8.00) in the ME/CFS group are considered to be in the mild range (Stern, 2014). Scores of 11 or higher on this scale indicate moderate severity, and scores of 15 or higher indicate high severity. Participants in the ME/CFS group had higher body temperature (average tympanic temperature before and after the scan).
Table 1:
Group means and their standard deviations (SD) for clinical and questionnaire data at baseline. p-values refer to independent-samples t-tests comparing the ME/CFS and control group means.
| ME/CFS group (n=15) | Control group (n=15) | P | |||
|---|---|---|---|---|---|
| Mean | SD | Mean | SD | ||
| Age (years) | 40.27 | 8.84 | 40.80 | 9.22 | 0.873 |
| Fatigue severity (9–63) | 54.33 | 6.78 | 10.87 | 2.50 | <0.001 |
| Anxiety (0–21) | 9.67 | 4.07 | 2.60 | 1.96 | <0.001 |
| Depressed mood (0–21) | 8.00 | 3.07 | 0.40 | 0.83 | <0.001 |
| Average body temperature (°C) | 36.97 | 0.19 | 36.72 | 0.23 | 0.003 |
3.2. Main Results
To test the validity of CR as a denominator in metabolite ratios, levels of this metabolite were tested between groups. Mean CR in the ME/CFS and control groups in the 47 AAL atlas regions and results from t-tests comparing the group means are provided in Online Resource 2. Of the 47 regions and the lateral ventricles, levels of CR differed significantly (p < 0.05) between groups in the left parietal cortex and left putamen. In the parietal cortex, CR was lower in the ME/CFS group (M = 6.417, SD = 1.056) than the control group (M = 7.252, SD = 0.907); t(28) = −2.232, p=0.028. In the putamen, CR was higher in ME/CFS group (M = 6.324, SD = 0.717) than in controls (M = 5.694, SD = 0.529); t(28) = 2.737, p = 0.011. CR was not different between groups in any other regions.
Figure 1 shows an example metabolite map from one participant with ME/CFS, as well as representative spectra from one participant in each group. Metabolic differences were observed in several brain regions. Metabolites related to neuroinflammation (CHO, MI, and LAC) were higher in ME/CFS patients compared to controls in several brain regions. Table 2 displays metabolite group means and results from between-groups t-tests that reached significance at p<0.05 (uncorrected). Participants with ME/CFS also showed significantly lower NAA/CR in the right fusiform and lingual gyri. The only result to survive corrections for multiple comparisons was elevated CHO/CR in the left anterior cingulate of participants with ME/CFS (Figure 2).
Fig. 1.
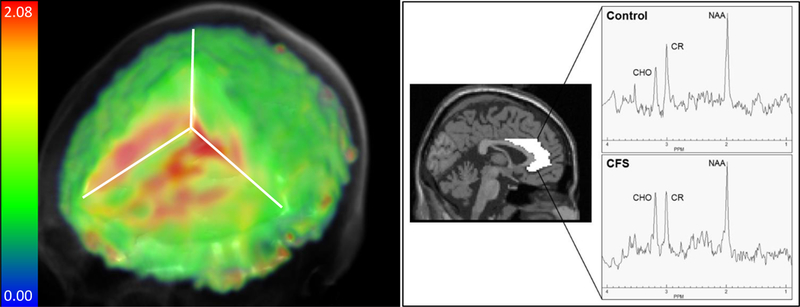
Left: Example whole-brain metabolite map of CHO/CR ratios from one participant with ME/CFS. Right: Spectra from the left anterior cingulate of one participant with CFS compared to an age-matched control participant are shown, evidencing an elevated CHO peak. The ROI is delineated from the AAL atlas in MNI space.
Table 2:
Group means and their standard deviations (SD) of metabolite ratios in regions of interest that showed group differences. t-values and corresponding p-values (uncorrected) are from independent-samples t-tests comparing group means in the ME/CFS and control group.
| ME/CFS group | Control group | t | df | p | ||||
|---|---|---|---|---|---|---|---|---|
| Metabolite | ROI | Mean | SD | Mean | SD | |||
| NAA/CR | R fusiform gyrus | 1.014 | 0.216 | 1.185 | 0.18 | -2.305 | 28 | 0.029 |
| R lingual gyrus | 1.174 | 0.154 | 1.294 | 0.149 | -2.158 | 28 | 0.040 | |
| CHO/CR | L anterior cingulate | 0.238 | 0.028 | 0.195 | 0.037 | 3.624 | 28 | 0.001* |
| R occipital cortex | 0.153 | 0.038 | 0.122 | 0.028 | 2.529 | 28 | 0.017 | |
| R anterior cingulate | 0.231 | 0.032 | 0.207 | 0.026 | 2.297 | 28 | 0.029 | |
| L middle cingulate | 0.210 | 0.027 | 0.192 | 0.016 | 2.221 | 28 | 0.035 | |
| R calcarine sulcus | 0.143 | 0.027 | 0.123 | 0.021 | 2.169 | 28 | 0.039 | |
| R temporal cortex | 0.185 | 0.023 | 0.167 | 0.023 | 2.105 | 28 | 0.044 | |
| LAC/CR | R lingual gyrus | 0.220 | 0.202 | 0.067 | 0.067 | 2.774 | 28 | 0.013 |
| L middle cingulate | 0.147 | 0.095 | 0.074 | 0.055 | 2.593 | 28 | 0.016 | |
| R insula | 0.180 | 0.138 | 0.085 | 0.062 | 2.427 | 28 | 0.022 | |
| L insula | 0.190 | 0.131 | 0.092 | 0.085 | 2.429 | 28 | 0.023 | |
| R fusiform gyrus | 0.164 | 0.171 | 0.049 | 0.048 | 2.517 | 28 | 0.023 | |
| L temporal cortex | 0.214 | 0.142 | 0.121 | 0.055 | 2.372 | 28 | 0.029 | |
| L hippocampus | 0.195 | 0.187 | 0.077 | 0.053 | 2.365 | 16.253† | 0.031 | |
| L rolandic operculum | 0.171 | 0.186 | 0.051 | 0.063 | 2.355 | 17.194† | 0.031 | |
| L precuneus | 0.204 | 0.154 | 0.101 | 0.075 | 2.315 | 20.335† | 0.031 | |
| R calcarine sulcus | 0.191 | 0.164 | 0.086 | 0.061 | 2.312 | 17.787† | 0.033 | |
| R parietal cortex | 0.362 | 0.286 | 0.179 | 0.123 | 2.274 | 19.004† | 0.035 | |
| L parietal cortex | 0.281 | 0.183 | 0.159 | 0.103 | 2.252 | 22.056† | 0.035 | |
| R thalamus | 0.175 | 0.185 | 0.071 | 0.046 | 2.132 | 15.700† | 0.049 | |
| cerebellum | 0.155 | 0.129 | 0.08 | 0.051 | 2.108 | 18.223† | 0.049 | |
| MI/CR | R pallidum | 0.439 | 0.296 | 0.227 | 0.203 | 2.260 | 28 | 0.032 |
CHO = choline-containing compounds; CR = creatine; LAC = lactate; MI = myo-inositol; NAA = N-acetylaspartate; L = left; R = right. ME/CFS group: n=15; control group: n=15
df adjusted for unequal variances.
Results surviving corrections for multiple comparisons using a false discovery rate of 0.01 (uncorrected p < 0.0023)
Fig. 2.
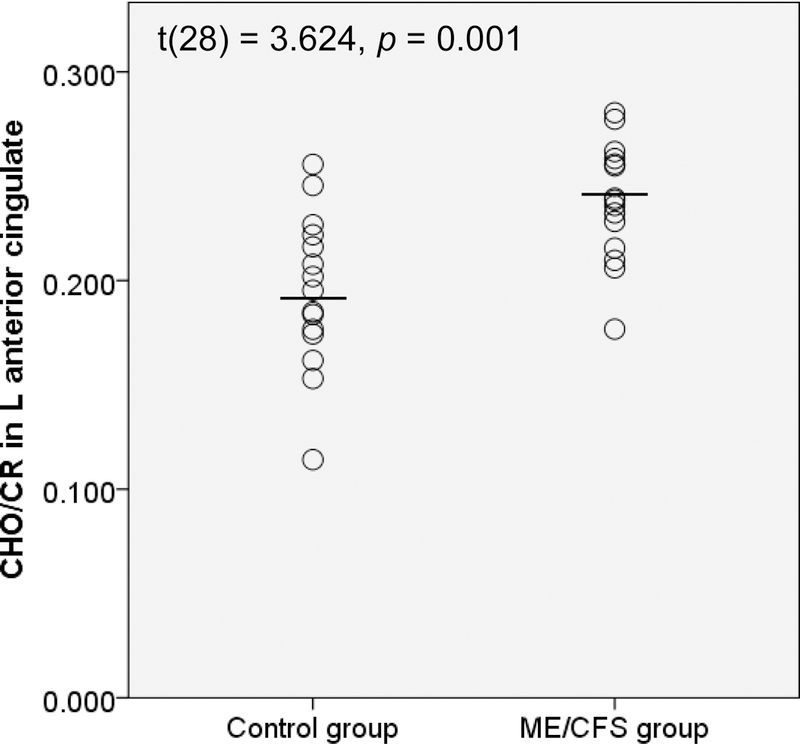
CHO/CR ratios in the left anterior cingulate for control vs. ME/CFS groups. L = left
The LAC/CR ratio in the lateral ventricles was not different between groups (ME/CFS group: M = 0.367, SD = 0.359; control group: M = 0.170, SD = 0.089; t(15.709) = 2.057, p = 0.057).
Independent-samples t-tests on regional CBF determined that there were no difference between ME/CFS patients and controls in any ROI that showed metabolic differences (all p > 0.05). Refer to Online Resource 3 for results from t-tests comparing the regional CBF group means.
Of the regions showing metabolic differences, several also showed significant correlations between metabolite ratios and self-reported fatigue on the FSS (Table 3, Figure 3), whereby higher ratios were associated with higher fatigue. None of the metabolite ratios associated with inflammation showed negative associations with fatigue.
Table 3:
Significant correlations (Spearman’s rho) between metabolite ratios and self-reported fatigue (measured using the FSS) in regions showing metabolic differences in the ME/CFS group
| Metabolite ratio | ROI | n | rs | p |
|---|---|---|---|---|
| CHO/CR | R ccipital cortex | 15 | 0.677 | 0.006 |
| LAC/CR | R fusiform gyrus | 15 | 0.620 | 0.014 |
| L temporal cortex | 15 | 0.604 | 0.017 | |
| R calcarine sulcus | 15 | 0.598 | 0.018 | |
| L parietal cortex | 15 | 0.591 | 0.020 | |
| MI/CR | R pallidum | 14 | 0.558 | 0.038 |
| NAA/CR | R lingual gyrus | 15 | −0.699 | 0.004 |
CHO = choline-containing compounds; CR = creatine; LAC = lactate; MI = myo-inositol; NAA = N-acetylaspartate; L = left; R = right.
Fig. 3.
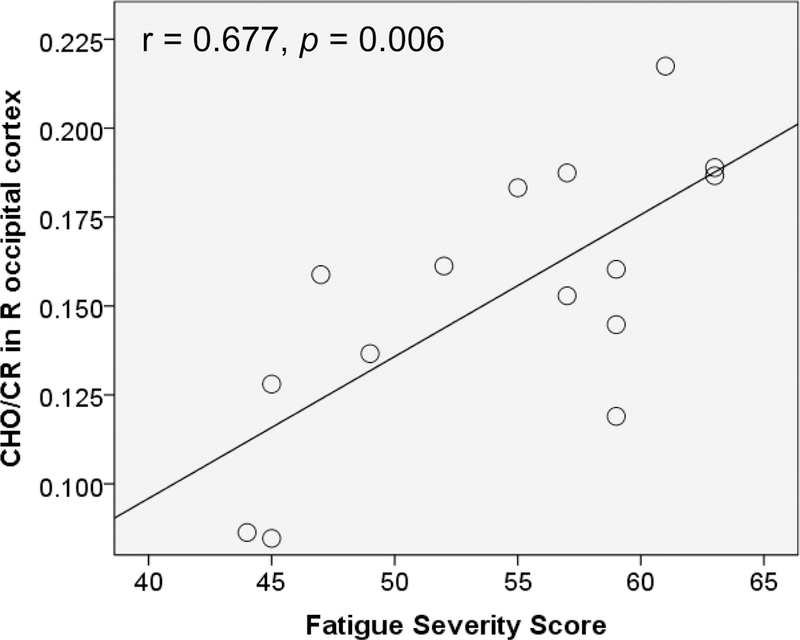
Relationship between CHO/CR in the right occipital cortex and fatigue severity of the FSS. R = right
CHO/CR ratios in the L anterior cingulate showed moderate positive correlations with anxiety (rs = 0.566, p = 0.028, n = 15), while LAC/CR in the L Rolandic operculum, R thalamus, and lateral ventricles showed moderate negative correlations with anxiety (L Rolandic operculum: rs = −0.606, p = 0.017; R thalamus: rs = −0.597, p = 0.019; lateral ventricles: rs = - 0.521, p = 0.046; all n = 15). CHO/CR in the R occipital cortex was moderately positively correlated with depression (rs = 0.595, p = 0.019, n = 15). All other correlations were not significant (p > 0.05).
Participants with ME/CFS also showed significantly higher average brain temperature than control participants at p < 0.05 in five brain regions – the right frontal cortex, right insula, right putamen, right thalamus, and cerebellum (Table 4). These findings did not survive corrections for multiple comparisons. To exclude the possibility that the brain temperature differences were driven by the observed differences in body temperature between the groups, we obtained Spearman’s rho and two-tailed significance tests (α = 0.05) between temperatures in the five brain regions and core body temperature in the ME/CFS group. Brain temperature was not significantly correlated with body temperature in any of the assessed regions (right frontal cortex: rs = 0.229, p = 0.224; right insula: rs = 0.180, p = 0.341; right putamen: rs = 0.069, p = 0.715; thalamus: rs = 0.058, p = 0.759; cerebellum: rs = 0.225, p = 0.232), suggesting that elevated brain temperature in ME/CFS is not a consequence of elevated body temperature.
Table 4:
Regions showing temperature differences between groups. ME/CFS group: n=15.
| Temperature (°C)/ROI | ME/CFS group | Control group | |||||
|---|---|---|---|---|---|---|---|
| Mean | SD | Mean | SD | t | df | p | |
| Temperature in R insula | 36.94 | 0.426 | 36.53 | 0.466 | 2.565 | 28 | 0.016 |
| Temperature in cerebellum | 37.02 | 0.455 | 36.52 | 0.628 | 2.510 | 28 | 0.018 |
| Temperature in R putamen | 36.51 | 0.444 | 36.14 | 0.467 | 2.248 | 28 | 0.033 |
| Temperature in R frontal cortex | 36.93 | 0.405 | 36.53 | 0.564 | 2.231 | 28 | 0.034 |
| Temperature in R thalamus | 36.76 | 0.409 | 36.48 | 0.321 | 2.127 | 28 | 0.042 |
Control group: n=15.
4. Discussion
4.1. Main Results
The primary aim of this study was to assess putative markers of neuroinflammation across the brain in ME/CFS. Women with ME/CFS and age-matched women underwent whole-brain MRS. We found elevations of CHO, LAC, MI, and temperature in several brain regions in the ME/CFS group, as well as lower levels of the neuronal marker NAA. We showed that these differences were not attributable to body temperature increases or to abnormalities in regional blood supply. Metabolite and temperature abnormalities were distributed across large portions of the brain, and are consistent with global neuroinflammation.
Elevated CHO in the ME/CFS group was found in the bilateral anterior cingulate (ACC), left middle cingulate, right calcarine sulcus, and right occipital and temporal lobes. These results support previous reports of increased CHO in ME/CFS, specifically in the occipital cortex (Puri et al., 2002). Because only free CHO and water-soluble breakdown products of membrane components (i.e. phosphocholine, glycerophosphocholine) are detectable by MRS, excess CHO has been interpreted as indicating abnormal phospholipid metabolism and accelerated cell membrane turnover, consistent with the processes of glial proliferation and demyelination (Glunde, Jie, & Bhujwalla, 2004; Lin & Gant, 2013). Although inflammation in ME/CFS is expected to be of low severity and may not cause demyelination, diffusion studies have previously pointed to subtle white matter abnormalities in ME/CFS (Zeineh et al., 2015). The current findings suggest that glial proliferation may underlie these changes. Increased CHO/CR is consistent with the presence of neuroinflammation in patients with ME/CFS.
The most significant difference in the study was CHO in the left ACC. We note this area in particular because it is the only region to survive corrections for multiple comparisons, and because it has been noted as a critically important region mediating cytokine-induced fatigue and mood deterioration (Capuron et al., 2005; Harrison et al., 2009). Cytokine-induced fatigue and depressive symptoms have previously been attributed to inflammation in the ACC, as indicated by elevated glutamate on MRS (Haroon et al., 2014). The current study provides further evidence for the link between ACC inflammation and fatigue by demonstrating that ME/CFS patients show elevated CHO in this region. Although FSS scores were not significantly correlated with CHO/CR in the left ACC in our sample, this could be due to the small sample size or poor sensitivity of the measure. We found a moderate positive correlation with anxiety, which shows that ACC abnormalities can have a variety of behavioral effects. The correlation with depression was not significant, although this is likely due to the low depressive symptoms in our sample.
MI was tested in this study because it is preferentially expressed in glial cells, and increases suggest changes in the density or activation status of microglia and astrocytes that are consistent with inflammatory processes (Chang, Munsaka, Kraft-Terry, & Ernst, 2013; Grover et al., 2012). We found MI to be normal in almost all areas of the brain in ME/CFS, with the exception of an elevation in the right globus pallidus. It is unclear how microglia abnormalities in the globus pallidus may be associated with ME/CFS, though several studies have found associations between fatigue and abnormal processing in this region (Bernitsas et al., 2017; Boissoneault, Sevel, Robinson, & Staud, 2018; Ferrero, Silver, Cocchetto, Masliah, & Langford, 2017; Goni, Basu, Murray, & Waiter, 2018; Hou et al., 2016; MacHale et al., 2000).
Because NAA is used as a marker of neuronal health in MRS studies, we examined NAA throughout the brain. NAA was determined to be normal in general, though decreased NAA was found in the right lingual and fusiform gyri in ME/CFS patients relative to controls. Finkelmeyer et al. (2018) recently reported gray matter volume increases in the same areas. Fluid accumulation could account for both the metabolite and structural abnormalities, and is consistent with the presence of localized inflammatory processes. However, because abnormalities in this area of the brain are not often associated with ME/CFS, we caution against over-interpretation of these results.
We found increased LAC in ME/CFS patients in the bilateral insula, bilateral parietal cortex, left hippocampus, left middle cingulate gyrus, left precuneus, right thalamus, right rolandic operculum, left temporal cortex, right calcarine sulcus, right fusiform gyrus, right lingual gyrus, and cerebellum. LAC is a byproduct of anaerobic cell metabolism (glycolysis) that is not found at high levels in the healthy brain, but is produced by various immune cells under inflammatory conditions (Dienel, 2012; El Ghazi et al., 2010). Because anaerobic glycolysis results in much less efficient synthesis of adenosine triphosphate (ATP) than healthy metabolism, the resultant energy deficits at the cellular level may drive the profound fatigue experienced by ME/CFS patients (Castro-Marrero et al., 2013; Lawson, Hsieh, March, & Wang, 2016; Myhill, Booth, & McLaren-Howard, 2013).
Our findings support several previous reports of elevated LAC in the brains of ME/CFS patients (Brooks et al., 2000; Mathew et al., 2009; Murrough et al., 2010; Natelson, Mao, et al., 2017; Natelson, Vu, et al., 2017; Shungu et al., 2012). Those studies reported LAC abnormalities in the cerebral ventricles, and we show here that LAC elevations may extend to the parenchyma. While we did not replicate the ventricular LAC elevations reported previously, we did observe ventricular LAC to be over twice as high in the ME/CFS group compared to the control group (p = 0.057), so the lack of statistical results may be partially resulting from inadequate power. Also, the short TE used in our acquisition can result in contamination of the LAC peak from lipids. Future studies using whole-brain MRS may require a separate scan with TE optimized for LAC.
We also examined temperature across the brain in ME/CFS and control participants. Consistent with our metabolite data, and with previous reports of increased temperature in other neuroinflammatory conditions, we found that individuals with ME/CFS had higher average temperatures in the right frontal cortex, right insula, as well as the right putamen and thalamus, and the cerebellum than the control group. Brain temperature increases were not attributable to elevated body temperature, and there were no regions where controls had higher brain temperatures than ME/CFS individuals. Temperature elevations in ME/CFS ranged from 0.28 to 0.5 °C above the respective regional temperature in control participants. Brain temperatures in the ME/CFS group were not, on average, elevated to a degree to be considered hyperthermic. It is not certain that the observed temperature differences are associated with neuroinflammation. However, we note that three out of the five regions with elevated brain temperature in individuals with ME/CFS also contained elevated lactate: the right insula, right thalamus, and cerebellum. The convergence of elevated lactate and elevated temperature in the same regions suggest heightened metabolism that may be related to neuroinflammation.
4.2. Limitations
Three main caveats must be noted regarding the interpretability of our findings. First, following MRS conventions, we have expressed all metabolite results as ratios over CR rather than absolute concentrations. While this method allows more direct comparisons across laboratories and scanners, it is dependent on the stability of CR, which cannot always be assumed (Jansen et al., 2006; Maudsley et al., 2009). When tested directly, we found that CR levels differed between the ME/CFS group and control in the left parietal cortex and putamen. Thus, our finding of increased LAC/CR in the left parietal cortex should be interpreted with caution. No significant group differences in CR were detected for any other region. Ultimately, this issue could be avoided if absolute metabolite concentrations were quantified from MRS data, although technical difficulties limit how soon the practice will be adopted across the field.
Second, it is difficult to guard against both false positives and false negatives in cases where the sample size is relatively small compared to the number of tests performed. We have presented our results using uncorrected as well as FDR-corrected p-values. The majority of regions did not meet the threshold for significance under multiple comparison corrections, and we caution against over-interpretation until results can be confirmed in an independent sample, preferably with a larger sample size.
Third, because anxiety and depressed mood were elevated in the ME/CFS group compared to controls, it is possible that metabolite or temperature differences between groups were related to these variables. In fact, we found moderate correlations between anxiety and depression and the metabolite ratios in some brain regions. We note, however, that average scores in the ME/CFS group were below the threshold indicating clinically significant depression or anxiety, meaning that influences from these variables on our results, if present, were likely very minimal. Our analyses also revealed that correlations between LAC/CR and anxiety were negative, which is the opposite of the expected direction.
Lastly, we note that while metabolite and temperature abnormalities in ME/CFS patients are consistent with the presence of neuroinflammation, there are other mechanisms, such as mitochondrial dysfunction or aberrant neuronal communication, that may be contributing to these changes. Because many conditions can been demonstrated to express abnormalities in MI, CHO, LAC, or CHO, they are not specific markers of neuroinflammation and cannot likely provide a unique diagnostic test for ME/CFS. Our confidence that metabolite abnormalities are related to neuroinflammation would be strengthened if there were several markers (for example, MI and CHO) elevated in overlapping regions.
5. Conclusions
This study is the first to investigate whole-brain MRS markers of neuroinflammation in ME/CFS. We report metabolite and temperature abnormalities in ME/CFS patients in widely distributed brain areas, suggesting ME/CFS is driven by diffuse pathophysiological processes affecting the whole brain, rather than regionally limited, which is consistent with the heterogeneity of its clinical symptoms. Our findings add support to the hypothesis that ME/CFS is the result of chronic, low-level neuroinflammation. While the whole-brain results are preliminary, we note that they largely agree with past publications that use MRS in ME/CFS. These results should be replicated in future studies with larger samples to further establish the profile of pathophysiological abnormalities in the brains of ME/CFS patients. Ultimately, the development of sensitive MRI markers of ME/CFS could supplement clinical tests to help guide treatment decisions.
Supplementary Material
Acknowledgments
Funding: This work was supported by the Solve ME/CFS Initiative [Ramsay Award program]; and the National Institutes of Health [grant number EB016064]. The sponsors had no involvement in the study design; in the collection, analysis or interpretation of data; in the writing of the report; or in the decision to submit the article for publication.
Footnotes
Conflict of Interest: The authors declare that they have no conflict of interest.
Ethical Approval: All procedures performed in studies involving human participants were in accordance with the ethical standards of the institutional and/or national research committee and with the 1964 Helsinki declaration and its later amendments or comparable ethical standards.
Informed consent: Informed consent was obtained from all individual participants included in the study.
Contributor Information
Christina Mueller, Department of Psychology, The University of Alabama at Birmingham, 1720 2nd Ave S, Birmingham, AL 35294, United States.
Joanne C. Lin, Department of Psychology, The University of Alabama at Birmingham, 1720 2nd Ave S, Birmingham, AL 35294, United States.
Sulaiman Sheriff, Department of Radiology, Miller School of Medicine, University of Miami, 1600 NW 10th Ave #1140, Miami, FL 33136, United States.
Andrew A. Maudsley, Department of Radiology, Miller School of Medicine, University of Miami, 1600 NW 10th Ave #1140, Miami, FL 33136, United States.
Jarred W. Younger, Department of Psychology, The University of Alabama at Birmingham, 1720 2nd Ave S, Birmingham, AL 35294, United States.
References
- Alam MM, Lee J, & Lee SY (2017). Recent Progress in the Development of TSPO PET Ligands for Neuroinflammation Imaging in Neurological Diseases. Nucl Med Mol Imaging, 51(4), 283–296. doi: 10.1007/s13139-017-0475-8. [DOI] [PMC free article] [PubMed] [Google Scholar]
- Anderson AM, Fennema-Notestine C, Umlauf A, Taylor MJ, Clifford DB, Marra CM, … the, C. G. (2015). CSF Biomarkers of Monocyte Activation and Chemotaxis correlate with Magnetic Resonance Spectroscopy Metabolites during Chronic HIV Disease. Journal of neurovirology, 21(5), 559–567. doi: 10.1007/s13365-015-0359-6. [DOI] [PMC free article] [PubMed] [Google Scholar]
- Andersson JLR, Jenkinson M, & Smith S (2010) Non-linear registration, aka spatial normalisation. FMRIB technical report TR07JA2
- Bernitsas E, Yarraguntla K, Bao F, Sood R, Santiago-Martinez C, Govindan R, … Seraji-Bozorgzad N (2017). Structural and Neuronal Integrity Measures of Fatigue Severity in Multiple Sclerosis. Brain Sci, 7(8). doi: 10.3390/brainsci7080102 [DOI] [PMC free article] [PubMed] [Google Scholar]
- Bitsch A, Bruhn H, Vougioukas V, Stringaris A, Lassmann H, Frahm J, & Bruck W (1999). Inflammatory CNS demyelination: histopathologic correlation with in vivo quantitative proton MR spectroscopy. AJNR Am J Neuroradiol, 20(9), 1619–1627. [PMC free article] [PubMed] [Google Scholar]
- Bjartmar C, Battistuta J, Terada N, Dupree E, & Trapp BD (2002). N-acetylaspartate is an axon-specific marker of mature white matter in vivo: a biochemical and immunohistochemical study on the rat optic nerve. Ann Neurol, 51(1), 51–58. [DOI] [PubMed] [Google Scholar]
- Boissoneault J, Sevel L, Robinson ME, & Staud R (2018). Functional brain connectivity of remembered fatigue or happiness in healthy adults: Use of arterial spin labeling. J Clin Exp Neuropsychol, 40(3), 224–233. doi: 10.1080/13803395.2017.1329407 [DOI] [PMC free article] [PubMed] [Google Scholar]
- Brooks JC, Roberts N, Whitehouse G, & Majeed T (2000). Proton magnetic resonance spectroscopy and morphometry of the hippocampus in chronic fatigue syndrome. Br J Radiol, 73(875), 1206–1208. doi: 10.1259/bjr.73.875.11144799 [DOI] [PubMed] [Google Scholar]
- Capuron L, Pagnoni G, Demetrashvili M, Woolwine BJ, Nemeroff CB, Berns GS, & Miller AH (2005). Anterior cingulate activation and error processing during interferon-alpha treatment. Biol Psychiatry, 58(3), 190–196. doi: 10.1016/j.biopsych.2005.03.033 [DOI] [PMC free article] [PubMed] [Google Scholar]
- Castro-Marrero J, Cordero MD, Saez-Francas N, Jimenez-Gutierrez C, Aguilar-Montilla FJ, Aliste L, & Alegre-Martin J (2013). Could mitochondrial dysfunction be a differentiating marker between chronic fatigue syndrome and fibromyalgia? Antioxid Redox Signal, 19(15), 1855–1860. doi: 10.1089/ars.2013.5346 [DOI] [PubMed] [Google Scholar]
- Chang L, Munsaka SM, Kraft-Terry S, & Ernst T (2013). Magnetic resonance spectroscopy to assess neuroinflammation and neuropathic pain. J Neuroimmune Pharmacol, 8(3), 576–593. doi: 10.1007/s11481-013-9460-x [DOI] [PMC free article] [PubMed] [Google Scholar]
- Chaudhuri A, Condon BR, Gow JW, Brennan D, & Hadley DM (2003). Proton magnetic resonance spectroscopy of basal ganglia in chronic fatigue syndrome. Neuroreport, 14(2), 225–228. doi: 10.1097/01.wnr.0000054960.21656.64 [DOI] [PubMed] [Google Scholar]
- Dienel GA (2012). Brain lactate metabolism: the discoveries and the controversies. J Cereb Blood Flow Metab, 32(7), 1107–1138. doi: 10.1038/jcbfm.2011.175 [DOI] [PMC free article] [PubMed] [Google Scholar]
- Dupont AC, Largeau B, Santiago Ribeiro MJ, Guilloteau D, Tronel C, & Arlicot N (2017). Translocator Protein-18 kDa (TSPO) Positron Emission Tomography (PET) Imaging and Its Clinical Impact in Neurodegenerative Diseases. Int J Mol Sci, 18(4). doi: 10.3390/ijms18040785 [DOI] [PMC free article] [PubMed] [Google Scholar]
- Ebel A, & Maudsley AA (2003). Improved spectral quality for 3D MR spectroscopic imaging using a high spatial resolution acquisition strategy. Magn Reson Imaging, 21(2), 113–120. [DOI] [PubMed] [Google Scholar]
- El Ghazi I, Sheng WS, Hu S, Reilly BG, Lokensgard JR, Rock RB, … Armitage IM (2010). Changes in the NMR metabolic profile of human microglial cells exposed to lipopolysaccharide or morphine. J Neuroimmune Pharmacol, 5(4), 574–581. doi: 10.1007/s11481-010-9197-8 [DOI] [PMC free article] [PubMed] [Google Scholar]
- Ferrero K, Silver M, Cocchetto A, Masliah E, & Langford D (2017). CNS findings in chronic fatigue syndrome and a neuropathological case report. J Investig Med, 65(6), 974–983. doi: 10.1136/jim-2016-000390 [DOI] [PubMed] [Google Scholar]
- Finkelmeyer A, He J, Maclachlan L, Watson S, Gallagher P, Newton JL, & Blamire AM (2018). Grey and white matter differences in Chronic Fatigue Syndrome - A voxel-based morphometry study. Neuroimage Clin, 17, 24–30. doi: 10.1016/j.nicl.2017.09.024 [DOI] [PMC free article] [PubMed] [Google Scholar]
- Fukuda K, Straus SE, Hickie I, Sharpe MC, Dobbins JG, & Komaroff A (1994). The chronic fatigue syndrome: a comprehensive approach to its definition and study. International Chronic Fatigue Syndrome Study Group. Ann Intern Med, 121(12), 953–959. [DOI] [PubMed] [Google Scholar]
- Glunde K, Jie C, & Bhujwalla ZM (2004). Molecular causes of the aberrant choline phospholipid metabolism in breast cancer. Cancer Res, 64(12), 4270–4276. doi: 10.1158/0008-5472.Can-03-3829 [DOI] [PubMed] [Google Scholar]
- Goni M, Basu N, Murray AD, & Waiter GD (2018). Neural Indicators of Fatigue in Chronic Diseases: A Systematic Review of MRI Studies. Diagnostics (Basel), 8(3). doi: 10.3390/diagnostics8030042 [DOI] [PMC free article] [PubMed] [Google Scholar]
- Grover VP, Pavese N, Koh SB, Wylezinska M, Saxby BK, Gerhard A, … Taylor-Robinson SD (2012). Cerebral microglial activation in patients with hepatitis C: in vivo evidence of neuroinflammation. J Viral Hepat, 19(2), e89–96. doi: 10.1111/j.1365-2893.2011.01510.x [DOI] [PubMed] [Google Scholar]
- Haroon E, Woolwine BJ, Chen X, Pace TW, Parekh S, Spivey JR, … Miller AH (2014). IFN-alpha-induced cortical and subcortical glutamate changes assessed by magnetic resonance spectroscopy. Neuropsychopharmacology, 39(7), 1777–1785. doi: 10.1038/npp.2014.25 [DOI] [PMC free article] [PubMed] [Google Scholar]
- Harrison NA, Brydon L, Walker C, Gray MA, Steptoe A, & Critchley HD (2009). Inflammation causes mood changes through alterations in subgenual cingulate activity and mesolimbic connectivity. Biol Psychiatry, 66(5), 407–414. doi: 10.1016/j.biopsych.2009.03.015 [DOI] [PMC free article] [PubMed] [Google Scholar]
- Hornig M, Gottschalk CG, Eddy ML, Che X, Ukaigwe JE, Peterson DL, & Lipkin WI (2017). Immune network analysis of cerebrospinal fluid in myalgic encephalomyelitis/chronic fatigue syndrome with atypical and classical presentations. Transl Psychiatry, 7(4), e1080. doi: 10.1038/tp.2017.44 [DOI] [PMC free article] [PubMed] [Google Scholar]
- Hou LJ, Song Z, Pan ZJ, Cheng JL, Yu Y, & Wang J (2016). Decreased Activation of Subcortical Brain Areas in the Motor Fatigue State: An fMRI Study. Front Psychol, 7, 1154. doi: 10.3389/fpsyg.2016.01154 [DOI] [PMC free article] [PubMed] [Google Scholar]
- Jansen JF, Backes WH, Nicolay K, & Kooi ME (2006). 1H MR spectroscopy of the brain: absolute quantification of metabolites. Radiology, 240(2), 318–332. doi: 10.1148/radiol.2402050314 [DOI] [PubMed] [Google Scholar]
- Jason LA, Evans M, Porter N, Brown M, Brown A, Hunnell J, … Friedberg F (2010). The development of a revised Canadian Myalgic Encephalomyelitis Chronic Fatigue Syndrome case definition American Journal of Biochemistry and Biotechnology, 6(2), 120–135. [Google Scholar]
- Karaszewski B, Carpenter TK, Thomas RG, Armitage PA, Lymer GK, Marshall I, … Wardlaw JM (2013). Relationships between brain and body temperature, clinical and imaging outcomes after ischemic stroke. J Cereb Blood Flow Metab, 33(7), 1083–1089. doi: 10.1038/jcbfm.2013.52. [DOI] [PMC free article] [PubMed] [Google Scholar]
- Kirov II, Liu S, Tal A, Wu WE, Davitz MS, Babb JS, … Gonen O (2017). Proton MR spectroscopy of lesion evolution in multiple sclerosis: Steady-state metabolism and its relationship to conventional imaging. Hum Brain Mapp, 38(8), 4047–4063. doi: 10.1002/hbm.23647. [DOI] [PMC free article] [PubMed] [Google Scholar]
- Kocevar G, Stamile C, Hannoun S, Roch JA, Durand-Dubief F, Vukusic S, … Sappey-Marinier D (2018). Weekly follow up of acute lesions in three early multiple sclerosis patients using MR spectroscopy and diffusion. J Neuroradiol, 45(2), 108–113. doi: 10.1016/j.neurad.2017.06.010. [DOI] [PubMed] [Google Scholar]
- Komaroff AL (2017). Inflammation correlates with symptoms in chronic fatigue syndrome. Proc Natl Acad Sci U S A, 114(34), 8914–8916. doi: 10.1073/pnas.1712475114 [DOI] [PMC free article] [PubMed] [Google Scholar]
- Krupp LB, LaRocca NG, Muir-Nash J, & Steinberg AD (1989). The fatigue severity scale. Application to patients with multiple sclerosis and systemic lupus erythematosus. Arch Neurol, 46(10), 1121–1123. [DOI] [PubMed] [Google Scholar]
- Lawson N, Hsieh CH, March D, & Wang X (2016). Elevated Energy Production in Chronic Fatigue Syndrome Patients. J Nat Sci, 2(10). [PMC free article] [PubMed] [Google Scholar]
- Lin JC, & Gant N (2013). The Biochemistry of Choline. In Stagg CJ & Rothman DL (Eds.), Magnetic Resonance Spectroscopy: Tools for Neuroscience Research and Emerging Clinical Applications (1st ed., pp. 104–110). Amsterdam: Elsevier. [Google Scholar]
- MacHale SM, Lawrie SM, Cavanagh JT, Glabus MF, Murray CL, Goodwin GM, & Ebmeier KP (2000). Cerebral perfusion in chronic fatigue syndrome and depression. Br J Psychiatry, 176, 550–556. [DOI] [PubMed] [Google Scholar]
- Mathew SJ, Mao X, Keegan KA, Levine SM, Smith EL, Heier LA, … Shungu DC (2009). Ventricular cerebrospinal fluid lactate is increased in chronic fatigue syndrome compared with generalized anxiety disorder: an in vivo 3.0 T (1)H MRS imaging study. NMR Biomed, 22(3), 251–258. doi: 10.1002/nbm.1315 [DOI] [PubMed] [Google Scholar]
- Maudsley AA, Domenig C, Govind V, Darkazanli A, Studholme C, Arheart K, & Bloomer C (2009). Mapping of brain metabolite distributions by volumetric proton MR spectroscopic imaging (MRSI). Magn Reson Med, 61(3), 548–559. doi: 10.1002/mrm.21875. [DOI] [PMC free article] [PubMed] [Google Scholar]
- Maudsley AA, Goryawala MZ, & Sheriff S (2017). Effects of tissue susceptibility on brain temperature mapping. Neuroimage, 146, 1093–1101. doi: 10.1016/j.neuroimage.2016.09.062. [DOI] [PMC free article] [PubMed] [Google Scholar]
- McCusker RH, & Kelley KW (2013). Immune-neural connections: how the immune system’s response to infectious agents influences behavior. J Exp Biol, 216(Pt 1), 84–98. doi: 10.1242/jeb.073411. [DOI] [PMC free article] [PubMed] [Google Scholar]
- Moshkin MP, Akulov AE, Petrovski DV, Saik OV, Petrovskiy ED, Savelov AA, & Koptyug IV (2014). Proton magnetic resonance spectroscopy of brain metabolic shifts induced by acute administration of 2-deoxy-d-glucose and lipopolysaccharides. NMR Biomed, 27(4), 399–405. doi: 10.1002/nbm.3074 [DOI] [PubMed] [Google Scholar]
- Murrough JW, Mao X, Collins KA, Kelly C, Andrade G, Nestadt P, … Shungu DC (2010). Increased ventricular lactate in chronic fatigue syndrome measured by 1H MRS imaging at 3.0 T. II: comparison with major depressive disorder. NMR Biomed, 23(6), 643–650. doi: 10.1002/nbm.1512 [DOI] [PubMed] [Google Scholar]
- Myhill S, Booth NE, & McLaren-Howard J (2013). Targeting mitochondrial dysfunction in the treatment of Myalgic Encephalomyelitis/Chronic Fatigue Syndrome (ME/CFS) - a clinical audit. Int J Clin Exp Med, 6(1), 1–15. [PMC free article] [PubMed] [Google Scholar]
- Nakatomi Y, Mizuno K, Ishii A, Wada Y, Tanaka M, Tazawa S, … Watanabe Y (2014). Neuroinflammation in Patients with Chronic Fatigue Syndrome/Myalgic Encephalomyelitis: An (1)(1)C-(R)-PK11195 PET Study. J Nucl Med, 55(6), 945–950. doi: 10.2967/jnumed.113.131045 [DOI] [PubMed] [Google Scholar]
- Natelson BH, Mao X, Stegner AJ, Lange G, Vu D, Blate M, … Shungu DC (2017). Multimodal and simultaneous assessments of brain and spinal fluid abnormalities in chronic fatigue syndrome and the effects of psychiatric comorbidity. J Neurol Sci, 375, 411–416. doi: 10.1016/j.jns.2017.02.046 [DOI] [PMC free article] [PubMed] [Google Scholar]
- Natelson BH, Vu D, Coplan JD, Mao X, Blate M, Kang G, … Shungu DC (2017). Elevations of Ventricular Lactate Levels Occur in Both Chronic Fatigue Syndrome and Fibromyalgia. Fatigue, 5(1), 15–20. doi: 10.1080/21641846.2017.1280114 [DOI] [PMC free article] [PubMed] [Google Scholar]
- Natelson BH, Weaver SA, Tseng CL, & Ottenweller JE (2005). Spinal fluid abnormalities in patients with chronic fatigue syndrome. Clin Diagn Lab Immunol, 12(1), 52–55. doi: 10.1128/cdli.12.1.52-55.2005 [DOI] [PMC free article] [PubMed] [Google Scholar]
- Omori M, Pearce J, Komoroski RA, Griffin WST, Mrak RE, Husain MM, & Karson CN (1997). In vitro 1H-magnetic resonance spectroscopy of postmortem brains with schizophrenia. Biological Psychiatry, 42(5), 359–366. doi: 10.1016/S0006-3223(96)00409-X [DOI] [PubMed] [Google Scholar]
- Orihuela R, McPherson CA, & Harry GJ (2016). Microglial M1/M2 polarization and metabolic states. Br J Pharmacol, 173(4), 649–665. doi: 10.1111/bph.13139 [DOI] [PMC free article] [PubMed] [Google Scholar]
- Peterson D, Brenu EW, Gottschalk G, Ramos S, Nguyen T, Staines D, & Marshall-Gradisnik S (2015). Cytokines in the cerebrospinal fluids of patients with chronic fatigue syndrome/myalgic encephalomyelitis. Mediators Inflamm, 2015, 929720. doi: 10.1155/2015/929720 [DOI] [PMC free article] [PubMed] [Google Scholar]
- Poon DC, Ho YS, Chiu K, Wong HL, & Chang RC (2015). Sickness: From the focus on cytokines, prostaglandins, and complement factors to the perspectives of neurons. Neurosci Biobehav Rev, 57, 30–45. doi: 10.1016/j.neubiorev.2015.07.015 [DOI] [PubMed] [Google Scholar]
- Puri BK, Counsell SJ, Zaman R, Main J, Collins AG, Hajnal JV, & Davey NJ (2002). Relative increase in choline in the occipital cortex in chronic fatigue syndrome. Acta Psychiatr Scand, 106(3), 224–226. [DOI] [PubMed] [Google Scholar]
- Reeves WC, Wagner D, Nisenbaum R, Jones JF, Gurbaxani B, Solomon L, … Heim C (2005). Chronic fatigue syndrome--a clinically empirical approach to its definition and study. BMC Med, 3, 19. doi: 10.1186/1741-7015-3-19 [DOI] [PMC free article] [PubMed] [Google Scholar]
- Rimbaut S, Van Gutte C, Van Brabander L, & Vanden Bossche L (2016). Chronic fatigue syndrome - an update. Acta Clin Belg, 1–8. doi: 10.1080/17843286.2016.1196862 [DOI] [PubMed] [Google Scholar]
- Rumana CS, Gopinath SP, Uzura M, Valadka AB, & Robertson CS (1998). Brain temperature exceeds systemic temperature in head-injured patients. Crit Care Med, 26(3), 562–567. [DOI] [PubMed] [Google Scholar]
- Shungu DC, Weiduschat N, Murrough JW, Mao X, Pillemer S, Dyke JP, … Mathew SJ (2012). Increased ventricular lactate in chronic fatigue syndrome. III. Relationships to cortical glutathione and clinical symptoms implicate oxidative stress in disorder pathophysiology. NMR Biomed, 25(9), 1073–1087. doi: 10.1002/nbm.2772 [DOI] [PMC free article] [PubMed] [Google Scholar]
- Stern AF (2014). The hospital anxiety and depression scale. Occup Med (Lond), 64(5), 393–394. doi: 10.1093/occmed/kqu024 [DOI] [PubMed] [Google Scholar]
- Tomoda A, Miike T, Yamada E, Honda H, Moroi T, Ogawa M, … Morishita S (2000). Chronic fatigue syndrome in childhood. Brain Dev, 22(1), 60–64. [DOI] [PubMed] [Google Scholar]
- Tzourio-Mazoyer N, Landeau B, Papathanassiou D, Crivello F, Etard O, Delcroix N, … Joliot M (2002). Automated anatomical labeling of activations in SPM using a macroscopic anatomical parcellation of the MNI MRI single-subject brain. Neuroimage, 15(1), 273–289. doi: 10.1006/nimg.2001.0978 [DOI] [PubMed] [Google Scholar]
- Wang Z, Aguirre GK, Rao H, Wang J, Fernandez-Seara MA, Childress AR, & Detre JA (2008). Empirical optimization of ASL data analysis using an ASL data processing toolbox: ASLtbx. Magn Reson Imaging, 26(2), 261–269. doi: 10.1016/j.mri.2007.07.003 [DOI] [PMC free article] [PubMed] [Google Scholar]
- Zhang Y, Brady M, & Smith S (2001). Segmentation of brain MR images through a hidden Markov random field model and the expectation-maximization algorithm. IEEE Trans Med Imaging, 20(1), 45–57. doi: 10.1109/42.906424 [DOI] [PubMed] [Google Scholar]
- Zeineh MM, Kang J, Atlas SW, Raman MM, Reiss AL, Norris JL, … Montoya JG (2015). Right arcuate fasciculus abnormality in chronic fatigue syndrome. Radiology, 274(2), 517–526. doi: 10.1148/radiol.14141079 [DOI] [PubMed] [Google Scholar]
- Zigmond AS, & Snaith RP (1983). The hospital anxiety and depression scale. Acta Psychiatr Scand, 67(6), 361–370. [DOI] [PubMed] [Google Scholar]
Associated Data
This section collects any data citations, data availability statements, or supplementary materials included in this article.