

Abstract
Motivation
Genome-wide identification of the transcriptomic responses of human cell lines to drug treatments is a challenging issue in medical and pharmaceutical research. However, drug-induced gene expression profiles are largely unknown and unobserved for all combinations of drugs and human cell lines, which is a serious obstacle in practical applications.
Results
Here, we developed a novel computational method to predict unknown parts of drug-induced gene expression profiles for various human cell lines and predict new drug therapeutic indications for a wide range of diseases. We proposed a tensor-train weighted optimization (TT-WOPT) algorithm to predict the potential values for unknown parts in tensor-structured gene expression data. Our results revealed that the proposed TT-WOPT algorithm can accurately reconstruct drug-induced gene expression data for a range of human cell lines in the Library of Integrated Network-based Cellular Signatures. The results also revealed that in comparison with the use of original gene expression profiles, the use of imputed gene expression profiles improved the accuracy of drug repositioning. We also performed a comprehensive prediction of drug indications for diseases with gene expression profiles, which suggested many potential drug indications that were not predicted by previous approaches.
Supplementary information
Supplementary data are available at Bioinformatics online.
1 Introduction
Identifying the mode-of-action of drugs is a major challenge in studies on the chemical systems biology of diseases. For their therapeutic activities, most drugs modulate the activity of human cell systems and are expected to enable recovery of these systems from an impaired state to a normal one. The complexity of human cell systems arises as a result of coordinated functions of genes and proteins, and drug-induced cellular states are characterized by certain gene expression patterns (Cancer Genome Atlas Research Network et al., 2013; Gligorijevic et al., 2016; Menche et al., 2015). Drugs often interact not only with primary targets but also with other proteins (off-targets), and drugs function in a cell-dependent manner. Thus, understanding the complex responses of human cell systems to drugs is vital in medical and pharmaceutical research. Genome-wide identification of the transcriptomic responses of human cell lines to drug treatments is a promising approach to deepen this understanding.
The Connectivity Map (CMap) is a pioneering database of chemically induced transcriptome data on human cell lines, and this database stores gene expression profiles of five cancer cell lines perturbed by 1309 compounds, including approved drugs. CMap is often used for drug repositioning to identify novel diseases to which existing drugs can be applied, which has been recognized as an efficient drug discovery strategy (Ashburn and Thor, 2004; Chong and Sullivan, 2007; Novac, 2013). A popular computational drug repositioning approach involves the use of drug-induced gene expression profiles in CMap (Lamb et al., 2006). Potential drug–disease associations are predicted based on the inverse correlation between the signatures of gene expression associated with drugs and those associated with diseases, assuming that drugs would abolish disease-specific gene expression patterns if the given drug is applicable for the treatment of the disease. Several algorithms and correlation measures have been developed for this inverse signature method (Cheng et al., 2013, 2014), and indeed, drugs that are effective for the treatment of inflammatory bowel disease, prostate cancer and colorectal cancer have been discovered using this method (Dudley et al., 2011; Kosaka et al., 2013; van Noort et al., 2014). However, these methods depend heavily on the coverage of drugs and human cell lines in CMap, which limits large-scale analyses.
To address the limitations of CMap, a novel gene expression profiling method, L1000, was developed in the Library of Integrated Network-based Cellular Signatures (LINCS) program (Subramanian et al., 2017). The L1000 database stores a large number of gene expression profiles representing the transcriptomic responses of 83 human cell lines to the administration of 21 175 compounds including approved drugs. Additionally, this database has opened the door to the large-scale analysis of drug-induced transcriptome data. Recently, several studies have focused on the use of the L1000 database, including those that used a normalization procedure for L1000 data (Liu et al., 2015), performed a correlation analysis between drug chemical structures and drug-induced gene expression profiles (Chen et al., 2015), and conducted a mode-of-action analysis of drugs (Iwata et al., 2017). The next challenge is to use drug-induced transcriptome data in the L1000 database in various medical applications, including drug repositioning for a range of diseases. However, the drug-induced gene expression profiles in the L1000 database are largely unknown because gene expression levels were not observed for all combinations of drugs and human cell lines, which is a serious obstacle in practical applications.
Several methods for imputing missing values have been proposed because gene expression profiling often generates missing values, normally due to various experimental problems. A weighted K-nearest neighbor method is considered to be the first proposed imputation method for gene expression data (Troyanskaya et al., 2001). A singular-value decomposition-based method (SVD impute) uses SVD to approximate the expression of all genes in the data matrix (Troyanskaya et al., 2001). The least squares method (LS impute) uses correlations between both genes and experiments (Bø et al., 2004). The local least squares method (LLS impute) and the iterated LLSs method are also based on the LS principle (Cai et al., 2006; Kim et al., 2005). The Bayesian principal-component analysis method simultaneously estimates a probabilistic model and latent variables within the framework of Bayesian inference (Oba et al., 2003). The Gaussian mixture clustering method (GMC impute) was developed based on GMC and model averaging (Ouyang et al., 2004). A support vector regression method was also proposed for imputing missing values into a much higher-dimensional space (Wang et al., 2006). Moreover, gene expression data were modeled as a low-rank matrix, and the matrix was completed using a non-linear convex optimization algorithm (Kapur et al., 2016). These previous methods are applicable to a gene expression data matrix (e.g. for genes and experiments); however, they cannot be applied to tensor-structured gene expression data (e.g. for genes, experiments, cells, time points and doses). There is a strong incentive to develop tensor-specific data completion methods.
Here, we developed a novel computational method to predict unknown parts of drug-induced gene expression profiles on various human cell lines and predict new drug therapeutic indications for a wide range of diseases. We proposed a tensor-train weighted optimization (TT-WOPT) algorithm to accurately predict the potential values for unknown parts in tensor-structured gene expression data. Our results revealed that the proposed TT-WOPT algorithm can accurately reconstruct drug-induced gene expression data for a range of human cell lines in the L1000 database. The results also revealed that in comparison with the use of original gene expression profiles, the use of imputed gene expression profiles improved the accuracy of drug repositioning in the framework of multitask learning. We also conducted a comprehensive drug indication prediction for all diseases for which gene expression profiles were available to identify potential drug candidates for such diseases.
2 Materials
2.1 Drug-induced transcriptome data
In the LINCS project, gene expression profiles have been obtained in the L1000 mRNA profiling assay (http://www.lincsproject.org). The gene expression profiles were obtained from the Gene Expression Omnibus database (GEO; Barrett et al., 2007): GSE70138 and GSE92742. This assay is based on 93 human cell lines and various cellular perturbations. The L1000 database provides 978 landmark genes, which are referred to as ‘L1000 genes’. Here, we used ‘level 5’ data, which comprise profiles generated by collapsing several replicates.
The gene expression levels were measured at 3, 6, 24, 48 and 144 h after compound treatment. Each gene expression profile (591 855 in total) was represented by its ‘sig_id’. In total, 312 596 compound treatment profiles (denoted as ‘trt_cp’) were used. For each compound, its corresponding InChIKey (https://iupac.org/who-we-are/divisions/division-details/inchi/) was also available from GEO. Here, we analyzed the gene expression profiles of 16 cell lines treated with 1483 drugs. Note that the drugs were a subset of all compounds. In this study, of the 1483 drugs, 261 were associated with at least one disease.
We constructed drug-induced gene expression profiles, which were referred to as ‘drug signatures’. Each drug signature was represented as a feature vector , where d is the number of genes. Each element in the drug signature was defined as the difference of the gene expression value measured after compound treatment to that measured in the corresponding controls (the background of the plate). Note that each drug signature is dependent on human cell lines, doses and time points.
2.2 Disease patient transcriptome data
The gene expression profiles of patients with various diseases were obtained from the CRowd Extracted Expression of Differential Signatures database (Wang et al., 2016). This database was constructed based on the results of a reanalysis of a large number of gene expression profiles from GEO. The gene expression profiles comprised the scores calculated using the characteristic direction method (Clark et al., 2014), which compares the gene expression measured in a disease tissue with that measured in a control tissue. The gene expression scores for the upregulated and downregulated genes are denoted as the ‘up_genes’ and ‘down_genes’ fields, respectively.
In total, 695 profiles annotated as ‘manual disease signatures’ were used here because these profiles were assigned disease ontology IDs (DOIDs; Kibbe et al., 2015). The DOIDs were converted to their corresponding KEGG DISEASE database (Kanehisa et al., 2010) IDs via medical subject headings terms or the Online Mendelian Inheritance in Man database (Hamosh et al., 2002). We extracted the profiles obtained from humans for 79 diseases and 14 804 genes. The gene expression profiles of the patients were referred to as patient-specific gene expression profiles. Forty-six diseases had at least one approved drug, and these 46 diseases are listed in alphabetical order as follows: acute myeloid leukemia, adrenoleukodystrophy, adult T-cell leukemia, allergic contact dermatitis, Alzheimer’s disease, amyotrophic lateral sclerosis, aplastic anemia, asthma, atopic dermatitis, breast cancer, cervical cancer, chronic granulomatous disease, chronic lymphocytic leukemia, chronic myeloid leukemia, colorectal cancer, Crohn’s disease, cystic fibrosis, dengue, dilated cardiomyopathy, endometrial cancer, familial combined hyperlipidemia, gastric cancer, hepatitis C, Huntington’s disease, hypercholesterolemia, idiopathic pulmonary fibrosis, immune thrombocytopenia, inflammatory bowel disease, LDL receptor disorder, malignant melanoma, multiple myeloma, nasopharyngeal cancer, ovarian cancer, pancreatic cancer, Parkinson’s disease, pituitary adenomas, primary open angle glaucoma, renal cell carcinoma, rheumatoid arthritis, sickle cell anemia, small cell lung cancer, systemic lupus erythematosus, testicular cancer, tuberculosis, Types I and II diabetes mellitus.
We averaged multiple patient-specific signatures for the same disease and constructed a disease signature for each of the 79 diseases. The gene expression signature of each disease was represented by the feature vector , where d is the number of genes. Disease signatures comprising all genes and those comprising the L1000 genes were constructed.
The disease signature comprising all genes was represented by a binary feature vector in which each element was assigned a value of 1 to represent the presence of a differentially expressed gene or a value of 0 to represent its absence. We constructed a disease similarity matrix by calculating the similarity scores using the Jaccard index (Tanimoto coefficient).
2.3 Drug therapeutic indication data
Drug therapeutic indications were represented as drug–disease associations, and the drug–disease association data were obtained from medical monographs (Papadakis et al., 2014) and the KEGG DISEASE database (Kanehisa et al., 2010). Here, 353 drug–disease associations involving 261 drugs and 46 diseases were used as gold standard data.
3 Methods
In this section, we present a TT-WOPT algorithm to predict the potential values for unknown parts in drug-induced gene expression data. Drug-induced gene expression data can be represented by a high-order tensor (a high-order generalization of vectors and matrices). Figure 1 shows an overview of our proposed approach when applying the TT-WOPT algorithm to a third-ordered drug-induced transcriptome dataset comprising drugs, genes and cell lines. For example, the drug-induced gene expression data consisting of 261 drugs, 978 genes and 16 cell lines can be represented by a 261 × 978 × 16 tensor, but most parts of the tensor are missing or unobserved. Thus, we aim to complete the tensor-structured gene expression data.
Fig. 1.
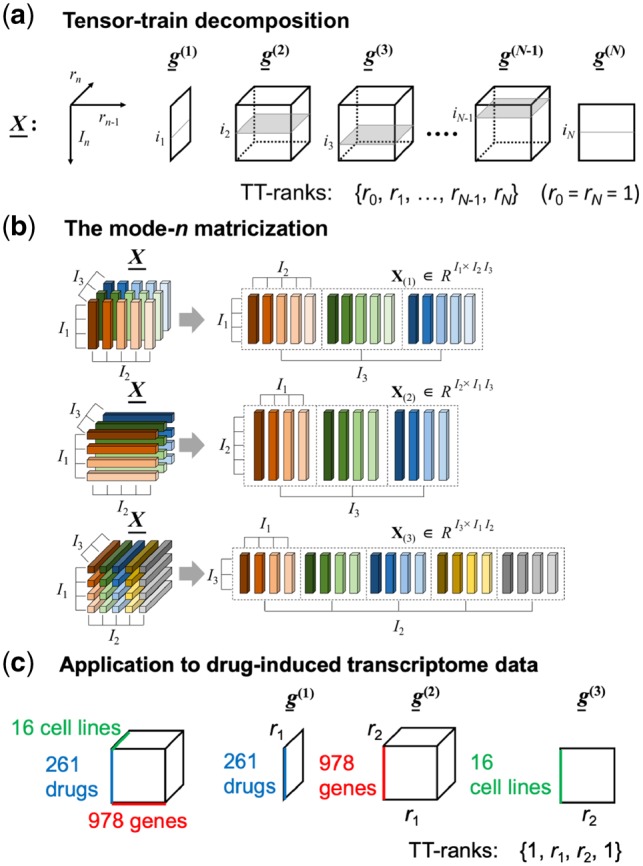
Overview of our proposed approach: (a) TT decomposition, (b) mode- n matricization (inspired from Cichocki et al., 2016) and (c) application of tensor decomposition to drug-induced transcriptome data comprising drugs, genes and cell lines
3.1 TT-WOPT algorithm for data completion
Most existing tensor decomposition methods, which are used to find latent factors, only target fully observed data. When data have missing entries, we cannot directly use existing tensor decomposition methods to predict missing entries. The WOPT method minimizes the distance between weighted real data and a weighted optimization objective. After performing optimization, the obtained tensor decomposition factors can reconstruct the observed real data well. Then, the decomposition factors can be converted to the original data structure to predict missing values.
Here, we apply a TT-WOPT algorithm to analyze a real-valued tensor, , with missing entries (Yuan et al., 2017). The index of the missing entries can be recorded by a weight tensor () and the size of which is the same as that of . Each entry of satisfies the following conditions:
TT decomposition decomposes a tensor into a sequence of core tensors, where all cores are third-order tensors. The TT decomposition of the tensor can be expressed as follows:
where is a sequence of third-order core tensors of size ,…, , respectively. The sequence is referred to as TT-ranks, which can limit the size of each core tensor. Each element of tensor can be written in the following index form:
where is the inth slice of the nth core tensor (Fig. 1a).
In the optimization algorithm, the objective variables are the elements of all core tensors. Here the objective function can be written as follows:
where and (* is the Hadamard product; Kolda and Bader, 2009).
The relation between the original tensor and core tensors can be derived as follows (Cichocki et al., 2016):
where for ,
where and ⊗ denotes the Kronecker product (Kolda and Bader, 2009). Here, the relation function uses a tensor matricization operation (Fig. 1b).
For , the partial derivatives of the objective function with respect to the nth core tensor can be expressed as follows:
After the objective function and the derivation of gradient are obtained, we can solve the optimization problem by any optimization algorithms based on the gradient descent method (Nocedal and Wright, 2006). The Supplementary Figure S1 illustrates the optimization procedure of the algorithm. In this study, the maximum iteration number was set to 300 as the criteria for stopping the optimization.
3.2 Relationship with other tensor decomposition algorithms
Note that most existing tensor decomposition methods (e.g. TT-SVD, TT-alternating least squares (ALS), CP-ALS) cannot perform data completion. Although CANDECOMP/PARAFAC WOPT (CP-WOPT) is applicable to data completion tasks, its prediction accuracies are insufficient for high-order tensor data with many missing entries (Acar et al., 2011). Instead, the TT-WOPT algorithm achieves high prediction accuracies for data with many missing entries.
The main difference between TT-WOPT and CP-WOPT is that they aim to find different decomposition models (i.e. TT decomposition and CP decomposition, respectively) for incomplete data. Though CP decomposition is a more compact model, it has problems to find optimal CP factors, especially on transcriptome data. In contrast, TT decomposition is a new decomposition model which is more flexible and owns better numerical properties like high compressibility and good performance even on high-order tensors. Details of the CP-WOPT algorithm are available in the Supplementary data.
3.3 Preparation of artificial missing values
For the performance evaluation of data completion, we randomly added artificial missing values to the original data based on two strategies. Figure 2 illustrates the strategies for generating artificial missing values. In the first strategy, the artificial missing values were generated anywhere in the tensors. This strategy is referred to as ‘random missing’. In the second strategy, which is more realistic in practical applications, all values in each cell axis were set as artificial missing values. This strategy is referred to as ‘cell-based missing’.
Fig. 2.
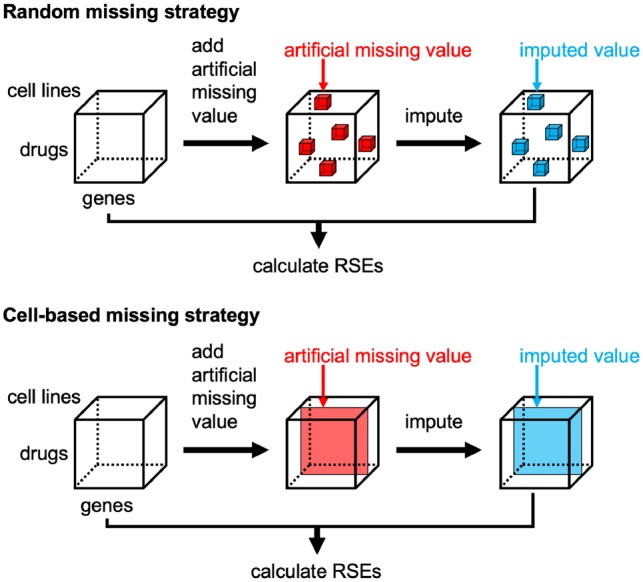
Strategies for generating artificial missing values
3.4 Multitask learning method for drug indication prediction
In this study, we presented a multitask learning method to predict drug therapeutic indications (applicable diseases of drugs) from drug-induced gene expression profiles and disease similarity. We formulated the drug indication prediction problem using a supervised multiple label prediction (Bickel et al., 2008). Assume that we have M diseases and P drugs.
We constructed a model to predict whether the ith drug would be used for treatment of the mth disease . Note that linear models can be used to analyze extremely high-dimensional data for both the prediction and feature extraction tasks. Thus, we adopted a linear function, , where is a d-dimensional weight vector for the mth disease and is a gene expression vector for the ith drug.
To overcome the scarcity of existing knowledge on the relationships between drugs and diseases, we learned individual predictive models jointly by sharing information across M diseases.
We attempted to simultaneously estimate all weight vectors in the models by minimizing the logistic loss with disease similarity. We estimated the weight vectors by minimizing the following objective function based on the learning set:
where is the logistic loss term, is a standard ridge regularization term to avoid the over-fitting problem, and is a regularization term reflecting the similarities among diseases, respectively. λr controls a standard ridge regularization term to avoid the overfitting problem, and λs controls the correlations between tasks (diseases in this study) to be considered. This process forces the weight vectors and to be close to each other if the similarity between disease l and disease m is high.
3.5 Previous methods for drug indication prediction
Some well-known methods for transcriptome-based drug repositioning has been established, such as the inverse signature method (Dudley et al., 2011; Jahchan et al., 2013; Kunkel et al., 2011; Sirota et al., 2011) and the eXtreme Sum (XSum) method (Cheng et al., 2014). The detailed procedures of those methods are explained below.
3.5.1 Inverse signature method
The inverse signature method is a popular transcriptome-based drug repositioning approach to find novel drugs for the treatment of diseases (Dudley et al., 2011; Jahchan et al., 2013; Kunkel et al., 2011; Sirota et al., 2011). Generally, drug signatures are assumed to have an inverse correlation with disease signatures if the drugs have therapeutic effects on those diseases (van Noort et al., 2014). To evaluate the transcriptional correlation between drugs and diseases, we calculated Pearson’s correlation coefficient.
3.5.2 The XSum method
The XSum method, which does not depend on the inverse correlation, was previously proposed (Cheng et al., 2014).
In the XSum method, multiple signatures from different cell lines were merged into a single signature by averaging, which resulted in a single signature for each drug. Here, we prepared a single signature for each cell line, which enabled us to evaluate the prediction performance in a cell-specific manner. For each drug–disease pair, the prediction values were calculated as follows:
where hi represents the genes in vector x, xi represents the gene expression values in vector x, is a set comprising common genes in the upregulated and downregulated genes in x and upregulated genes in z, is a set comprising common genes among the upregulated and downregulated genes in x and downregulated genes in z, and d is the number of features (i.e. genes). Researchers report that the XSum method exhibits the best performance in the prediction of drug–disease associations (Cheng et al., 2014).
4 Results
4.1 The proposed method works better than the baseline method
We tested the proposed TT-WOPT algorithm’s ability to impute missing values in drug-induced transcriptome data. For the performance evaluation of data completion, we randomly added artificial missing values to the original data, and evaluated whether the TT-WOPT and CP-WOPT algorithms could correctly recover these values. The missing values were generated based on two strategies: ‘random missing’ and ‘cell-based missing’.
As a standard imputation method, we used a nearest neighbor method (Troyanskaya et al., 2001). As a baseline method, we also tested the CP-WOPT algorithm (Acar et al., 2011), which is a previously established tensor decomposition method applicable to data completion tasks. To evaluate the tensor decomposition appropriately, we here applied tensor decomposition algorithms to the normalized drug-induced gene expression data. The tensor ranks of TT-WOPT and CP-WOPT were set within the range of 10–30 and optimized for each experiment. We evaluated the relative standard errors (RSEs) between the original data and the reconstructed data from the tensor decomposition. We calculated the RSEs for two types of cases, namely all values and missing values. For the former case, we calculated the RSEs between all values in the original data and those in the reconstructed data from the tensor decomposition, whereas for the latter case, we calculated the RSEs between the missing values in the original data and the imputed values in the reconstructed data. We repeated these experiments three times and calculated the average of the RSEs.
Table 1 shows the result for the performance evaluation of the data completion for a third-ordered gene expression dataset comprising 261 drugs, 978 genes and 16 cell lines, where the dataset contains artificial missing values generated based on the ‘random missing’ strategy. Here, the RSEs for only the artificially generated missing values are compared. In this evaluation, TT-WOPT worked better than CP-WOPT in most cases (P-value = 5.14 × 10⁻¹⁰, Wilcoxon signed-rank test). The Supplementary Table S1 provides a comparison of the RSEs for all values. In most cases, the performance of the proposed TT-WOPT algorithm was better than that of the baseline CP-WOPT algorithm. Overall, the RSEs of the TT-WOPT were significantly smaller than those of the CP-WOPT (P-value = 5.13 × 10⁻¹⁰). These results suggest that the proposed TT-WOPT algorithm can work well for data completion of drug-induced gene expression profiles.
Table 1.
Performance evaluation of data completion by tensor decomposition algorithms for third-order transcriptome data (drugs, genes and cell lines) with different rates of artificial missing values
| Artificial missing rate |
|||||||||
|---|---|---|---|---|---|---|---|---|---|
| 10% |
50% |
90% |
|||||||
| Standard imputation | CP (baseline) | TT (proposed) | Standard imputation | CP (baseline) | TT (proposed) | Standard imputation | CP (baseline) | TT (proposed) | |
| Total cell lines | 0.0750 | 0.0765 | 0.0694 | 0.0837 | 0.0798 | 0.0716 | NA | 0.0820 | 0.0776 |
| MCF7 | 0.0634 | 0.0616 | 0.0568 | 0.0735 | 0.0658 | 0.0574 | NA | 0.0681 | 0.0604 |
| PC3 | 0.0648 | 0.0650 | 0.0592 | 0.0742 | 0.0673 | 0.0614 | NA | 0.0699 | 0.0655 |
| A375 | 0.0832 | 0.0862 | 0.0764 | 0.0929 | 0.0906 | 0.0788 | NA | 0.0930 | 0.0881 |
| HA1E | 0.0744 | 0.0759 | 0.0681 | 0.0842 | 0.0796 | 0.0707 | NA | 0.0819 | 0.0764 |
| HT29 | 0.0773 | 0.0777 | 0.0703 | 0.0853 | 0.0810 | 0.0726 | NA | 0.0831 | 0.0797 |
| A549 | 0.0755 | 0.0785 | 0.0708 | 0.0833 | 0.0812 | 0.0718 | NA | 0.0822 | 0.0770 |
| VCAP | 0.0643 | 0.0710 | 0.0632 | 0.0703 | 0.0723 | 0.0662 | NA | 0.0740 | 0.0717 |
| YAPC | 0.0728 | 0.0738 | 0.0679 | 0.0840 | 0.0786 | 0.0718 | NA | 0.0810 | 0.0782 |
| HELA | 0.0701 | 0.0715 | 0.0666 | 0.0800 | 0.0749 | 0.0693 | NA | 0.0772 | 0.0739 |
| HCC515 | 0.0986 | 0.0994 | 0.0893 | 0.1068 | 0.1039 | 0.0926 | NA | 0.1049 | 0.1000 |
| HEPG2 | 0.0948 | 0.0954 | 0.0907 | 0.1012 | 0.0978 | 0.0914 | NA | 0.0990 | 0.0958 |
| HS578T | 0.0407 | 0.0420 | 0.0403 | 0.0431 | 0.0432 | 0.0412 | NA | 0.0445 | 0.0431 |
| MCF10A | 0.0480 | 0.0476 | 0.0455 | 0.0496 | 0.0482 | 0.0455 | NA | 0.0496 | 0.0476 |
| MDAMB231 | 0.0432 | 0.0440 | 0.0429 | 0.0475 | 0.0467 | 0.0434 | NA | 0.0490 | 0.0456 |
| SKBR3 | 0.0415 | 0.0440 | 0.0416 | 0.0426 | 0.0432 | 0.0417 | NA | 0.0450 | 0.0426 |
| BT20 | 0.0433 | 0.0441 | 0.0419 | 0.0443 | 0.0443 | 0.0426 | NA | 0.0468 | 0.0439 |
Note: Missing values were generated by the ‘random missing’ strategy. RSEs between the original and reconstructed data from tensor decomposition were calculated for missing values only. The proposed TT-WOPT method and the baseline CP-WOPT method are denoted as TT and CP, respectively. Artificially generated missing rates of 10, 50 and 90% were tested. Cell lines are listed in order of increasing original missing rates. Bold indicates the best result.
Table 2 shows the results of the performance evaluation of the data completion for the third-ordered gene expression dataset, where the dataset contains artificial missing values generated based on the ‘cell-based missing’ strategy. Table 2a provides a comparison of the RSEs for all values. The proposed TT-WOPT algorithm works much better than the baseline CP-WOPT algorithm (P-value = 3.05 × 10⁻⁵). The difference of artificial missing cells does not affect accuracy. Table 2b provides a comparison of the RSEs for only artificially generated missing values. In this evaluation, the baseline CP-WOPT algorithm worked to some extent for several cell lines. However, in most cases, the performance of the proposed TT-WOPT algorithm was better than that of the baseline CP-WOPT algorithm (P-value = 3.05 × 10⁻⁵). These results suggest that the proposed TT-WOPT algorithm could work well in practice.
Table 2.
Performance evaluation of data completion by tensor decomposition algorithms for third-order transcriptome data (drugs, genes and cell lines) with artificial missing values
| Artificial missing cell | (a) RSEs for all values |
(b) RSEs for missing values |
||
|---|---|---|---|---|
| CP (baseline) | TT (proposed) | CP (baseline) | TT (proposed) | |
| MCF7 | 0.1811 | 0.1523 | 0.6673 | 0.5498 |
| PC3 | 0.2170 | 0.1525 | 0.8199 | 0.5514 |
| A375 | 0.2216 | 0.1511 | 0.8122 | 0.5459 |
| HA1E | 0.2495 | 0.1539 | 0.9562 | 0.5583 |
| HT29 | 0.2577 | 0.1551 | 0.9910 | 0.5638 |
| A549 | 0.2401 | 0.1529 | 0.9157 | 0.5537 |
| VCAP | 0.2196 | 0.1531 | 0.8329 | 0.5549 |
| YAPC | 0.2604 | 0.1530 | 1.0015 | 0.5547 |
| HELA | 0.2695 | 0.1540 | 1.0390 | 0.5590 |
| HCC515 | 0.2109 | 0.1528 | 0.7910 | 0.5541 |
| HEPG2 | 0.1657 | 0.1564 | 0.5855 | 0.5696 |
| HS578T | 0.2281 | 0.1517 | 0.8655 | 0.5476 |
| MCF10A | 0.2157 | 0.1508 | 0.8139 | 0.5439 |
| MDAMB231 | 0.2134 | 0.1537 | 0.8029 | 0.5571 |
| SKBR3 | 0.2208 | 0.1546 | 0.8307 | 0.5609 |
| BT20 | 0.2238 | 0.1538 | 0.8500 | 0.5574 |
Note: Missing values were generated by the ‘cell-based missing’ strategy. RSEs between the original and reconstructed data from tensor decomposition were calculated for missing values only. The proposed TT-WOPT method and the baseline CP-WOPT method are denoted as TT and CP, respectively. Cell lines are listed in order of increasing original missing rates. Bold indicates the best result.
4.2 The proposed method works well even for higher-order tensors
Note that the tensor decomposition methods are applicable to higher-order tensors. Here, we attempted to reconstruct drug-induced gene expression profiles over time and evaluated the performance of the methods for a fourth-order gene expression dataset comprising 261 drugs, 978 genes, 16 cell lines and 4 time points (i.e. 3, 6, 24 and 48 h), where the dataset contains artificial missing values generated based on the ‘random missing’ strategy. Table 3 shows the results for the performance evaluation of the data completion for the fourth-order data, where the RSEs for missing values are compared. The Supplementary Table S2 provides a comparison of the RSEs for all values. The proposed TT-WOPT algorithm worked better than the baseline CP-WOPT algorithm in terms of small RSEs for all values (P-value = 4.78 × 10⁻¹⁰) and for missing values (P-value = 5.05 × 10⁻¹⁰). Table 4 shows the results for the performance evaluation of the data completion for the fourth-ordered gene expression dataset, where the dataset contains artificial missing values generated based on the ‘cell-based missing’ strategy. Table 4a and 4b show the RSEs for all values and those for missing values, respectively. The proposed TT-WOPT algorithm worked better than the baseline CP-WOPT algorithm in terms of having small RSEs for all values (P-value = 3.05 × 10⁻⁵) and for missing values (P-value = 3.05 × 10⁻⁵). The tendency for the fourth-order tensor was much clearer, compared with the previous evaluation for the third-order tensor. These results suggest that the proposed algorithm can perform well even for higher-order tensors.
Table 3.
Performance evaluation of data completion by tensor decomposition algorithms for fourth-order transcriptome data (drugs, genes, cell lines and time points) with different rates of artificial missing values
| Artificial missing rate |
|||||||||
|---|---|---|---|---|---|---|---|---|---|
| 10% |
50% |
90% |
|||||||
| Standard imputation | CP (baseline) | TT (proposed) | Standard imputation | CP (baseline) | TT (proposed) | Standard imputation | CP (baseline) | TT (proposed) | |
| Total cell lines | 0.00271 | 0.0031 | 0.00266 | 0.0028 | 0.0030 | 0.0027 | NA | 0.0036 | 0.0028 |
| MCF7 | 0.00195 | 0.0031 | 0.00189 | 0.00242 | 0.0028 | 0.00236 | NA | 0.0037 | 0.0026 |
| PC3 | 0.0024 | 0.0027 | 0.0022 | 0.0026 | 0.0029 | 0.0024 | NA | 0.0036 | 0.0026 |
| A375 | 0.00288 | 0.0032 | 0.00286 | 0.0028 | 0.0030 | 0.0026 | NA | 0.0035 | 0.0025 |
| HA1E | 0.0033 | 0.0032 | 0.0029 | 0.0029 | 0.0032 | 0.0028 | NA | 0.0037 | 0.0029 |
| HT29 | 0.0022 | 0.0022 | 0.0018 | 0.00195 | 0.0023 | 0.00192 | NA | 0.0030 | 0.0020 |
| A549 | 0.0027 | 0.0027 | 0.0024 | 0.0033 | 0.0035 | 0.0032 | NA | 0.0039 | 0.0033 |
| VCAP | 0.0028 | 0.0036 | 0.0027 | 0.0031 | 0.0033 | 0.0030 | NA | 0.0037 | 0.0030 |
| YAPC | 0.0036 | 0.0037 | 0.0034 | 0.0037 | 0.0037 | 0.0032 | NA | 0.0041 | 0.0036 |
| HELA | 0.0043 | 0.0035 | 0.0032 | 0.0040 | 0.0040 | 0.0037 | NA | 0.0042 | 0.0038 |
| HCC515 | 0.0023 | 0.0023 | 0.0015 | 0.0021 | 0.0023 | 0.0020 | NA | 0.0031 | 0.0021 |
| HEPG2 | 0.0011 | 0.0017 | 0.0010 | 0.00142 | 0.0017 | 0.00138 | NA | 0.0030 | 0.0016 |
| HS578T | 0.0019 | 0.0018 | 0.0007 | 0.0011 | 0.0020 | 0.0010 | NA | 0.0031 | 0.0014 |
| MCF10A | 0.0016 | 0.0016 | 0.0004 | 0.0009 | 0.0017 | 0.0008 | NA | 0.0032 | 0.0011 |
| MDAMB231 | 0.0006 | 0.0017 | 0.0005 | 0.0008 | 0.0020 | 0.0007 | NA | 0.0028 | 0.0008 |
| SKBR3 | 0.00035 | 0.0017 | 0.00036 | 0.0012 | 0.0022 | 0.0011 | NA | 0.0029 | 0.0011 |
| BT20 | 0.0007 | 0.0018 | 0.0008 | 0.0009 | 0.0020 | 0.0007 | NA | 0.0030 | 0.0011 |
Note: Missing values were generated by the ‘random missing’ strategy. RSEs between the original and reconstructed data from tensor decomposition were calculated for missing values only. The proposed TT-WOPT method and the baseline CP-WOPT method are denoted as TT and CP, respectively. Artificially generated missing rates of 10, 50 and 90% were tested. Cell lines are listed in order of increasing original missing rates. Bold indicates the best result.
Table 4.
Performance evaluation of data completion by tensor decomposition algorithms for fourth-order transcriptome data (drugs, genes, cell lines and time points) with artificial missing values
| Artificial missing cell | (a) RSEs for all values |
(b) RSEs for missing values |
||
|---|---|---|---|---|
| CP (baseline) | TT (proposed) | CP (baseline) | TT (proposed) | |
| MCF7 | 0.2693 | 0.0071 | 1.0749 | 0.0266 |
| PC3 | 0.2215 | 0.0064 | 0.8859 | 0.0236 |
| A375 | 0.1811 | 0.0122 | 0.7245 | 0.0481 |
| HA1E | 0.2568 | 0.0052 | 1.0273 | 0.0173 |
| HT29 | 0.2950 | 0.0056 | 1.1522 | 0.0198 |
| A549 | 0.2222 | 0.0111 | 0.8887 | 0.0436 |
| VCAP | 0.1543 | 0.0115 | 0.6172 | 0.0452 |
| YAPC | 0.1838 | 0.0055 | 0.7352 | 0.0198 |
| HELA | 0.2073 | 0.0098 | 0.8291 | 0.0380 |
| HCC515 | 0.3141 | 0.0048 | 1.0315 | 0.0171 |
| HEPG2 | 0.2077 | 0.0051 | 0.8308 | 0.0175 |
| HS578T | 0.1887 | 0.0101 | 0.7548 | 0.0395 |
| MCF10A | 0.1678 | 0.0108 | 0.6713 | 0.0421 |
| MDAMB231 | 0.2241 | 0.0053 | 0.8964 | 0.0191 |
| SKBR3 | 0.2164 | 0.0108 | 0.8654 | 0.0423 |
| BT20 | 0.2711 | 0.0052 | 1.0127 | 0.0178 |
Note: Missing values were generated by the ‘cell-based missing’ strategy. RSEs between the original and reconstructed data from tensor decomposition were calculated for (a) all values and (b) missing values only. The proposed TT-WOPT method and the baseline CP-WOPT method are denoted as TT and CP, respectively. Cell lines are listed in order of increasing original missing rates. Bold indicates the best result.
4.3 Tensor decomposition contributes to more accurate prediction of drug indications
We tested the tensor decomposition’s ability to improve the prediction of drug therapeutic indications from drug-induced gene expression signatures and disease-specific gene expression signatures. For the third-order transcriptome data, the tensor ranks {1, 30, 30, 1} was the best for TT-WOPT. Therefore, the best value of the tensor ranks was used here. As predictive methods for the drug indication prediction, we tested three methods, namely the inverse signature method, the XSum method and the multitask learning method. The inverse signature and XSum methods are previously developed methods based on the correlation between drug-induced gene expression signatures and disease-specific gene expression signatures (Cheng et al., 2013, 2014; Dudley et al., 2011; Kosaka et al., 2013; Lamb et al., 2006; van Noort et al., 2014), and the multitask learning method is our proposed method (this article). These methods were designed to predict appropriate drugs that could be applicable to each disease.
We evaluated the performance of drug indication predictions by performing 5-fold cross-validation experiments. We used the receiver operating characteristic (ROC) curve, which is a plot of true positive rates as a function of false positive rates (FPRs). We evaluated the area under the ROC curve (AUC) score for the FPR as 1.0, where 1 is perfect inference and 0.5 is random inference. We calculated the AUC scores for drug–disease pairs and individual diseases. In the evaluation of drug–disease pairs, we calculated the AUC scores for all drug–disease pairs simultaneously. In the evaluation of individual diseases, we calculated the AUC score for each disease and calculated the average AUC score over diseases.
Figure 3 shows the resulting AUC scores for different methods with and without tensor decomposition, where these scores were evaluated for drug–disease pairs and individual diseases. As shown in this figure, tensor decomposition improved the prediction performance, particularly for the multitask learning method. The prediction performances of the inverse signature and XSum methods were nearly the same in all cases. In addition, in all cases, multitask learning outperformed these other two methods, which suggests that supervised learning could be meaningful. These results also suggest that the multitask learning method with tensor decomposition worked the best at predicting therapeutic indications for drugs.
Fig. 3.

Performance comparison on the drug indication prediction among the inverse signature, XSum and multitask learning methods with and without tensor decomposition. Each box-plot represents AUC scores for all cell lines. The horizontal gray line corresponds to random inference
Figure 4 shows a comparison of the AUC scores for each cell line and the associated missing rate in the gene expression profiles for each cell line. For nearly all cell lines, the use of imputed gene expression profiles with tensor decomposition worked better than the use of original gene expression profiles. In cell lines with high missing rates in particular, the usefulness of the tensor decomposition was clear. Note that drug-induced gene expression profiles were largely unobserved (96.6% unobserved) for several cell lines such as HS578T, MCF10A, MDAMB231, SKBR3 and BT20, which means that the cell lines were treated by few drugs. These results suggest that tensor decomposition has the potential to improve the performance of a variety of drug repositioning methods.
Fig. 4.

Performance comparison on drug indication prediction among the inverse signature, XSum and multitask learning methods with and without tensor decomposition. The top panel shows the AUC score calculated using all prediction scores for all drug–disease pairs. The middle panel shows the average of AUC scores calculated using all prediction scores for individual diseases. The bottom panel shows the missing rate in each cell line. Cell lines are listed in increasing order of missing rates
Finally, we performed a comprehensive prediction of unknown therapeutic indications of 1483 drugs. For these drugs, the gene expression data are available in the LINCS database. We used all known drug–disease associations as a learning dataset and predicted new drug therapeutic indications. Because of space limitation, the detailed results are found in the Supplementary data (the Supplementary data are available at http://labo.bio.kyutech.ac.jp/~yamani/ismb2019/).
5 Discussion
In this article, we have proposed a novel tensor decomposition technique, named TT-WOPT, to predict unknown parts of drug-induced gene expression profiles for a variety of human cell lines. The proposed TT-WOPT algorithm allowed us to accurately impute the missing entries in drug-induced transcriptome data. This could potentially significantly improve the performance of drug repositioning for a wide range of diseases. The idea that the proposed TT-WOPT algorithm is applicable to higher-order tensors should be noted. The gene expression levels were measured at several time points after drug treatment with different drug concentrations. Representing the drug-induced transcriptome data by a higher-order tensor structure by employing additional axes, such as a time axis and a concentration axis, would be possible. The investigation of this idea could further enhance the performance in drug repositioning.
The analysis of drug-induced gene expression profiles is a powerful approach to understanding the mode-of-action of drugs and to discover new purposes for existing drugs. However, drug-induced gene expression profiles are not always measured for all combinations of drugs, cell lines, and time points, which has been a serious obstacle in practice. In fact, the recently established LINCS database stores numerous gene expression profiles across various cell lines, but the numbers of cell lines and drugs for which gene expression profiles are measured are considerably limited. The completion of drug-induced gene expression profiles would facilitate drug repositioning in cell-specific and time-dependent manners.
We demonstrated the usefulness of the tensor decomposition method in an analysis of drug-induced transcriptome data; however, this method is applicable to any transcriptome data with missing values. Recent transcriptome data tend to be represented by a tensor structure rather than a matrix data structure. For example, the disease transcriptome data could be represented by a tensor, where the first, second, third and fourth axes of the tensor correspond to diseases, genes, organs and time points, respectively. The findings of this study provide some clues for the best use of existing transcriptome data with unobserved parts and missing values. The proposed TT-WOPT algorithm works better than existing tensor decomposition methods such as CP-WOPT (Acar et al., 2011) in terms of accuracy, particularly for higher-order tensor data with large missing rates. The performance of the TT-WOPT algorithm depends on some hyper-parameters (e.g. TT-ranks). Therefore, the development of a well-established approach for finding optimal parameters would improve the performance of data completion.
Funding
This work was supported by JST PRESTO [grant number JPMJPR15D8] and JST AIP-PRISM [grant number JPMJCR18Y5], Japan. F.B. is an international fellow of the Japan Society for the Promotion of Science.
Conflict of Interest: none declared.
Supplementary Material
References
- Acar E. et al. (2011) Scalable tensor factorizations for incomplete data. Chemometr. Intell. Lab. Syst., 106, 41–56. [Google Scholar]
- Ashburn T.T., Thor K.B. (2004) Drug repositioning: identifying and developing new uses for existing drugs. Nat. Rev. Drug Discov., 3, 673–683. [DOI] [PubMed] [Google Scholar]
- Barrett T. et al. (2007) NCBI GEO: mining tens of millions of expression profiles–databases and tools update. Nucleic Acids Res., 35, D760–D765. [DOI] [PMC free article] [PubMed] [Google Scholar]
- Bickel S. et al. (2008) Multi-task learning for HIV therapy screening. In: McCallum,A. and Roweis,S. (eds.), Proceedings of the 25th International Conference on Machine Learning. ACM, New York, NY, pp. 56–63.
- Bø T.H. et al. (2004) LSimpute: accurate estimation of missing values in microarray data with least squares methods. Nucleic Acids Res., 32, e34. [DOI] [PMC free article] [PubMed] [Google Scholar]
- Cai Z. et al. (2006) Iterated local least squares microarray missing value imputation. J. Bioinform. Comput. Biol., 4, 935–957. [DOI] [PubMed] [Google Scholar]
- Cancer Genome Atlas Research Network. et al. (2013) The Cancer Genome Atlas Pan-Cancer analysis project. Nat. Genet., 45, 1113–1120. [DOI] [PMC free article] [PubMed] [Google Scholar]
- Chen B. et al. (2015) Relating chemical structure to cellular response: an integrative analysis of gene expression, bioactivity, and structural data across 11,000 compounds. CPT Pharmacometrics Syst. Pharmacol., 4, 576–584. [DOI] [PMC free article] [PubMed] [Google Scholar]
- Cheng J. et al. (2013) Evaluation of analytical methods for connectivity map data. In: Altman,R.B. et al. (eds.), Proceedings of the Pacific Symposium on Biocomputing 2013, World Scientific, Singapore, pp. 5–16. [PubMed]
- Cheng J. et al. (2014) Systematic evaluation of connectivity map for disease indications. Genome Med., 6, 540. [DOI] [PMC free article] [PubMed] [Google Scholar]
- Chong C.R., Sullivan D.J. (2007) New uses for old drugs. Nature, 448, 645–646. [DOI] [PubMed] [Google Scholar]
- Cichocki A. et al. (2016) Tensor networks for dimensionality reduction and large-scale optimization: part 1 low-rank tensor decompositions. Found. Trends Mach. Learn., 9, 249–429. [Google Scholar]
- Clark N.R. et al. (2014) The characteristic direction: a geometrical approach to identify differentially expressed genes. BMC Bioinformatics, 15, 79.. [DOI] [PMC free article] [PubMed] [Google Scholar]
- Dudley J.T. et al. (2011) Computational repositioning of the anticonvulsant topiramate for inflammatory bowel disease. Sci. Transl. Med., 3, 96ra76.. [DOI] [PMC free article] [PubMed] [Google Scholar]
- Gligorijevic D. et al. (2016) Large-scale discovery of disease–disease and disease–gene associations. Sci. Rep., 6, 32404.. [DOI] [PMC free article] [PubMed] [Google Scholar]
- Hamosh A. et al. (2002) Online Mendelian Inheritance in Man (OMIM), a knowledgebase of human genes and genetic disorders. Nucleic Acids Res., 30, 52–55. [DOI] [PMC free article] [PubMed] [Google Scholar]
- Iwata M. et al. (2017) Elucidating the modes of action for bioactive compounds in a cell-specific manner by large-scale chemically-induced transcriptomics. Sci. Rep., 7, 40164. [DOI] [PMC free article] [PubMed] [Google Scholar]
- Jahchan N.S. et al. (2013) A drug repositioning approach identifies tricyclic antidepressants as inhibitors of small cell lung cancer and other neuroendocrine tumors. Cancer Discov., 3, 1364–1377. [DOI] [PMC free article] [PubMed] [Google Scholar]
- Kanehisa M. et al. (2010) KEGG for representation and analysis of molecular networks involving diseases and drugs. Nucleic Acids Res., 38, D355–D360. [DOI] [PMC free article] [PubMed] [Google Scholar]
- Kapur A. et al. (2016) Gene expression prediction using low-rank matrix completion. BMC Bioinformatics, 17, 243.. [DOI] [PMC free article] [PubMed] [Google Scholar]
- Kibbe W.A. et al. (2015) Disease Ontology 2015 update: an expanded and updated database of human diseases for linking biomedical knowledge through disease data. Nucleic Acids Res., 43, D1071–D1078. [DOI] [PMC free article] [PubMed] [Google Scholar]
- Kim H. et al. (2005) Missing value estimation for DNA microarray gene expression data: local least squares imputation. Bioinformatics, 21, 187–198. [DOI] [PubMed] [Google Scholar]
- Kolda T.G., Bader B.W. (2009) Tensor decomposition and applications. SIAM Rev., 51, 455–500. [Google Scholar]
- Kosaka T. et al. (2013) Identification of drug candidate against prostate cancer from the aspect of somatic cell reprogramming. Cancer Sci., 104, 1017–1026. [DOI] [PMC free article] [PubMed] [Google Scholar]
- Kunkel S.D. et al. (2011) mRNA expression signatures of human skeletal muscle atrophy identify a natural compound that increases muscle mass. Cell Metab., 13, 627–638. [DOI] [PMC free article] [PubMed] [Google Scholar]
- Lamb J. et al. (2006) The Connectivity Map: using gene-expression signatures to connect small molecules, genes, and disease. Science, 313, 1929–1935. [DOI] [PubMed] [Google Scholar]
- Liu C. et al. (2015) Compound signature detection on LINCS L1000 big data. Mol. Biosyst., 11, 714–722. [DOI] [PMC free article] [PubMed] [Google Scholar]
- Menche J. et al. (2015) Uncovering disease–disease relationships through the incomplete interactome. Science, 347, 1257601.. [DOI] [PMC free article] [PubMed] [Google Scholar]
- Nocedal J., Wright S. (2006) Numerical Optimization. Springer-Verlag, New York, NY. [Google Scholar]
- Novac N. (2013) Challenges and opportunities of drug repositioning. Trends Pharmacol. Sci., 34, 267–272. [DOI] [PubMed] [Google Scholar]
- Oba S. et al. (2003) A Bayesian missing value estimation method for gene expression profile data. Bioinformatics, 19, 2088–2096. [DOI] [PubMed] [Google Scholar]
- Ouyang M. et al. (2004) Gaussian mixture clustering and imputation of microarray data. Bioinformatics, 20, 917–923. [DOI] [PubMed] [Google Scholar]
- Papadakis M.A. et al. (2014) Current Medical Diagnosis and Treatment 2014. McGraw Hill Medical, New York, NY. [Google Scholar]
- Sirota M. et al. (2011) Discovery and preclinical validation of drug indications using compendia of public gene expression data. Sci. Transl. Med., 3, 96ra77.. [DOI] [PMC free article] [PubMed] [Google Scholar]
- Subramanian A. et al. (2017) A next generation Connectivity Map: L1000 platform and the first 1,000,000 profiles. Cell, 171, 1437–1452. [DOI] [PMC free article] [PubMed] [Google Scholar]
- Troyanskaya O. et al. (2001) Missing value estimation methods for DNA microarrays. Bioinformatics, 17, 520–525. [DOI] [PubMed] [Google Scholar]
- van Noort V. et al. (2014) Novel drug candidates for the treatment of metastatic colorectal cancer through global inverse gene-expression profiling. Cancer Res., 74, 5690–5699. [DOI] [PubMed] [Google Scholar]
- Wang X. et al. (2006) Missing value estimation for DNA microarray gene expression data by Support Vector Regression imputation and orthogonal coding scheme. BMC Bioinformatics, 7, 455–500. [DOI] [PMC free article] [PubMed] [Google Scholar]
- Wang Z. et al. (2016) Extraction and analysis of signatures from the gene expression omnibus by the crowd. Nat. Commun., 7, 12846.. [DOI] [PMC free article] [PubMed] [Google Scholar]
- Yuan L. et al. (2017) Completion of high order tensor data with missing entries via tensor-train decomposition. In: Liu,D. et al. (eds.), Neural Information Processing. ICONIP 2017. Lecture Notes in Computer Science, Vol. 10634. Springer, Cham, Switzerland, pp. 222–229.
Associated Data
This section collects any data citations, data availability statements, or supplementary materials included in this article.