

OBJECTIVES:
Duodenal cancer in familial adenomatous polyposis (FAP) arises from adenomas. Differentially expressed genes (DEGs) in the duodenal adenoma-carcinoma pathway have been identified in murine FAP models, but similar data in patients with FAP are limited. Identifying such changes may have significance in understanding duodenal polyposis therapies and identifying cancer biomarkers. We performed a genome-wide transcriptional analysis to describe the duodenal adenoma-carcinoma sequence and determine changes distinguishing patients with FAP with and without duodenal cancer.
METHODS:
Transcriptional profiling was performed with the Affymetrix Human Transcriptome Array 2.0 on duodenal biopsies from 12 FAP patients with duodenal cancer (FAP cases) and 12 FAP patients without cancer (FAP controls). DEGs were compared between cancer-normal, adenoma-normal, and cancer-adenoma in FAP cases and between adenomas from FAP cases and FAP controls. Significant results at P < 0.05 were filtered using fold change > 2.
RESULTS:
Two hundred twenty-four DEGs were identified at an absolute fold change > 2. In adenoma-normal, downregulation of DEGs involved in metabolism of brush border proteins (LCT), lipids (APOB/A4), reactive oxygen species (GSTA2), and retinol (RBP2) was observed. In the cancer-adenoma comparison, upregulation of DEGs involved in cell invasion/migration (POSTN, SPP1) and downregulation of DEGs involved in Paneth differentiation (DEFA5/6) were observed. In the adenoma-adenoma comparison, downregulation of several DEGs (CLCA1, ADH1C, ANXA10) in FAP case adenomas was observed. DEGs with therapeutic potential include SPP1, which is involved in both cyclooxygenase and epidermal growth factor receptor pathways targeted by the sulindac/erlotinib combination for duodenal polyposis.
DISCUSSION:
We describe DEGs in the human duodenal adenoma-carcinoma sequence in FAP, which may have prognostic and therapeutic significance. Validation studies are needed to confirm these findings.
INTRODUCTION
Familial adenomatous polyposis (FAP) is an autosomal dominant condition caused by loss-of-function in the adenomatous polyposis coli (APC) gene. The APC gene product inhibits Wnt/β-catenin signaling (1). In FAP, loss of function of APC results in promotion of β-catenin's tumorigenic effects and development of hundreds to thousands of intestinal adenomas. Resulting colorectal carcinoma (CRC) is nearly inevitable without early surgical intervention (2).
Duodenal cancer arises from duodenal adenomas and is a leading cause of death in FAP (3). Although the lifetime risk of duodenal polyposis in FAP approaches 100%, the cumulative incidence of cancer is 4.5% by the age of 57 (4). Chemoprevention with the cyclooxygenase 2 (COX-2) inhibitor celecoxib (5) and with a combination of the nonselective COX inhibitor sulindac and the epidermal growth factor receptor (EGFR) inhibitor erlotinib (6) have shown promise in decreasing polyp burden although long-term effect on cancer risk is unknown. Prophylactic duodenectomy is most effective at preventing cancer (7,8) but is associated with significant morbidity and mortality.
The Spigelman stage (SS) of duodenal polyposis (I-IV) is the only known tool to determine duodenal cancer risk and is used to guide endoscopic surveillance and need for prophylactic duodenectomy in FAP (4,9–11). Despite the prognostic value of SS, up to 40% of FAP patients with duodenal cancer do not have advanced SS polyposis and develop cancer while under surveillance (4,9,10). Therefore, it is clear that additional predictive factors must be identified.
Molecular characteristics of duodenal adenomas may aid in determining duodenal cancer risk. This is supported by gene expression studies on APCMin/+ mice, which, like patients with FAP, have a germline APC mutation but predominantly develop small intestinal polyposis (12). In these mice, normal intestine, adenoma, and carcinoma are distinguished by differentially expressed genes (DEGs) (13,14), suggesting that transcriptional changes herald malignant change of duodenal polyps in FAP. A recent study investigated gene expression changes between normal and adenomatous duodenal tissue in patients with FAP and found abnormalities in the Wnt/β-catenin, EGFR, and prostaglandin E2 (PGE2) pathways (15). However, no genome-wide investigation investigating the adenoma-carcinoma sequence in patients with FAP has been published. As a result, predictive and therapeutic targets to prevent duodenal cancer are largely unknown.
In this study, we first characterized the duodenal adenoma-carcinoma sequence in FAP by performing gene expression profiling on normal duodenum, adenoma, and cancer tissue from FAP patients with duodenal cancer (FAP cases). Next, we determined DEGs differentiating patients with duodenal cancer by comparing transcriptional profiles of adenomas from FAP cases with adenomas from FAP patients without cancer (FAP controls). Our ultimate objective was to uncover potential biomarkers for progression and therapeutic targets.
METHODS
Patient selection
Using the David G. Jagelman Inherited Colorectal Cancer Registries' Institutional Review Board-approved Cologene database and the Cleveland Clinic Anatomic Pathology database, we identified FAP patients with duodenal polyposis. Clinical and endoscopic characteristics were obtained from electronic and paper medical records. Pathology specimens were obtained from Anatomic Pathology archives.
We identified 12 FAP patients with duodenal cancer (FAP cases) between 1988 and 2013 and 269 FAP patients with duodenal polyposis without cancer (FAP controls) undergoing upper endoscopic surveillance between 2005 and 2013. From this pool of FAP controls, we randomly selected 12 patients with similar age characteristics (mean, median, range) as our FAP cases (Figure 1). Clinical characteristics from FAP cases and FAP controls were collected, including age, gender, race, and sulindac or celecoxib use at the time of surveillance. Endoscopic characteristics were also collected, including polyp number (0–5, 6–20 or >20), size (0–5, 6–10 or >10 mm), histology (tubulous, tubulovillous, or villous) and dysplasia (low-grade or high-grade dysplasia) in the duodenum. Polyp histology and dysplasia information were taken from adenoma specimens obtained from FAP cases and FAP controls.
Figure 1.

Patient selection and gene expression comparisons. Comparisons are labeled as follows: a) cancer-normal; b) adenoma-normal; c) cancer-adenoma; d) adenoma (from FAP cases)-adenoma (from FAP controls). FAP, familial adenomatous polyposis.
Gene expression profiling
Upper endoscopic surveillance of patients with FAP was performed with a systematic approach (16). In each endoscopy, a forward-viewing and, when needed to view the papilla, side-viewing endoscope was used. Biopsies were performed on representative duodenal polyps and the papilla and specimens were preserved as formalin-fixed paraffin-embedded (FFPE) or Hollande's fixed samples. RNA extraction was performed with the Qiagen RNA FFPEasy kit. RNA was extracted from normal, adenoma, and cancer tissue from each of the 12 FAP cases and adenoma tissue from each of the 12 FAP controls, yielding 48 RNA samples. For adenoma samples, tissue with the most advanced histology was selected for extraction.
Gene expression profiling was performed using the Affymetrix GeneChip human transcriptome array (HTA) 2.0. Before profiling, quality control (QC) analysis verified that all 48 samples had sufficient yield (ranging from 43 to 159 μg). Our samples were run in 2 batches (24 samples per batch). RNA samples were converted to complementary DNA (cDNA) fragments, which were labeled to incorporate biotin. Labeled cDNA was then incubated with the HTA to allow hybridization of cDNA fragments to array oligonucleotides. Following hybridization, arrays underwent automated washing and fluorescent staining before collection of fluorescent signal intensities. At each step in this process, the same amount of RNA/cDNA from each sample was used to reduce batch-to-batch effects.
After raw data collection, each image file was visually inspected; no crude blemishes or grid misalignment was observed. Affymetrix proprietary algorithms featuring robust multi-chip analysis normalization was applied to all samples during data spreadsheet generation. A custom report monitoring 14 different QC metrics was generated using Affymetrix Expression Console. Principal among these was area under the curve (AUC), which indicated ease with which signal may be distinguished from background noise. AUC values range from 0 (imperfect) to 1 (perfect) and Affymetrix recommends values greater than 0.8. All 48 samples exceeded this metric; AUC values ranged from 0.899 to 0.979. Further corroboration of quality was indicated by consistency of other QC parameters, including perfect match mean and background mean. There were no outlier values, indicating no significant batch-to-batch discrepancy. Therefore, all 48 samples were retained in the data set. Transcription results have been deposited to NCBI GEO submission #GSE111156.
Verification by quantitative PCR
qPCR was performed in triplicate using a TaqMan RNA-to-CT 1-Step Master Mixtures Kit with primers and monocolor hydrolysis probes, Hs009590101_m1 (SPP1), Hs00356112_m1 (SI), Hs0016636_m1 (APOA4), Hs00944023_M1 (CEACAM5), Hs01105012_m1 (ANXA10), and Hs00187842_m1 (B2M) (Applied Biosystems, Foster City, CA). qPCR was performed on an ABI PRISM 7500 real-time PCR system, according to the manufacturer's instructions. For all genes, qPCR cycling conditions were 48 °C for 15 minutes, 95 °C for 10 minutes, 50 cycles of 95 °C for 15 seconds, 60 °C for 1 minute, and 37 °C for 1 minute. PCR products were subjected to electrophoresis on an agarose gel to confirm absence of nonspecific PCR products. For each sample, the crossing threshold point (CT) for the amplification curves was determined by the second derivative maximum method. Absolute quantitation was performed with an in-run standard curve. The reference gene Beta-2 microglobulin (B2M) was used for separation of control populations and all results were normalized against calibrator RNA from MCF7. ∆CT was defined as CT (candidate gene) − CT (B2M). ∆∆CT was defined as ∆CT (candidate gene in sample RNA) − ∆CT (candidate gene in calibrator RNA). Relative expression value, or power, for each candidate gene in each sample was calculated as 2−∆∆CT.
Statistical analysis
Analysis of transcriptional data was performed using the Affymetrix Expression Console Software package (version 1.3), R (version 3.2.0), and SAS (version 9.4). Raw data were processed using the Expression Console and further normalized with a cyclic loess approach. In comparisons, results for DEGs were expressed as either a positive fold change (FC), indicating upregulation or negative FC, indicating downregulation in the more advanced sample compared to the less advanced sample.
Within each FAP case, we performed comparisons between cancer and normal tissue (cancer-normal), between cancer and adenoma tissue (cancer-adenoma), and between adenoma and normal tissue (adenoma-normal) (Figure 1). For each pairwise comparison, we tested for significant differences at P < 0.05 using a nonparametric paired Wilcoxon test. To control for potential false positive results, we filtered pairwise results using a false discovery rate (FDR) < 0.10 and an absolute FC > 2 criteria. We then performed an unpaired comparison between adenomas from FAP cases and adenomas from FAP controls (adenoma-adenoma). We tested for significant differences at P < 0.05 using a nonparametric unpaired Wilcoxon test and filtered results using a FDR < 0.10 and an absolute FC > 2 criteria. Among DEGs in each comparison, we chose “representative” DEGs, which we defined as genes that have previously been implicated in FAP studies in mice or humans or in the development of other sporadic intestinal cancers.
Candidate DEGs were validated by quantitative polymerase chain reaction (PCR). For each comparisons, we tested for significant differences at P < 0.05 using nonparametric Wilcoxon tests.
RESULTS
Sample characteristics
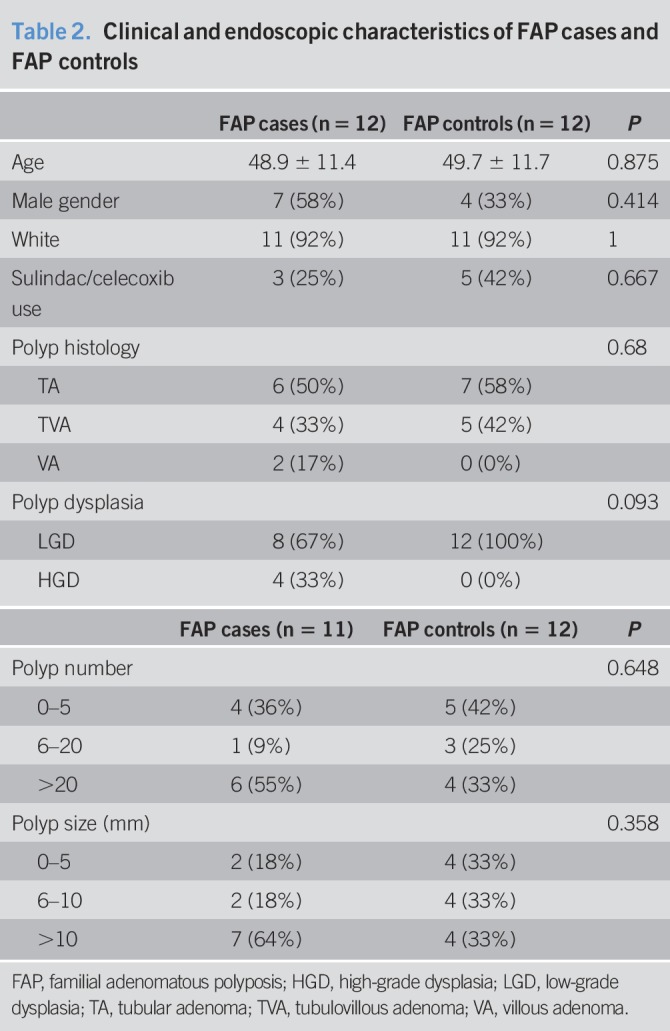
The median age of FAP cases and FAP controls was 48.5 years (range 34–70 years). Clinical and endoscopic characteristics in FAP cases and FAP controls are described in Tables 1 and 2. Of 12 FAP cases, 4 had ampullary and 8 had nonampullary cancer. FAP cases and FAP controls did not differ with regard to age, gender, race, sulindac/celecoxib use nor did they differ with regard to polyp number, size, histology, or dysplasia (Table 2).
Table 1.
Pathology of duodenal specimens from FAP cases and FAP controls

Table 2.
Clinical and endoscopic characteristics of FAP cases and FAP controls
Overview of DEGs
One hundred seventy-eight DEGs were identified with a FDR < 0.10 and an absolute FC > 2 in at least one comparison. Supplemental Table 1 (see Supplementary Digital Content 1, http://links.lww.com/CTG/A51) describes the number of DEGs in each comparison and Supplemental Table 2 (see Supplementary Digital Content 1, http://links.lww.com/CTG/A51) lists DEGs in each comparison. Protein-coding DEGs were classified into one of 9 groups according to cellular function/pathway of gene products. Table 3 shows representative DEGs within each group and FC in each comparison. Hierarchical clustering of DEGs in each comparison is shown in Figure 2.
Table 3.
Representative DEGs grouped by cellular function/pathway

Figure 2.

Hierarchical clustering for each of the 4 gene expression comparisons (a–d). DEGs with FC > 2 and P < 0.05 are shown, small nucleolar RNA, C/D box (SNORD) genes are not included. Each tissue type is color coded as follows: yellow = normal tissue from FAP case; red = adenoma from FAP case; cyan = cancer from FAP case; green = adenoma from FAP control. Lists of DEGs in each comparison is shown in Supplemental Table 2 (see Supplementary Digital content 1, http://links.lww.com/CTG/A51). DEG, differentially expressed gene; FAP, familial adenomatous polyposis; FC, fold change.
Transition from normal duodenal to adenoma in FAP
In the adenoma-normal comparison, 19 protein-coding DEGs were identified. Neoplastic processes involving 8 representative DEGs are shown in Table 4.
Table 4.
Transcriptional changes in adenoma-normal comparison

Enterocyte dedifferentiation
Enterocyte dedifferentiation can be determined by examining expression along the crypt-villus axis and in the Caco-2 cell line, which spontaneously differentiates into mature small intestine (17). In adenoma-normal, we found downregulation of DEGs involved in brush-border metabolism. Among these, expression of LCT (18) and TMPRSS15 (19) increases during the crypt-villus axis, while expression of LCT (20) increases with Caco-2 differentiation. We observed downregulation of APOA4 and APOB, which encode apolipoproteins whose expression increases during Caco-2 cell differentiation (21). The downregulation of these brush border and lipid metabolism DEGs indicates enterocyte dedifferentiation. In adenoma-normal, we found upregulation of SLC12A2, which encodes the basolateral ion transporter NKCC1. NKCC1 expression decreases in the crypt-villus axis (22), suggesting that its upregulation further implicates enterocyte dedifferentiation.
Warburg effect
During the transition from normal to adenoma, certain DEGs implicate the Warburg effect, in which proliferating tumor cells prefer glycolysis over gluconeogenesis and aerobic respiration. We found downregulation of ALDOB, which encodes a gluconeogenesis enzyme. Of note, Aldob is downregulated in adenomas of APCMin/+ mice (14).
Decreased production of all-trans retinoic acid
In adenoma-normal, RBP2 was downregulated. In small intestine, the retinol binding protein 2 (RBP2) mediates Vitamin A (retinol) uptake. Retinol is oxidized to all-trans-retinaldehyde by alcohol dehydrogenase and then to all-trans retinoic acid (ATRA) by aldehyde dehydrogenase (23). ATRA suppresses tumorigenesis in part by blocking induction of COX-2 (24). Therefore, downregulation of RBP2 indicates that decreased ATRA production may play a role in the transition of normal duodenum to adenoma. Of note, decreased ATRA production is implicated in APCMin/+ mice adenomas, which show downregulation of Adh1 (14).
Impaired reactive oxygen species/carcinogen defense
In adenoma-normal, we found downregulation of GSTA1 and GSTA2, which encode members of the α class of gluathione-S-transferase enzymes. These enzymes have glutathione peroxidase activity, which protects cells from reactive oxygen species (ROS). GSTA1 downregulation is seen in normal duodenum from patients with FAP compared to non-FAP controls (25). Furthermore, downregulation of Gsta4 is seen in intestinal adenomas of APCMin/+ mice (14). This suggests that diminished antioxidant defense plays a role in duodenal adenoma development in FAP.
Transition from duodenal adenoma to cancer in FAP
In the cancer-adenoma comparison, there were 26 protein-coding DEGs. Neoplastic processes involving 8 representative DEGs are shown in Table 5.
Table 5.
Transcriptional changes in cancer-adenoma comparison

Goblet and Paneth cell dedifferentiation
In cancer-adenoma, we found downregulation of CLCA1, which encodes a chloride channel expressed in intestinal goblet cells. CLCA1 expression increases with Caco-2 differentiation (26), suggesting that its downregulation may indicate goblet cell dedifferentiation.
In cancer-adenoma, we also found downregulation of DEFA5 and DEFA6, which encode α-defensins and are primarily expressed in Paneth cells of the small intestine (27). Both are upregulated in colon adenomas and cancer compared to normal tissue (28), indicating abnormal Paneth cell differentiation in colon tumors (29). Given these findings, DEFA5/6 downregulation may indicate Paneth dedifferentiation during the evolution of duodenal adenoma to cancer in FAP.
Decreased production of ATRA
In cancer-adenoma, we found downregulation of ADH1C, which again implicates decreased ATRA production in the progression of duodenal neoplasia in FAP.
Increased tumor invasiveness
In cancer-adenoma, upregulation of several DEGs involved in cell adhesion and extracellular matrix interactions was observed, including upregulation of COL12A1, which encodes for type XII collagen and is involved in the desmoplastic reaction between cancer cells and associated fibroblasts, which drives colon cancer metastases (30). Cancer tissue also exhibited upregulation of FN1 and SPP1. FN1 encodes fibronectin 1, which promotes cell proliferation and invasion by interacting with α5β1 integrin (31). SPP1 encodes osteopontin (OPN), which mediates cell migration partially through interactions with αvβ3 integrin (32). In cancer-adenoma, POSTN and IL8, which encode the pro-angiogenesis factors periostin (33) and interleukin-8 (34), respectively, were also upregulated.
DEGs with predictive potential in FAP
Among our representative DEGs, several have potential as tissue or serum biomarkers for progression of duodenal neoplasia.
Potential tissue biomarkers for duodenal cancer in FAP
We identified 13 protein-coding DEGs that distinguished FAP case and FAP control adenomas, all of which were downregulated in FAP cases (Supplemental Table 1, see Supplementary Digital Content 1, http://links.lww.com/CTG/A51). Of these DEGs, CLCA1, ADH1C, and ANXA10 have particular significance as potential tissue biomarkers.
CLCA1 encodes a chloride channel expressed in goblet cells, whereas ADH1C encodes an alcohol dehydrogenase enzyme involved in retinol oxidation. Studies have shown CLCA1 downregulation in CRC (26) and ADH1C downregulation in gastric cancer (23). In this study, CLCA1 and ADH1C are downregulated in cancer compared to adenoma and in adenoma from FAP cases compared to FAP controls, indicating that downregulation of these DEGs within adenomas may indicate increased likelihood of neoplastic progression.
ANXA10 encodes annexin 10, a calcium- and phospholipid-binding protein normally expressed in gastric mucosa that inhibits tumorigenesis by causing growth suppression and stimulation of apoptosis (35). Decreased ANXA10 expression is seen in gastric cancer (35). In this study, ANXA10 expression followed a unique pattern. Within FAP cases, ANXA10 does not differ in cancer-normal but is upregulated in adenoma-normal (FC 2.3, FDR 0.30) and downregulated in cancer-adenoma (FC −1.5, FDR < 0.10) comparisons. Furthermore, ANXA10 is significantly downregulated in adenoma from FAP cases compared to FAP controls (FC −2.1, FDR < 0.10). Considering the aforementioned roles of ANXA10, it is possible that the upregulation of ANXA10 in duodenal adenomas indicates a protective “gastric programming.” Downregulation during the transition from FAP control to FAP case adenoma and from FAP case adenoma to cancer may reflect a loss in the tumor suppressive function of ANXA10. Given these findings, determining tissue expression of ANXA10 may predict the likelihood that a duodenal adenoma progresses to cancer in FAP.
Potential serum biomarkers for duodenal cancer in FAP
Among the DEGs identified, SPP1 and CEACAM5 have potential as serum biomarkers for duodenal cancer in FAP.
SPP1 encodes OPN. SPP1 expression is 27-fold higher in sporadic ampullary cancer compared to normal duodenum and serum OPN progressively increases from healthy controls to patients with ampullary adenoma to patients with sporadic ampullary cancer (36). CEACAM5 encodes membrane-bound and secreted carcinoembryonic antigen (CEA). For CRC, serum CEA is an independent prognostic factor for recurrence and survival after curative resection (37). In this study, CEACAM5 is the only DEG upregulated in the adenoma-normal and cancer-adenoma comparisons (Table 3). Together, these findings suggest that serum OPN and CEA may help determine development of duodenal polyposis and progression to duodenal cancer in FAP.
DEGs with therapeutic potential in FAP
Certain DEGs may have significance in existing and novel chemopreventive therapies for duodenal polyposis.
Both celecoxib (5) and the sulindac/erlotinib combination (38) decrease duodenal polyp burden in FAP. We found upregulation of SPP1 in cancer-normal and cancer-adenoma comparisons. SPP1 is a Wnt/β-catenin target gene (39) and administration of the COX-2 inhibitor parecoxib to APC∆14/+ mice, which display a FAP phenotype, downregulates SPP1 by inhibition of Wnt/β-catenin while decreasing intestinal tumor load and mice morality (40). OPN is an upstream activator of the EGFR pathway (41). In non-small-cell lung cancer cell lines, the radiosensitizing effect of erlotinib is abolished after OPN depletion (42). Given its role as a target of PGE2 signaling and an activator of EGFR signaling, tissue levels of OPN may be of particular significance in predicting response to the sulindac/erlotinib combination regimen.
CEACAM6 upregulation in the adenoma-normal and cancer-normal comparisons was also noted. CEACAM6 encodes a membrane-bound cell adhesion molecule, which confers resistance to anoikis, the apoptosis induced by lack of correct cell/extracellular matrix attachment (43). This allows for cancer cell survival and invasiveness. Accordingly, CEACAM6 overexpression is seen in CRC (44) and pancreatic cancer (45). In a murine model of pancreatic cancer, administration of a CEACAM6-specific monoclonal antibody conjugated with immunotoxin increases tumor apoptosis and decreases tumor growth (46). In nonhuman primates, this antibody-drug conjugate has minimal toxicity, with a dose-dependent, reversible neutropenia (47). These findings implicate CEACAM6 as a potential novel therapeutic target in the treatment of duodenal polyposis in FAP.
PCR verification
We determined expression levels of candidate genes SPP1, CEACAM5, SI, APOA4, and ANXA10 by PCR. In certain samples from certain patients, PCR could not be successfully performed and expression levels were undefined (Supplemental Table 3, see Supplementary Digital Content 1, http://links.lww.com/CTG/A51).
For cancer-normal and cancer-adenoma comparisons, the sample size for comparison of SI expression was very low (n = 5). Therefore, we decided to exclude PCR results from SI expression. For the remaining genes, FAP cases 10 and 11 consistently did not yield results on PCR. Both FAP cases 10 and 11 had samples preserved with Hollande's fixative (Supplemental Table 4, see Supplementary Digital Content 1, http://links.lww.com/CTG/A51), which can affect RNA yield and quality (48) and therefore may explain the failure of PCR expression analysis in these samples.
Table 6 shows HTA and PCR results. For every comparison, direction of FC mirrored HTA findings. Specific magnitude of FC and statistical significance is detailed below.
SPP1: Gene expression differences in SPP1 was fully verified by PCR.
CEACAM5: PCR analyses verified no difference in adenoma-adenoma comparison. As in HTA analysis, PCR analysis showed upregulation in cancer-normal and cancer-adenoma, but each comparison had a trend toward significance.
APOA4: PCR analysis verified downregulation in all comparisons; of note, for adenoma-normal, PCR analysis showed a trend toward downregulation.
ANXA10: PCR analysis verified ANXA10 upregulation in adenoma-normal, downregulation in cancer-adenoma, and the lack of significant difference in cancer-normal. In adenoma-adenoma, PCR analysis showed a trend toward downregulation, which mirrored significant HTA results.
Table 6.
Gene expression analysis for 4 DEGs from human transcriptome array (HTA) vs confirmatory PCR

DISCUSSION
Duodenal cancer is a leading cause of death in FAP after colectomy. SS IV duodenal polyposis is a risk factor for duodenal cancer, yet many FAP patients have no history of SS IV polyposis (4,9,10), indicating a need for additional predictors of cancer risk. In APCMin/+ mice, gene expression changes accompany the evolution of small intestinal neoplasia (13,14). To date, no such genome-wide investigation has been performed in patients with FAP. In this study, we described the duodenal adenoma-carcinoma sequence in FAP by comparing normal, adenoma, and cancer tissue of 12 duodenal cancer cases. In the transition from normal duodenum to adenoma, we found potential roles for enterocyte dedifferentiation, the Warburg effect, decreased ATRA synthesis, and impaired ROS/carcinogen defense. In the transition from adenoma to cancer, Paneth/goblet cell dedifferentiation, decreased ATRA synthesis, and increased tumor invasiveness were implicated.
Several DEGs distinguished FAP case from FAP control adenomas. ANXA10 is unique in that it is upregulated from normal to adenoma in FAP cases but downregulated from FAP case adenoma to cancer and from FAP control adenoma to FAP case adenoma. Given its function, ANXA10 expression in adenomas may indicate a protective “gastric programming” that suppresses neoplastic evolution. We also identified DEGs upregulated in cancer compared to adenoma that may have utility as biomarkers for neoplastic progression, including SPP1 and CEACAM5 (36,49,50).
Delker et al. (15) performed gene expression analysis on normal duodenum and adenoma in patients with FAP who were either treated with sulindac/erlotinib or with placebo. In the placebo group, they performed an adenoma-normal comparison similar to the one performed in this study. Genes involved in Wnt, PGE2, and EGFR signaling were differentially expressed in the placebo group but not in the sulindac/erlotinib group, indicating a beneficial inhibition of these pathways (15). Duodenal polyps in this study also exhibited upregulation of CD44, a cancer stem cell marker associated with PGE2 signaling (51), and MMP7, which encodes a matrix metalloproteinase and is a Wnt/Beta-catenin signaling target (52). In our study, CD44 and MMP7 were both upregulated in our cancer-normal comparisons (Table 3). Furthermore, MMP1, which is also a WNT/Beta-catenin target (53), was upregulated in our adenoma-normal and cancer-normal comparisons (Table 3).
We also identified DEGs with therapeutic potential in FAP. We found upregulation of SPP1, which plays a role in both the tumorigenic effect of PGE2 (40) and in activation of EGFR signaling (41). Given its relation to both pathways, determining SPP1 expression may help predict response to sulindac/erlotinib therapy. We also identified CEACAM6 as a potential novel therapeutic target for duodenal polyposis control in FAP. CEACAM6 has been successfully targeted in animal models of pancreatic cancer (45,47).
Several limitations merit further discussion. Our RNA extraction and gene expression profiling procedures were specific for FFPE and Hollande's fixatives and all RNA samples met QC checkpoints for HTA profiling. However, during PCR verification, several samples, particularly Hollande's fixed samples, yielded undefined results. As a result, PCR comparisons involved lower sample sizes and, while FCs matched our HTA results for 4 candidate genes, P values in some comparisons did not reach statistical significance. This indicates the importance of future validation studies with independent cohorts. Another limitation is the potential for false positives. To address this, we applied a FDR < 0.10 cutoff for our DEGs. Although there is still potential for false positives despite this cutoff, it should be noted that of 52 DEGs that differed in 2+ comparisons, all 52 differed in the same direction (upregulation/downregulation) in each comparison. Similarly, of 8 DEGs that differed in 3+ comparisons, all differed in the same direction in each comparison.
In summary, we have conducted the first ever genome-wide expression analysis of duodenal neoplasia in FAP. Future validation studies with immunohistochemical staining or Western Blot analysis are needed to verify protein expression of candidate genes. Furthermore, for genes whose expression may predict response to celecoxib or sulindac/erlotinib therapy, gene knock-in or knock-out in APCMin/+ mice can be performed to determine effect on therapeutic response. Effect of the CEACAM6 antibody-drug conjugate on APCMin/+ mice can also be investigated, and if this shows therapeutic benefit and low toxicity, targeting CEACAM6 may emerge as a viable option for duodenal polyposis control in FAP.
CONFLICTS OF INTEREST
Guarantor of the article: Sushrut S. Thiruvengadam, MD.
Specific author contributions: Study concept and design: S.S.T. and C.A.B. Acquisition of data (retrospective identification and selection of patients): S.S.T., R.L., M.O. and L.L. Acquisition of data (identification and preparation of archived tissue samples for transcriptional profiling): S.S.T. and R.K.P. Acquisition of data (transcriptional profiling): M.L.V. and C.L. Acquisition of data (PCR verification): S.S.T., Z.W., and B.S. Analysis and interpretation of the data: S.S.T., R.L., Y.C., J.S.B., and C.A.B. Drafting of the manuscript: S.S.T. Critical revision of the manuscript for important intellectual content: C.A.B., J.B.S., M.L.V., B.S., and Z.W. All authors have reviewed the final submitted draft.
Financial support: Grant support provided by Cleveland Clinic Research Program Committees Award (RPC 2014–1047). Technical support for this work was provided by the Gene Expression and Genotyping Facility, a component of the Integrated Genomic Shared Resource sponsored by the Case Comprehensive Cancer Center (P30 CA43703). This work was independent of this funding.
Potential competing interests: C.A.B. reports the following relevant financial disclosures: grants from Cancer Prevention Pharmaceuticals, Ferring Pharmaceuticals, consultant royalties and personal fees from Sucampo, Aries, and Salix Pharmaceuticals. M.K. reports the following relevant financial disclosures: consulting honorarium from Helomics and TransEnterix. The other authors affirm that they have no relevant financial or personal conflicts to disclose.
Study Highlights.
WHAT IS KNOWN
✓ Murine models of FAP have identified DEGs in the duodenal adenoma-carcinoma sequence.
✓ This has not been studied in patients with FAP.
WHAT IS NEW HERE
✓ Transition from normal duodenum to adenoma is characterized by abnormal metabolism of brush border proteins, lipids, ROS, and retinol and transition from adenoma to cancer was characterized by upregulation of DEGs involved in cell invasion and migration.
✓ Certain DEGs differed between adenomas from cancer patients and controls.
✓ Several DEGs have potential therapeutic significance in existing chemopreventive regimens, including the sulindac/erlotinib combination for duodenal polyposis in FAP.
TRANSLATIONAL IMPACT
✓ In the future, physicians may be able to use differential expression of certain genes in order to determine progression of duodenal adenoma to cancer in FAP.
✓ In the future, physicians may be able to target novel and existing chemopreventive pathways to prevent progression of duodenal polyposis and development of cancer in FAP.
Supplementary Material
Footnotes
SUPPLEMENTARY MATERIAL accompanies this paper at http://links.lww.com/CTG/A51
REFERENCES
- 1.Klaus A, Birchmeier W. Wnt signalling and its impact on development and cancer. Nat Rev Cancer 2008;8:387–98. [DOI] [PubMed] [Google Scholar]
- 2.Vasen HFA, Möslein G, Alonso A, et al. Guidelines for the clinical management of familial adenomatous polyposis (FAP). Gut 2008;57:704–13. [DOI] [PubMed] [Google Scholar]
- 3.Galle TS, Juel K, Bülow S. Causes of death in familial adenomatous polyposis. Scand J Gastroenterol 1999;34:808–12. [DOI] [PubMed] [Google Scholar]
- 4.Bulow S, Bjork J, Christensen IJ, et al. Duodenal adenomatosis in familial adenomatous polyposis. Gut 2004;53:381–6. [DOI] [PMC free article] [PubMed] [Google Scholar]
- 5.Phillips RKS, Wallace MH, Lynch PM, et al. A randomised, double blind, placebo controlled study of celecoxib, a selective cyclooxygenase 2 inhibitor, on duodenal polyposis in familial adenomatous polyposis. Gut 2002;50:857–60. [DOI] [PMC free article] [PubMed] [Google Scholar]
- 6.Samadder NJ, Neklason DW, Boucher KM, et al. Effect of sulindac and erlotinib vs placebo on duodenal neoplasia in familial adenomatous polyposis. JAMA 2016;315:1266. [DOI] [PMC free article] [PubMed] [Google Scholar]
- 7.Brosens LAA, Keller JJ, Offerhaus GJA, et al. Prevention and management of duodenal polyps in familial adenomatous polyposis. Gut 2005;54:1034–43. [DOI] [PMC free article] [PubMed] [Google Scholar]
- 8.Johnson MD, Mackey R, Brown N, et al. Outcome based on management for duodenal adenomas: Sporadic versus familial disease. J Gastrointest Surg 2010;14:229–35. [DOI] [PubMed] [Google Scholar]
- 9.Groves CJ, Saunders BP, Spigelman AD, et al. Duodenal cancer in patients with familial adenomatous polyposis (FAP): Results of a 10 year prospective study. Gut 2002;50:636–41. [DOI] [PMC free article] [PubMed] [Google Scholar]
- 10.Björk J, Akerbrant H, Iselius L, et al. Periampullary adenomas and adenocarcinomas in familial adenomatous polyposis: Cumulative risks and APC gene mutations. Gastroenterology 2001;121:1127–35. [DOI] [PubMed] [Google Scholar]
- 11.Bianchi LK, Burke CA, Bennett AE, et al. Fundic gland polyp dysplasia is common in familial adenomatous polyposis. Clin Gastroenterol Hepatol 2008;6:180–5. [DOI] [PubMed] [Google Scholar]
- 12.Moser AR, Pitot HC, Dove WF. A dominant mutation that predisposes to multiple intestinal neoplasia in the mouse. Science 1990;247:322–4. [DOI] [PubMed] [Google Scholar]
- 13.Paoni NF, Feldman MW, Gutierrez LS, et al. Transcriptional profiling of the transition from normal intestinal epithelia to adenomas and carcinomas in the APCMin/+ mouse. Physiol Genomics 2003;15:228–35. [DOI] [PubMed] [Google Scholar]
- 14.Leclerc D, Deng L, Trasler J, et al. Apc Min/+ mouse model of colon cancer: Gene expression profiling in tumors. J Cel Biochem 2004;93:1242–54. [DOI] [PubMed] [Google Scholar]
- 15.Delker DA, Wood AC, Snow AK, et al. Chemoprevention with cyclooxygenase and epidermal growth factor receptor inhibitors in familial adenomatous polyposis patients: mRNA signatures of duodenal neoplasia. Cancer Prev Res 2018;11:4–15. [DOI] [PMC free article] [PubMed] [Google Scholar]
- 16.Burke CA, Beck GJ, Church JM, et al. The natural history of untreated duodenal and ampullary adenomas in patients with familial adenomatous polyposis followed in an endoscopic surveillance program. Gastrointest Endosc 1999;49:358–64. [DOI] [PubMed] [Google Scholar]
- 17.Sambuy Y, Angelis IDe, Ranaldi G, et al. The caco-2 cell line as a model of the intestinal barrier: Influence of cell and culture-related factors on caco-2 cell functional characteristics. Cell Biol Toxicol 2005;21:1–26. [DOI] [PubMed] [Google Scholar]
- 18.Goda T, Yasutake H, Tanaka T, et al. Lactase-phlorizin hydrolase and sucrase-isomaltase genes are expressed differently along the villus-crypt axis of rat jejunum. J Nutr 1999;129:1107–13. [DOI] [PubMed] [Google Scholar]
- 19.Imamura T, Kitamoto Y. Expression of enteropeptidase in differentiated enterocytes, goblet cells, and the tumor cells in human duodenum. Am J Physiol Gastrointest Liver Physiol 2003;285:G1235–41. [DOI] [PubMed] [Google Scholar]
- 20.Van Beers EH, Al RH, Rings EH, et al. Lactase and sucrase-isomaltase gene expression during Caco-2 cell differentiation. Biochem J 1995;308(Pt 3):769–75. [DOI] [PMC free article] [PubMed] [Google Scholar]
- 21.Reisher SR, Hughes TE, Ordovas JM, et al. Increased expression of apolipoprotein genes accompanies differentiation in the intestinal cell line Caco-2. Proc Natl Acad Sci U S A 1993;90:5757–61. [DOI] [PMC free article] [PubMed] [Google Scholar]
- 22.Jakab RL, Collaco AM, Ameen NA. Physiological relevance of cell-specific distribution patterns of CFTR, NKCC1, NBCe1, and NHE3 along the crypt-villus axis in the intestine. Am J Physiol Liver Physiol 2011;300:G82–98. [DOI] [PMC free article] [PubMed] [Google Scholar]
- 23.Kropotova ES, Zinov’eva OL, Zyrianova AF, et al. Expression of genes involved in retinoic acid biosynthesis in human gastric cancer [in Russian]. Mol Biol (Mosk) 2013;47:317–30. [DOI] [PubMed] [Google Scholar]
- 24.Subbaramaiah K, Cole PA, Dannenberg AJ. Retinoids and carnosol suppress cyclooxygenase-2 transcription by CREB-binding protein/p300-dependent and -independent mechanisms. Cancer Res 2002;62:2522–30. [PubMed] [Google Scholar]
- 25.van Heumen BW, Roelofs HM, te Morsche RH, et al. Duodenal mucosal risk markers in patients with familial adenomatous polyposis: Effects of celecoxib/ursodeoxycholic acid co-treatment and comparison with patient controls. Orphanet J Rare Dis 2013;8:181. [DOI] [PMC free article] [PubMed] [Google Scholar]
- 26.Yang B, Cao L, Liu B, et al. The transition from proliferation to differentiation in colorectal cancer is regulated by the calcium activated chloride channel A1. PLoS One 2013;8:e60861. [DOI] [PMC free article] [PubMed] [Google Scholar]
- 27.Mastroianni JR, Costales JK, Zaksheske J, et al. Alternative luminal activation mechanisms for paneth cell α-defensins. J Biol Chem 2012;287:11205–12. [DOI] [PMC free article] [PubMed] [Google Scholar]
- 28.Radeva MY, Jahns F, Wilhelm A, et al. Defensin alpha 6 (DEFA 6) overexpression threshold of over 60 fold can distinguish between adenoma and fully blown colon carcinoma in individual patients. BMC Cancer 2010;10:588. [DOI] [PMC free article] [PubMed] [Google Scholar]
- 29.Joo M, Shahsafaei A, Odze RD. Paneth cell differentiation in colonic epithelial neoplasms: Evidence for the role of the apc/β-catenin/Tcf pathway. Hum Pathol 2009;40:872–80. [DOI] [PubMed] [Google Scholar]
- 30.Karagiannis GS, Petraki C, Prassas I, et al. Proteomic signatures of the desmoplastic invasion front reveal collagen type XII as a marker of myofibroblastic differentiation during colorectal cancer metastasis. Oncotarget 2012;3:267–85. [DOI] [PMC free article] [PubMed] [Google Scholar]
- 31.Mitra AK, Sawada K, Tiwari P, et al. Ligand-independent activation of c-Met by fibronectin and α5β1-integrin regulates ovarian cancer invasion and metastasis. Oncogene 2011;30:1566–76. [DOI] [PMC free article] [PubMed] [Google Scholar]
- 32.Eltanani M, Campbell F, Kurisetty V, et al. The regulation and role of osteopontin in malignant transformation and cancer. Cytokine Growth Factor Rev 2006;17:463–74. [DOI] [PubMed] [Google Scholar]
- 33.Ouyang G, Liu M, Ruan K, et al. Upregulated expression of periostin by hypoxia in non-small-cell lung cancer cells promotes cell survival via the Akt/PKB pathway. Cancer Lett 2009;281:213–9. [DOI] [PubMed] [Google Scholar]
- 34.Yoshida S, Ono M, Shono T, et al. Involvement of interleukin-8, vascular endothelial growth factor, and basic fibroblast growth factor in tumor necrosis factor alpha-dependent angiogenesis. Mol Cell Biol 1997;17:4015–23. [DOI] [PMC free article] [PubMed] [Google Scholar]
- 35.Kim JK, Kim PJ, Jung KH, et al. Decreased expression of annexin A10 in gastric cancer and its overexpression in tumor cell growth suppression. Oncol Rep 2010;24:607–12. [PubMed] [Google Scholar]
- 36.Van Heek NT, Maitra A, Koopmann J, et al. Gene expression profiling identifies markers of ampullary adenocarcinoma. Cancer Biol Ther 2004;3:651–6. [DOI] [PubMed] [Google Scholar]
- 37.Kim CG, Ahn JB, Jung M, et al. Preoperative serum carcinoembryonic antigen level as a prognostic factor for recurrence and survival after curative resection followed by adjuvant chemotherapy in stage III colon cancer. Ann Surg Oncol 2017;24:227–35. [DOI] [PubMed] [Google Scholar]
- 38.Samadder NJ, Neklason DW, Boucher KM, et al. Effect of sulindac and erlotinib vs placebo on duodenal neoplasia in familial adenomatous polyposis. JAMA 2016;315:1266. [DOI] [PMC free article] [PubMed] [Google Scholar]
- 39.Rohde F, Rimkus C, Friederichs J, et al. Expression of osteopontin, a target gene of de-regulated Wnt signaling, predicts survival in colon cancer. Int J Cancer 2007;121:1717–23. [DOI] [PubMed] [Google Scholar]
- 40.Zagani R, Hamzaoui N, Cacheux W, et al. Cyclooxygenase-2 inhibitors down-regulate osteopontin and Nr4a2—New therapeutic targets for colorectal cancers. Gastroenterology 2009;137:1358–66.e3. [DOI] [PubMed] [Google Scholar]
- 41.Lamour V, Henry A, Kroonen J, et al. Targeting osteopontin suppresses glioblastoma stem-like cell character and tumorigenicity in vivo. Int J Cancer 2015;137:1047–57. [DOI] [PubMed] [Google Scholar]
- 42.Wang M, Han J, Marcar L, et al. Radiation resistance in KRAS-mutated lung cancer is enabled by stem-like properties mediated by an osteopontin-EGFR pathway. Cancer Res 2017;77:2018–28. [DOI] [PMC free article] [PubMed] [Google Scholar]
- 43.Beauchemin N, Arabzadeh A. Carcinoembryonic antigen-related cell adhesion molecules (CEACAMs) in cancer progression and metastasis. Cancer Metastasis Rev 2013;32:643–71. [DOI] [PubMed] [Google Scholar]
- 44.Jantscheff P, Terracciano L, Lowy A, et al. Expression of CEACAM6 in resectable colorectal cancer: A factor of independent prognostic significance. J Clin Oncol 2003;21:3638–46. [DOI] [PubMed] [Google Scholar]
- 45.Duxbury MS, Ito H, Ashley SW, et al. CEACAM6 as a novel target for indirect type 1 immunotoxin-based therapy in pancreatic adenocarcinoma. Biochem Biophys Res Commun 2004;317:837–43. [DOI] [PubMed] [Google Scholar]
- 46.Duxbury MS, Matros E, Clancy T, et al. CEACAM6 is a novel biomarker in pancreatic adenocarcinoma and PanIN lesions. Ann Surg 2005;241:491–6. [DOI] [PMC free article] [PubMed] [Google Scholar]
- 47.Strickland LA, Ross J, Williams S, et al. Preclinical evaluation of carcinoembryonic cell adhesion molecule (CEACAM) 6 as potential therapy target for pancreatic adenocarcinoma. J Pathol 2009;218:380–90. [DOI] [PubMed] [Google Scholar]
- 48.Zhou M, Bronner M, Magi-Galluzz C, et al. Optimized RNA extraction and RT-PCR assays provide successful molecular analysis on a wide variety of archival fixed tissues. Cancer Res 2007;67:4423. [Google Scholar]
- 49.Slentz K, Senagore A, Hibbert J, et al. Can preoperative and postoperative CEA predict survival after colon cancer resection? Am Surg 1994;60:528–31. [PubMed] [Google Scholar]
- 50.Ni XG, Bai XF, Mao YL, et al. The clinical value of serum CEA, CA19-9, and CA242 in the diagnosis and prognosis of pancreatic cancer. Eur J Surg Oncol 2005;31:164–9. [DOI] [PubMed] [Google Scholar]
- 51.Wang D, Fu L, Sun H, et al. Prostaglandin E2 promotes colorectal cancer stem cell expansion and metastasis in mice. Gastroenterology 2015;149:1884–95.e4. [DOI] [PMC free article] [PubMed] [Google Scholar]
- 52.Dey N, Young B, Abramovitz M, et al. Differential activation of Wnt-β-catenin pathway in triple negative breast cancer increases MMP7 in a PTEN dependent manner. PLoS One 2013;8:e77425. [DOI] [PMC free article] [PubMed] [Google Scholar]
- 53.Jean C, Blanc A, Prade-Houdellier N, et al. Epidermal growth factor receptor/-catenin/T-cell factor 4/matrix metalloproteinase 1: A new pathway for regulating keratinocyte invasiveness after UVA irradiation. Cancer Res 2009;69:3291–9. [DOI] [PubMed] [Google Scholar]
Associated Data
This section collects any data citations, data availability statements, or supplementary materials included in this article.