Abstract
Mitochondria contain their own genomes, and unlike nuclear genomes, mitochondrial genomes are inherited maternally. With a high mutation rate and little recombination, special selection mechanisms exist in the female germline to prevent the accumulation of deleterious mutations1–5. The molecular mechanisms underpinning selection remain poorly understood6. Here, using an allele-specific fluorescent in situ-hybridization approach to distinguish wildtype from mutant mtDNA, we have visualized germline selection for the first time. Selection first manifests in the early stages of Drosophila oogenesis, triggered by reduction of the pro-fusion protein Mitofusin. This leads to the physical separation of mitochondrial genomes into different mitochondrial fragments, preventing the mixing of genomes and their products, and thereby reducing complementation. Once fragmentated, mitochondria harboring mutant genomes are less able to make ATP, which marks them for selection through a process requiring the mitophagy proteins Atg1 and BNIP3. Surprisingly, a reduction in Atg1 or BNIP3 decreases the amount of wildtype mtDNA, suggesting a link between mitochondrial turnover and mtDNA replication. Remarkably, fragmentation is not only necessary for selection in germline tissues, but also sufficient to induce selection in somatic tissues where selection is normally absent. Our studies posit a generalizable mechanism to select against deleterious mtDNA mutations that may allow the development of strategies for treatment of mtDNA disorders.
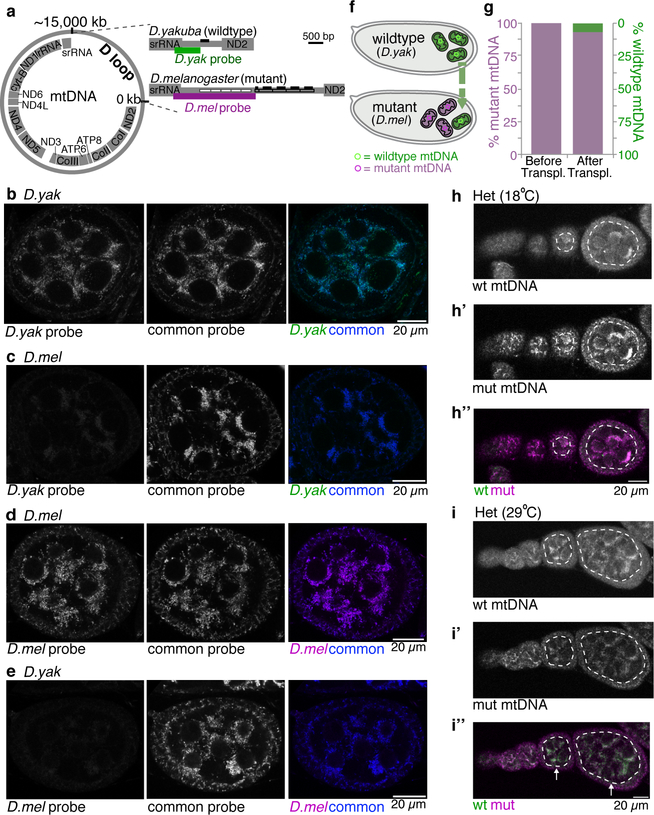
To visualize germline selection, we designed fluorescently labeled DNA probes that bind specifically to unique regions of the D-loops of mtDNA from either D. melanogaster or a closely related species, D. yakuba (Extended Data Fig. 1a–e). By transplanting wildtype D. yakuba mitochondria into a strain of D. melanogaster whose mtDNA contains a temperature-sensitive point mutation in cytochrome c oxidase subunit I (CoIts)3,5,7, we generated heteroplasmic animals harboring mixtures of wildtype and mutant mtDNA (Extended Data Figs. 1f,g, 4a,b). At the permissive temperature (18°C), the mutation does not grossly affect cytochrome oxidase activity and is consequently not selected against in the germline3,5,7. At the restrictive temperature (29°C), cytochrome oxidase activity is greatly reduced, and the mutation is selected against when paired with wildtype mtDNA from either D. melanogaster3,5,7 or D. yakuba8. This heteroplasmic animal model and mtDNA specific FISH assay allow us to directly observe and analyze mtDNA selection in vivo.
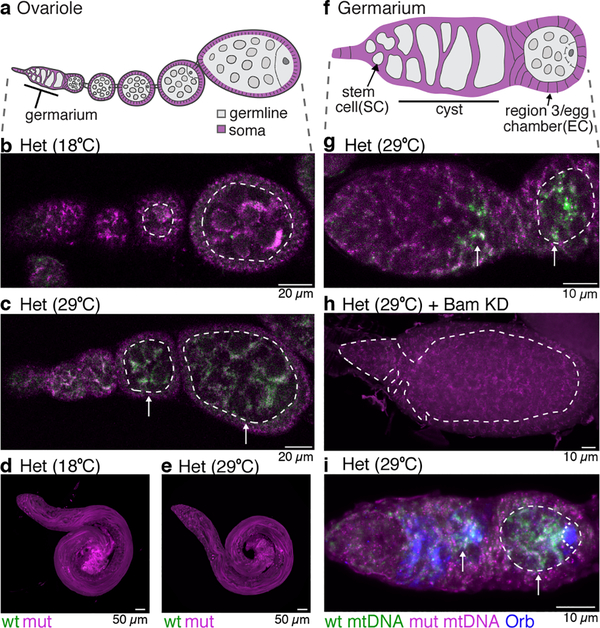
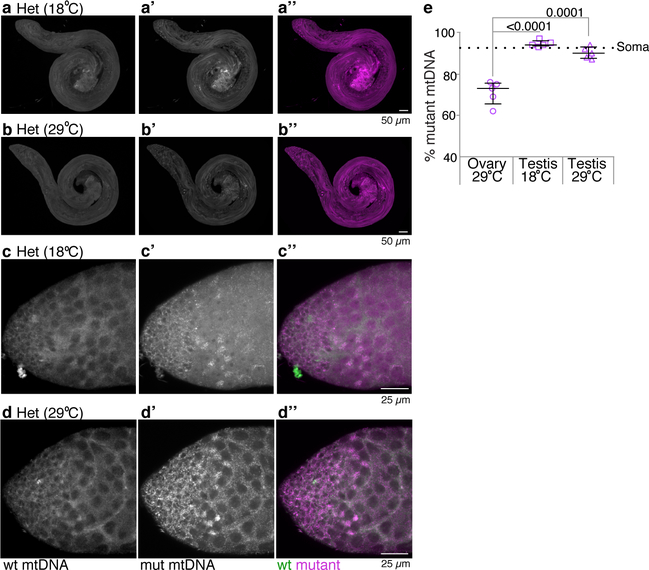
Drosophila ovaries comprise two tissue types: germline, which gives rise to eggs and the next generation, and somatic cells, which surround the germline (Fig. 1a). Since our heteroplasmic strain contained largely mutant D. melanogaster mtDNA (93%), at the permissive temperature the ovaries remained largely mutant in both the germline and soma (Fig. 1b; Extended Data Figs. 1h–h”). At the restrictive temperature, the proportion of wildtype D. yakuba mtDNA relative to mutant melanogaster mtDNA increased markedly in the germline but not the soma (Fig. 1c; Extended Data Figs. 1i–i”), demonstrating that mtDNA selection is germline-specific. Male mtDNA is not inherited, and mtDNA FISH and qPCR of heteroplasmic Drosophila testes indicate that mtDNA selection is largely absent in the male germline (Fig. 1d,e and Extended Data Fig. 2). Thus, mtDNA selection is female, germline-specific.
Figure 1. Purifying mtDNA selection is a female germline specific that manifests during cyst differentiation.
a. Schematic of ovariole: germarium at tip followed by egg chambers surrounded by somatic follicle cells. b and c. Ovarioles of flies heteroplasmic (Het) for D. melanogaster mt:Co1ts (mut) and D. yakuba (wt) genomes hybridized with fluorescent probes that detect either wt or mutant genomes. Selection against the mutant genome is observed in the germline at the restrictive (29°C) but not permissive (18°C) temperature. (See Extended Data Figs. 1h–i.) d and e. mtDNA FISH of Het testes. No selection against mutant genomes is observed at either 29°C or 18°C (See Extended Data Fig. 2.) f. Schematic of germarium: germline stem cells (SC) renew and produce cysts that mature into egg chambers (EC). g. mtDNA FISH of Het germarium at restrictive temperature. Arrows point to wt mtDNA, which is first strongly detected in cyst cells. (See Extended Data Fig. 3a,b,e.) h. Het germarium, expressing bam RNAi, arrested prior to cyst formation. No increase in wt mtDNA is observed. (See Extended Data Fig. 3c.) i. mtDNA FISH of Het germarium co-reacted with anti-Orb antisera to mark cysts and oocytes. (See Extended Data Fig. 3d.) b, c, g, h, and i. The dashed lines marks the boundary between somatic and germline cells. All images, here and below, are oriented with stem cells towards left.
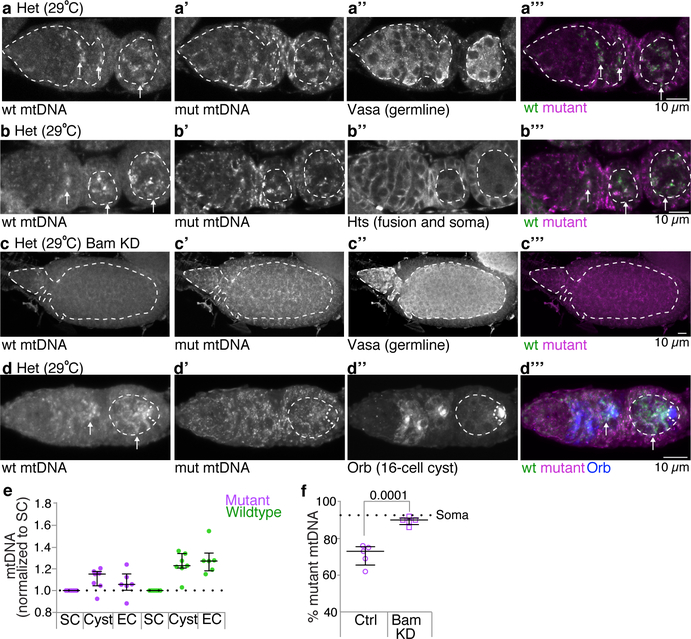
mtDNA selection is thought to occur early during oocyte development1–5. In Drosophila, during this time germline stem cells divide asymmetrically to self-renew and produce daughters that undergo four rounds of divisions with incomplete cytokinesis to form germline cysts (Fig. 1f). mtDNA FISH analysis showed no increase in wildtype D. yakuba mtDNA relative to mutant D. melanogaster mtDNA in germline stem cells. However, selection was observed when germ cells differentiated into cysts and thereafter into egg chambers (Fig. 1g,i; Extended Data Fig. 3a–a”’,b–b”’, 3d–d”’,e). Inhibition of cyst formation by reducing expression of the key early differentiation factor, Bag-of-marbles, blocked selection (Fig. 1h; Extended Data Fig. 3c–c”’,f). Our results show that mtDNA selection occurs after the stem-cell stage, early in oogenesis, during germline cyst differentiation.
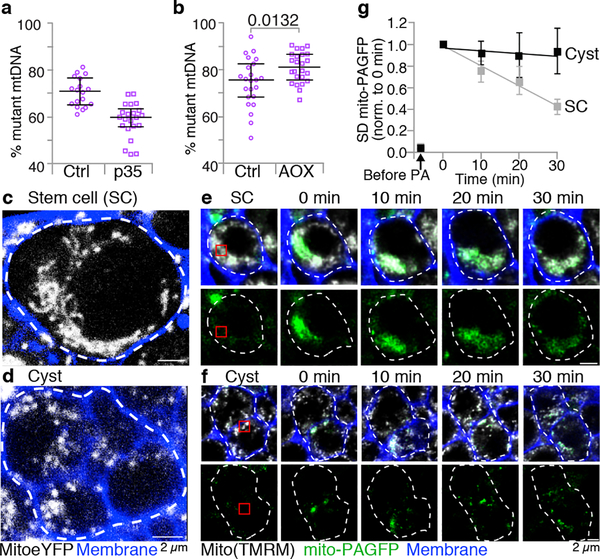
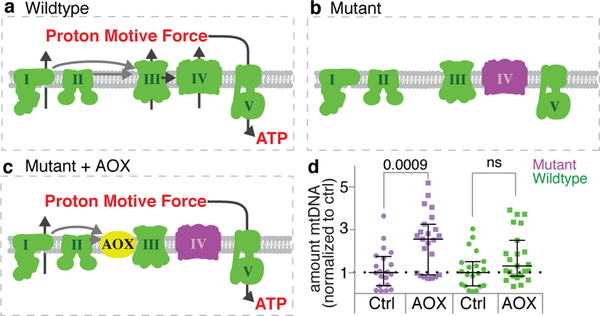
Germline selection could occur at the cellular level via cell death. Cyst cells that inherit too many mutant mitochondrial genomes might die and not be represented in subsequent progeny9. However, Hill et al. failed to observe cyst cell death during selection in Drosophila3, and we found that inhibiting cell death by overexpressing the cell death inhibitor p35 did not block selection (Fig. 2a). Alternatively, the unit of selection could be the mitochondrial genome. To test this, we asked whether expressing the Ciona intestinalis protein alternative oxidase (AOX), which can partially complement loss of Complex IV7,10, influenced selection (Extended Data Fig. 4a–c). In effect, we bypassed the function of complex IV, while leaving the mutant gene in place. Expression of AOX largely blocked selection by rescuing the mutant mitochondria (Fig. 2b; Extended Data Fig. 4a–d), indicating that the selection mechanism senses defects in the oxidative phosphorylation process. Consistent with earlier reports11, our data show that the unit of selection is the mitochondrion itself.
Figure 2. Germline cyst mitochondria undergo fragmentation.
a and b. Percent mutant mtDNA, as assayed by qPCR, of heteroplasmic ovaries with cell death blocked in the germline by expression of p35 (a), or with the function of the mutant Complex IV bypassed by expression of the Ciona intestinalis Alternative Oxidase (AOX) (b; see Extended Data Fig. 4.). The mtDNA qPCR data throughout are presented as medians with interquartile range and compared by two-tailed unpaired t tests. In Supplementary Table 2 for all data sets we also present 95% confidence intervals of the difference between the control and experimental means and the number of biologically independent samples used to derive the statistics. c and d. Stills of live images illustrating the differing shapes of mitochondria in stem cells (c) and 4 to 8 cell cysts (d). Mitochondria, white; Cell membranes, blue. Dashes outline the stem cell and 4 to 8 cell cyst. (See Supplementary Video 1.) e and f. Time course of diffusion of photoactivated mito-PAGFP in stem cells (SC, e) and 4–8 cell cysts (f). Mitochondria, white in upper panels. The red box marks the site of photoactivation. g. Quantification of diffusion of photoactivated mito-PAGFP in SC and cysts. The standard deviation (SD) of GFP fluorescence intensity in the whole stem cell or cyst at each time point was normalized to the initial postactivation value. Data are means and standard errors of 4 biological replicates.
We therefore asked whether morphological changes in mitochondria could be observed during selection in differentiating cysts. Using a mitochondrially targeted eYFP and live confocal microscopy, we observed that cyst mitochondria were rounder and more discrete than stem-cell mitochondria, which were more often clustered, tubular and branched (Fig. 2c,d, Supplementary Video 1). In accord with others12, these results suggest that germline cyst mitochondria become fragmented. We hypothesize that fragmentation allows mutant mitochondrial genomes to be distinguished from wildtype ones. During the 2 to 8 cell cyst stage, mtDNA does not replicate3; consequently, fragmentation causes a reduction in the number of genomes per mitochondrion, decreasing the probability that both mutant and wildtype reside in the same mitochondrion and improving the efficacy of selection. To facilitate selection it is also necessary that fragmentation prevents mitochondria from sharing their contents. To test this idea, we targeted a photoactivatable GFP (PAGFP) to the mitochondrial matrix and photoactivated a subset of mitochondria in stem-cells and cysts. In stem-cells, PAGFP diffused rapidly throughout the mitochondrial network, indicating that these mitochondria share contents (Fig. 2e,g). In cysts, PAGFP rarely passed from one mitochondrion to another (Fig. 2f,g), indicating that at this stage mitochondria do not readily share contents. These observations suggest that germline cyst mitochondrial fragmentation creates functionally distinguishable units for selection.
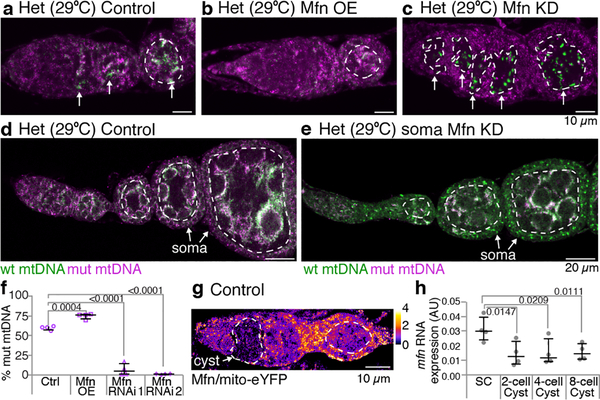
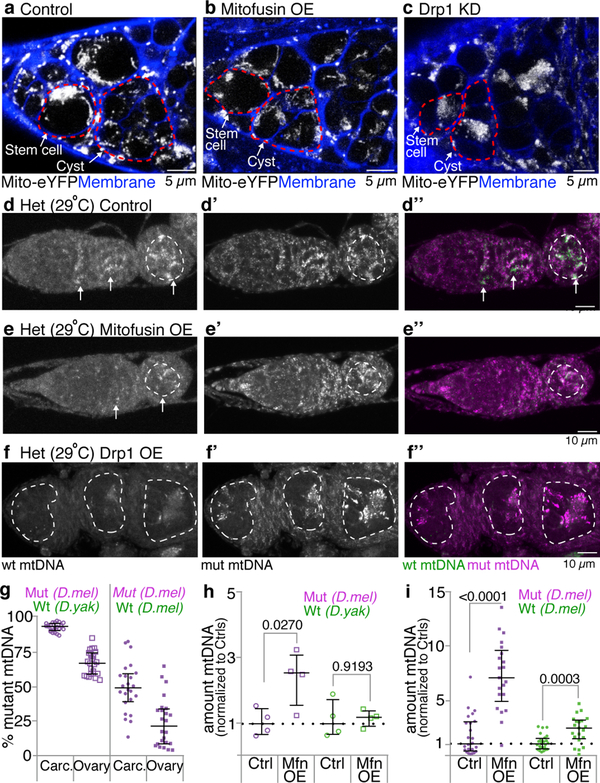
To directly test whether the fragmentation observed in cysts is necessary for selection, we increased the interconnectedness of cyst mitochondria by overexpressing the pro-fusion protein Mitofusin13 (Extended Data Fig. 5a,b). Using mtDNA FISH, we found that overexpressing Mitofusin largely abolished selection (Fig. 3a,b; Extended Data Fig. 5e–e”). Consistent with our FISH data, qPCR quantification indicated that Mitofusin overexpression increased the level of mutant mtDNA, while not grossly affecting wildtype mtDNA (Fig. 3f; Extended Data Fig. 5h). To exclude the possibility that our results were influenced by the fact that both the nuclear and mutant mitochondrial genomes were from D. melanogaster while the wildtype mitochondrial genome was from D. yakuba, we repeated the experiment in a heteroplasmic strain in which both wildtype and mutant mtDNAs were from D. melanogaster. In this D. melanogaster only background, Mitofusion overexpression similarly blocked selection (Extended Data Fig. 5i). Increasing connectedness of cyst mitochondria, by reducing expression of the pro-fission factor Drp114 (Extended Data Fig. 5c), also blocked selective removal of mutant mtDNA (Extended Data Fig. 5f–f”). These findings suggest that promoting mitochondrial fusion or inhibiting fission allows mutant mtDNA to hide and escape selection during oogenesis. Therefore, a sustained fragmented phase is necessary for mtDNA selection.
Figure 3. Mitochondrial fragmentation is necessary and sufficient for germline mitochondrial DNA selection.
a-c. mtDNA FISH of heteroplasmic germaria: (a) control, (b) germline overexpression of Mitofusin (Mfn; selection for wt mtDNA is no longer observed) and (c) germline knockdown of Mitofusin (selection for wt mtDNA is observed in stem cells). Dashed circles demarcate germline. Arrows mark selection for wt mtDNA. (See Extended Data Figs. 5d,e, 6c–c”’). d and e. Knocking down Mitofusin in somatic cells is sufficient to select against mutant mtDNA in those cells. f. Percent mutant mtDNA, as assayed by qPCR, of embryos laid by control heteroplasmic females and of embryos of heteroplasmic females in which Mitofusin was overexpressed (Mfn OE) or knocked down in the germline. (See Extended Data Figs. 5g, 6d,e.) g. Germarium expressing HA-tagged Mitofusin (Mfn), under its endogenous promoter, and mitochondrially target eYFP (eYFP) reacted with anti-HA and anti-GFP antisera. Pseudocoloring depicts the ratio of Mitofusin to mito-eYFP levels. For ratios see pseudocolor bar. Dashed circle pointed to by the arrow outlines the cysts. (See Extended Data Figs. 7a–a”’.) h. mitofusin RNA levels decrease in cysts compared to stem cells. The RNA levels were determined by RT-qPCR and are presented as arbitrary units (AU). Data were analyzed using unpaired one-tailed t tests. (See also Extended Data Fig. 7b.)
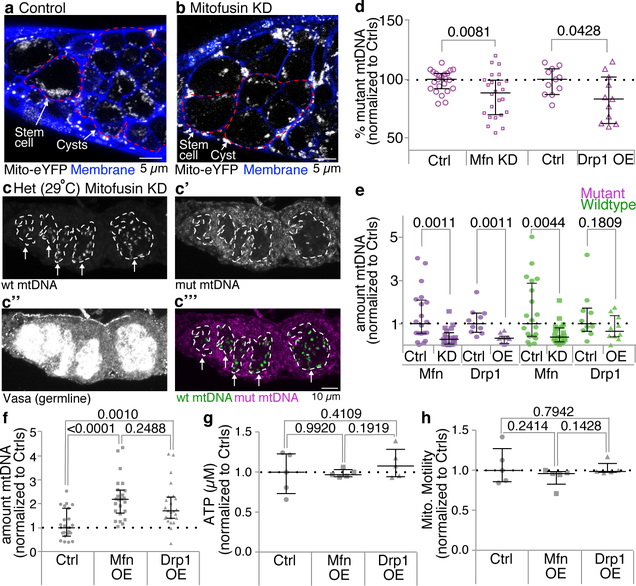
To test whether mitochondrial interconnectedness could underlie the absence of mtDNA selection in germline stem-cells, we promoted fragmentation in stem cells by reducing expression of Mitofusin (Extended Data Fig. 6a,b). This caused selection to occur in germline stem cells (Fig. 3c; Extended Data Fig. 6c–c”’). A striking reduction in mutant mtDNA was observed, suggesting that once fragmented, an elimination pathway acts to degrade mutant mtDNA. While, knockdown of Mitofusin also caused defects in germline development (Fig. 3c, Extended Data Fig. 6c–c”’), mtDNA quantification by qPCR of the few young embryos obtained (Fig. 3f) and of whole ovaries (Extended Data Fig. 6d,e) confirmed that reducing Mitofusin expression enhanced germline selection. Overexpression of Drp1 similarly enhanced selection (Extended Data Fig. 6d,e). Control experiments indicated that Mitofusin and Drp1 do not regulate selection through processes other than fusion and fission (see Supplementary Note 1). Together these data show that mitochondrial fragmentation is not only necessary but also sufficient for germline mtDNA selection.
There is no robust selection against mutant mtDNA in most somatic tissues15,16. Given that a prolonged fragmented phase is sufficient to induce selection in the germline, we asked whether it might also be sufficient in the soma. Remarkably, reducing Mitofusin expression induced strong selection against mutant mtDNA in somatic follicle cells (Fig. 3d,e), demonstrating that sustained fragmentation is sufficient to induce mtDNA selection in somatic cells. Our data indicate that the key determinant, which permits selection in the germline but not the soma, is the dramatic decrease in fusion of germline mitochondria during early oogenesis that results in an extended phase of mitochondrial fragmentation.
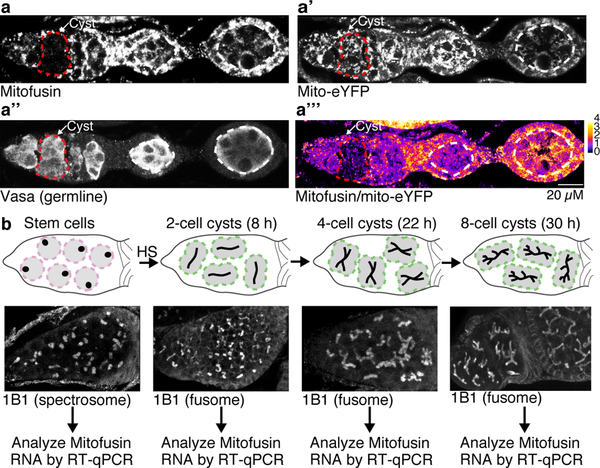
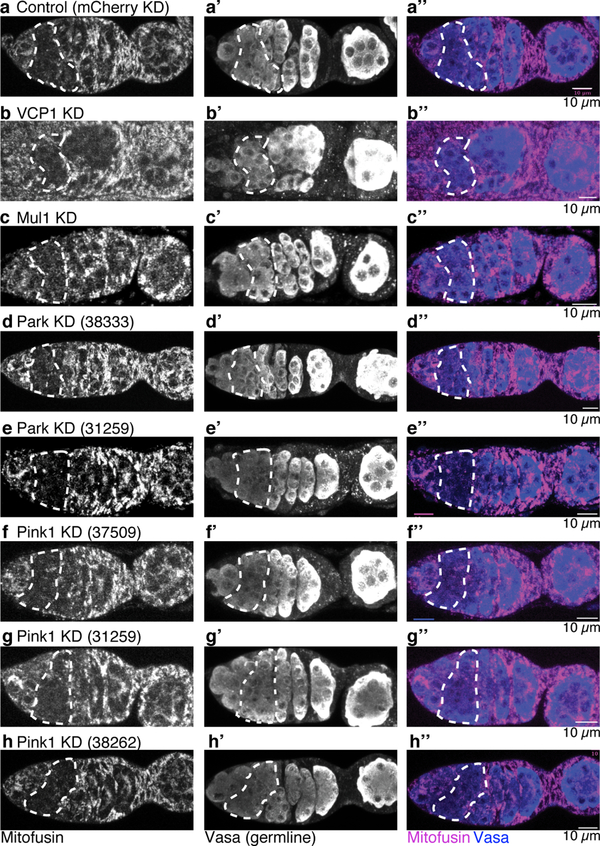
To test whether this fragmented phase is caused by a decrease in Mitofusin expression, we measured Mitofusin protein and RNA levels and found that both were selectively reduced in cyst mitochondria (Fig. 3g,h; Extended Data Fig. 7). Downregulation of Mitofusin was not affected by reducing expression of known posttranslational regulators Pink1, Parkin, VCP117 or Mul118 (Extended Data Fig. 8). Thus, Mitofusin expression is down-regulated in germline cysts, which drives mitochondrial fragmentation and in turn germline mtDNA selection.
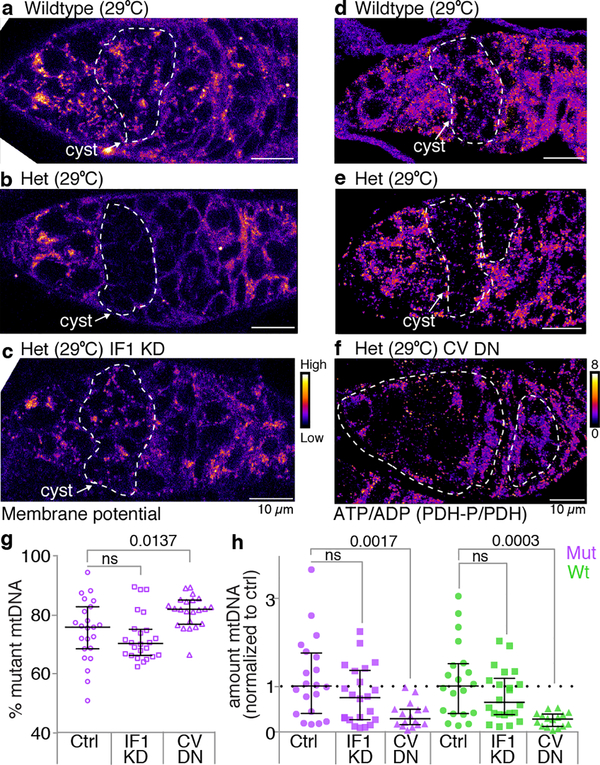
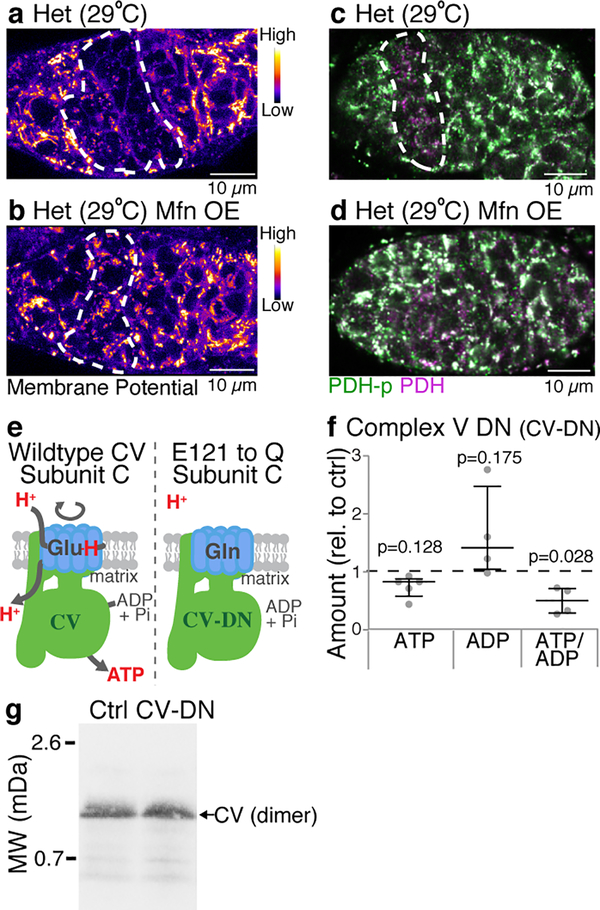
It remains unknown how mutant mitochondria are recognized and selected against once they are fragmented. The mitochondrial genome encodes proteins that are required for the generation of a proton motive force (PMF) and the synthesis of ATP. Mutations in mtDNA would therefore be expected to directly affect the PMF, ATP levels, or both. Indeed, both PMF and ATP levels were reduced in germline cysts, in predominantly mutant heteroplasmic animals (Fig. 4a,b,d,e, Extended Data Fig. 9a–d). Inhibition of mitochondrial fragmentation by overexpressing Mitofusin blocked this reduction, further highlighting the importance of sustained mitochondrial fragmentation in exposing mutant genomes (Extended Data Fig. 9a–d). To determine whether a reduction in PMF marks mutant mitochondria for selection, we tested the effect of restoring the PMF in mutant mitochondria. Normally, the ATP synthase inhibitory factor 1 (IF1) prevents ATP synthase from working in reverse to restore the PMF in mutant mitochondria19,20. Therefore, to restore the PMF, we reduced expression of IF1 (Fig. 4c). We observed no effect on selection (Fig. 4g) and no increase in the levels of wildtype or mutant mtDNA (Fig. 4h), indicating that a loss of PMF is not necessary for selection against mutant mitochondria. We then explored whether a reduction in mitochondrial ATP levels could provide a signal to select against mutant mitochondria. It is not possible to restore ATP levels in mutant heteroplasmic animals without also restoring the PMF. Therefore, we tested whether reducing ATP was sufficient to make wildtype mitochondria appear mutant and promote their elimination. We generated a transgenic strain that conditionally expressed a dominant negative form of ATP synthase in mutant and wildtype mitochondria alike (Fig. 4f; Extended Data Fig. 9e–g). Reduction in mitochondrial ATP levels reduced mutant mtDNA and importantly wildtype mtDNA (Figs. 4g,h), indicating that a reduction in mitochondrial ATP is sufficient to induce selection.
Figure 4. A decrease in mitochondrial ATP reduces both mutant and wildtype mtDNA.
a-c. Pseudocolored images of germaria of wildtype (a; w1118), heteroplasmic (b) and heteroplasmic females with ATP synthase inhibitory factor 1 (IF1 KD) knocked down in germline (c) reacted with TMRM to measure mitochondrial membrane potential. d-f. Germaria of wildtype (d; w1118), heteroplasmic (e) and heteroplasmic females expressing a dominant negative inhibitor of complex V (CV DN) in the germline (f) reacted with antibodies to phosphorylated pyruvate dehydrogenase (PDH-P) and pyruvate dehydrogenase (PDH). Pseudocoloring depicts the ratio of PDH-P to PDH and is a measure ATP levels. (See Extended Data Fig. 9.) g and h. Percent mutant mtDNA (g) and the amount of mutant and wildtype mtDNA (h), as assayed by qPCR, of control heteroplasmic ovaries, of heteroplasmic ovaries in which the ATP synthase inhibitory factor 1 was knocked down in the germline (IF1 KD), and of heteroplasmic ovaries in which a dominant negative inhibitor of complex V (CV DN) was expressed in the germline. In h the amounts of mutant and wildtype DNA were normalized to the amounts in control ovaries.
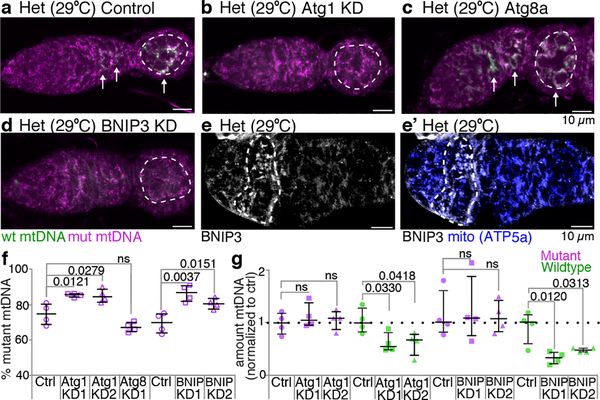
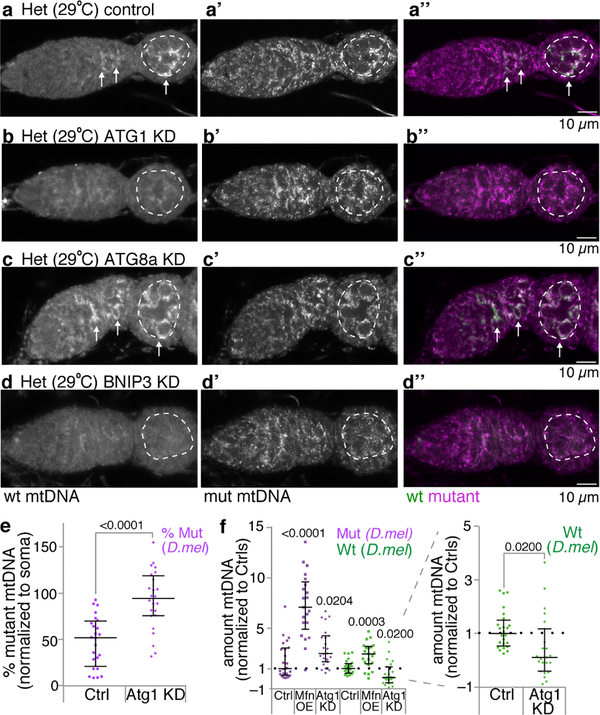
We next sought to determine how mutant mitochondria are selected against once they have been fragmented and their ATP depleted. Mitophagy would seem to be a good candidate for the mechanism, as it is the main pathway to eliminate dysfunctional mitochondria from somatic tissues21. Nonetheless, Parkin-mediated mitophagy has little effect on the clearance of mutant mtDNA in somatic tissues15 or in the germline5. Nevertheless, because mitochondrial fragmentation in stem cells caused a striking reduction in mutant mtDNA (Fig. 3C), we asked whether other mitophagy pathway components are required for germline mtDNA selection. Interestingly, we found that knockdown of Atg1, the master regulator of autophagy21, blocked selection, while knockdown of Atg8, a key structural component of the autophagosome that interacts with selective autophagy receptors21, did not (Fig. 5a–c,f and Extended Data 10a–c”). Instances of Atg1-dependent, Atg8- and Parkin-independent mitophagy have been previously described, notably in the clearance of mitochondria during red blood cell maturation22–24, which also requires the outer mitochondrial membrane protein NIX/BNIP3L25. Given these parallels, we asked whether CG5059 (BNIP3), the Drosophila protein most homologous to NIX/BNIP3L, was required for selection in the germline. Reducing BNIP3 expression inhibited selection (Fig. 5d,f and Extended Data 10d–d”). Consistent with these findings, BNIP3 is upregulated in differentiating cysts26 where it associated with mitochondria (Fig. 5e,e’).
Figure 5. The mitophagy proteins Atg1 and BNIP3 are necessary for germline mitochondrial DNA selection.
a-d. mtDNA FISH of control heteroplasmic germaria (a) and of heteroplasmic germaria in which Atg1 (b), Atg8 (c) or BNIP3 (d) were knocked down. The dashed circles demarcate the germline, arrows point to wildtype mtDNA. (See Extended Data Fig 10.) e and e’. BNIP3 protein localization in a heteroplasmic germarium. e’ also shows mitochondria (blue) as visualized with anti-ATP5a antibody. f. Percent mutant mtDNA, as assayed by qPCR, of control heteroplasmic ovaries (Ctrl) and of ovaries in which Atg1, Atg8 or BNIP3 were knocked down. g. The amount of mutant and wildtype mtDNA, as assayed by qPCR, in ovaries in which Atg1 or BNIP3 were knocked down, normalized to the amount of mutant and wildtype mtDNA in control ovaries.
Bypassing mutant complex IV (Extended Data Fig. 4d) or preventing mitochondrial fragmentation by overexpressing Mitofusin (Extended Data Figs. 5h,i) primarily blocked selection by preventing elimination of mutant mtDNA. To our surprise, we found that instead of preventing elimination of mutant mtDNA, reducing the expression of Atg1 or BNIP3 predominantly decreased the levels of wildtype mtDNA (Fig. 5g). This was also the case when Atg1 was knocked down in a heteroplasmic strain in which both wildtype and mutant mtDNAs were from D. melanogaster (Extended Data Fig. 10e,f). It has been proposed that Pink1 inhibits replication of mutant mtDNA allowing wildtype mtDNA to outcompete their mutant counterparts3,5,11. Our results suggest that the turnover of mitochondria is coupled to replication such that elimination of defective mitochondria may trigger replication of active mitochondria and ultimately selection.
Our findings indicate that developmentally regulated fragmentation of cyst mitochondria is needed to isolate their genomes and proteomes, so that mitochondria possessing mutant mtDNA can be selected against through a process requiring the mitophagy proteins Atg1 and BNIP3. Given the benefits of mitochondrial fragmentation on mtDNA selection, why aren’t mitochondria always fragmented? Enhanced fragmentation comes at a cost, as strong knockdown of Mitofusin causes mitochondrial and cellular dysfunction in both germline and somatic tissues (Extended Data Fig. 6c–c”’)27. In addition, evidence suggests that frequent fusion and swapping of mitochondrial contents is important to maintain the health of the network27 and efficiently generate ATP28. We previously showed that during early oogenesis the germline does not have a strong requirement for mitochondrially generated ATP29. It may have evolved an alternative energy metabolism in order to tolerate the possible negative energetic consequences of reduced mitochondrial function caused by sustained fragmentation. It will be interesting to explore whether inducing mitochondrial fragmentation in somatic tissues can be used as a treatment for those suffering from mtDNA disorders. Recent work suggests that this may be the case; inducing mitochondrial fragmentation in the soma temporarily during midlife improved health and prolonged lifespan in Drosophila and C. elegans, possibly by promoting the removal of deleterious mtDNA16,30,31. In conclusion, we have uncovered a key driver of mtDNA purifying selection in the female germline, and our findings suggest new therapeutic approaches for treatment of mtDNA disorders.
METHODS
Fly stocks
For a list of fly stocks used in this paper see Supplementary Table 1.
To generate UAS.CV-DN the coding sequence of ATP synthase subunit C (CG1746) was amplified using Phusion High Fidelity PCR system (NEB, M0530L), the proton accepting glutamic acid 121 (numbered according to the start of the preprotein) mutated to a glutamine and the mutated coding sequence cloned into pVALIUM2232 using Gibson Assembly® master mix (NEB, E2611S). Plasmid DNA was then injected by BestGene Inc. into a strain carrying attP40 landing sites and integrated into the second chromosome using phiC31 integrase33.
Heteroplasmic flies
Heteroplasmic flies were generated by germ plasm transfer from either wildtype Drosophila yakuba or wildtype Drosophila melanogaster (w1118) embryos into mutant Drosophila melanogaster (mt:CoIts + mt:nd2del1) embryos as described previously5,34. GAL4 drivers were crossed into the heteroplasmic fly lines. Heteroplasmic yakuba/melanogaster flies were maintained at 29°C. Heteroplasmic melanogaster/melanogaster flies were maintained at 18°C. They were mated to flies carrying RNAi or overexpression constructs at 18°C for 2–3 days. The embryos and first instar larvae were then aged for 2–3 days at 18°C prior to being shifted to 29°C.
Fluorescent in situ hybridization and immunofluorescence
Generation of unique probes
For Drosophila melanogaster: The D loop was amplified from mtDNA using the primers ggccgatatcccgcgactgctggcaccaatttagtca and ggccgatatcccctatcaaggtaatcctttttatcaggca. The PCR product was digested with EcoRV and SwaI and the unique sequences subcloned into pUC19. The DNA that was subsequently nick translated was amplified using m13 forward and reverse primers. For Drosophila yakuba: The D loop was amplified from mtDNA using the primers ggccggatccccgcgactgctggcaccaatttggt and ggccaagcttccctatcaaggtaaccctttttatcaggca and subcloned into pUC19. The unique sequences were amplified using m13 forward and gattatctattaatttagaacttagtataca primers. Fluorescent probes were generated by nick translation using FISH Tag DNA kits (Thermo Fisher). The probes that recognize mtDNA of both species have been described previously35.
With the exception of the temperature shift experiments (Figs. 1b–e, Extended Data Figs. 1h,i, 2) ovaries were dissected from 1–3 day old females. Ovaries and testes were fixed and hybridized essentially as described36. Dissected ovaries and testes were fixed for 4 and 8 minutes respectively in cacodylate fixative (100mM Na Cacodylate, pH 7.4, 100mM sucrose, 40mM KOAc, 10mM NaOAc, 10mM EGTA, 5% formaldehyde). They were then washed 4 X 10 min in 2X SSCT (2XSSC, 0.1% Tween-20). Ovaries were washed for 10 min in 20% then 40% formamide in 2X SSCT and 2X in 50% formamide in 2XSSCT. They were then incubated in 40ul of 2XSSC, 50% formamide, 10% dextran sulfate, 5ug E. coli tRNA, 5ug salmon sperm DNA, 40ug BSA, 200ng each fluorescent probe for 3 min at 91°C, prior to incubation overnight at 30°C. Testes were washed 3 X 10 min in PBS/0.5% Triton X-100, dehydrated through an ethanol series, incubated in 100% ethanol overnight at 4°C, rehydrated, incubated in 5% HOAc at 4°C for 5 min, washed 3 X 5 min in PBS at 4°C and refixed in 2% paraformaldehyde at room temperature for 55 min37. Following three 10 min washes in PBS/0.5% Triton X-100, testes were washed 3 X 10 min in 2X SSCT, exchanged into 50% formamide, and hybridized like ovaries except that they were incubated for 4 hours at 50°C prior to overnight incubation at 30°C. Both ovaries and testes were washed 4 X 10 min in 50% formamide in 2X SSCT at 30°C, 10 min in 40% formamide, then 20% formamide at in 2X SSCT at room temperature, and 3 X 10 min in 2X SSCT at room temperature. When FISH was followed by immunofluorescence, ovaries were rinsed 3X in PBS and fixed again in 2% paraformaldehyde in PBS for 30 min. Immunofluorescence was as described35.
Imaging parameters are presented in Supplementary Table 3. For mtDNA FISH, at least 10 control and experimental ovarioles, germaria or testes were imaged for each experimental condition. For determining the ratios of PDH-P/PDH (Figs. 4d–f), Mitofusin/mito-eYFP (Fig. 3g, Extended Data Fig. 7a) and the localization of BNIP3 (Figs. 5e,f) at least 3 germaria were imaged. Imaging was not done blind. Deconvolution was performed using the aggressive unsupervised profile of Huygens Professional. (See Supplementary Table 3 for list of images that were deconvolved.) In order to be able to visualize changes in germline mtDNA across samples, images were normalized so that the somatic cells of the ovary were ~90% mutant mtDNA (magenta), approximately the percentage determined by our qPCR measurements. Using Fiji38 the display range was adjusted by modifying the minimum to remove background signal (~10%) from the wildtype mtDNA (green) channel. Both the mutant and wildtype maximum settings were then adjusted to make the soma ~90% as measured by quantifying a region of interest in the soma after conversion to RGB color (see Supplementary Table 3). When the soma was manipulated (Figs. 3d,e) images were instead normalized as above to make the germline ~65% mutant mtDNA. In Extended Data we present in gray scale the non-background subtracted, unnormalized images.
Antibodies
Primary antisera used were rabbit anti-Vasa (R. Lehmann laboratory), mouse monoclonal anti-Hts (1B1, DSHB)39, mouse monoclonal anti-Orb (4H8, DSHB)40, mouse monoclonal anti-HA (abcam ab130275), chicken anti-GFP (Aves Labs, GFP-1020), mouse monoclonal anti-ATP5A [15H4C4] (abcam ab14748), mouse anti-PDH E1 alpha (Abcam, ab110334) and rabbit anti-phoshpo-PDH E1alpha (S293) (Millipore, AP1062). Secondary antibodies were DyLight™ 405 donkey anti-rabbit, DyLight™ 405 donkey anti-mouse, Cy3 donkey anti-mouse, all from Jackson ImmunoResearch, and Alexa fluor 488 goat anti-chicken from ThermoFisher Scientific.
qPCR quantification of mitochondrial DNA
One to 3 day old flies were dissected. For Figs. 3f, 5f,g, Extended Data Figs. 1g, 2e, 3f, 5h, mtDNA was extracted from pools of embryos, dissected ovaries and fly carcasses as previously described5. Samples were mechanically homogenized with a plastic pestle in 100 μl of homogenization buffer (100 mM Tris-HCl pH 8.8, 0.5 mM EDTA, 1% SDS) and incubated for 30 min at 65°C. Potassium acetate was added to 1M and samples were incubated for 30 min on ice, before centrifugation at 20,000 g for 15 min at 4°C. DNA was then precipitated from the supernatant by adding 0.5 volumes of isopropanol and centrifugation at 20,000 g for 5 min at room temperature. The resultant pellet was washed with 70% ethanol and suspended in water. qPCR was carried out using 25 ng of nucleic acid and 300 nM of each primer pair with a Roche LightCycler 480 machine and LightCycler 480 SYBR Green I Master 2X (Roche, 04887352001). The PCR program was: 10 min at 95°C, 45 cycles of 95°C for 15 s and 60°C for 1 min. Dissociation curves generated through a thermal denaturation step were used to verify amplification specificity. For Figs. 2a,b, 4g,h, Extended Data Figs. 4d, 5i, 6d,e,f 10e,f individual ovaries and carcasses were homogenized in 10mM Tris pH8.0, 1mM EDTA, 25mM NaCl, 200 ug/ml Proteinase K, incubated at 25°C for 30 minutes, 95°C for 2 minutes41. qPCR was carried out as described above with 1/25 of an ovary and 1/50 of a carcass. For a list of the primers used see Supplementary Table 4.
The crossing point (Cp) values (the cycle at which the fluorescence of a sample rises above the background fluorescence) were calculated using the Second Derivative Maximum method of the Roche LightCycler 480 software. The Cp values used in the analysis were the mean values of the 2 primer sets that amplified the indicated genomic or mtDNAs. The amount of mutant or wild type mtDNA = 2−Cp. The % mutant DNA = (amount mutant mtDNA/(amount mutant mtDNA + amount wildtype mtDNA)) × 100. The soma (carcass) represents the starting heteroplasmy of the animal being measured. This percentage varies somewhat from animal to animal. Because we are interested in the % decrease in mutant mtDNA in the germline relative to the starting heteroplasmy, the percent mutant mtDNA in each ovary was normalized to the percent mutant mtDNA in its corresponding carcass. The percent wildtype mtDNA in each ovary was then derived by subtracting that value from 100%.
To determine the amount of mutant and wildtype mtDNA relative to the amount of genomic DNA, the amount of total mtDNA in each ovary was normalized to the amount of genomic DNA in that ovary. The amount of mutant and wildtype mtDNA was determined by multiplying the normalized percent mutant or wildtype mtDNA in the ovary by the normalized amount of mtDNA in that ovary.
Because of the number of manipulations involved in generating qPCR data, any of which can result in errors, we routinely tested for outliers. Outliers were identified using the ROUT method (Q=1%) as implemented in Prism 7 for Mac OS X GraphPad Software, La Jolla California USA, www.graphpad.com. All outliers were removed ad hoc, i.e. they were removed prior to looking at the data.
Data were analyzed using unpaired two-tailed t tests and 95% confidence intervals of the difference between the control and experimental means as implemented in Prism 7 for Mac OS X GraphPad Software, La Jolla California USA, www.graphpad.com. See Supplementary Table 2.
Quantification of mitofusin RNA levels
To generate ovaries with 2, 4 and 8-cell cysts, hs-bam;;bamΔ86 flies were heat shocked for 2 hours at 37°C in a circulating water bath, transferred to new freshly yeasted vials, and incubated at 29°C for 8 hours (2-cell cyst), 22 hours (4-cell cyst) and 30 hours (8-cell cysts) before ovaries were extracted for total RNA isolation. Total RNA isolated from ovaries using Tri-Reagent (BioShop, TRI118) was treated with Turbo DNA-free Kit (ThermoFisher, AM1907) to remove residual genomic DNA contamination. Reverse transcription (RT) was performed on 1μg of total RNA using oligo(dT)20 primers (ThermoFisher, 18418020) and Superscript III (ThermoFisher, 18064014). qPCR was carried out using SensiFASTTM SYBR No-ROX qPCR kit (FroggaBio, BIO-98050) and the cycling parameters described above on 1/2 of the RT reaction with marf specific primers. Dissociation curves generated through a thermal denaturing step were used to verify amplification specificity. Results were normalized to the mean value obtained for three genes (CG8187; CG2698; Und) with invariant expression in a range tissues and developmental stages, as revealed by publicly available transcriptome data42. Data were analyzed using unpaired one-tailed t tests. For a list of the primers used see Supplementary Table 4.
Live imaging, photo-activation and measurement of membrane potential
For live imaging mito-eYFP tagged mitochondria, ovaries were removed from females and the ovarioles teased apart using tungsten needles in Halocarbon 200 oil (Halocarbon Prodcuts Corp., 9002–83–9) on a coverslide. For photoactivation and membrane potential measurement, ovaries were removed from females and incubated in Schneider’s medium (Life technology, 21720) containing 1 μM tetraphenylborate (Sigma, T25402) and 20 nM tetramethylrhodamine, methyl ester (TMRM) (Invitrogen, T668) for 30 min at room temperature in the dark. 10 μg/ml CellMask™ Deep Red plasma membrane stain (Invitrogen, C10046) was then added and the ovaries were incubated for 10 more min. The ovaries were washed once with Schneider’s Medium before being teased apart as above in Halocarbon 200 oil on a coverslip. For all live imaging, the samples were then mounted on a slide with a gas permeable membrane (YSI, Membrane Kit Standard) prior to imaging with a Zeiss LSM780 confocal microscope with Plan-Apochromat 40X/1.4 Oil DIC and Plan-Apochromat 63X/1.4 Oil DIC objectives. For all live imaging experiments and for measurement of membrane potential at least 3 biological replicas were imaged. For photoactivation, the background signal (before photoactivation) was subtracted from all images in the time series using Fiji. Images were corrected for chromatic shifting using 0.1 nm TetraSpeck microspheres (ThermoFisher) and deconvolved using Huygens Essential X11. For the quantification of the diffusion of photoactivated mito-PAGFP in stem cells and cysts, the standard deviation of the PAGFP fluorescence intensity was calculated using Fiji as previously described43,44. An increase in diffusion of PAGFP leads to a decrease in the standard deviation and indicates an increase in the number of productive fusion events. Imaris software (Bitplane) was used to quantify mitochondrial motility in germaria. Individual mitochondria were tracked using the autoregressive motion algorithm and the distance they moved (μm) in one second was measured for each mitochondrion (displacement delta length). Mean displacement of all mitochondria over one minute of live imaging is reported.
Clear Native Gel Electrophoresis
ATP synthase oligomerization was assessed by CN-PAGE45. 10 pairs of ovaries were homogenized in 50 μL PBS and mixed with 50 μL 0.1% digitonin (ThermoFisher, BN20061) in PBS. After incubation on ice for 15 min, samples were centrifuged (10,000 X g) for 15 min at 4°C. The pellets (mitoplast fraction) were washed in 200 μL PBS and centrifuged (10,000 X g) for 15 min at 4°C. then solubilized in 25 μl 1X NativePAGE™ sample buffer (ThermoFisher, BN20032) supplemented with 10 μL 5% digitonin (ThermoFisher, BN20061). After incubation on ice for 15 min, samples were centrifuged (20,000 X g) for 30 min at 4°C. Samples (15 μl) were then resolved on 1.0 mm, 10 well NativePAGE 3–12% Bis-Tris Gels (ThermoFisher, BN2011BX10) with 1X NativePAGE running buffer (ThermoFisher, BN2001) according to the manufacturer’s instructions, at 4°C. The cathode buffer was supplemented with 0.02% (w/v) n-Dodecyl b-D-maltoside (Sigma, D4641) and 0.05% (w/v) sodium deoxycholate (Sigma, 30970). Following CN-PAGE, proteins were transferred to 0.2 μm PVDF membranes (Bio-Rad, 162–0174) using XCell SureLock™ Mini-Cell Electrophoresis System (ThermoFisher, EI0001) in buffer comprising 48mM Tris (Sigma, T1503), 39mM glycine (ThermoFisher, BP381–1), 0.05% (w/v) SDS (Sigma, L3771), 20% (v/v) methanol (ThermoFisher, A412–4), pH 8.3. The membrane was blocked in PBS, 0.1% Tween 20 with 5% skimmed milk powder and incubated with primary antibody for 1 hour at room temperature. Blots were incubated with the appropriate secondary antiserum for 1 hour at room temperature, treated with Pierce ECL Western Blotting Substrate (ThermoFisher, 32106) according to the manufacturer’s instructions, and visualized on ChemiDoc MP Imaging System (BioRad, 170–8280).
ATP/ADP Determination
To measure ATP and ADP, embryos were dechorionated in bleach for 2 min, washed in PBS containing 0.1% Triton X-100, and homogenized (10 embryos per sample) with a pestle in 12μL Assay Buffer (Sigma, MAK135A). Samples were then analyzed using ADP/ATP Ratio Assay Kit (Sigma, MAK135) according to manufacturer’s instructions. Luminescence was recorded using the Synergy H1 Microplate Reader (BioTek, BTH1M). Data were analyzed using paired t tests.
Extended Data
Extended Data Figure 1. FISH probes are specific for either D. yakuba or D. melanogaster mitochondrial DNA.
a. Schematics of the mitochondrial genome and the D loops of D. yakuba and D. melanogaster. In the schematic of the D loop of D. melanogaster the boxed regions denote 2 classes of repeated sequences. The open boxes are unique to D. melanogaster. The hatched boxes contain a 300 bp sequence, that is conserved in other Drosophilids46 and is depicted by solid bars above the repeats in D. melanogaster and by a single solid bar above the D. yakuba D loop. The FISH probes are directed against unique regions of the D loops; the D. yakuba specific probe is depicted as a green bar and the D. melanogaster specific probe is depicted as a magenta bar beneath the respective D loops. b-e. Confocal images of D. yakuba (b,e) and D. melanogaster (c,d) stage 7 egg chambers hybridized with D. yakuba specific probes (green; b,c) and D. melanogaster specific probes (magenta; d,e). All egg chambers were also hybridized with probes recognizing mtDNA of both species (middle panels; blue). The merged images are in the right panels. The D. yakuba probe hybridizes to D. yakuba mtDNA (b) but not D. melanogaster mtDNA (c). The D. melanogaster probe hybridizes to D. melanogaster mtDNA (d) but not D. yakuba mtDNA (e). f. Schematic illustrating the generation of heteroplasmic flies by the transfer of germ plasm that contains wildtype mitochondria (green) from Drosophila yakuba (D. yak) into Drosophila melanogaster (D. mel) embryos that are homoplasmic for mt:CoIts + mt:nd2del1 mutant mitochondria (magenta). g. Bar plots showing percentage of mutant and wildtype mtDNA, as assayed by qPCR, in adult female carcasses without ovaries from the original mutant D. melanogaster strain and the heteroplasmic line generated by pole plasm transplantation. The data are an average of 4 independent replicates. h-h” and i-i”. Ovarioles of flies heteroplasmic (Het) for D. melanogaster mt:Co1ts (mut) and D. yakuba (wt) genomes that were shifted to 18°C (permissive temperature) for 10 days or maintained at 29°C (restrictive temperature) hybridized with fluorescent probes that detect either wt D. yakuba (green) or mutant D. melanogaster (magenta) genomes. Selection against the mutant genome is observed in the germline when flies were raised at 29°C. Here and in all Extended Data figures the gray scale images are non-background subtracted and unnormalized.
Extended Data Figure 2. Selection against mutant mitochondrial DNA does not occur in the male germline.
Testes of heteroplasmic (Het) flies that were shifted to 18°C for 7 days (a and c) or maintained at 29°C (b and d) hybridized with fluorescent probes that detect either wt D. yakuba (green) or mutant D. melanogaster (magenta) genomes. The higher magnification images in c and d include the stem cells and spermatogonial cysts. Selection against mutant mtDNA is not observed in testes of flies raised at the restrictive temperature (29°C). e. Scatter plots showing percentage of mutant mtDNA, as assayed by qPCR, of adult ovaries and testes of heteroplasmic flies raised at 29°C, and of adult testes of heteroplasmic flies shifted to 18°C for 7 days. The mtDNA qPCR data throughout are presented as medians with interquartile range and compared by two-tailed unpaired t-tests. In Supplementary Table 2 for all data sets we also present 95% confidence intervals of the difference between the control and experimental means and the number of biologically independent samples used to derive the statistics. The dashed line denotes the % mutant mtDNA in whole adult female carcasses lacking ovaries. All testes are oriented with stem cell niche toward left.
Extended Data Figure 3. Selection manifests in germline cyst cells and does not occur when cyst formation is blocked.
Germaria of heteroplasmic females (Het), raised at 29°C, were hybridized with fluorescent probes that detect either wt D. yakuba or mutant D. melanogaster mtDNA, and reacted with anti-Vasa antisera to mark the germline (a-a”’) or anti-Hts (1B1) antisera to mark the fusome and somatic cells (b-b”’). The dashed outlines delineate the germline in a, individual, developing cysts in the germarium, and egg chambers each surrounded by somatic follicle cells in b. wt mtDNA (arrows) can first be strongly detected in cysts. c-c”’. A germarium of a heteroplasmic fly (Het), raised at 29°C, in which cyst formation was blocked by expression of an RNAi against bag-of-marbles (Bam; UAS.bam shRNA TRiP.HMJ22155) in the germline under the control of nos-GAL4. The germarium was hybridized with fluorescent probes directed against wt (c and c”’) and mutant mtDNAs (c’ and c”’) and reacted with anti-Vasa antisera to mark the germline (c”). No increase in wt mtDNA is observed. d-d”’. A germarium of a heteroplasmic fly, raised at 29°C, hybridized with fluorescent probes that detect either wt D. yakuba mtDNA (d and d”’) or mutant D. melanogaster mtDNA (d’ and d”’), and reacted with anti-Orb antisera (d”, blue in d”’) to demarcate all cells of the developing cysts and the oocyte in later egg chambers. Arrows in d and d”’ point to wt mtDNA, and dashed outlines delineate cysts in the germarium and germline in the egg chambers. e. Scatter plots showing the relative amounts of wt D. yakuba and mutant D. melanogaster mtDNA, as assayed by FISH, in cysts and egg chambers (EC) compared to the amount in stem cells (SC). f. Scatter plot showing percentage of mutant mtDNA, as assayed by qPCR, of control (Ctrl; nos-GAL4 driving UAS.mCherry RNAi) heteroplasmic ovaries and of heteroplasmic ovaries in which cyst formation was blocked by the knock down of Bam (Bam KD). Here and in all images below, ovarioles are oriented with stem cell niche towards left.
Extended Data Figure 4. Expression of the Ciona intestinalis Alternative Oxidase (AOX) rescues mutant mitochondria.
a. In wildtype mitochondria the electron transport chain complexes (I-IV) that reside in the inner mitochondrial membrane couple the transfer of electrons with the transfer of protons across the membrane. The resulting proton motive force drives the synthesis of ATP by complex V. b. At the restrictive temperature the CoIts mutation blocks the transfer of electrons through complex IV (cytochrome oxidase, purple) resulting in the absence of both the generation of a proton motive force and ATP production. c. AOX (yellow) catalyzes the transfer of electrons from ubiquinone to molecular oxygen bypassing complexes III and IV. This restores the transfer of protons at complex I and the generation of ATP. d. Scatter plot of the amount of mutant D. melanogaster (purple) and wildtype D. yakuba (green) mtDNA, as assayed by qPCR, in ovaries expressing AOX under control of nos-GAL4 normalized to the amount of mutant and wildtype mtDNA in control ovaries (Ctrl) expressing cherry RNAi. Expression of AOX rescues the mutant genomes.
Extended Data Figure 5. Mitochondrial fragmentation is necessary for germline mitochondrial DNA selection.
a-c. Stills of live images illustrating the effect that overexpressing Mitofusin (b) or knocking down Drp1 (c) in the germline has on the morphology of mitochondria compared to controls (a, nos-GAL4 driving UAS mCherry RNAi; the stills in Fig 2c,d are higher magnifications of this image.) When Mitofusin is overexpressed (nos-GAL4 driving UAS.marf47), or when Drp1 is knocked down (nos-GAL4 driving UAS-Drp1.miRNA.CDS48), the mitochondria in the cysts are no longer discrete as they are in control cysts. The mitochondria (white) were labeled with a mitochondrially targeted eYFP and cell membranes (blue) with CellMask™ Deep Red Plasma membrane Stain. Stem cells and cysts are outlined in red. d-d”. Germarium of a control heteroplasmic female (nos-GAL4 driving UAS.mCherry RNAi), raised at 29°C, hybridized with fluorescent probes that detect either wt D. yakuba mtDNA (greyscale in d; green in d”) or mutant D. melanogaster mtDNA (greyscale in d’; magenta in d”). Selection for wt mtDNA is observed as indicated by the arrows in d and d”. e and f. Selection for wt mtDNA is no longer observed when Mitofusin (Mfn) is overexpressed (nos-GAL4 driving UAS.marf) or when Drp1 is knocked down (nos-GAL4 driving UAS-Drp1.miRNA.CDS). wt D. yakuba mtDNA: greyscale in e,f green in e”,f”; mutant D. melanogaster mtDNA: greyscale in e’,f’ magenta in e”,f”. The dashed outlines delineate the germline g. Scatter plot showing the percentage of mutant D. melanogaster mtDNA, as assayed by qPCR, in carcasses (carc.) and ovaries of heteroplasmic flies in which the wildtype mtDNA was either from D. yakuba or D. melanogaster. mCherry RNAi was expressed in the ovaries under control of nos-GAL4. h. Scatter plot of the amount of mutant D. melanogaster (purple) and wildtype D. yakuba (green) mtDNA, as assayed by qPCR, of young embryos laid by heteroplasmic females in which Mitofusin was overexpressed in the germline (Mfn OE) normalized to the amount of mutant and wildtype mtDNA in young embryos laid by control heteroplasmic females (Ctrl; nos-GAL4 driving UAS.mCherry RNAi). i. Same as g, except analysis was performed on ovaries in which both wildtype and mutant mtDNAs were from D. melanogaster. Mitofusin overexpression increases the levels of mutant mtDNA.
Extended Data Figure 6. Mitochondrial fragmentation is sufficient for germline mitochondrial DNA selection.
a and b. Stills of live images illustrating the effect that knocking down Mitofusin in the germline (b) has on the morphology of mitochondria compared to controls (a). When Mitofusin is knocked down (nos-GAL4 driving UAS.mfn shRNA2 TRiP.HMC0388332) the mitochondria in the stem cells are fragmented. The mitochondria (white) were labeled with a mitochondrially targeted eYFP and cell membranes (blue) with CellMask™ Deep Red Plasma membrane Stain. Stem cells and cysts are outlined in red. c. The knockdown of Mitofusin in the germline by expressing Mitofusin RNAi (nos-GAL4 driving UAS.mfn shRNA2 TRiP.HMC03883) results in selection for wt mtDNA (green) occurring in stem cells. The germarium was also reacted with anti-Vasa antiserum (c”) to mark the germline and delineate the stem cells and cysts. wt D. yakuba mtDNA: greyscale in c, green in c”; mutant D. melanogaster mtDNA: greyscale in c’, magenta in c”’. Mutant mtDNA is readily detected in the soma but not in the germline. d. Scatter plot comparing the percentage of mutant mtDNA, as assayed by qPCR, of ovaries in which Mitofusin was weakly knocked down in the germline (Mfn KD; nos-GAL4 driving UAS.mfn long hairpin RNA1 TRiP.JF0165049) and of ovaries in which Drp1 was overexpressed in the germline (Drp1 OE; nos-GAL4 driving UAS-Drp1.miRNA.CDS). The percent of mutant mtDNA in each case was normalized to the percent mutant mtDNA in control ovaries to illustrate that overexpressing Drp1 enhances selection to a similar extent as does weakly knocking down Mitofusin. e. Scatter plot of the amount of mutant D. melanogaster (purple) and wildtype D. yakuba (green) mtDNA, as assayed by qPCR, in ovaries in which Mitofusin was weakly knocked down or in which Drp1 was overexpressed in the germline normalized to the amount of mutant and wildtype mtDNA in control ovaries (Ctrl) expressing cherry RNAi in the germline. Knocking down Mitofusin or overexpressing Drp1 results in a decrease in mutant mtDNA. f-h. The effect of germ line overexpression of Mitofusin (Mfn) and Drp1 on copy number (f), ATP levels (g), and mitochondrial motility (h) in homoplasmic wildtype D. melanogaster ovaries (also see Supplementary Note 1). f. Scatter plot of the amount of mtDNA, as assayed by qPCR, in homoplasmic ovaries in which Mfn or Drp1 were overexpressed in the germ line, normalized to the amount of mtDNA in control ovaries (Ctrl; nos-GAL4 driving UAS.mCherry RNAi). g. Scatter plot of the amount of ATP in homoplasmic ovaries overexpressing Mfn or Drp1 in the germ line under control of Maternal α-Tubulin Gal4 normalized to the amount of ATP in control ovaries (Ctrl; Maternal α-Tubulin Gal4 driving UAS.mCherry RNAi). h. Scatter plot of mitochondrial motility in homoplasmic ovaries overexpressing Mfn or Drp1 in the germ line. Motility was assessed by measuring mean mitochondrial displacement using live confocal microscopy and Imaris analysis software.
Extended Data Figure 7. Mitofusin is down-regulated in germline cysts.
a-a”’. A germarium of a female expressing HA-tagged Mitofusin (Mfn), under control of the Mitofusin promoter (Marf-gHA48), and mitochondrially target eYFP (mito-eYFP50), was reacted with anti-HA antisera to detect Mitofusin (a), anti-GFP antisera to detect mitochondria (a’) and anti-Vasa antisera to delineate the germline (a”). In a”’ the ratio of the levels of Mitofusin to mito-eYFP is presented in pseudocolor. The colors correspond to the ratios indicated on the pseudocolor bar. The dashed red circles outline the cysts and the dashed white circles demarcate the germline in the egg chambers. b. Scheme for quantifying the levels of mitofusin RNA at different time points during early oogenesis. Females mutant for the differentiation factor Bam, which is required for cyst formation, and carrying a rescuing transgene expressing Bam under control of a heat shock promoter were heat shocked at 37°C for 2 hrs, and then allowed to recover for the indicated times. This allows for the isolation of ovaries that contain staged cysts, predominantly at 2, 4 or 8 cell cyst stage. The morphology of the spectrosome and fusome as revealed by staining with anti-Hts (1B1) antisera was used to confirm the staging. RNA for RT-qPCR was isolated from ovaries from flies prior to heat shock and at the indicated times following heat shock.
Extended Data Figure 8. The down-regulation of Mitofusin in cysts is not mediated by known regulators of Mitofusin protein.
Germaria of females expressing HA-tagged Mitofusin (Mfn), under control of the Mitofusin promoter (Marf-gHA48) reacted with anti-HA antisera to detect Mitofusin (grayscale in a-h, magenta in a”-h”) and anti-Vasa antibody to delineate the germline (grayscale in a’-h’, blue in a”-h”). The indicated known regulators of Mitofusin protein levels were knocked down in the germline using RNAi under control of nos-GAL4. The numbers in parentheses are BDSC stock numbers. All ovarioles are oriented with stem cell niche towards left.
Extended Data Figure 9. Inhibiting mitochondrial fragmentation blocks the decrease in proton motive force and ATP levels in cysts of heteroplasmic flies.
a-d. Germaria of heteroplasmic control flies (a,c; w1118) and heteroplasmic flies in which Mitofusin was overexpressed in the germline (b,d; nos-GAL4 driving UAS.marf47), reacted with TMRM to visualize mitochondrial membrane potential (pseudocolored in a,b) or with antibodies to phosphorylated pyruvate dehydrogenase (PDH P, purple) and pyruvate dehydrogenase (PDH, green) to measure ATP levels (c,d). e. Diagram showing the essential glutamate at position 121 in c-ring subunits that acts as the proton donor and acceptor in the proton translocation pathway. In the dominant negative c-ring (CV-DN) this glutamate was mutated to a glutamine, which can no longer bind the protons. f. Scatter plot illustrating the reduction in ATP/ADP ratio in embryos laid by mothers expressing CV-DN in the germ line under control of Maternal α-Tubulin Gal4. The ratios were measured using an ADP/ATP Ratio Assay Kit (Abcam ab65313). Data were analyzed using paired t tests. g. Blue Native Polyacrylamide Gel illustrating that expression of the dominant negative inhibitor of complex V (CV-DN) does not disrupt the Complex V dimer. For gel source data, see Supplementary Figure 1.
Extended Data Figure 10. The mitophagy proteins Atg1 and BNIP3 are necessary for germline mitochondrial DNA selection.
Germaria of a control heteroplasmic female (a-a”; nos-GAL4 driving UAS.mCherry RNAi) and of heteroplasmic females in which Atg1 (b-b”), Atg8 (c-c”) or BNIP3 (d-d”) were knocked down in the germ line, raised at 29°C, hybridized with fluorescent probes that detect either wt D. yakuba mtDNA (greyscale in a-d, green in a”-d”) or mutant D. melanogaster mtDNA (greyscale in a’-d’, magenta in a”-d”). The dashed circles demarcate the germline in the early egg chambers. The arrows point to wildtype mtDNA. e and f. Scatter plots showing percentage of mutant mtDNA and the amount of mutant (magenta) and wildtype (green) mtDNA, as assayed by qPCR, of control heteroplasmic ovaries (Ctrl) and of ovaries in which Atg1was knocked down in the germline (Atg1 KD). In the left panel in f the amount of mutant and wildtype mtDNA of heteroplasmic ovaries overexpressing Mitofusin (Mfn OE) is plotted to illustrate that overexpressing Mitofusin primarily inhibits selection by increasing the amount of mutant mtDNA while knocking down Atg1 primarily inhibits selection by decreasing the amount of wildtype mtDNA. The control and Mitofusin overexpression data is the same as that presented in Extended Data Fig. 5h. All the dissections and analyses were carried out at the same time. The right panel of f is a zoomed in view to illustrate the affect knocking down Atg1 has on the level of wildtype mtDNA. In e and f both wildtype and mutant mtDNAs were from D. melanogaster.
Supplementary Material
Acknowledgements
We thank Jongkyeong Chung, Ming Guo, Patrick O’Farrell, Howard Jacobs, Hansong Ma, the Drosophila Species Stock Center, the Bloomington Drosophila Stock Center and the Vienna Drosophila Stock Center for fly stocks, members of the Lehmann lab and Kimberly Lau for discussions, Yusuff Abdu, Lacy Barton, Allison Blum, Steve Burden, Simon Kidd, Mike Murphy, Angus McQuibban and Daria Siekhaus for comments on the manuscript and Agnel Sfeir for experimental suggestions to address reviewers’ comments. This work was supported by Canadian Institutes of Health Research grant FRN 159510 to TRH and by NIH grant R37HD41900 to RL. TRH is part of the UofT Medicine by Design initiative, which receives funding from CFREF. RL is an HHMI investigator.
Footnotes
Data Availability Statement
Source data for all graphs are provided with the paper. The Cp values associated with each primer pair and DNA, and confocal image data are available upon request.
References
- 1.Fan W et al. A mouse model of mitochondrial disease reveals germline selection against severe mtDNA mutations. Science 319, 958–962 (2008). [DOI] [PMC free article] [PubMed] [Google Scholar]
- 2.Stewart JB et al. Strong purifying selection in transmission of mammalian mitochondrial DNA. PLoS Biol. 6, e10 (2008). [DOI] [PMC free article] [PubMed] [Google Scholar]
- 3.Hill JH, Chen Z & Xu H Selective propagation of functional mitochondrial DNA during oogenesis restricts the transmission of a deleterious mitochondrial variant. Nat Genet 46, 389–392 (2014). [DOI] [PMC free article] [PubMed] [Google Scholar]
- 4.Floros VI et al. Segregation of mitochondrial DNA heteroplasmy through a developmental genetic bottleneck in human embryos. Nature Cell Biology 20, 144–151 (2018). [DOI] [PMC free article] [PubMed] [Google Scholar]
- 5.Ma H, Xu H & O’Farrell PH Transmission of mitochondrial mutations and action of purifying selection in Drosophila melanogaster. Nat Genet 46, 393–397 (2014). [DOI] [PMC free article] [PubMed] [Google Scholar]
- 6.Palozzi JM, Jeedigunta SP & Hurd TR Mitochondrial DNA Purifying Selection in Mammals and Invertebrates. J. Mol. Biol 430, 4834–4848 (2018). [DOI] [PubMed] [Google Scholar]
- 7.Chen Z et al. Genetic mosaic analysis of a deleterious mitochondrial DNA mutation in Drosophila reveals novel aspects of mitochondrial regulation and function. Mol. Biol. Cell 26, 674–684 (2015). [DOI] [PMC free article] [PubMed] [Google Scholar]
- 8.Ma H & O’Farrell PH Selfish drive can trump function when animal mitochondrial genomes compete. Nat Genet 48, 798–802 (2016). [DOI] [PMC free article] [PubMed] [Google Scholar]
- 9.Pepling ME & Spradling AC Mouse ovarian germ cell cysts undergo programmed breakdown to form primordial follicles. Dev Biol 234, 339–351 (2001). [DOI] [PubMed] [Google Scholar]
- 10.Fernandez-Ayala DJM et al. Expression of the Ciona intestinalis alternative oxidase (AOX) in Drosophila complements defects in mitochondrial oxidative phosphorylation. Cell Metabolism 9, 449–460 (2009). [DOI] [PubMed] [Google Scholar]
- 11.Zhang Y et al. PINK1 Inhibits Local Protein Synthesis to Limit Transmission of Deleterious Mitochondrial DNA Mutations. Mol Cell 1–17 (2019). doi: 10.1016/j.molcel.2019.01.013 [DOI] [PMC free article] [PubMed] [Google Scholar]
- 12.Cox RT & Spradling AC A Balbiani body and the fusome mediate mitochondrial inheritance during Drosophila oogenesis. Development 130, 1579–1590 (2003). [DOI] [PubMed] [Google Scholar]
- 13.Hwa JJ, Hiller MA, Fuller MT & Santel A Differential expression of the Drosophila mitofusin genes fuzzy onions (fzo) and dmfn. Mech Dev 116, 213–216 (2002). [DOI] [PubMed] [Google Scholar]
- 14.Bleazard W et al. The dynamin-related GTPase Dnm1 regulates mitochondrial fission in yeast. Nature Cell Biology 1, 298–304 (1999). [DOI] [PMC free article] [PubMed] [Google Scholar]
- 15.Pickrell AM et al. Endogenous Parkin Preserves Dopaminergic Substantia Nigral Neurons following Mitochondrial DNA Mutagenic Stress. Neuron 87, 371–381 (2015). [DOI] [PMC free article] [PubMed] [Google Scholar]
- 16.Kandul NP, Zhang T, Hay BA & Guo M Selective removal of deletion-bearing mitochondrial DNA in heteroplasmic Drosophila. Nat Commun 7, 13100 (2016). [DOI] [PMC free article] [PubMed] [Google Scholar]
- 17.Tanaka A et al. Proteasome and p97 mediate mitophagy and degradation of mitofusins induced by Parkin. J Cell Biol 191, 1367–1380 (2010). [DOI] [PMC free article] [PubMed] [Google Scholar]
- 18.Yun J et al. MUL1 acts in parallel to the PINK1/parkin pathway in regulating mitofusin and compensates for loss of PINK1/parkin. eLIFE 3, e01958 (2014). [DOI] [PMC free article] [PubMed] [Google Scholar]
- 19.Lefebvre V et al. Genome-wide RNAi screen identifies ATPase inhibitory factor 1 (ATPIF1) as essential for PARK2 recruitment and mitophagy. Autophagy 9, 1770–1779 (2013). [DOI] [PubMed] [Google Scholar]
- 20.Buzhynskyy N, Sens P, Prima V, Sturgis JN & Scheuring S Rows of ATP synthase dimers in native mitochondrial inner membranes. Biophys. J 93, 2870–2876 (2007). [DOI] [PMC free article] [PubMed] [Google Scholar]
- 21.Pickles S, Vigié P & Youle RJ Mitophagy and Quality Control Mechanisms in Mitochondrial Maintenance. Curr Biol 28, R170–R185 (2018). [DOI] [PMC free article] [PubMed] [Google Scholar]
- 22.Zhang J et al. Mitochondrial clearance is regulated by Atg7-dependent and independent mechanisms during reticulocyte maturation. Blood 1–9 (2009). doi: 10.1182/blood-2008-04-151639 [DOI] [PMC free article] [PubMed] [Google Scholar]
- 23.Zhang J et al. A short linear motif in BNIP3L (NIX) mediates mitochondrial clearance in reticulocytes. Autophagy 8, 1325–1332 (2014). [DOI] [PMC free article] [PubMed] [Google Scholar]
- 24.Villa E, Marchetti S & Ricci J-E No Parkin Zone: Mitophagy without Parkin. Trends in Cell Biology 28, 882–895 (2018). [DOI] [PubMed] [Google Scholar]
- 25.Schweers RL et al. NIX is required for programmed mitochondrial clearance during reticulocyte maturation. Proceedings of the National Academy of Sciences 104, 19500–19505 (2007). [DOI] [PMC free article] [PubMed] [Google Scholar]
- 26.Hsu H-J & Drummond-Barbosa D A visual screen for diet-regulated proteins in the Drosophila ovary using GFP protein trap lines. Brain Res Gene Expr Patterns 23–24, 13–21 (2017). [DOI] [PMC free article] [PubMed] [Google Scholar]
- 27.Chan DC Fusion and fission: interlinked processes critical for mitochondrial health. Annu. Rev. Genet 46, 265–287 (2012). [DOI] [PubMed] [Google Scholar]
- 28.Mitra K, Wunder C, Roysam B, Lin G & Lippincott-Schwartz J A hyperfused mitochondrial state achieved at G1-S regulates cyclin E buildup and entry into S phase. Proceedings of the National Academy of Sciences 106, 11960–11965 (2009). [DOI] [PMC free article] [PubMed] [Google Scholar]
- 29.Teixeira FK et al. ATP synthase promotes germ cell differentiation independent of oxidative phosphorylation. Nature Cell Biology 17, 689–696 (2015). [DOI] [PMC free article] [PubMed] [Google Scholar]
- 30.Rana A et al. Promoting Drp1-mediated mitochondrial fission in midlife prolongs healthy lifespan of Drosophila melanogaster. Nat Commun 8, 1–14 (2017). [DOI] [PMC free article] [PubMed] [Google Scholar]
- 31.Lin Y-F et al. Maintenance and propagation of a deleterious mitochondrial genome by the mitochondrial unfolded protein response. Nature 533, 416–419 (2016). [DOI] [PMC free article] [PubMed] [Google Scholar]
Method References
- 32.Ni J-Q et al. A genome-scale shRNA resource for transgenic RNAi in Drosophila. Nat Meth 8, 405–407 (2011). [DOI] [PMC free article] [PubMed] [Google Scholar]
- 33.Markstein M, Pitsouli C, Villalta C, Celniker SE & Perrimon N Exploiting position effects and the gypsy retrovirus insulator to engineer precisely expressed transgenes. Nat Genet 40, 476–483 (2008). [DOI] [PMC free article] [PubMed] [Google Scholar]
- 34.Matsuura ET, Chigusa SI & Niki Y Induction of mitochondrial DNA heteroplasmy by intra- and interspecific transplantation of germ plasm in Drosophila. Genetics 122, 663–667 (1989). [DOI] [PMC free article] [PubMed] [Google Scholar]
- 35.Hurd TR et al. Long Oskar Controls Mitochondrial Inheritance in Drosophila melanogaster. Dev Cell 39, 560–571 (2016). [DOI] [PMC free article] [PubMed] [Google Scholar]
- 36.McKim KS, Joyce EF & Jang JK in Methods in Molecular Biology 558, 197–216 (Humana Press, 2009). [DOI] [PubMed] [Google Scholar]
- 37.Long X, Colonell J, Wong AM, Singer RH & Lionnet T Quantitative mRNA imaging throughout the entire Drosophila brain. Nat Meth 14, 703–706 (2017). [DOI] [PubMed] [Google Scholar]
- 38.Schindelin J et al. Fiji: an open-source platform for biological-image analysis. Nat Meth 9, 676–682 (2012). [DOI] [PMC free article] [PubMed] [Google Scholar]
- 39.Zaccai M & Lipshitz HD Differential distributions of two adducin-like protein isoforms in the Drosophila ovary and early embryo. Zygote 4, 159–166 (1996). [DOI] [PubMed] [Google Scholar]
- 40.Lantz V, Chang JS, Horabin JI, Bopp D & Schedl P The Drosophila orb RNA-binding protein is required for the formation of the egg chamber and establishment of polarity. Genes Dev 8, 598–613 (1994). [DOI] [PubMed] [Google Scholar]
- 41.Gloor GB et al. Type I repressors of P element mobility. Genetics 135, 81–95 (1993). [DOI] [PMC free article] [PubMed] [Google Scholar]
- 42.Celniker SE et al. Unlocking the secrets of the genome. Nature 459, 927–930 (2009). [DOI] [PMC free article] [PubMed] [Google Scholar]
- 43.Gomes LC, Di Benedetto G & Scorrano L During autophagy mitochondria elongate, are spared from degradation and sustain cell viability. Nature Cell Biology 13, 589–598 (2011). [DOI] [PMC free article] [PubMed] [Google Scholar]
- 44.Mariotti FR, Corrado M & Campello S Following mitochondria dynamism: confocal analysis of the organelle morphology. Methods Mol. Biol 1241, 153–161 (2015). [DOI] [PubMed] [Google Scholar]
- 45.Wittig I & Schägger H Advantages and limitations of clear-native PAGE. Proteomics 5, 4338–4346 (2005). [DOI] [PubMed] [Google Scholar]
- 46.Lewis DL, Farr CL, Farquhar AL & Kaguni LS Sequence, organization, and evolution of the A+T region of Drosophila melanogaster mitochondrial DNA. Mol. Biol. Evol 11, 523–538 (1994). [DOI] [PubMed] [Google Scholar]
- 47.Park J et al. Drosophila Porin/VDAC affects mitochondrial morphology. PLoS ONE 5, e13151 (2010). [DOI] [PMC free article] [PubMed] [Google Scholar]
- 48.Sandoval H et al. Mitochondrial fusion but not fission regulates larval growth and synaptic development through steroid hormone production. eLIFE 3, e03558 (2014). [DOI] [PMC free article] [PubMed] [Google Scholar]
- 49.Ni J-Q et al. Vector and parameters for targeted transgenic RNA interference in Drosophila melanogaster. Nat Meth 5, 49–51 (2008). [DOI] [PMC free article] [PubMed] [Google Scholar]
- 50.LaJeunesse DR et al. Three new Drosophila markers of intracellular membranes. BioTechniques 36, 784–8–790 (2004). [DOI] [PubMed] [Google Scholar]
Associated Data
This section collects any data citations, data availability statements, or supplementary materials included in this article.


