

Abstract
Background
It is well known that white matter injuries observed at birth are associated with adverse neurodevelopmental outcomes later in life. Whether white matter developmental variations in healthy newborns are also associated with changes in later neurodevelopment remains to be established.
Purpose
To evaluate whether developmental variations of white matter microstructures identified by MRI correlate with neurodevelopmental outcomes in healthy full-term infants.
Materials and Methods
In this prospective study, pregnant women were recruited and their healthy full-term newborns underwent a brain MRI including diffusion tensor imaging at approximately 2 weeks of age. These infants were tested at approximately 2 years of age with the Bayley Scales of Infant Development (BSID). Voxel-wise correlation analyses of fractional anisotropy (FA), measured with diffusion tensor MRI, and neurodevelopmental test scores, measured by using BSID, were performed by using tract-based spatial statistics (TBSS), followed by region-of-interest (ROI) analyses of correlations between mean FA in selected white matter ROIs and each BSID subscale score.
Results
Thirty-eight full-term infants (20 boys, 18 girls) underwent MRI examination at 2 weeks of age (14.3 days ± 1.6) and BSID measurement at 2 years of age (732 days ± 6). TBSS analyses showed widespread clusters in major white matter tracts, with positive correlations (P ≤ .05, corrected for the voxel-wise multiple comparisons) between FA values and multiple BSID subscale scores. These correlations were largely independent of several demographic parameters as well as family environment. Gestational age at birth appeared to be a confounding factor as TBSS-observed correlations weakened when it was included as a covariate; however, after controlling for gestational age at birth, ROI analyses still showed positive correlations (P ≤ .05, R = 0.35 to 0.48) between mean FA in many white matter ROIs and BSID cognitive, language, and motor scores.
Conclusion
There were significant associations between white matter microstructure developmental variations in healthy full-term newborns and their neurodevelopmental outcomes.
© RSNA, 2019
Online supplemental material is available for this article.
See also the editorial by Hu and McAllister in this issue.
Summary
Measurement of fractional anisotropy using diffusion tensor MRI in multiple white matter regions of healthy full-term newborns correlated with neurodevelopmental outcomes of these infants at age 2 years in our study, independent of potential prenatal and postnatal confounders.
Key Points
■ Higher white matter integrity (as reflected by higher fractional anisotropy values on diffusion MRI) at newborn age correlated with better neurodevelopment (as reflected by higher Bayley Scales of Infant Development scores) at age 2 years in our study.
■ Significant correlations with fractional anisotropy (controlled for confounding effects of gestational age at birth) were found in seven brain white matter tracts for cognitive subscores (P = .004–.05; correlation coefficient R = 0.35–0.48), five white matter tracts for language subscores (P = .01–.04; R = 0.36–0.44), and two white matter tracts for motor subscores (P = .03–.04; R = 0.38–0.40).
Introduction
Healthy neurodevelopment in children requires adequate early brain white matter integrity. Two main processes involved in white matter development include establishment of connections between brain regions to form functional networks and myelination of these connections to facilitate efficient neural signal transfer. The former is mostly completed by the end of normal gestation, and the latter starts at approximately the early third trimester of gestation and develops rapidly during early infancy (1). At birth, all major white matter tracts are formed and are similar in organization to the white matter in older infants, despite differences in water diffusion anisotropy values (2,3) mostly due to myelination. It is well known that white matter injuries at birth (or at term-equivalent age) for newborns with medical conditions, such as those born preterm (4), with congenital heart diseases (5), or with hypoxic-ischemic encephalopathy (6), are associated with deficits in neurodevelopmental outcomes. Nevertheless, it is not as clear whether there are similar associations between variations in white matter developmental status in healthy newborns and long-term neurodevelopmental outcomes. A few recent publications revealed relationships between white matter development and cognitive functions in healthy children. The developmental trajectory of whole brain myelin volume fraction in children between age 3 months and 4 years showed significant associations with receptive and expressive language scales (7), while children with above-average ability (reflected in the early learning composite measured using the Mullen Scales of Early Learning) showed differential trajectories of myelin development compared with children with average and below average ability (8), and a common underlying factor in multiple white matter tracts observed in healthy newborns showed significant correlations with early learning composite at age 1 year (9). These findings suggest that the relationships between early white matter development and later neurodevelopmental measures do exist in healthy children, but more studies are needed to clarify this connection.
Diffusion imaging has a high sensitivity for studying normal white matter development and identifying white matter injury in young infants. Changes in parameters measured by diffusion tensor MRI, such as increase of fractional anisotropy (FA), a putative marker of white matter integrity, are reflective of rapid brain development during infancy (10). Using diffusion tensor MRI in previous studies, we detected subtle effects on white matter not visible using standard neonatal MRI protocols (including T1-weighted, T2-weighted, inversion recovery, and fluid-attenuated inversion recovery sequences), such as microstructural changes associated with different ventilation settings and minor brain hemorrhage in extremely low birth-weight infants (11,12). Using different analyses on the diffusion imaging data from this cohort, we also detected developmental variations associated with gestational age at birth (within the term window) and prenatal environment (such as maternal obesity) in healthy term infants (13,14). What remains to be determined is whether these brain differences observed during infancy, especially for the healthy population, translate to changes in neurodevelopmental outcomes later in life.
We hypothesized that there would be significant correlations between early MRI measurement of white matter integrity and later neurodevelopment in healthy infants, indicating that early white matter indexes are predictive of later outcomes even for the healthy population. The purpose of this study was to evaluate whether developmental variations of white matter microstructures identified by MRI correlate with neurodevelopmental outcomes in healthy full-term infants. To test our hypothesis, we used a well-characterized cohort of pregnant women and their healthy full-term infants to study the relationship between diffusion tensor MRI parameters at approximately 2 weeks of age and neurodevelopment measured by Bayley Scales of Infant Development (BSID) at 2 years of age.
Materials and Methods
Study Participants
From 2012 to 2015, pregnant women were prospectively and consecutively recruited for this neuroimaging-neurodevelopment study from the GLOWING (ClinicalTrials.gov identifier: NCT01131117), a study funded by the U.S. Department of Agriculture research cohort at the Arkansas Children’s Nutrition Center. The institutional review board at the University of Arkansas for Medical Sciences approved our study protocol and all participants (pregnant women) provided written consent. Inclusion criteria for the pregnant women included second parity, singleton pregnancy, age of 21 years or older, conception without assisted fertility treatments, and prepregnancy body mass index of 18.5–35. Exclusion criteria for the pregnant women included pre-existing medical conditions that can potentially (as determined by the research team) influence offspring health (eg, diabetes mellitus, hypertension, malignancies, seizure disorder, systemic lupus erythematosus, drug or alcohol abuse, serious psychiatric disorders), sexually transmitted diseases, medical complications during pregnancy (eg, gestational diabetes, pre-eclampsia), medications during pregnancy known to influence fetal growth (eg, thyroid hormone, glucocorticoids, insulin, oral hypoglycemic agents), and smoking and/or alcohol consumption during pregnancy. In addition to standard demographic information, the IQs of all pregnant women (except one) were assessed by using the Wechsler Abbreviated Scale of Intelligence, and body composition (fat mass percentage) was measured using air displacement plethysmography in addition to body mass index, both measured at the first study visit (≤ 10 weeks of gestation).
Inclusion criteria for the infants included being healthy, having no medical issues at birth, and birth at 37 weeks of gestation or later. Exclusion criteria for the infants included having current or past medical conditions or medication known to influence growth and development and being unable to complete a brain MRI at 2 weeks of age without sedation.
In total, 46 pregnant women were enrolled from the GLOWING study, 44 of their infants had an MRI examination at age 2 weeks, and 38 of these infants (20 male, 18 female) returned for neurodevelopmental assessments at age 2 years with at least one component of the BSID third edition (hereafter, BSID-III) tested with valid data. A flowchart of the study cohort is included in Figure 1; additional information about the larger GLOWING cohort (from which the participants of this study were recruited) is in Appendix E1, Fig E1 (online).
Figure 1:

Flow diagram of the study cohort. BSID = Bayley Scales of Infant Development.
MRI Data Acquisition
All infants underwent an MRI examination during natural sleep without sedation at 2 weeks of age at Arkansas Children’s Hospital. The MRI data were acquired using a 1.5-T Achieva scanner (Philips Healthcare, Best, the Netherlands) with an eight-channel sensitivity-encoding head coil. Infants were fed approximately 30 minutes before the scan and wrapped in a MedVac infant immobilizer (CFI Medical Solutions, Fenton, Mich). Mini muffs and an additional headphone were used to block the noise from the scanner, a pulse oximeter probe was used to monitor oxygen saturation and heart rate, and an MRI-compatible camera was used to monitor the infants during the scan. Pulse sequences included diffusion-weighted, susceptibility-weighted, and three-dimensional T1-weighted sequences to evaluate for incidental findings and to potentially exclude apparent brain abnormalities, as well as a single-shot spin-echo echo-planar imaging sequence with 180 mm × 180 mm field of view, 90 × 90 acquisition matrix, 3-mm section thickness, 30–36 continuous axial sections, shortest repetition time of 4200 msec, echo time of 66 msec, diffusion-weighting gradients in 15 uniformly distributed directions, and a maximum b value of 700 sec/mm2 to acquire diffusion tensor MRI data.
MRI Data Analysis
Regular MRI data were sent to the hospital picture archiving and communication system (PACS) for screening for incidental findings. One radiologist (C.M.G., R.H.R., or A.C.R., with 30, 10, and 5 years of experience, respectively, in neuroradiology) blinded to clinical data other than basic participant information displayed on PACS reviewed each scan independently soon after the scan to ensure there were no clinically diagnosable incidental findings. Variability was not measured for the screening. Diffusion-weighted images were exported to a workstation with the open-source FMRIB Software Library (FSL Version 5.0, created by the Oxford Center for Functional MRI of the Brain, Oxford, UK) installed on a VMware Linux virtual machine (VMware, Palo Alto, Calif) for postprocessing. Eigenvalues for the diffusion tensors were computed and diffusion tensor MRI parameter maps were generated using the FDT toolbox in FSL. Tract-based spatial statistics (TBSS) methods were used for analysis of diffusion tensor MRI data. We described these details in previous publications (11,13,14). Briefly, the FA maps were preprocessed and aligned to identify the most representative to serve as the target for nonlinear registration. All FA maps were then registered to the template target and skeletonized to illustrate major white matter tracts (FA > 0.1) for further statistical analysis. The randomization program in FSL was used to perform voxel-wise correlation analysis of FA values in the brain white matter measured at age 2 weeks with BSID scores measured at age 2 years. In addition, white matter regions of interest (ROIs) showing clusters on TBSS analysis with significant correlations were sketched based solely on anatomy of the whole region, and the mean FA values for each ROI were correlated with neurodevelopmental test scores as well. All ROI analyses were performed using the commercially available MATLAB software (Version R2017b; Mathworks, Natick, Mass).
Neurodevelopmental Outcomes Measurements
The BSID-III was administered to the infants at age 2 years at Arkansas Children’s Nutrition Center by a licensed psychological examiner (with more than 5 years of experience) supervised by a pediatric psychologist (B.J.B., with approximately 30 years of experience). A detailed explanation of BSID-III, including reliability and reproducibility, is included in Appendix E1 (online). The BSID-III included five subscores: cognitive, language, and motor scales based on observation of the infants, and socioemotional and adaptive behavior scales based on questionnaires completed by the parents. Cognitive scales evaluated visual preference, attention, memory, sensorimotor skills, exploration and manipulation, and concept formation; language scales evaluated receptive and expressive language; motor scales evaluated fine and gross motor skills; socioemotional scales evaluated communicating needs and self-regulation using emotional signals; and adaptive behavior scales evaluated communication, self-care, and self-direction.
Statistical Analysis
The assumption of normality and potential outliers were checked for each outcome of study. Correlation analyses were used to examine the associations between the FA values and the outcomes. For the voxel-wise correlation analysis of FA values and BSID scores, randomizations with the threshold-free cluster enhancement (TFCE) option and 5000 permutations were used. To correct for multiple comparisons, the observed TFCE images were compared with the empirical null distribution computed from permutations of the maximum voxel-specific TFCE scores. Correlations with a P value less than or equal to .05, corrected for multiple comparisons for the voxel-wise analyses, were regarded as significant. For the ROI analysis, partial correlation tests were used to examine if there were significant correlations between the mean FA value in each ROI and the BSID scores. P values less than or equal to .05 were regarded as indicative of statistical significance. Strength of correlation was interpreted as follows: correlation coefficient R of 0.30, 0.50, and 0.70 for weak, moderate, and strong linear relationships, respectively (15).
Potential confounders were considered in the data analysis. Maternal, birth, and neonatal features suspected of having confounding effects were tested. Specifically, demographic characteristics such as infant sex, infant diet (whether breastfed at all or not, and breastfeeding duration), infant gestational age at birth, family socioeconomic status (including both parents’ education and income), mother’s IQ and body mass index at early pregnancy, and mother’s age at delivery were added as covariates in the TBSS analysis, to determine if each factor changed the associations between FA at age 2 weeks and BSID at age 2 years. Because of the limited sample size and the concerns of degrees of freedom in the statistical analysis when multiple covariates were included, these potential confounders were examined individually. Only parameters showing strong confounding effects in TBSS analyses were included as covariates in the final adjusted ROI correlation analyses to control for the confounding effects. All statistical analyses were implemented with the MATLAB software and the SAS software (version 9.4, SAS Institute, Cary, NC).
Results
The demographic information of the infants and their mothers is presented in the Table. Thirty-eight infants (20 male, 18 female) were included in our study. Mean values (± standard deviation) for demographic information were as follows for the infants: gestational age at birth, 275 days ± 7; age at MRI, 14.3 days ± 1.6; age at BSID assessment, 732 days ± 6; and breastfeeding duration, 252 days ± 196. For the infants’ mothers, the mean values for demographic information were as follows: age at delivery, 29.5 years ± 4.0; IQ at early pregnancy, 108 ± 8; fat mass percentage at early pregnancy, 34.5% ± 8.6; and body mass index at early pregnancy, 26.3 ± 5.8. The BSID-III test scores for the infants at age 2 years are also listed in the Table, with mean scores as follows: socioemotional, 116 ± 17; cognitive, 101 ± 10; language, 101 ± 11; motor, 105 ± 13; and adaptive, 99 ± 13.
Demographic Data and Neurodevelopmental Test Scores for Infants and Mothers
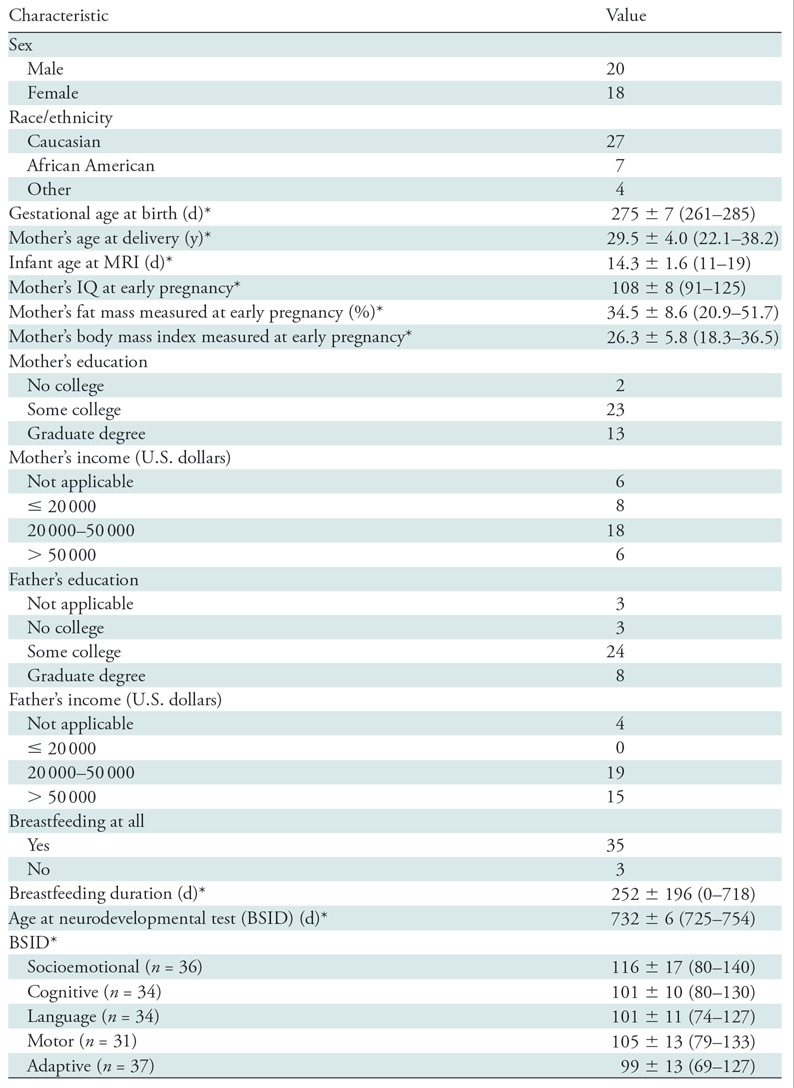
Note.—Unless otherwise stated, data are number of participants. BSID = Bayley Scales of Infant Development.
*Data are mean ± standard deviation. Data in parentheses are range (minimum to maximum).
TBSS analyses revealed correlations (P ≤ .05, after multiple-comparison corrections) between FA values measured at age 2 weeks and multiple BSID subscale scores measured at age 2 years in our infant cohort (Fig 2). Widespread white matter regions in the brain showed clusters with positive correlation between FA and socioemotional, cognitive, language, and motor scores. There were no correlations (P ≤ .05, after multiple-comparison corrections) between the adaptive behavior scores and FA values in any white matter regions. There were also no negative correlations (P ≤ .05, after multiple-comparison corrections) between FA values in any imaging voxels and any BSID scores.
Figure 2:

Voxel-wise tract-based spatial-statistics analysis shows positive correlations (P ≤ .05, after correction for multiple comparisons) between fractional anisotropy (FA) values at 2 weeks of age and Bayley Scales of Infant Development (BSID) scores at 2 years of age in multiple brain white matter regions. Images are in radiologic convention (left/right flipped). Mean skeleton of major white matter tracts (blue) is overlaid on mean FA maps (background images). Orange/yellow color on the skeleton represents voxels with positive correlation (P ≤ .05, corrected) between FA value and BSID subscale scores, including socioemotional, cognitive, language, and motor scores. There are no voxels with significant correlation between FA values and BSID adaptive behavior scores.
When potential confounding factors specified previously were included in the TBSS correlation analysis individually as a covariate, the resulting maps again showed widespread clusters with correlations between FA and BSID parameters (P ≤ .05, after multiple-comparison corrections) (Figs E2–E10 [online]). These results were similar to the maps when none of these factors were included as covariates (Fig 2), indicating no or minimal confounding effects by these factors. However, when the infant’s gestational age at birth was included as a covariate in the TBSS analysis, the relationships between FA values in newborns and BSID test scores at 2 years of age were diminished, only existing at a statistical threshold of P less than or equal to .01, uncorrected for multiple comparisons (Fig E11 [online]). This indicates that infant’s gestational age at birth was an important confounding factor in the FA-BSID relationships. We also noted a trend of positive correlations between gestational age at birth and BSID scores at age 2 years in our cohort (specifically, R = 0.34 and P = .05 for correlation with cognitive scores; R = 0.29 and P = .09 for correlation with language scores; R = 0.32 and P = .08 for correlation with motor scores; and R = 0.31 and P = .06 for correlation with socioemotional scores).
Importantly, additional ROI partial correlation analysis based on mean FA values for whole white matter regions showing clusters on TBSS analysis were able to detect weak but significant correlations between mean FA and BSID scores (R ranging from 0.35 to 0.48, P ≤ .05, controlled for the confounding effects of gestational age at birth). Specifically, cognitive scores at age 2 years positively correlated with newborn mean FA values in the genu and body of the corpus callosum, right optic radiation, right fornix, left peduncle, right peduncle, and right posterior limb of the internal capsule (Fig 3). Language scores at age 2 years positively correlated with newborn mean FA values in the left peduncle, right optic radiation, left and right radiation of the corpus callosum, and genu of the corpus callosum (Fig 4). Motor scores at age 2 years positively correlated with newborn mean FA values in the right inferior longitudinal fasciculus and right anterior corona radiata (Fig 5). When including all clinical parameters (regardless of their effect sizes) in the partial correlation analysis, similar correlations between FA and BSID scores were found (Fig E12 [online]).
Figure 3:

Cognitive correlation analysis: Region-of-interest analysis shows that mean fractional anisotropy (FA) values at age 2 weeks for multiple white matter tracts positively correlate with Bayley Scales of Infant Development cognitive scores at age 2 years (n = 34, P ≤ .05, controlled for the confounding effects of gestational age at birth).
Figure 4:

Language correlation analysis: Region-of-interest analysis shows that mean fractional anisotropy (FA) values at age 2 weeks for multiple white matter tracts positively correlate with Bayley Scales of Infant Development language scores at age 2 years (n = 34, P ≤ .05, controlled for the confounding effects of gestational age at birth).
Figure 5:

Motor correlation analysis: Region-of-interest analysis shows that mean fractional anisotropy (FA) values at age 2 weeks for multiple white matter tracts positively correlate with Bayley Scales of Infant Development motor scores at age 2 years (n = 31, P ≤ .05, controlled for the confounding effects of gestational age at birth).
Discussion
Our study revealed associations (correlation coefficients ranging from 0.35 to 0.48; P ≤ .05) between diffusion tensor MRI–measured fractional anisotropy (FA) values at 2 weeks of age and Bayley Scales of Infant Development (BSID) scores measured at 2 years of age in healthy infants. Specifically, higher FA values, indicating greater early white matter development, positively correlated with higher BSID subscale scores (including language, cognitive, and motor), indicating better later neurodevelopment. Several demographic and environmental factors, such as infant sex (16,17), family socioeconomic status (18), mother’s age at delivery (19), maternal body composition (13), and breastfeeding duration (20–23), were tested as covariates in our study, justified by previously shown possibility of effects on either brain structure or function or neurodevelopmental outcomes (or both). However, infant’s gestational age at birth was the only factor that showed strong confounding effects in the correlation analysis. This is not surprising since gestational age likely impacts both white matter development in healthy full-term newborns (as demonstrated in our previous study [13]) and their neurodevelopmental outcomes (as reflected by the trend of correlations between gestational age at birth and BSID scores at age 2 years found in our study).
Many studies have revealed associations between clinically observed white matter injuries during infancy in those with medical conditions and adverse neurodevelopmental outcomes during later childhood (4–6). Nevertheless, there is a scarcity of literature revealing such relationships in children born healthy and full-term. Our study indicates that variation in white matter microstructural integrity in healthy newborns correlates with neurodevelopmental outcomes at age 2 years. Our findings not only reinforce the superior sensitivity of diffusion tensor MRI for detection of subtle changes in brain white matter but also highlight the significant correlations between early white matter development and later outcomes. Further study will be necessary to test if postnatal intervention can effectively promote neurodevelopmental outcomes for healthy infants with below-average white matter development at birth. With information obtained from this study, it is possible that neuroimaging in newborns may to some extent predict neurodevelopment even for healthy children, and prenatal intervention targeted at improving white matter integrity at birth will be important for further promoting neurodevelopment in children.
Our results showed weak but significant correlations between the adjusted ROI analysis of mean FA-BSID relationships involving several white matter regions and the BSID subscales, which included cognitive, language, and motor scores. These white matter regions surprisingly were not specifically in the major white matter pathways involved in these functions; for example, frontal or prefrontal white matter for cognition, superior longitudinal fasciculus for language, and cerebral peduncle and posterior limbs of internal capsule for motor functions. One possible reason for this is that the correlations with BSID scores were with global white matter development, while correlations with regions that involved particular functions were not able to reach the statistical significance with the limited sample size. There may also be additional confounding factors we did not consider but that still affected the FA-BSID relationships. Confounding factors may not only reduce the observed effects but also shift regions showing effects. Nevertheless, the white matter regions we identified still have important implications for respective functions and are consistent with literature studying relationships between brain structure and neurodevelopment in healthy children. For example, correlations between mean FA and BSID language and cognitive scores were mainly in the corpus callosum (which connects the left and right brain hemisphere and may play an important role in language lateralization [24]), including the genu, body, and radiation; and in the projection fibers (which transmit neural signal from deep brain to cortex and may be a pathway for the functional integration of motor and cognition [25]), including the cerebral peduncle and internal capsules. These correlations are consistent with a recent study on infants and young children investigating relationships between white matter myelination and early learning composite as well as verbal and nonverbal developmental quotients (8). In addition, FA and BSID cognitive correlation was observed in the fornix. As part of the limbic system, the fornix is an important region for memory function. Loss of fornix white matter has shown to be a strong predictor of cognitive impairment in the elderly (26). Another region that showed positive correlation between mean FA and BSID cognitive and language scores is the optic radiation, an important component of the visual pathway. While the exact functional relationship of this is unclear, the ability to search visual information is a prerequisite for learning involved in language and cognition, and the optic radiation is one of the first white matter tracts to be myelinated during infancy. For the socioemotional and adaptive behavior measures, there were no significant correlations with mean FA values in any white matter ROI, after controlling for the confounding effects of gestational age at birth. This may also be related to the small sample size or with the fact that these two subscales were obtained from questionnaires instead of direct observations by trained psychological examiners.
The major strengths of our study are the prospective nature and the longitudinal design. Besides using a well-defined, healthy cohort, we documented and tested several prenatal and postnatal factors for confounding effects on the FA-BSID relationships of interest.
Our study limitations included a small sample size that may have resulted in a lack of correlations with the main functional pathways, and the use of a 1.5-T MRI scanner and a small number of diffusion directions, which limited diffusion models that can be tested but should be adequate for evaluating FA. In addition, many other postnatal factors, such as parenting style and exposure to adverse environment, which were not assessed in our study, may also confound the findings. Finally, we only revealed correlations between early neuroimaging and later neurodevelopment but did not test the predictive ability of early neuroimaging. To advance our study, we recommend machine learning approaches based on larger data sets with both training and test data. Our findings may be further validated by longer term follow-up and cognitive outcome assessments that are not possible at age 2 years.
In conclusion, we report correlations between white matter development in healthy full-term infants and neurodevelopmental outcomes at a later age. Despite confounding effects by factors such as gestational age at birth, these correlations remain significant in many brain white matter regions. Our findings indicate that pre- and perinatal brain development is pivotal for optimized cognition and neurodevelopment in healthy infants.
APPENDIX
SUPPLEMENTAL FIGURES
Acknowledgments
Acknowledgments
We thank the Arkansas Children’s Nutrition Center Clinical Studies Core and the Arkansas Children’s Hospital Radiology MRI team for their assistance with this study.
Supported in part by Arkansas Children's Hospital Research Institute (Marion B. Lyon Award) and USDA (USDA-ARS Project, 6026-51000-010-05S). X.O. supported by NIH P20GM121293 and P30GM110702.
Disclosures of Conflicts of Interest: K.F. disclosed no relevant relationships. A.C.R. disclosed no relevant relationships. A.A. Activities related to the present article: disclosed institutional grant from the USDA. Activities not related to the present article: disclosed no relevant relationships. Other relationships: disclosed no relevant relationships. B.J.B. disclosed no relevant relationships. X.L. disclosed no relevant relationships. C.M.G. Activities related to the present article: disclosed institutional grant from the USDA. Activities not related to the present article: disclosed payment received for expert testimony from law firms defending physicians. Other relationships: disclosed no relevant relationships. R.H.R. disclosed no relevant relationships. T.M.B. Activities related to the present article: disclosed institutional grant from the NIH and USDA. Activities not related to the present article: disclosed no relevant relationships. Other relationships: disclosed no relevant relationships. X.O. Activities related to the present article: disclosed institutional grant from USDA. Activities not related to the present article: disclosed no relevant relationships. Other relationships: disclosed no relevant relationships.
Abbreviations:
- BSID
- Bayley Scales of Infant Development
- FA
- fractional anisotropy
- ROI
- region of interest
- TBSS
- tract-based spatial statistics
References
- 1.Dubois J, Dehaene-Lambertz G, Kulikova S, Poupon C, Hüppi PS, Hertz-Pannier L. The early development of brain white matter: a review of imaging studies in fetuses, newborns and infants. Neuroscience 2014;276:48–71. [DOI] [PubMed] [Google Scholar]
- 2.Hermoye L, Saint-Martin C, Cosnard G, et al. Pediatric diffusion tensor imaging: normal database and observation of the white matter maturation in early childhood. Neuroimage 2006;29(2):493–504. [DOI] [PubMed] [Google Scholar]
- 3.Geng X, Gouttard S, Sharma A, et al. Quantitative tract-based white matter development from birth to age 2 years. Neuroimage 2012;61(3):542–557. [DOI] [PMC free article] [PubMed] [Google Scholar]
- 4.Perlman JM. White matter injury in the preterm infant: an important determination of abnormal neurodevelopment outcome. Early Hum Dev 1998;53(2):99–120. [DOI] [PubMed] [Google Scholar]
- 5.Peyvandi S, Chau V, Guo T, et al. Neonatal brain injury and timing of neurodevelopmental assessment in patients with congenital heart disease. J Am Coll Cardiol 2018;71(18):1986–1996. [DOI] [PMC free article] [PubMed] [Google Scholar]
- 6.Weeke LC, Groenendaal F, Mudigonda K, et al. A novel magnetic resonance imaging score predicts neurodevelopmental outcome after perinatal asphyxia and therapeutic hypothermia. J Pediatr 2018;192:33–40.e2. [DOI] [PMC free article] [PubMed] [Google Scholar]
- 7.O’Muircheartaigh J, Dean DC, 3rd, Ginestet CE, et al. White matter development and early cognition in babies and toddlers. Hum Brain Mapp 2014;35(9):4475–4487. [DOI] [PMC free article] [PubMed] [Google Scholar]
- 8.Deoni SCL, O’Muircheartaigh J, Elison JT, et al. White matter maturation profiles through early childhood predict general cognitive ability. Brain Struct Funct 2016;221(2):1189–1203. [DOI] [PMC free article] [PubMed] [Google Scholar]
- 9.Lee SJ, Steiner RJ, Yu Y, et al. Common and heritable components of white matter microstructure predict cognitive function at 1 and 2 y. Proc Natl Acad Sci U S A 2017;114(1):148–153. [DOI] [PMC free article] [PubMed] [Google Scholar]
- 10.Yoshida S, Oishi K, Faria AV, Mori S. Diffusion tensor imaging of normal brain development. Pediatr Radiol 2013;43(1):15–27. [DOI] [PMC free article] [PubMed] [Google Scholar]
- 11.Ou X, Glasier CM, Ramakrishnaiah RH, et al. Impaired white matter development in extremely low-birth-weight infants with previous brain hemorrhage. AJNR Am J Neuroradiol 2014;35(10):1983–1989. [DOI] [PMC free article] [PubMed] [Google Scholar]
- 12.Ou X, Glasier CM, Ramakrishnaiah RH, et al. Diffusion tensor imaging in extremely low birth weight infants managed with hypercapnic vs. normocapnic ventilation. Pediatr Radiol 2014;44(8):980–986. [DOI] [PMC free article] [PubMed] [Google Scholar]
- 13.Ou X, Glasier CM, Ramakrishnaiah RH, et al. Gestational age at birth and brain white matter development in term-born infants and children. AJNR Am J Neuroradiol 2017;38(12):2373–2379. [DOI] [PMC free article] [PubMed] [Google Scholar]
- 14.Ou X, Thakali KM, Shankar K, Andres A, Badger TM. Maternal adiposity negatively influences infant brain white matter development. Obesity (Silver Spring) 2015;23(5):1047–1054. [DOI] [PMC free article] [PubMed] [Google Scholar]
- 15.Mukaka MM. Statistics corner: a guide to appropriate use of correlation coefficient in medical research. Malawi Med J 2012;24(3):69–71. [PMC free article] [PubMed] [Google Scholar]
- 16.Schmithorst VJ, Holland SK, Dardzinski BJ. Developmental differences in white matter architecture between boys and girls. Hum Brain Mapp 2008;29(6):696–710. [DOI] [PMC free article] [PubMed] [Google Scholar]
- 17.Chung WCJ, Auger AP. Gender differences in neurodevelopment and epigenetics. Pflugers Arch 2013;465(5):573–584. [DOI] [PMC free article] [PubMed] [Google Scholar]
- 18.Bradley RH, Corwyn RF. Socioeconomic status and child development. Annu Rev Psychol 2002;53(1):371–399. [DOI] [PubMed] [Google Scholar]
- 19.Sandin S, Hultman CM, Kolevzon A, Gross R, MacCabe JH, Reichenberg A. Advancing maternal age is associated with increasing risk for autism: a review and meta-analysis. J Am Acad Child Adolesc Psychiatry 2012;51(5):477–486.e1. [DOI] [PubMed] [Google Scholar]
- 20.McCrory C, Murray A. The effect of breastfeeding on neuro-development in infancy. Matern Child Health J 2013;17(9):1680–1688. [DOI] [PubMed] [Google Scholar]
- 21.Deoni SCL, Dean DC, 3rd, Piryatinsky I, et al. Breastfeeding and early white matter development: a cross-sectional study. Neuroimage 2013;82(0):77–86. [DOI] [PMC free article] [PubMed] [Google Scholar]
- 22.Isaacs EB. Neuroimaging, a new tool for investigating the effects of early diet on cognitive and brain development. Front Hum Neurosci 2013;7:445. [DOI] [PMC free article] [PubMed] [Google Scholar]
- 23.Ou X, Andres A, Cleves MA, et al. Sex-specific association between infant diet and white matter integrity in 8-y-old children. Pediatr Res 2014;76(6):535–543. [DOI] [PubMed] [Google Scholar]
- 24.Hinkley LBN, Marco EJ, Brown EG, et al. The contribution of the corpus callosum to language lateralization. J Neurosci 2016;36(16):4522–4533. [DOI] [PMC free article] [PubMed] [Google Scholar]
- 25.Leisman G, Moustafa AA, Shafir T. Thinking, walking, talking: integratory motor and cognitive brain function. Front Public Health 2016;4(4):94. [DOI] [PMC free article] [PubMed] [Google Scholar]
- 26.Fletcher E, Raman M, Huebner P, et al. Loss of fornix white matter volume as a predictor of cognitive impairment in cognitively normal elderly individuals. JAMA Neurol 2013;70(11):1389–1395. [DOI] [PMC free article] [PubMed] [Google Scholar]
Associated Data
This section collects any data citations, data availability statements, or supplementary materials included in this article.