

Abstract
Background:
There is controversy over “labelling” people with prediabetes. Using serial cross-sectional National Health and Nutrition Examination Surveys (1988–1994, 1999–2004, 2005–2010, 2011–2014), we examined prevalence of cardio-renal burdens in U.S. adults with prediabetes over time and compared patterns with other glycemic groups.
Methods:
Among 25813 non-pregnant adults, we categorized glycemia as: self-reported diagnosed diabetes or no self-reported diabetes with Fasting Plasma Glucose (FPG)=100–125mg/dl or glycated hemoglobin (HbA1c)=5.7–6.4% (prediabetes), FPG≥126mg/dl or HbA1c≥6.5% (undiagnosed diabetes), or FPG<100mg/dl and HbA1c<5.7% (normal glycemia). We repeated analyses using varying definitions of prediabetes (FPG=110–125mg/dl or HbA1c=5.7–6.4%, FPG=110–125mg/dl or HbA1c=6.0–6.4%, and FPG=100–125mg/dl and HbA1c=5.7–6.4%). For each group over time, we estimated prevalence of hypertension and dyslipidemia; among those, we estimated proportions treated and achieving care goals. By group, we estimated current, former, and never-smoking; mean ten-year cardiovascular event risk (using Framingham, UKPDS, and ASCVD estimators); albuminuria (mean and albumin:creatinine ratio≥30mg/g), estimated glomerular filtration rate (eGFR; mean and <60ml/min/1.73m2), and prevalence of myocardial infarction and stroke.
Findings:
In 2011–2014, >36% adults with prediabetes were hypertensive; >50% had dyslipidemia; >24% smoked; >11% had albuminuria or reduced eGFR; and average ten-year event risk was approximately 5–6%. From 1988–1994 to 2011–2014, adults with prediabetes experienced significant increases in hypertension (+9–10percentage points [ppt]); no change in dyslipidemia; declines in smoking (range: −5.6 to −9.8ppt); increases in treatment (+27.2ppt [BP]; +33.6ppt [lipids]) and goal achievement (+36.2ppt [BP]; +31.8ppt [lipids]); declines in cardiovascular risk (range: −1.9 to −4.9ppt); but no change in albuminuria, reduced eGFR, myocardial infarction, and stroke. Prevalence and patterns were consistent across all prediabetes definitions examined. Compared to adults with prediabetes, adults with diagnosed diabetes experienced larger improvements in cardio-renal risk treatments, except smoking did not decline.
Interpretation:
Over 25 years, cardio-renal risks and disease remained highly prevalent in adults with prediabetes, regardless of definitions used. Identifying prediabetes may open opportunities for cardio-renal risk reduction.
INTRODUCTION
There are concerns that current diagnostic thresholds for prediabetes are too low and that labeling people as having prediabetes leads to “medicalization” of the condition.(1) Critics argue that prediabetes is a creation of the pharmaceutical industry and that a substantial portion of people with prediabetes never progress to diabetes. Proponents of the prediabetes “diagnosis” argue that several longitudinal studies, meta-analyses,(2, 3) and rates of high progression noted in the control groups of intervention trials(4, 5) provide adequate evidence that people with prediabetes have three- to eleven times higher annual diabetes incidence than the general population and that the benefits and opportunity to intervene with lifestyle modification (LSM) outweighs the potential negative externalities. Furthermore, while prediabetes is associated with excess future risk of cardiovascular disease,(6) little is known about the prevalence of cardio-renal risk factors and disease in prediabetes. Also, it remains unknown whether identification of these individuals provides an opportunity to assert particular attention to management of these risk factors.
To further inform this debate, we used nationally-representative data from 1988 to 2014 to examine trends in prevalence, treatment, and control of hypertension, dyslipidemia, and smoking; average 10-year cardiovascular disease (CVD) event risk; and presence of cardio-renal co-morbidities in the US adult population by glycemic status (i.e. those with prediabetes, diagnosed diabetes, undiagnosed diabetes, and normal glycemia). Greater emphasis on identification, large randomized trials of diabetes management,(7–9) along with a movement focused on quality benchmarking against guideline-recommended care goals have led to successive improvements in cardio-renal risk factor profiles of persons with diagnosed diabetes nationally.(10, 11) To date, however, it is unclear whether people with prediabetes also experienced similar improvements. These findings not only contribute nationally representative data to controversies regarding prediabetes, but also help identify gaps in care for specific groups that can be addressed to optimize population cardiovascular health in the U.S.
METHODS
Study design and participants
We analyzed data from successive National Health and Nutrition Examination Surveys (NHANES) over 25 years (1988–1994, 1999–2004, 2005–2010, and 2011–2014). The National Center for Health Statistics (NCHS) employs a complex multi-stage sampling approach to recruit sample populations such that each two-year NHANES cycle is representative of the nation’s non-institutionalized civilians. The NCHS Research Ethics Review Board approved NHANES. All participants provided informed consent prior to participation.
Details regarding sampling methods, survey instruments, and data collection have been described elsewhere.(12, 13) Briefly, social and demographic characteristics were obtained via interviewer-administered questionnaires. Data regarding anthropometrics, blood pressure (BP, mmHg), and blood and urine specimens were collected in mobile examination centers. From these, fasting plasma glucose (FPG, mg/dl), glycated hemoglobin (HbA1c, %), non-HDL cholesterol (mg/dl), and urinary creatinine and albumin were estimated using standardized laboratory techniques (Appendix A).
Response rates for 1988–2014 NHANES ranged from 75–80%. Our analyses included all non-pregnant participants aged 20 years and older with no self-reported diabetes that fasted for a minimum of eight hours and all participants with self-reported diabetes regardless of fasting status. In total, our analysis included 7916 (1988–1994), 6684 (1999–2004), 5750 (2005–2010), and 5463 participants (2011–2014).
Variable Definitions
Diagnosed diabetes was defined by participants’ positive response to the question, “Other than during pregnancy, have you ever been told by a doctor or health professional that you have diabetes or sugar diabetes?” For those reporting no diabetes diagnosis, we classified undiagnosed diabetes as FPG ≥126mg/dl (7.0mmol/L) or HbA1c ≥6.5% (48mmol/mol), prediabetes as FPG 100–125mg/dl (5.6–6.9mmol/L) or HbA1c 5.7–6.4% (39–47mmol/mol), and normal glycemic status as FPG <100mg/dl (5.6 mmol/L) and HbA1c <5.7% (39mmol/mol). In sensitivity analyses, we defined prediabetes with higher FPG (110–125mg/dl [6.1–6.9mmol/L]) and/or higher HbA1c (≥6.0% [42mmol/mol]) thresholds to examine if and how prevalence of prediabetes and cardio-renal co-morbidities varied.
Participant Characteristics
We reported mean age, sex, race/ethnicity (non-Hispanic white vs. others), insurance status (any vs. none), and education (< high-school vs. at least high-school education) at time of survey. We used poverty-income ratio, an indicator of income relative to inflation-adjusted family need to categorize income (above vs. at or below poverty level).(14) We used measured height, weight, and waist circumference to calculate body mass index (BMI; weight divided by height squared [kg/m2]) and waist-to-height ratio (waist divided by height).
Cardiovascular Risk Factors
We defined hypertension as self-reported anti-hypertensive drug use and/or measured BP≥140/90mmHg. We defined dyslipidemia as self-reported lipid-lowering drug use and/or non-HDL cholesterol≥160mg/dl. To estimate smoking prevalence, we used self-reports of ever smoking (reporting ≥100 cigarettes smoked in their lifetime) and classified smoking status as “current” (positive response when asked about smoking at the time of survey), “former” (positive response to ever smoking, but negative to current); or “never” (negative response to ever smoking).
Care Goal Achievement
The BP goal (<140/90mmHg) was based on the Seventh Joint National Committee.(15) For lipid control, we used non-HDL cholesterol<130mg/dl (2.6mmol/L) which corresponds with the LDL cholesterol<100mg/dl (2.2mmol/L) goal articulated in the American Diabetes Association guidelines.(16) We used not currently smoking as the tobacco control goal.
Cardio-renal complications of Diabetes
We calculated average 10-year CVD event risk using three risk scores: the modified Framingham score,(17) the United Kingdom Prospective Diabetes Study (UKPDS) diabetes-specific tool,(18) and the more contemporary atherosclerotic cardiovascular disease (ASCVD) risk calculator.(19) We described previous myocardial infarction and stroke based on participant self-report.
We examined different markers of chronic kidney disease (CKD): median urinary albumin:creatinine ratio (ACR) and ACR≥30 mg/g (signifying moderate-to-severe albuminuria), as well as mean estimated glomerular filtration rate (eGFR) and eGFR<60ml/min/1.73m2 (stages III-V) using the CKD-EPI equation.(20) We also estimated prevalence of hyperfiltration (eGFR>135ml/min/1.73m2), an early indicator of hyperglycemia-related renal damage.(21)
Statistical analysis
We used SAS version 9.3 (SAS Institute Inc., Cary, NC) and SUDAAN version 11.0 (Research Triangle Institute, Research Triangle Park, NC) to adjust for complex survey designs. To account for differential probabilities of selection and non-response, we used interview weights from individuals with diagnosed diabetes and fasting weights for individuals without diagnosed diabetes so that the sum of the sampling weights added to the total US population. Missing data ranged from 1% (smoking status) to 3.5% (CKD), and sample sizes were reduced for each specific analysis where data for the dependent variable were missing.
For each glycemic group (diagnosed diabetes, undiagnosed diabetes, prediabetes, normal glycemia) in each period, we described socio-demographic and clinical characteristics, and, using multiple logistic regression, we calculated prevalence of hypertension and dyslipidemia adjusted for age, sex, and race/ethnicity. We tested for trends in distributional differences in these characteristics and CVD risk factors in successive periods using adjusted Wald F tests.
Among those with hypertension, we estimated the proportion treated based on self-report. Then, for those treated, we assessed proportions of adults that achieved BP <140/90mmHg (i.e. “controlled”) and those who did not (“uncontrolled”). This same approach was repeated for dyslipidemia.
For tobacco use, we reported proportions of never, former, and current smokers for each glycemic group for each survey period.
For each group in each time period, we also reported average 10-year CVD event risk and estimated prevalence of myocardial infarction and stroke. In sensitivity analyses, we estimated CVD event risk after excluding people with a history of myocardial infarctions, strokes, and congestive heart failure.
For CKD, we reported mean albuminuria and eGFR, prevalence of proteinuria and reduced eGFR separately and together, and prevalence of hyperfiltration to explore whether patterns of renal disease varied by classification method.
For all estimates of prevalence, care goal achievement, and mean levels, we calculated the predicted changes between 1988–94 and 2011–14 using an interaction term of glycemic status by survey period in logistic regression models adjusted for age, sex, and race/ethnicity.
We reported 95% confidence intervals (95%CI) for all data and used p<0.05 as an indicator of statistical significance.
Role of the Funding Source
The NCHS funds NHANES surveys, but did not play any role in the design, conduct, and reporting of these analyses.
RESULTS
Over successive survey periods between 1988–1994 and 2011–2014 (Table 1), prevalence of prediabetes and diagnosed diabetes increased while undiagnosed diabetes and normal glycemia decreased. Throughout the period, prevalence (and absolute numbers) of each prediabetes subgroup increased over time, though there was wide variation in absolute numbers with prediabetes by different definition permutations. In 2011–2014 surveys, using the most specific (FPG 100–125mg and A1c 5.7–6.4%) and sensitive definitions (FPG 100–125mg or A1c 5.76.4%), prediabetes prevalence varied from 11.0% (19.5 million adults) to 34.7% (78.5 million), respectively.
Table 1.
Characteristics of US adults aged ≥ 18 years by glycemic status, NHANES 1988 to 2014
| 1988–1994 | 1999–2004 | 2005–2010 | 2011–2014 | p- value |
|
|---|---|---|---|---|---|
| Diagnosed diabetes | n=1265 | n=1406 | n=1918 | n=1381 | |
| Estimated population size, millions † | 9.5(0.4) | 14.3(0.6) | 18.0 (0.8) | 22.0 (0.9) | |
| Prevalence, % | 5.4 (0.2) | 7.2 (0.3) | 8.4 (0.4) | 9.7 (0.4) | <0.001 |
| Mean Age, years | 60.2 (0.8) | 59.2 (0.6) | 59.7 (0.5) | 60.1 (0.4) | 0.995 |
| Female, % | 55.1 (2.7) | 51.5 (1.4) | 52.2 (1.7) | 51.2 (1.6) | 0.260 |
| Mean BMI, kg/m2 | 30.2 (0.3) | 31.9 (0.3) | 32.8 (0.2) | 33.0 (0.3) | <0.001 |
| Mean WHTR | 0.625 (0.005) | 0.648 (0.005) | 0.659 (0.003) | 0.666 (0.004) | <0.001 |
| Uninsured, % | 9.3 (1.1) | 11.3 (1.1) | 11.0 (1.0) | 11.7 (1.0) | 0.150 |
| Non-Hispanic white, % | 73.6 (2.3) | 64.7 (3.0) | 61.3 (2.9) | 60.7 (2.9) | 0.001 |
| Not completing HS Education, % | 43.2 (2.9) | 34.1 (1.7) | 30.0 (1.2) | 23.9 (2.2) | <0.001 |
| At or below poverty, % | 17.4 (1.7) | 18.0 (1.5) | 15.2 (1.1) | 20.8 (2.2) | 0.427 |
| Time since diagnosis, y | 9.5 (0.3) | 12.1 (0.5) | 10.7 (0.3) | 11.6 (0.4) | 0.006 |
| Undiagnosed diabetes | n=504 | n=238 | n=310 | n=209 | |
| Estimated population size, millions † | 8.3(0.4) | 6.3(0.5) | 7.1(0.6) | 6.8(0.6) | |
| Prevalence, % | 4.7 (0.3) | 3.2 (0.2) | 3.3 (0.3) | 3.0 (0.3) | <0.001 |
| Mean Age, years | 55.0 (0.8) | 57.9 (1.5) | 60.0 (0.9) | 55.9 (1.4) | 0.365 |
| Female, % | 52.1 (2.5) | 41.2 (3.7) | 36.7 (3.9) | 43.7 (5.9) | 0.140 |
| Mean BMI, kg/m2 | 29.2 (0.6) | 32.3 (0.8) | 33.1 (0.6) | 34.1 (0.7) | <0.001 |
| Mean WHTR | 0.6 (0.007) | 0.644 (0.009) | 0.661 (0.008) | 0.675 (0.008) | <0.001 |
| Uninsured, % | 11.1 (1.4) | 17.7 (2.8) | 16.5 (2.6) | 21.6 (4) | 0.009 |
| Non-Hispanic white, % | 64.5 (3.2) | 71.6 (3.4) | 67.0 (3.9) | 50.8 (5.6) | 0.024 |
| Not completing HS Education, % | 38.8 (2.5) | 32.6 (3.8) | 24.4 (2.9) | 26.2 (3.2) | 0.001 |
| At or below poverty, % | 14.6 (1.7) | 15.9 (2.3) | 12.4 (2.5) | 21.9 (4.5) | 0.193 |
| Prediabetes | n=2620 | n=1921 | n=2609 | n=1701 | |
| Estimated population size, millions † FPG 100–125mg/dl or A1c 5.7–6.4% FPG 110–125mg/dl or A1c 5.7–6.4% FPG 110–125mg/dl or A1c 6.0–6.4% FPG 100–125mg/dl and A1c 5.7–6.4% |
56.2 (1.9) 32.6 (1.3) 17.9 (0.9) 12.1 (0.8) |
59.9 (2.3) 25.5 (1.1) 14.3 (0.7) 11.7 (0.7) |
77.5 (1.7) 39.8 (1.0) 20.1 (0.9) 18.7 (0.9) |
78.5 (2.7) 41.2 (1.6) 19.6 (1.2) 19.5 (0.9) |
|
| Prevalence, % FPG 100–125mg/dl or A1c 5.7–6.4% FPG 110–125mg/dl or A1c 5.7–6.4% FPG 110–125mg/dl or A1c 6.0–6.4% FPG 100–125mg/dl and A1c 5.7–6.4% |
31.7 (1.0) 18.4 (0.7) 10.1 (0.5) 6.8 (0.4) |
30.0 (1.2) 14.4 (0.6) 8.0 (0.4) 6.6 (0.4) |
36.0 (0.8) 22.5 (0.6) 11.3 (0.5) 10.5 (0.5) |
34.7 (1.2) 23.2 (0.9) 11.1 (0.7) 11.0 (0.5) |
0.003 <0.001 0.016 <0.001 |
| Mean Age, years | 51.7 (0.6) | 51.9 (0.5) | 52.1 (0.5) | 52.6 (0.4) | 0.221 |
| Female, % | 40.8 (1.3) | 41.8 (1) | 44.7 (1.3) | 47.3 (1.7) | 0.001 |
| Mean BMI, kg/m2 | 28.0 (0.2) | 29.5 (0.2) | 29.9 (0.2) | 30.1 (0.3) | <0.001 |
| Mean WHTR | 0.576 (0.002) | 0.596 (0.003) | 0.602 (0.003) | 0.609 (0.004) | <0.001 |
| Uninsured, % | 14.7 (1.4) | 16.8 (1.2) | 19.2 (1.0) | 18.8 (1.5) | 0.025 |
| Non-Hispanic white, % | 74.9 (1.5) | 73.6 (2.3) | 70.1 (2.3) | 66.5 (2.8) | 0.004 |
| Not completing HS Education, % | 30.2 (2.1) | 23.3 (1.2) | 21.7 (1.3) | 19.6 (1.7) | <0.001 |
| At or below poverty, % | 12.8 (1.6) | 12.4 (1.4) | 13.7 (1.0) | 16.0 (1.3) | 0.096 |
| Normal glycemia | n=3618 | n=3075 | n=3024 | n=2172 | |
| Estimated population size, millions † | 103.2 (2.3) | 119.0 (2.5) | 112.4 (2) | 119.2 (2.7) | |
| Prevalence, % | 58.2 (1.3) | 59.6 (1.2) | 52.3 (0.9) | 52.6 (1.2) | <0.001 |
| Mean Age, years | 39.7 (0.4) | 41.6 (0.5) | 40.8 (0.4) | 41.6 (0.6) | 0.027 |
| Female, % | 58.0 (1.1) | 56.5 (0.9) | 56.3 (0.8) | 55.0 (1.0) | 0.045 |
| Mean BMI, kg/m2 | 25.3 (0.1) | 26.7 (0.1) | 26.9 (0.2) | 27.3 (0.2) | <0.001 |
| Mean WHTR | 0.519 (0.002) | 0.544 (0.002) | 0.547 (0.002) | 0.559 (0.003) | <0.001 |
| Uninsured, % | 14.8 (1.2) | 20.2 (1.2) | 21.5 (1.2) | 20.5 (1.2) | 0.001 |
| Non-Hispanic white, % | 78.7 (1.8) | 73.3 (1.8) | 71.7 (1.6) | 68.7 (2.5) | 0.001 |
| Not completing HS Education, % | 18.6 (1.1) | 17.2 (1.0) | 13.9 (0.9) | 13.1 (1.5) | 0.002 |
| At or below poverty, % | 11.7 (1.1) | 13.0 (1.0) | 11.8 (0.7) | 16.7 (1.9) | 0.032 |
Abbreviations:
NHANES National Health and Nutrition Examination Survey; %, percent; BMI, body mass index; WHTR, waist-to- height-ratio; HS, high school
All estimates include standard errors in parentheses
Data were from the National Health and Nutrition Examinations Surveys
Diagnosed diabetes was defined by participants’ self-reporting physician diagnosis of diabetes.
Undiagnosed diabetes was defined as no self-reported diabetes diagnosis and FPG ≥126mg/dl (7.0mmol/L) or HbAlc ≥6.5% (48mmol/mol).
Characteristics of prediabetes population was for the group defined as no-self reported diabetes and FPG 100125mg/dl (5.6–6.9mmol/L) or HbA1c 5.7–6.4% (39–47mmol/mol).
Normal glycemic status was defined by no reported diabetes diagnosis and FPG <100mg/dl (5.6 mmol/L) and HbA1c <5.7% (39mmol/mol).
Population size was estimated for the civilian, non-institutionalized US adult population aged 20 years and older using Current Population Survey population totals and the proportion in each glycemic group.
Across all glycemic groups, over the period from 1988–1994 to 2011–2014 surveys, mean age of US adults remained stable; sex distributions stayed largely the same except for women accounting for larger proportions of those with prediabetes; and higher proportions over time self-identified as minority race/ethnicities and reported completing high school education. Mean BMI and WHtR increased substantially in every group. Over time, larger proportions of people with undiagnosed diabetes, prediabetes, and normoglycemia were living in poverty. Of note, for people with diagnosed diabetes, the average number of years since diagnosis increased from 9.5 to 11.6 years between 1988–1994 and 2011–2014 surveys.
Prevalence of hypertension and dyslipidemia
Across survey periods (Table 2), adjusted prevalence of hypertension increased significantly among adults in every group (prediabetes +9.0 ppt [4.9, 13.1]; diagnosed diabetes: +16.6 percentage points [ppt; 11.8, 21.4]; undiagnosed diabetes +12.6 ppt [3.5, 21.7]; and normoglycemia +5.8 ppt [2.7, 8.9]). Prevalence of dyslipidemia increased in adults with diagnosed diabetes (+9.8 ppt [3.7, 15.9]), remained relatively stable in those with undiagnosed diabetes and prediabetes, and decreased in normoglycemic individuals (−6.0 ppt [−9.9, −2.1]). Hypertension and dyslipidemia prevalence estimates were similar or slightly higher for prediabetes subgroups defined using more specific thresholds (Appendix B), and patterns of prevalence changes over time (9–10 ppt increases in hypertension and no change in dyslipidemia) were similar.
Table 2.
Trends in prevalence of hypertension and dyslipidemia among U.S. adults aged ≥ 18 years by glycemic status, NHANES 1988 to 2014
| 1988–1994 | 1999–2004 | 2005–2010 | 2011–2014 | Δ from 88–94 to 11–14 |
P interaction | |
|---|---|---|---|---|---|---|
| n=8007 | n=6640 | n=7861 | n=5463 | P trend | ||
| Hypertension | <0.001 | |||||
| Diagnosed diabetes | 38.9 (36.1–41.7) | 50.5 (46.7–54.2) | 54.7 (50.9–58.4) | 55.5 (51.4–59.5) | +16.6 (11.9, 21.3) | <0.001 |
| Undiagnosed diabetes | 35.7 (30.8–40.8) | 48.9 (41.1–56.7) | 46.3 (39.2–53.5) | 49.8 (41.4–58.3) | +14.1 (4.5, 23.7) | 0.014 |
| Prediabetes | 26.9 (24.9–29.0) | 35.5 (33.1–38.1) | 35.2 (32.9–37.6) | 36.6 (32.8–40.5) | +9.7 (5.4, 14.0) | <0.001 |
| Normal glycemic status | 18.9 (17.3–20.7) | 26.4 (24.6–28.3) | 21.8 (20.1–23.6) | 25.0 (22.7–27.4) | +6.0 (3.3, 8.7) | 0.002 |
| Dyslipidemia | <0.001 | |||||
| Diagnosed diabetes | 53.4 (48.7–58.0) | 51.9 (49.2–54.5) | 53.5 (50.4–56.7) | 63.2 (59.3–67.0) | +9.8 (3.9, 15.7) | 0.001 |
| Undiagnosed diabetes | 46.5 (40.7–52.3) | 53.8 (47.0–60.5) | 53.0 (46.3–59.5) | 53.1 (43.9–62.1) | +6.6 (−4.2, 17.4) | 0.284 |
| Prediabetes | 53.1 (48.7–57.4) | 50.5 (47.5–53.4) | 46.1 (43.8–48.4) | 51.2 (47.0–55.3) | −1.9 (−7.8, 4.0) | 0.281 |
| Normal glycemic status | 36.8 (34.1–39.7) | 38.5 (36.5–40.6) | 33.7 (31.7–35.7) | 31.0 (28.2–33.9) | −5.8 (−9.7, −1.9) | 0.001 |
Abbreviations: NHANES, National Health and Nutrition Examinations Surveys
All analyses were adjusted for age, sex, race/ethnicity
P for trend: Calculated for each glycemic status group by including a continuous variable for the midpoint of each survey period in logistic regression models; significant values indicated variation over time within glycemic groups
P for interaction: significant P-values indicated varying associations between prevalence estimates over time across glycemic groups
Treatment and control among those with hypertension or dyslipidemia
In successive periods from 1988–1994 to 2011–2014, among those with hypertension (Figure 1: A), proportions of adults with prediabetes using BP-lowering medications increased from 53.9% to 81.4% (p<0.001). Similar increases in anti-hypertensive treatment were also evident in other groups. Achievement of BP treatment targets increased in every group over time, except for those with undiagnosed diabetes; by 2011–2014, adults with undiagnosed diabetes were 20–30 ppt less likely to meet BP goals compared to all other groups (36.6% vs. 55–65%, p-values<0.001). Mean systolic and diastolic BP levels over time corroborate these findings (Table 3), and this pattern was especially evident among those with diagnosed hypertension.
Figure 1.
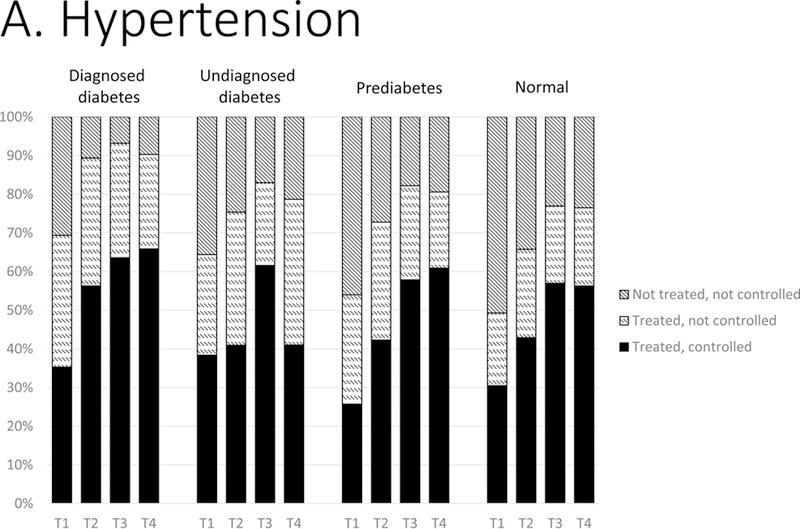
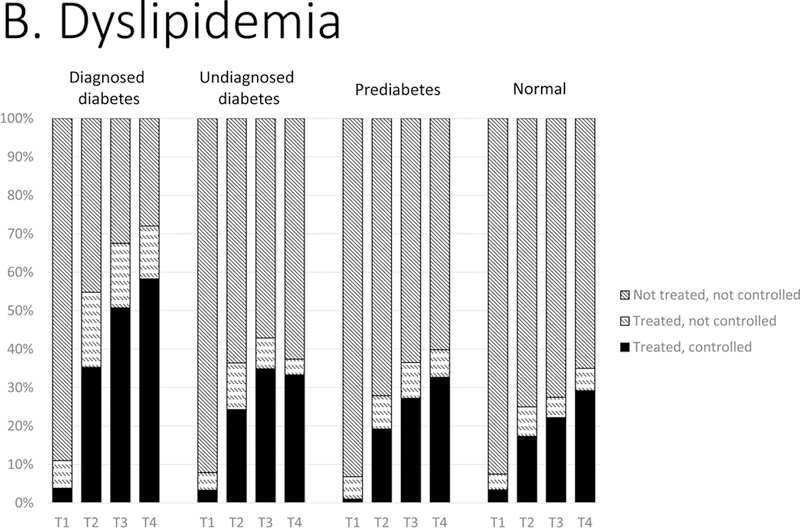
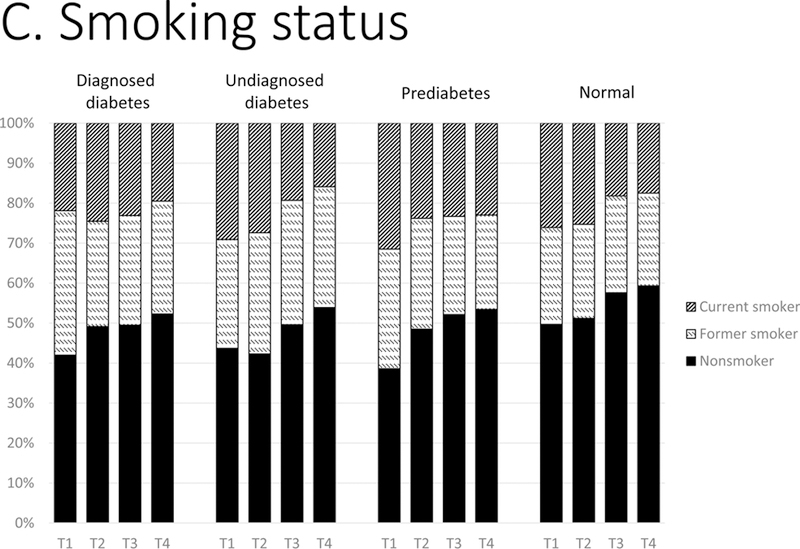
Distributions of control of CVD risk factors: (A) hypertension, (B) dyslipidemia, and (C) smoking status by glycemic status, 1988–2014. T1, 1988–1994; T2, 1999–2004; T3, 2005–2010; T4, 2011–2014. Hypertension was classified as: not treated (no antihypertensive medication use and BP ≥140/90 mm Hg); treated, not controlled (antihypertensive medication use and blood pressure ≥140/90 mm Hg); treated, controlled (antihypertensive medication use and blood pressure <140/90 mm Hg). Dyslipidemia was classified as: not treated (no lipidlowering medication use and non-HDL cholesterol ≥160 mg/dL); treated, not controlled (lipid-lowering medication use and non-HDL ≥160 mg/dL); treated, controlled (lipid-lowering medication use and non-HDL <160 mg/dL). Smoking status by self-report was classified as current smoker, former smoker, and never smoker.
Table 3.
Mean blood pressure and lipid levels by glycemic group, hypertension, and dyslipidemia status, U.S. adults aged ≥ 18 years, NHANES 1988–2014
| 1988–1994 | 1999–2004 | 2005–2010 | 2011–2014 | Δ 88–94 to 10–14 | ||
|---|---|---|---|---|---|---|
| n=8007 | n=6640 | n=7861 | n=5463 | P trend | ||
| Among whole population | ||||||
| Systolic BP (mmHg) | ||||||
| Diagnosed diabetes | 129.4 | 127.6 | 124.5 | 124.3 | −5.1 (−7.3, −2.9) | <0.001 |
| Undiagnosed diabetes | 125.2 | 130.3 | 122.8 | 129.2 | 3.9 (−1.5, 9.3) | 0.625 |
| Prediabetes | 123.6 | 125.7 | 122.1 | 122.0 | −1.6 (−3.2, 0.0) | 0.001 |
| Normal glycemic status | 117.8 | 121.4 | 118.6 | 119.0 | 1.2 (0.1, 2.2) | 0.714 |
| Diastolic BP (mmHg) | ||||||
| Diagnosed diabetes | 73.5 | 70.4 | 69.0 | 69.9 | −3.6 (−4.9, −2.3) | <0.001 |
| Undiagnosed diabetes | 74.9 | 73.1 | 70.8 | 72.8 | −2.0 (−5.3, 1.2) | 0.102 |
| Prediabetes | 74.5 | 73.5 | 70.2 | 71.1 | −3.4 (−4.5, −2.3) | <0.001 |
| Normal glycemic status | 71.4 | 71.9 | 68.6 | 69.1 | −2.4 (−3.3, −1.4) | <0.001 |
| Among those with hypertension | ||||||
| Systolic BP (mmHg) | ||||||
| Diagnosed diabetes | 144.7 | 137.5 | 133.5 | 132.5 | −12.2 (−15.5, −8.9) | <0.001 |
| Undiagnosed diabetes | 141.6 | 144.6 | 132.3 | 142.7 | 1.1 (−6.3, 8.6) | 0.451 |
| Prediabetes | 144.2 | 140.5 | 134.1 | 132.2 | −12 (−14.9, −9.1) | <0.001 |
| Normal glycemic status | 139.2 | 141.1 | 133.5 | 133.6 | −5.6 (−8.5, −2.8) | <0.001 |
| Diastolic BP (mmHg) | ||||||
| Diagnosed diabetes | 76.7 | 71.8 | 69.9 | 70.4 | −6.3 (−8, −4.7) | <0.001 |
| Undiagnosed diabetes | 78.6 | 76.2 | 71.7 | 73.7 | −4.9 (−9.8, 0.1) | 0.015 |
| Prediabetes | 80.1 | 76.4 | 72.6 | 72.4 | −7.7 (−9.5, −5.9) | <0.001 |
| Normal glycemic status | 80.7 | 77.3 | 73.1 | 73.0 | −7.8 (−10.1, −5.4) | <0.001 |
| Among whole population | ||||||
| Non-HDL (mg/dl) | ||||||
| Diagnosed diabetes | 172.0 | 155.3 | 134.2 | 129.8 | −42.2 (−49.7, −34.7) | <0.001 |
| Undiagnosed diabetes | 172.7 | 159.0 | 148.3 | 146.5 | −26.2 (−36.7, −15.6) | <0.001 |
| Prediabetes | 166.5 | 156.9 | 146.2 | 144.7 | −21.8 (−25.6, −17.9) | <0.001 |
| Normal glycemic status | 146.1 | 145.1 | 139.6 | 133.8 | −12.3 (−15.4, −9.2) | <0.001 |
| Among whole population | ||||||
| Non-HDL (mg/dl) | ||||||
| Diagnosed diabetes | 203.9 | 179.2 | 153.0 | 142.0 | −61.8 (−69.7, −54.0) | <0.001 |
| Undiagnosed diabetes | 200.3 | 184.4 | 171.5 | 169.3 | −31.0 (−43.6, −18.4) | <0.001 |
| Prediabetes | 196.1 | 184.8 | 171.2 | 165.5 | −30.7 (−34.4, −27.0) | <0.001 |
| Normal glycemic status | 186.6 | 181.5 | 176.7 | 167.9 | −18.7 (−22.9, −14.5) | <0.001 |
P for trend: Calculated for each glycemic status group by including a continuous variable for the midpoint of each survey period in logistic regression models; significant values indicated variation over time within glycemic groups NHANES, National Health and Nutrition Examinations Surveys
From 1988–1994 to 2011–2014, among those with dyslipidemia (Figure 1: B), use of lipid-lowering treatments increased in all groups: similarly among adults with prediabetes (6.6% to 40.2%, p<0.001), undiagnosed diabetes (7.7% to 35.8%, p<0.001), and normoglycemia (7.7% to 34.5%, p<0.001), but much more markedly in people with diagnosed diabetes (from 11.0% to 72.0%, p<0.001). By 2011–2014, there was a marked difference in achievement of guideline-recommended lipid levels between those with diagnosed diabetes (57%) versus all other glycemic groups (~29–33%, p-values<0.001). Mean non-HDL cholesterol levels over time declined significantly in every glycemic group (Table 3); the magnitude of reductions were largest in adults with diagnosed diabetes.
Smoking
Current smoking declined considerably since 1988–1994 in all glycemic groups (~6–12 ppt, p-values<0.01) except in those with diagnosed diabetes (Figure 1: C).
Cardio-Renal Comorbidities
Adjusted for age, sex, and race/ethnicity differences across glycemic groups between 1988–94 and 2011–2014, US adults’ ten-year probability of having a CVD event has declined significantly for each group, using the Framingham, ASCVD, and UKPDS risk scores (Table 4). This decline was most pronounced among people with diagnosed diabetes (ranging from −3.2 [ASCVD] to −6.7 [UKPDS] ppt]) compared to undiagnosed (ranging from −1.4 [ASCVD] to −4.4 [UKPDS] ppt), prediabetes (ranging from −1.9 [ASCVD] to −2.7 [UKPDS] ppt), and normoglycemic adults (approximately 1.0 ppt). History of previous myocardial infarction and previous stroke have largely remained stable for every group over time. Excluding adults with CVD history, CVD event risk estimates and declines were no different over time (Appendix C). Estimates and trends were consistent across all definitions of prediabetes (Appendix D).
Table 4.
Trends in estimates of cardiovascular event risk, prevalence of myocardial infarction, and prevalence of strokes in U.S. adults aged ≥ 18 years by glycemic status, NHANES 1988 to 2014
| 1988–1994 | 1999–2004 | 2005–2010 | 2011–2014 | Δ from 88–94 to 11–14 |
P interaction | |
|---|---|---|---|---|---|---|
| n=8007 | n=6640 | n=7861 | n=5463 | P trend | ||
| 10-yr CVD risk | ||||||
| Framingham | <0.001 | |||||
| Diagnosed diabetes | 16.5 (15.2–17.7) | 14.0 (13.3–14.6) | 11.2 (10.6–11.7) | 11.3 (10.4–12.1) | −5.2 (−6.8, −3.6) | <0.001 |
| Undiagnosed diabetes | 10.4 (9.4–11.4) | 8.8 (8–9.7) | 6.3 (5.6–7.0) | 7.7 (5.7–9.8) | −2.7 (−4.9, −0.5) | 0.003 |
| Prediabetes | 7.7 (7.3–8.1) | 6.8 (6.5–7.0) | 5.6 (5.3–5.8) | 5.4 (5.1–5.7) | −2.3 (−2.9, −1.7) | <0.001 |
| Normal glycemic status | 5.8 (5.5–6.0) | 5.6 (5.5–5.8) | 5.0 (4.8–5.1) | 5.0 (4.8–5.2) | −0.8 (−1.0, −0.6) | <0.001 |
| UKPDS | <0.001 | |||||
| Diagnosed diabetes | 19.9 (17.7–22.1) | 16.4 (15.2–17.6) | 12.1 (11.3–12.9) | 13.2 (11.6–14.8) | −6.7 (−9.2, −4.2) | <0.001 |
| Undiagnosed diabetes | 15.5 (13.8–17.1) | 13.6 (11.2–16.0) | 10.3 (8.6–12.0) | 11.0 (8.3–13.7) | −4.4 (−7.5, −1.3) | 0.001 |
| Prediabetes | 8.9 (8.2–9.5) | 7.7 (7.4–8.1) | 6.3 (6.0–6.6) | 6.1 (5.7–6.6) | −2.7 (−3.5, −1.9) | <0.001 |
| Normal glycemic status | 6.2 (5.9–6.5) | 6.0 (5.8–6.3) | 5.3 (5.1–5.5) | 5.3 (5.1–5.5) | −0.9 (−1.3, −0.5) | <0.001 |
| ASCVD | 0.046 | |||||
| Diagnosed diabetes | 20.8 (19.2–22.3) | 19.5 (18.2–20.8) | 17.9 (16.7–19.1) | 17.6 (16.2–19.0) | −3.2 (−5.2, −1.2) | 0.001 |
| Undiagnosed diabetes | 20.7 (18.4–23.0) | 19.6 (17.3–21.9) | 18.8 (16.7–20.8) | 19.3 (14.0–24.7) | −1.4 (−7.1, 4.3) | 0.580 |
| Prediabetes | 8.9 (8.3–9.4) | 8.7 (8.2–9.2) | 7.2 (6.7–7.7) | 6.9 (6.4–7.4) | −1.9 (−2.5, −1.3) | <0.001 |
| Normal glycemic status | 7.2 (6.8–7.6) | 7.4 (7.1–7.7) | 6.5 (6.1–6.9) | 6.3 (5.9–6.7) | −0.9 (−1.3, −0.5) | <0.001 |
| Previous MI | 0.609 | |||||
| Diagnosed diabetes | 8.4 (7.0–10.1) | 7.2 (5.8–8.9) | 7.1 (6.0–8.5) | 6.7 (5.5–8.3) | −1.7 (−3.9, 0.5) | 0.101 |
| Undiagnosed diabetes | 4.9 (2.9–8.1) | 5.5 (3.3–9.0) | 4.6 (2.7–7.5) | 6.4 (3.5–11.5) | +1.6 (−2.9, 6.1) | 0.600 |
| Prediabetes | 3.6 (2.8–4.6) | 3.4 (2.8–4.2) | 3.8 (3.2–4.6) | 3.6 (2.5–5.2) | 0.0 (−1.6, 1.6) | 0.874 |
| Normal glycemic status | 2.7 (1.9–3.7) | 2.4 (1.7–3.2) | 1.9 (1.4–2.8) | 1.5 (1.0–2.2) | −1.2 (−2.2, −0.2) | 0.014 |
| Previous Stroke | 0.445 | |||||
| Diagnosed diabetes | 5.6 (4.4–7.2) | 4.8 (3.8–6.0) | 6.1 (5.1–7.2) | 5.3 (4.2–6.7) | −0.3 (−2.1, 1.5) | 0.907 |
| Undiagnosed diabetes | 3.0 (2.0-4.4) | 3.2 (1.7–6.1) | 2.1 (1.0-4.5) | 3.5 (1.8–6.6) | +0.5 (−2.0, 3.0) | 0.955 |
| Prediabetes | 2.2 (1.5–3.0) | 2.4 (1.9–3.1) | 2.5 (1.9–3.2) | 2.5 (1.8–3.4) | +0.4 (-0.6, 1.4) | 0.505 |
| Normal glycemic status | 1.3 (0.9–2.0) | 2.4 (1.7–3.2) | 2.2 (1.5–3.1) | 2.4 (1.7–3.5) | +1.1 (0.1, 2.1) | 0.048 |
NHANES, National Health and Nutrition Examinations Surveys; CVD, cardiovascular disease; UKPDS, United Kingdom Prospective Diabetes Study; ASCVD, Atherosclerotic Cardiovascular Disease guidelines (from American Heart Association and American College of Cardiology); MI, myocardial infarction; yr, year; FPG, fasting plasma glucose
10-yr CVD risk calculated using Framingham, UKPDS, and ASCVD risk scores
All analyses adjusted for age, sex, and race/ethnicity
P for trend: Calculated for each glycemic status group by including a continuous variable for the midpoint of each survey period in logistic regression models; significant values indicated variation over time within glycemic groups
P for interaction: significant P-values indicated varying associations between prevalence estimates over time across glycemic groups
Overall, there was no change in prevalence of any CKD for those with diagnosed or undiagnosed diabetes or prediabetes; only adults with normal glycemia experienced a 3.4ppt increase over time (Table 5). Patterns by specific CKD markers varied by group over time: for example, median ACR increased in every group except in those with diagnosed diabetes, where a statistically significant reduction was seen. Glomerular filtration declined in all groups, and significantly among those with diagnosed diabetes and normal glycemia. Across all definitions of prediabetes, prevalence estimates and trends were consistent (Appendix E).
Table 5.
Trends in diabetic renal disease markers in U.S. adults aged ≥ 18 years by glycemic status, NHANES 1988 to 2014
| 1988–1994 | 1999–2004 | 2005–2010 | 2011–2014 | Δ from 88–94 to 11–14 |
P interaction | |
|---|---|---|---|---|---|---|
| n=8007 | n=6640 | n=7861 | n=5463 | P trend | ||
| Any CKD | 0.038 | |||||
| Diagnosed diabetes | 30.3 (26.2–34.7) | 31.8 (29.0–34.7) | 29.6 (27.1–32.1) | 29.6 (26.2–33.3) | −0.7 (−6.0, 4.6) | 0.612 |
| Undiagnosed diabetes | 22.1 (18.1–26.7) | 31.1 (23.9–39.2) | 19.9 (15.9–24.7) | 20.4 (13.8–29.2) | −1.7 (−10.3, 6.9) | 0.283 |
| Prediabetes | 12.4 (10.6–14.4) | 13.1 (11.4–15.1) | 12.4 (10.9–14.2) | 11.4 (9.9–13.1) | −1.0 (−3.4, 1.4) | 0.353 |
| Normal glycemic status | 7.0 (5.9–8.2) | 9.4 (8.4–10.6) | 9.2 (7.9–10.7) | 10.4 (8.7–12.4) | +3.4 (1.2, 5.6) | 0.002 |
| ACR≥=30 | 0.001 | |||||
| Diagnosed diabetes | 29.9 (26.3–33.8) | 27.1 (24.4–30.0) | 24.5 (22.3–26.8) | 23.8 (20.7–27.3) | −6.1 (−10.8, −1.4) | 0.005 |
| Undiagnosed diabetes | 16.5 (13.0–20.6) | 25.3 (18.5–33.6) | 16.7 (13.3–20.7) | 17.5 (11.3–25.9) | 1.0 (−7.0, 9.0) | 0.729 |
| Prediabetes | 9.3 (7.7–11.2) | 9.1 (7.8–10.6) | 8.9 (7.7–10.3) | 7.7 (6.8–8.8) | −1.6 (−3.6, 0.4) | 0.118 |
| Normal glycemic status | 5.2 (4.4–6.2) | 6.2 (5.3–7.3) | 6.4 (5.3–7.6) | 7.5 (6.1–9.3) | +2.3 (0.5, 4.1) | 0.010 |
| Median ACR | ** | |||||
| Diagnosed diabetes | 22.0 (16.4–27.6) | 18.9 (14.2–23.6) | 19.6 (15.2–24.1) | 18.5 (15.8–21.2) | −3.5 (−6.3, −0.6) | 0.015 |
| Undiagnosed diabetes | 14.0 (6.1–20.0) | 18.1 (10.2–27.1) | 16.8 (9.0–22.7) | 16.6 (11.8–19.9) | 2.6 (−0.1, 5.7) | ** |
| Prediabetes | 10.4 (9.3–11.4) | 10.6 (9.5–11.6) | 10.6 (9.6–11.6) | 11.0 (10.4–11.7) | 0.7 (0.3, 1.1) | 0.004 |
| Normal glycemic status | 10.0 (9.0–11.0) | 9.7 (8.7–10.7) | 10.0 (9.1–11.0) | 10.7 (10.0–11.4) | 0.7 (0.4, 0.9) | <0.001 |
| eGFR<60 | 0.002 | |||||
| Diagnosed diabetes | 7.7 (5.9–9.9) | 9.5 (8.2–10.9) | 10.2 (8.9–11.6) | 11.8 (10.4–13.3) | +4.1 (1.7, 6.5) | 0.002 |
| Undiagnosed diabetes | 7.1 (5.1–9.9) | 8.0 (5.8–10.8) | 6.2 (4.7–8.1) | 6.8 (4.3–10.4) | −0.4 (−4.1, 3.3) | 0.622 |
| Prediabetes | 4.7 (3.9–5.5) | 5.7 (4.7–6.9) | 5.0 (4.3–5.9) | 4.6 (3.7–5.9) | 0.0 (−1.4, 1.4) | 0.769 |
| Normal glycemic status | 2.2 (1.8–2.8) | 5.1 (4.2–6.2) | 4.3 (3.4–5.3) | 3.8 (2.8–5.0) | +1.5 (0.3, 2.7) | 0.013 |
| Mean eGFR | <0.001 | |||||
| Diagnosed diabetes | 96.1 (93.7–98.4) | 92 (90.6–93.3) | 92.0 (90.5–93.5) | 90.4 (88.4–92.5) | −5.7 (−8.8, −2.6) | 0.001 |
| Undiagnosed diabetes | 97.0 (94.0–100.0) | 98.1 (94.6–101.5) | 96.0 (93.3–98.7) | 102 (96.9–107.2) | 5.0 (−0.9, 10.9) | 0.162 |
| Prediabetes | 96.1 (94.5–97.7) | 91.4 (90.1–92.7) | 94.4 (93.5–95.4) | 94.0 (92.4–95.6) | −2.1 (−4.3, 0.1) | 0.335 |
| Normal glycemic status | 99.4 (97.9–100.9) | 92.3 (91.2–93.3) | 94.8 (93.8–95.8) | 94.7 (93.3–96.1) | −4.7 (−6.8, −2.6) | <0.001 |
| Hyperfiltration | 0.269 | |||||
| Diagnosed diabetes | 13.6 (8.9–20.3) | 5.8 (4.4–7.7) | 7.6 (5.9–9.8) | 7.2 (5.3–9.7) | −6.4 (−12.5, −0.3) | 0.042 |
| Undiagnosed diabetes | 7.3 (3.5–14.4) | 14.5 (8.9–22.8) | 8.2 (5.4–12.3) | 12.0 (6.5–21.1) | 4.7 (−4.0, 13.4) | 0.523 |
| Prediabetes | 5.2 (3.9–6.9) | 3.3 (2.4–4.4) | 3.8 (3.0–4.8) | 4.3 (3.2–5.7) | −0.9 (−2.9, 1.1) | 0.500 |
| Normal glycemic status | 6.1 (4.9–7.5) | 3.8 (3.2–4.6) | 4.5 (3.8–5.2) | 4.4 (3.7–5.3) | −1.7 (−3.1, −0.3) | 0.068 |
NHANES, National Health and Nutrition Examinations Surveys; yr, year; FPG, fasting plasma glucose; ACR, albumin-creatinine ratio; eGFR, estimated glomerular filtration rate
Any CKD refers to either of: urine ACR>=30 and/or eGFR<60
Hyperfiltration defined as GFR>=135 ml/min/1.73m2
All analyses adjusted for age, sex, and race/ethnicity
P for trend: Calculated for each glycemic status group by including a continuous variable for the midpoint of each survey period in logistic regression models; significant values indicated variation over time within glycemic groups
P for interaction: significant P-values indicated varying associations between prevalence estimates over time across glycemic groups
Relative standard error >30% indicates that estimate may be unreliable
DISCUSSION
Using sensitive and specific definitions, in the 2011–2014 period, over one third of US adults with impaired fasting glucose or elevated A1c levels had hypertension, over half had dyslipidemia, and over a quarter smoked. Approximately 12% had some form of CKD, 6% reported a previous myocardial infarction or stroke, and average 10-year CVD event risk was approximately 6%. The absolute number of people with prediabetes in the US varied widely based on the definition used. However, even with the most sensitive definitions, the prevalence of cardio-renal risks and co-morbidities remained the same; this implies that the absolute volume of people affected by these co-morbidities outnumbered those with diabetes and similar risks or co-morbidities. Our data also show much room for improvement among people with prediabetes, especially for lipid-lowering where only about 40% of those with dyslipidemia were receiving treatment.
Adjusted for age, sex, and race/ethnicity differences over time and compared to other glycemic groups, adults with diagnosed diabetes have benefited from more BP- and lipid-lowering treatment; exhibited greater BP and lipid control in every survey period since 1988–1994; and experienced impressive declines in ten-year probability of having a CVD event. Over the years, despite an increase in the average duration of diabetes –a major risk factor for diabetes complications, itself– there have been no changes in prevalence of myocardial infarction, stroke, or renal impairment. Longer diabetes duration with similar mean age and prevalence of complications may imply that diabetes is being diagnosed earlier in the disease process or care received by diagnosed diabetic adults may be counteracting the influence of longer diabetes duration, or both.
In the context of ongoing debates about “medicalizing” prediabetes, these data contribute some thought- provoking considerations. First, even if one contends that rates of progression from prediabetes to diabetes are not especially high, our data show that the proportions and absolute numbers of people affected by risk factors and cardio-renal co-morbidities are concerning. Other data corroborate associations between prediabetes and cardio-renal complications.(22, 23) Furthermore, per capita health expenditures for adults with prediabetes are higher than expenditures in the general public and grow when people progress to diabetes.(24) Given that there were also contentions regarding lower (e.g., FPG≥100mg/dl [5.6mmol/L]) versus higher diagnostic thresholds (FPG≥110mg/dl [6.0mmol/L]), we examined a range of cutpoints and noted similar findings, albeit the absolute numbers with prediabetes were smaller and the proportions affected by cardio-renal risks and co-morbidities were higher when we used more specific definitions. With regard to medicalization leading to treatment, gaps in use of lipid-lowering medications in people with prediabetes were large. These may reflect physician apprehension given the added risk of diabetes with statin use;(25) the CVD risk reduction benefits –especially for primary prevention– versus the increased risk of diabetes of statins –especially among people with prediabetes– remains a contentious issue.(26)
Second, in the case of diabetes, our data suggest that diagnosed diabetes status was associated with significantly greater treatment and achievement of BP and cholesterol care goals. Previous studies have also shown improvements in achievement of diabetes care goals(27) and, in parallel, more impressive declines in macrovascular disease –especially myocardial infarction and stroke– in people with diabetes than no diabetes between 1990 and 2010.(28) Persons with diagnosed diabetes may have received more attentive care, treatments, and focus on achieving care goals. Another consideration to contextualize our findings is that diagnosis may be occurring earlier over time. There may be lessons here for cases of undiagnosed diabetes and prediabetes. Only one in ten people with prediabetes is aware of his/her elevated glucose,(29) and, as was the case for diagnosed diabetes, identification might prompt earlier treatments for their co-morbidities to lower cardio-renal risk.
Third, and foremost, earlier intervention is beneficial. Robust randomized controlled trials in multiple countries have shown that intensive LSM (eating fiber rich foods, being physically active, and managing weight) for people with impaired glucose tolerance can slow progression to diabetes,(30, 31) and are associated with numerous other benefits (regression to normoglycemia in a third of cases;(32) lower need for BP- and lipid-lowering medications;(33) lower disability; less obstructive sleep apneas; less retinopathy; and less urinary incontinence(34)). In the Diabetes Prevention Program study, intensive LSM was provided to placebo and metformin study groups upon discontinuation of the randomized trial at 2.8years, and still, cumulative diabetes incidence in the original LSM group remained 34% and 27% lower even 10 and 15years after randomization, respectively.(30) In addition, long-term reductions in all afore-mentioned conditions, albeit small due to both arms being exposed to the intervention, remained greater in the intervention arm. This is strong proof that the earlier the intervention is started, the higher the likelihood of delaying progression and associated costs.
It is important to clarify that we are not endorsing earlier initiation of glucose-lowering medications to “prevent” diabetes – recent aggregated data showed that these have no impact on the pathophysiology of diabetes and only serve to suppress glucose for the period they are taken.(35) Earlier intervention with LSM, on the other hand, has enduring benefits and are associated with collateral benefits such as reductions in BP and cholesterol,(36) less need for medications,(37) and possibly less CKD.(38) LSM interventions might also offer a promising opportunity to preserve quality of life for longer as declines in excess diabetes-related mortality has led to an expansion in the number of years that people with diabetes live with disabilities;(39) earlier intervention might help shift the distribution of disease and disability later, which may also lower long-term costs.
Efforts to identify diabetes earlier may be buoyed by recent modifications to the US Preventive Services Task Force diabetes screening guideline, which recommends screening all adults aged 40–70 years who are overweight or obese.(40) The new standards may be more sensitive than previous recommendations as they include the added value of identifying prediabetes earlier as an opportunity to modify disease trajectory.
This study has some limitations. We used successive surveys which offer important snapshots, but only reflect the risk profile of the population at the time of survey. The cross-sectional design is limited in terms of our ability to truly evaluate longitudinal associations between prediabetes and excess risk of cardiovascular and renal diseases over time; this is the purview of prospective cohort studies. That said, our study provides valuable information on prevalence of cardio-renal risks and calculated levels of early organ damage for US adults for each glycemic group. Definitions of glycemic groups may not meet more strict clinical criteria of separate, repeated measures to classify glycemic status. This may have resulted in overestimates of diabetes and prediabetes; still, single measure definitions are commonly used in epidemiologic studies and were consistently applied across surveys making our findings regarding trends internally valid. We defined prediabetes using FPG and HbA1c, but not 2-hour postprandial glucose as it is logistically challenging to collect these samples in large epidemiological studies. As such, our estimates of prediabetes are lower than if impaired glucose tolerance (IGT) were included, and indeed, there is evidence that IGT is more strongly related to cardio-renal risks and disease; as such, our estimates are likely conservative. For BP and lipid control, denominators (those with hypertension or dyslipidemia) may be subject to ascertainment bias; to provide a more comprehensive interpretation of this, we examined mean BP and lipid levels for all glycemic groups irrespective of diagnostic status and also among those with hypertension and dyslipidemia separately. Medications to lower BP are used for non-hypertension reasons such as migraine headache prophylaxis and this may have affected our estimates of hypertension prevalence and control, albeit by a small amount. Self-reported data may be subject to recall and social desirability biases.
In terms of strengths, our analyses included US adults across the spectrum of glycemia and offers perspectives from successive nationally representative surveys on risk factors, treatment, adherence, and complications profiles. We adjusted all estimates to remove the influence of differences and changes in age, sex, and race/ethnicity across glycemic groups over time. We used non-HDL cholesterol levels instead of total or LDL-cholesterol fractions so that there was no exclusion of non-fasted individuals and non-HDL cholesterol is also gaining recognition in clinical practice. Also, we used categorical (e.g., treated vs. not), continuous (e.g., mean BP), and global (e.g., older and contemporary CVD risk estimators) performance indicators to provide a comprehensive picture of trends over time.
The absolute number of adults with prediabetesis large, no matter which definitions are used. More importantly, substantial portions of these adults have co-morbid cardio-renal risk factors and disease. These data call for a less diabetes-centric view of prediabetes and instead conceptualize detection as an opportunity for early intervention; i.e. identifying and addressing prediabetes and related cardio-renal risk factors and co-morbidities is an investment in broader population cardio-metabolic health.
Supplementary Material
RESEARCH IN CONTEXT.
Evidence before this study
Despite meta-analyses and randomized clinical trials showing that people with prediabetes have 5–10 times faster progression to diabetes than the general public, critics argue that not all individuals with prediabetes develop diabetes and that labeling them unnecessarily medicalizes these people.
Added value of this study
To our knowledge, this is the first study to examine the overall cardio-metabolic profiles of adults with prediabetes. Using data from successive nationally-representative cross-sectional U.S. surveys from the early 1990’s, our study shows growth in cardiac and renal risk factors and diseases in people with prediabetes, some improvements in treatment of blood pressure and cholesterol, and reductions in smoking. Our study is also the first to compare these trends over time with those seen in people with diagnosed and undiagnosed diabetes, and those without any glucose regulation abnormalities.
Implications of all the available evidence
Prediabetes is exceedingly common and approximately half of these people have co-morbidities like hypertension, dyslipidemia, or both, leading to excess cardiovascular and renal disease risk. These findings did not change with different definitions of prediabetes. Furthermore, compared to people with prediabetes, undiagnosed diabetes, or no glycemic abnormalities, people with diagnosed diabetes have enjoyed a much higher likelihood of receiving blood pressure- and cholesterol-lowering treatments and declining incidence of macrovascular complications over time. Given the vast numbers of people with prediabetes, even if identification of glucose abnormalities resulted in marginally greater engagement in healthy behaviors and treatment of co-morbidities like blood pressure, cholesterol, and smoking cessation, it is likely that population cardio-metabolic and renal health would improve.
ACKNOWLEDGEMENTS
Data were collected by the National Center for Health Statistics of the Centers for Disease Control and Prevention.
MKA is partially supported by the Georgia Center for Diabetes Translation Research funded by the National Institute of Diabetes and Digestive and Kidney Diseases (P30DK111024).
Footnotes
The findings and conclusions in this report are those of the authors and do not necessarily represent the official position of the US Centers for Disease Control and Prevention.
DECLARATION OF INTERESTS
We declare no competing interests.
REFERENCES
- 1.Yudkin JS, Montori VM. The epidemic of pre-diabetes: the medicine and the politics. BMJ : British Medical Journal. 2014;349. [DOI] [PMC free article] [PubMed] [Google Scholar]
- 2.Gerstein HC, Santaguida P, Raina P, Morrison KM, Balion C, Hunt D, et al. Annual incidence and relative risk of diabetes in people with various categories of dysglycemia: a systematic overview and meta-analysis of prospective studies. Diabetes Res Clin Pract. 2007;78(3):305–12. [DOI] [PubMed] [Google Scholar]
- 3.Morris DH, Khunti K, Achana F, Srinivasan B, Gray LJ, Davies MJ, et al. Progression rates from HbAlc 6.0–6.4% and other prediabetes definitions to type 2 diabetes: a meta-analysis. Diabetologia. 2013;56(7):1489–93. [DOI] [PubMed] [Google Scholar]
- 4.Knowler WC, Barrett-Connor E, Fowler SE, Hamman RF, Lachin JM, Walker EA, et al. Reduction in the incidence of type 2 diabetes with lifestyle intervention or metformin. N Engl J Med. 2002;346(6):393–403. [DOI] [PMC free article] [PubMed] [Google Scholar]
- 5.Tuomilehto J, Lindstrom J, Eriksson JG, Valle TT, Hamalainen H, Ilanne-Parikka P, et al. Prevention of type 2 diabetes mellitus by changes in lifestyle among subjects with impaired glucose tolerance. N Engl J Med. 2001;344(18):1343–50. [DOI] [PubMed] [Google Scholar]
- 6.The Emerging Risk Factors C. Glycated hemoglobin measurement and prediction of cardiovascular disease. JAMA. 2014;311(12):1225–33. [DOI] [PMC free article] [PubMed] [Google Scholar]
- 7.Holman RR, Paul SK, Bethel MA, Matthews DR, Neil HA. 10-year follow-up of intensive glucose control in type 2 diabetes. N Engl J Med. 2008;359(15):1577–89. [DOI] [PubMed] [Google Scholar]
- 8.Kearney PM, Blackwell L, Collins R, Keech A, Simes J, Peto R, et al. Efficacy of cholesterol-lowering therapy in 18,686 people with diabetes in 14 randomised trials of statins: a meta-analysis. Lancet (London, England). 2008;371(9607):117–25. [DOI] [PubMed] [Google Scholar]
- 9.Blood Pressure Lowering Treatment Trialists C. Effects of Different Blood Pressure-Lowering Regimens on Major Cardiovascular Events in Individuals With and Without Diabetes Mellitus: Results of Prospectively Designed Overviews of Randomized Trials. Arch Intern Med. 2005;165(12):1410–9. [DOI] [PubMed] [Google Scholar]
- 10.Saaddine JB, Engelgau MM, Beckles GL, Gregg EW, Thompson TJ, Narayan KM. A diabetes report card for the United States: quality of care in the 1990s. Ann Intern Med. 2002;136(8):565–74. [DOI] [PubMed] [Google Scholar]
- 11.Ali MK, Bullard KM, Saaddine JB, Cowie CC, Imperatore G, Gregg EW. Achievement of goals in U.S. diabetes care, 1999–2010. N Engl J Med. 2013;368(17):1613–24. [DOI] [PubMed] [Google Scholar]
- 12.Centers for Disease Control and Prevention. National Center for Health Statistics (NCHS). National Health and Nutrition Examination Survey: Questionnaires, Datasets, and Related Documentation [Hyattsville, MD]. Available from: http://www.cdc.gov/nchs/nhanes/nhanes_questionnaires.htm.
- 13.Centers for Disease Control and Prevention Web Site. National Center for Health Statistics (NCHS). National Health and Nutrition Examination Survey: NHANES Laboratory Data [Hyattsville, MD]. Available from: https://wwwn.cdc.gov/Nchs/Nhanes/Search/DataPage.aspx?Component=Laboratory.
- 14.U.S. Census Bureau. Poverty [Washington, DC]. Available from: http://www.census.gov/hhes/www/poverty/index.html.
- 15.Chobanian AV, Bakris GL, Black HR, Cushman WC, Green LA, Izzo JL, Jr., et al. Seventh report of the Joint National Committee on Prevention, Detection, Evaluation, and Treatment of High Blood Pressure. Hypertension. 2003;42(6):1206–52. [DOI] [PubMed] [Google Scholar]
- 16.American Diabetes Association. 8. Cardiovascular Disease and Risk Management. Diabetes Care. 2016;39(Supplement 1):S60–S71. [DOI] [PubMed] [Google Scholar]
- 17.D’Agostino RB Sr., Vasan RS, Pencina MJ, Wolf PA, Cobain M, Massaro JM, et al. General cardiovascular risk profile for use in primary care: the Framingham Heart Study. Circulation. 2008;117(6):743–53. [DOI] [PubMed] [Google Scholar]
- 18.Stevens RJ, Kothari V, Adler AI, Stratton IM. The UKPDS risk engine: a model for the risk of coronary heart disease in Type II diabetes (UKPDS 56). Clin Sci (Lond). 2001;101(6):671–9. [PubMed] [Google Scholar]
- 19.Goff DC, Lloyd-Jones DM, Bennett G, Coady S, D’Agostino RB, Gibbons R, et al. 2013 ACC/AHA Guideline on the Assessment of Cardiovascular Risk. A Report of the American College of Cardiology/American Heart Association Task Force on Practice Guidelines. 2013. [DOI] [PMC free article] [PubMed] [Google Scholar]
- 20.Levey AS, Stevens LA, Schmid CH, Zhang YL, Castro AF, 3rd, Feldman HI, et al. A new equation to estimate glomerular filtration rate. Ann Intern Med. 2009;150(9):604–12. [DOI] [PMC free article] [PubMed] [Google Scholar]
- 21.Cachat F, Combescure C, Cauderay M, Girardin E, Chehade H. A systematic review of glomerular hyperfiltration assessment and definition in the medical literature. Clin J Am Soc Nephrol. 2015;10(3):382–9. [DOI] [PMC free article] [PubMed] [Google Scholar]
- 22.Huang Y, Cai X, Mai W, Li M, Hu Y. Association between prediabetes and risk of cardiovascular disease and all cause mortality: systematic review and meta-analysis. BMJ. 2016;355. [DOI] [PMC free article] [PubMed] [Google Scholar]
- 23.Plantinga LC, Crews DC, Coresh J, Miller ER, Saran R, Yee J, et al. Prevalence of Chronic Kidney Disease in US Adults with Undiagnosed Diabetes or Prediabetes. Clinical Journal of the American Society of Nephrology. 2010;5(4):673–82. [DOI] [PMC free article] [PubMed] [Google Scholar]
- 24.Dall TM, Yang W, Halder P, Pang B, Massoudi M, Wintfeld N, et al. The Economic Burden of Elevated Blood Glucose Levels in 2012: Diagnosed and Undiagnosed Diabetes, Gestational Diabetes Mellitus, and Prediabetes. Diabetes Care. 2014;37(12):3172–9. [DOI] [PubMed] [Google Scholar]
- 25.Sattar N, Preiss D, Murray HM, Welsh P, Buckley BM, de Craen AJ, et al. Statins and risk of incident diabetes: a collaborative meta-analysis of randomised statin trials. Lancet (London, England). 2010;375(9716):735–42. [DOI] [PubMed] [Google Scholar]
- 26.Ebrahim S, Taylor FC, Brindle P. Statins for the primary prevention of cardiovascular disease. BMJ : British Medical Journal. 2014;348. [DOI] [PubMed] [Google Scholar]
- 27.National Committee for Quality Assurance. The State of Health Care Quality Reports [Available from: http://www.ncqa.org/report-cards/health-plans/state-of-health-care-quality.
- 28.Gregg EW, Li Y, Wang J, Burrows NR, Ali MK, Rolka D, et al. Changes in diabetes-related complications in the United States, 1990–2010. N Engl J Med. 2014;370(16):1514–23. [DOI] [PubMed] [Google Scholar]
- 29.Li Y, Geiss LS, Burrows NR, Rolka DB, Albright A. Awareness of Prediabetes - United States, 2005–2010. Morbidity and Mortality Weekly. March 22, 2013;62(11):209–12. [PMC free article] [PubMed] [Google Scholar]
- 30.Diabetes Prevention Program Research Group. Long-term effects of lifestyle intervention or metformin on diabetes development and microvascular complications over 15-year follow-up: the Diabetes Prevention Program Outcomes Study. The Lancet Diabetes & Endocrinology. 2015;3(11):866–75. [DOI] [PMC free article] [PubMed] [Google Scholar]
- 31.Li G, Zhang P, Wang J, An Y, Gong Q, Gregg EW, et al. Cardiovascular mortality, all-cause mortality, and diabetes incidence after lifestyle intervention for people with impaired glucose tolerance in the Da Qing Diabetes Prevention Study: a 23-year follow-up study. The Lancet Diabetes & Endocrinology. 2014;2(6):474–80. [DOI] [PubMed] [Google Scholar]
- 32.Perreault L, Kahn SE, Christophi CA, Knowler WC, Hamman RF. Regression from pre-diabetes to normal glucose regulation in the diabetes prevention program. Diabetes Care. 2009;32(9):1583–8. [DOI] [PMC free article] [PubMed] [Google Scholar]
- 33.Diabetes Prevention Program Outcomes Study Research Group, Orchard TJ, Temprosa M, Barrett-Connor E, Fowler S, Goldberg R, et al. Long-term effects of the Diabetes Prevention Program interventions on cardiovascular risk factors: a report from the DPP Outcomes Study. Diabetic medicine : a journal of the British Diabetic Association. 2013;30(1):46–55. [DOI] [PMC free article] [PubMed] [Google Scholar]
- 34.Brown JS, Wing R, Barrett-Connor E, Nyberg LM, Kusek JW, Orchard TJ, et al. Lifestyle Intervention Is Associated With Lower Prevalence of Urinary Incontinence. The Diabetes Prevention Program. 2006;29(2):385–90. [DOI] [PMC free article] [PubMed] [Google Scholar]
- 35.Haw J, Galaviz KI, Straus AN, et al. Long-term sustainability of diabetes prevention approaches: A systematic review and meta-analysis of randomized clinical trials. JAMA Internal Medicine. 2017;177(12):1808–17. [DOI] [PMC free article] [PubMed] [Google Scholar]
- 36.Mudaliar U, Zabetian A, Goodman M, Echouffo-Tcheugui JB, Albright AL, Gregg EW, et al. Cardiometabolic Risk Factor Changes Observed in Diabetes Prevention Programs in US Settings: A Systematic Review and Meta-analysis. PLoS Med. 2016;13(7):e1002095. [DOI] [PMC free article] [PubMed] [Google Scholar]
- 37.Uusitupa M, Peltonen M, Lindström J, Aunola S, Ilanne-Parikka P, Keinänen-Kiukaanniemi S, et al. Ten-Year Mortality and Cardiovascular Morbidity in the Finnish Diabetes Prevention Study—Secondary Analysis of the Randomized Trial. PLoS ONE. 2009;4(5):e5656. [DOI] [PMC free article] [PubMed] [Google Scholar]
- 38.Balk EM, Earley A, Raman G, Avendano EA, Pittas AG, Remington PL. Combined diet and physical activity promotion programs to prevent type 2 diabetes among persons at increased risk: A systematic review for the community preventive services task force. Annals of Internal Medicine. 2015;163(6):437–51. [DOI] [PMC free article] [PubMed] [Google Scholar]
- 39.Bardenheier BH, Lin J, Zhuo X, Ali MK, Thompson TJ, Cheng YJ, et al. Disability-Free Life-Years Lost Among Adults Aged >/=50 Years With and Without Diabetes. Diabetes Care. 2016;39(7):1222–9. [DOI] [PMC free article] [PubMed] [Google Scholar]
- 40.Siu AL. Screening for Abnormal Blood Glucose and Type 2 Diabetes Mellitus: U.S. Preventive Services Task Force Recommendation StatementScreening for Abnormal Blood Glucose and Type 2 Diabetes Mellitus. Annals of internal medicine. 2015;163(11):861–8. [DOI] [PubMed] [Google Scholar]
Associated Data
This section collects any data citations, data availability statements, or supplementary materials included in this article.