

Abstract
Transcriptome-wide association studies using predicted expression have identified thousands of genes whose locally regulated expression is associated with complex traits and diseases. In this work, we show that linkage disequilibrium induces significant gene-trait associations at non-causal genes as a function of the expression quantitative trait loci weights used in expression prediction. We introduce a probabilistic framework that models correlation among transcriptome-wide association study signals to assign a probability for every gene in the risk region to explain the observed association signal. Importantly, our approach remains accurate when expression data for causal genes are not available in the causal tissue by leveraging expression prediction from other tissues. Our approach yields credible sets of genes containing the causal gene at a nominal confidence level (for example, 90%) that can be used to prioritize genes for functional assays. We illustrate our approach by using an integrative analysis of lipid traits, where our approach prioritizes genes with strong evidence for causality.
Transcriptome-wide association studies (TWASs) using predicted expression levels have been proposed as an approach to identify novel genomic risk regions and putative risk genes involved in complex traits and diseases1–3. Since TWAS based on predicted expression relies on only the genetic component of expression, it can be viewed as a test for non-zero local genetic correlation between expression and trait1,4,5. Significant genetic correlation in this setting is often interpreted as an estimate of the effect of SNPs on a trait mediated by the gene of interest. However, this interpretation requires very strong assumptions that are probably violated in empirical data due to linkage disequilibrium (LD) and/or pleiotropic SNP effects1–3,6–11. Therefore, TWAS has been mostly utilized as a test of association, in contrast to methods that attempt to directly estimate the mediated effect (that is, Mendelian randomization3,6–9).
In this work, we show that the gene–trait association statistics from TWAS at a known risk region are correlated as a function of LD among SNPs and expression quantitative trait loci (eQTL) weights used in the prediction models. The effect is similar to LD tagging in genome-wide association studies (GWASs) where LD within a region induces associations at tag SNPs (yielding the traditional Manhattan-style plots). Even in the simplest case where a single SNP causally impacts the expression of a gene, which in turn causally impacts a trait, LD among SNPs used in the eQTL prediction models induces significant gene-trait associations at nearby non-causal genes in the region. The tagging effect is further exacerbated in the presence of multiple causal SNPs and genes. As an illustrative example, consider a risk region with six genes where a single SNP is causal for a single gene which impacts the trait (Fig. 1). Although genes 3 and 4 in Fig. 1 have non-overlapping prediction weights due to different eQTL genetic regulation, LD among SNPs with non-zero prediction weights induces correlations in the TWAS statistics at genes 3 and 4. Estimating the correlation structure of predicted expression among nearby genes enables statistical fine-mapping over gene–trait associations. However, several confounding factors can bias inference. First, there is a body of evidence supporting horizontal pleiotropic effects from SNPs8,11,12, which bias gene–trait association statistics. Second, it is critical that TWAS fine-mapping approaches maintain robustness when the causal mechanism is not steady-state levels of gene expression10. Fine-mapping in these instances without controlling for confounding could prioritize non-causal genes.
Fig. 1 |. Illustration of the induced correlation structure for predicted expression.
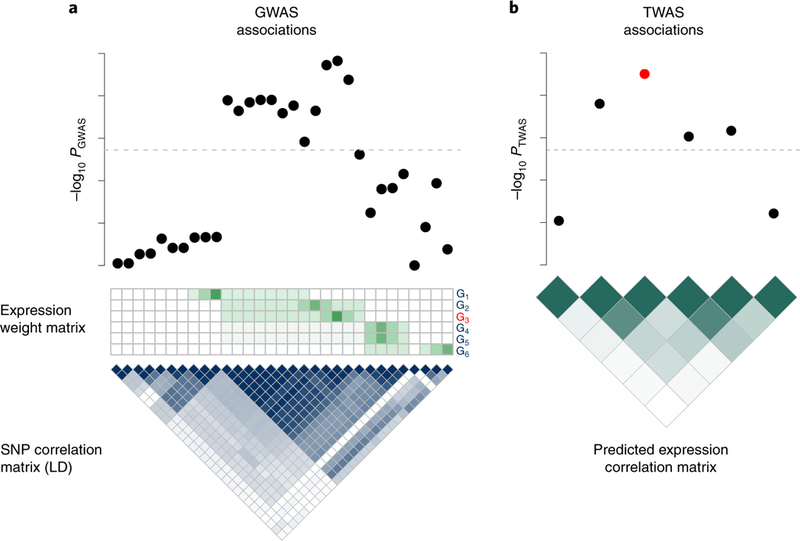
a, Top: Manhattan plot indicating strength of SNP association with trait. Middle: Expression weight matrix for six genes in the region, with the causal gene indicated in red. Each row corresponds to a gene (denoted G1, to G6), and each column represents a SNP. Color indicates magnitude of eQTL effect. Bottom: The correlation structure (LD) across SNPs. Darker color indicates stronger correlation. b, Top: Transcriptome-wide association signal indicating strength of predicted expression association with trait. Bottom: Induced correlation of predicted expression. Darker color indicates stronger correlation between predicted expression levels. Dashed lines indicate the genome-wide (transcriptome-wide) significance threshold.
Here, we propose an approach to perform statistical fine-mapping over the gene–trait association signals from TWAS. Our approach, FOCUS (fine-mapping of causal gene sets), accounts for the correlation structure induced by LD and prediction weights used in the TWAS and controls for certain pleiotropic effects. FOCUS takes as input GWAS summary data, expression prediction weights (as estimated from eQTL reference panels), and LD among all SNPs in the risk region, and estimates the probability for any given set of genes to explain the TWAS signal. We extend probabilistic SNP fine-mapping approaches13–15 to estimate sets of genes that contain the causal genes (defined here as a gene responsible for the association signal) at a predefined confidence level (that is, ρ-credible gene sets). We perform extensive simulations and show that FOCUS is approximately unbiased in estimating the posterior probabilities and credible sets at a specified certainty when the causal gene is present in the data. When the causal tissue is unavailable and alternative tissues with correlated expression levels are used as a proxy, FOCUS maintains its performance under standard assumptions. Finally, as a demonstration using real GWAS data, we apply FOCUS to four GWASs of lipid levels16. We find that FOCUS prioritizes genes with established roles in low-density lipoprotein (LDL) risk (for example, SORT1)17.
Results
Methods overview.
To disentangle the causal and tagging gene–trait associations at a TWAS-significant region, we analytically derive the covariance structure among TWAS statistics as a function of LD and eQTL weights used in prediction. Next, we model the entire vector of marginal TWAS association statistics (ztwas) at all genes in a region (TWAS significant and not-significant), using a multivariate Gaussian distribution parameterized by the effect sizes at causal genes (λpe), residual SNP effects (λsnp), and the correlation structure induced by inferred expression weights (Ω) with LD (V) as
(see Methods). We control for bias resulting from pleiotropic effects of SNPs by including an intercept term that quantifies the average SNP effect sizes (λsnp) tagged by predicted expression ; see Methods). To allow for genes without prediction models in the relevant tissue (due to quality control and/or low power in eQTL studies), we leverage recent work demonstrating that eQTLs are largely shared across tissues18 and include prediction models from proxy tissues for such genes (see Methods). We employ a standard Bayesian approach to compute the marginal posterior inclusion probability (PIP) for each gene in the region to be causal given the observed TWAS statistics. To avoid overfitting, we integrate out the unknown causal effects λpe using a multivariate Gaussian prior (see Methods). We use PIPs to compute ρ-credible gene set that contain the causal gene with probability ρ (refs. 13–15). To account for missing causal mechanisms, due to either unpredicted expression or other latent functional mechanisms, we include the null model as a possible outcome in the credible set, which acts as a regularization for posterior estimates at observed genes (see Methods). Lastly, we use a simulation-based procedure to compute posterior predictive checks19 that measure the FOCUS model’s goodness-of-fit given observed TWAS Z-scores.
FOCUS yields accurate credible sets in simulations.
To characterize the predicted expression correlation structure and to validate our framework, we used extensive simulations starting from real genotype data to generate expression reference panels and GWAS summary data (Fig. 2; see Methods). We confirmed that non-causal genes in risk regions show significant association with trait as a function of LD and eQTL weights (see Supplementary Fig. 1), which motivates TWAS fine-mapping to prioritize genes causally impacting trait10. We simulated complex traits under a variety of architectures to assess the performance of 90%-credible gene sets computed using FOCUS (Fig. 3; see Methods). When the causal gene was assayed in its relevant tissue, we found that 90%-credible gene sets contained 83% (s.d. 0.04) of causal genes across simulations on average (Fig. 3 and Supplementary Fig. 2). FOCUS models an intercept term to control for pleiotropic SNP effects (λsnp) tagged through predicted expression. In simulations where SNPs directly impacted downstream trait, we found a small decrease in performance (Fig. 3; see Methods), which suggests that FOCUS maintains performance despite regressing out the average local effect. Next, we varied sample size across GWAS and reference eQTL data sets. Intuitively, we found improved performance for FOCUS to detect causal genes as sample size increased (Fig. 3 and Supplementary Fig. 3). Sample size for the eQTL reference panel affected performance to a larger degree than GWAS sample size, consistent with earlier reports1. For example, at NeQTL = 100, we found that 90%-credible gene sets contained the causal gene in 76% of simulations, which is significantly lower when compared with 84% for NeQTL = 500 (Mann–Whitney U-test P=2.52 × 10⁻⁶). Next, we explored how underlying heritability of expression at causal genes impacts prioritization. Heritability defines the prediction upper bound for SNP-based approaches20,21, and we expect performance to improve as non-zero heritability is easier to detect. We confirmed that performance increased with heritability of causal gene expression (Fig. 3). For example, we simulated gene expression having heritability and inferred eQTL weights using NeQTL = 500 and found a significant decrease in performance when compared with (Mann–Whitney U-test P = 1.1 × 10⁻⁵). We investigated the role of the prior effect-size distribution for gene expression4,22 and found performance to remain stable for a wide range of values (Supplementary Figs. 4 and 5). Lastly, similar results were obtained when using sparse regression to predict gene expression (Supplementary Fig. 6) and when using an alternative FOCUS model to account for variation across pleiotropic effects (Supplementary Note and Supplementary Fig. 7).
Fig. 2 |. Simulation diagram for alternative and null scenarios.
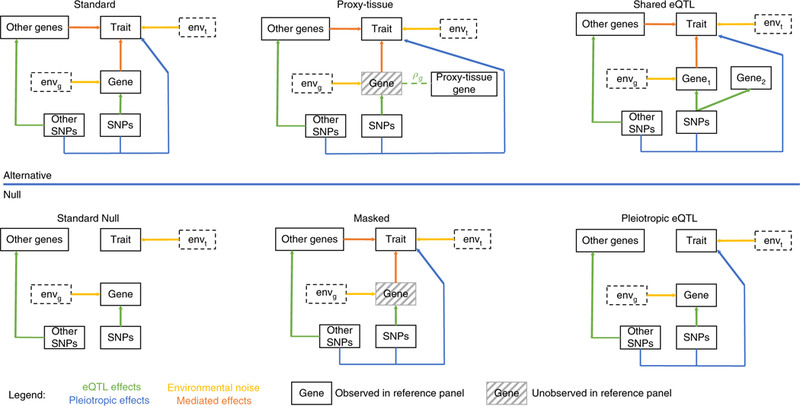
The top three diagrams represent simulations under the alternative. Here, gene expression and SNPs causally impact trait (standard); the causal gene in the relevant tissue is missing, but measured in a proxy tissue (proxy-tissue); and simulations are shown in which nearby genes share the same eQTLs (shared eQTL). The lower three diagrams represent simulations under the null or confounding instances. Here, there is no impact on downstream trait from genetics (standard null), the causal gene is missing in the reference panel and unavailable in proxy tissues (masked), and downstream trait is strictly a function of direct effects from SNPs that are eQTLs for genes (pleiotropic eQTL). We indicate the contribution of the environment to gene expression and trait as envg and envt, respectively.
Fig. 3 |. Credible gene sets are well calibrated in simulations.
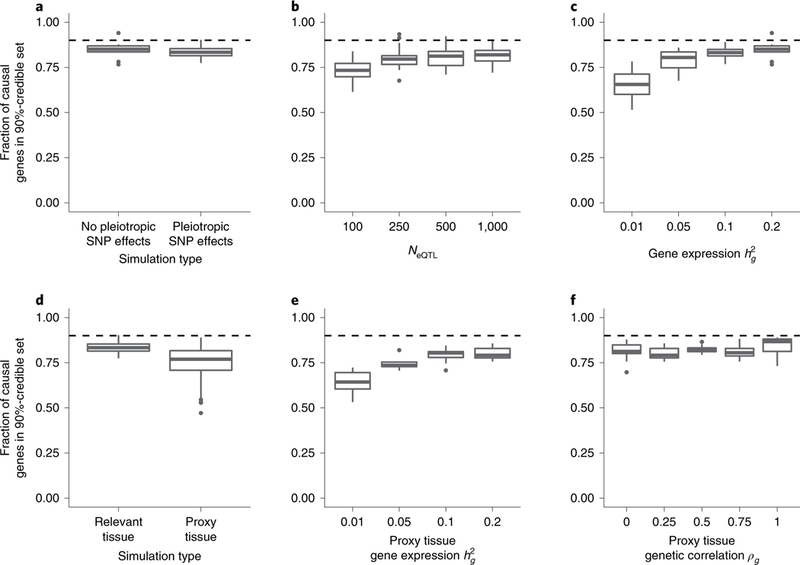
Box-plots represent the distribution of the proportion of causal genes captured in the 90% (dashed line)-credible set over simulations (that is, sensitivity; see Methods). Specifically, the median, upper and lower quartiles, 1.5× interquartile range, and outlier simulations (points). a, Standard simulations with and without pleiotropic SNP effects on trait. Prediction models were trained using the relevant (that is, causal) tissue. b, Calibration as a function of eQTL reference panel sample size. c, Calibration as a function of heritability of causal gene expression. d, Calibration using prediction models trained using proxy tissue measurements. e, Calibration using proxy tissue when heritability of reference gene expression varies compared with fixed in the relevant tissue. f, Calibration using proxy tissue when genetic correlation of reference gene expression and gene expression in the relevant tissue vary.
FOCUS remains stable when using proxy tissues.
Next, we investigated the performance of FOCUS when the causal gene in the relevant tissue is missing but is measured in a different tissue (see Methods). In real data, a gene may act through a tissue that is difficult to assay in large sample sizes but may have similar cis-regulatory patterns in tissues that are easier to collect (for example, blood). Indeed, several studies1,4,18,23 established that cis-regulated gene expression levels exhibit high genetic correlation across tissues and functional architectures. The intuition in this approach is that the loss in power from using the correlated tissue is offset by the gain in power due to larger eQTL sample size. Here, we consider a causal gene to be successfully fine-mapped if its corresponding proxy tissue model is in the 90%-credible gene set. When sample sizes for eQTL in the relevant and proxy tissues were the same, but heritability in proxy tissue was lower than in the relevant tissue, we found a significant loss in accuracy. We found that 90%-credible sets captured the causal gene in 75% (s.d. 0.09) of simulations compared with 83% (s.d. 0.04) when averaging over values of ρg (Mann–Whitney U-test P = 8.7 × 10⁻⁵; Fig. 3). This effect was not observed when heritability of proxy tissue gene expression was at least that of expression in the relevant tissue (Mann–Whitney U-test P = 0.27). For example, when expression in the relevant tissue was but in the proxy, we found that 90%-credible gene sets contained the causal gene in significantly fewer simulations (64% versus 83%; Mann–Whitney U-test P = 8.6 × 10⁻⁷). This suggests that when causal eQTLs are shared across tissues, increased heritability of expression increases power to detect the causal gene. In our simulations we found correlation of effect sizes at shared eQTLs to play no major role in performance when heritability of expression in the relevant and proxy tissue was similar (; Fig. 3 and Supplementary Fig. 8). In the case of zero correlation between effect sizes at the same eQTL SNPs, this result can be interpreted as pleiotropic effects on independent molecular traits, which are known to be difficult to differentiate from a causal effect1,3,8. However, we note that this result could be impacted by the simulation setup that enforces 1–2 eQTL SNPs as causal across tissues. Collectively, these results demonstrate that FOCUS is relatively robust to model perturbations and performs well when underlying tissue-specific causal genes are represented by proxy tissue eQTL weights.
FOCUS is robust to confounding.
We have shown that TWAS statistics are correlated due to LD between eQTL SNPs, implying that when predicted expression for the causal gene is not included in the inference, nearby genes will probably be prioritized in fine-mapping. FOCUS controls for this scenario by explicitly modeling the null (that is, causal configuration c = 0; see Methods) as a possible explanation when computing credible gene sets. We tested the performance of FOCUS in standard-null simulations, when there is no relationship between expression and trait, and found that the null model was contained in the 90%-credible gene set in 2,495 of 2,500 of our simulations. On average, 90%-credible sets contained 3.4 models (including the null) and 2.4 when restricted to genes only. In 298 of 2,500 simulations, the null model was the only model defining the 90%-credible gene set. For the remaining 2,202 of 2,500 credible gene sets, the average posterior probability for the null model was considerably greater than for neighboring gene models found in credible gene sets (average posterior 0.75 versus 0.075; P < 2 × 10–16). Together, these results indicate that FOCUS is accurate when no relationship between gene expression and trait exists. We next performed experiments using simulations where causal gene expression impacts the downstream trait but has been masked from the data before testing. We found the null model in 69% (s.d. 0.07) of 90%-credible gene sets (Fig. 4), which was a significantly greater percentage compared with simulations where the causal gene was present (41%, s.d. 0.05; Mann–Whitney Latest P =4.2 × 10⁻⁴). Altogether, we find that FOCUS is robust in the challenging setting of prioritizing the null model when causal expression is missing.
Fig. 4 |. FOCUS credible sets alleviate bias in confounding simulations.
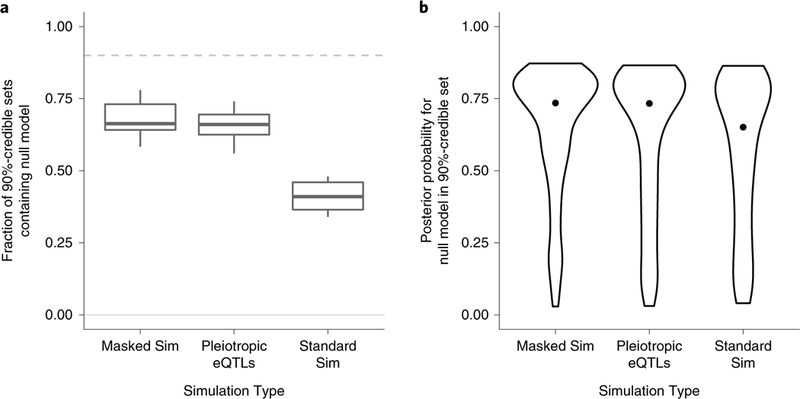
‘Standard sim’ indicates simulations under our standard pipeline. ‘Masked sim’ indicates simulations where the causal genes are pruned before analysis. ‘Pleiotropic eQTLs’ indicates simulations where gene expression does not mediate an effect on a downstream trait, but the same eQTLs have direct effects on a downstream trait. a, Box-plots represent the median, upper and lower quartiles, and 1.5× interquartile range of the proportion of genes captured in the 90%-credible gene sets over simulations. b, Violin plots represent the distribution of the posterior probability for null models captured in 90%-credible sets. Points represent the median posterior probability.
Next, we investigated simulations in which there is no mediated effect of steady-state gene expression on downstream trait, but eQTLs for genes have pleiotropic effects on downstream trait (that is, pleiotropic eQTLs). Here, we measured performance by counting how often the null model was prioritized over corresponding regional genes for each risk region in the pleiotropy simulations. Overall, we found that the null model was the top-ranked model for 251 of 500 regions (Fishers exact P < 2.2 × 10⁻¹⁶). Similarly, the 90%-credible gene sets within pleiotropic eQTL simulations were enriched with null model capture (328 of 500 sets; Fisher’s exact P < 2.2 × 10⁻¹⁶). We next compared performance across simulation types. We focused on credible sets that contained the null model and computed the average posterior probability in pleiotropic eQTL simulations and standard simulations. The credible gene sets contained the null model in a larger fraction of regions compared with those from standard simulations (Fig. 4). Similarly, focusing on the null models captured in credible sets, pleiotropic eQTL simulations resulted in more posterior density being assigned to the null model compared with those from standard simulations (Mann–Whitney U-test P = 0.04). Together, these results imply that FOCUS prioritizes the null model in the majority of simulated scenarios where SNPs exhibit a horizontal pleiotropic effect. Lastly, we performed simulations in which a non-causal gene shares the same regulatory eQTL as the causal gene. We found computed PIPs to be similar between the causal and non-causal in this eQTL scenario, reflecting the challenge in discerning causality when regulatory variants are shared across genes (Supplementary Fig. 9).
FOCUS improves resolution for fine-mapping causal genes.
Having established that causal genes are contained in the credible set, next we quantified the average number of genes captured. We found that 90%-credible gene sets contained 4.4 genes on average (s.d. 1.3) in the relevant-tissue simulations, which resulted in an average 54% of predicted genes per risk region. We found a similar number of genes in 90%-credible gene sets across simulations when varying model parameters and sample sizes (Supplementary Figs. 10–15). For completeness, we prioritized genes in simulations using 90%-credible gene sets for direct comparison with TWAS P values and the posterior probability of colocalization (COLOC PP4 (ref. 24)). In detail, we simulated a complex trait where multiple genes in a region are causal and each gene has multiple eQTLs (see Methods).
We then selected genes in two ways. First, we selected the same number of genes using either P value or PP4 ranking as the 90%-credible gene set (listed as ‘matched’). Second, we selected genes using standard thresholds for COLOC (PP4 ≥ 0.8) and TWAS P value (P < 0.05/15,277). We found that prioritizing genes by using credible sets outperformed both alternatives (Fig. 5 and Supplementary Table 1). For example, FOCUS captured 89% (s.d. 0.01) of simulated causal genes on average compared with 84% (s.d. 0.02) and 77% (s.d. 0.06) for P value and PP4 ranking when matching for size. FOCUS performance was similar with respect to TWAS and COLOC when eQTLs were shared across genes, having captured 82% (s.d. 0.07) of causal genes compared with 79% (s.d. 0.06) for TWAS-matched and 71% (s.d. 0.02) for COLOC-matched (Fig. 5). Relative performance for FOCUS improved when comparing with non-size-matched methods (Fig. 5). Similarly, using relaxed thresholds to determine colocalization (PP4) showed comparable results (Supplementary Table 1). Overall, we find that FOCUS has greater sensitivity to identify causal genes across realistic simulations.
Fig. 5 |. FOCUS accurately prioritizes causal genes in simulations.
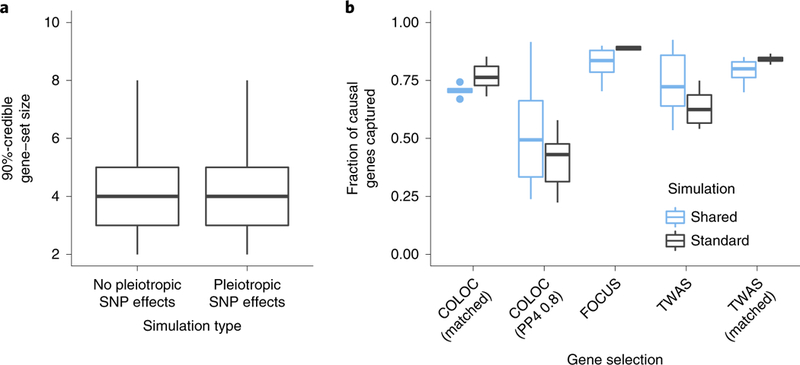
a, Size of the 90%-credible gene set in standard simulations with and without pleiotropic SNP effects on trait. Prediction models were trained using the relevant (that is, causal) tissue. Box-plots represent the median, upper and lower quartiles, and 1.5× interquartile range of the total number of genes captured in the 90%-credible gene sets over simulations. b, Method sensitivity in capturing causal genes in simulations. We ranked genes based on their P value (TWAS; P < 0.05/15,277) or colocalization score (PP4 ≥ 0.8). We also selected the same number of ranked genes as the 90%-credible gene set (matched). ‘Standard’ refers to simulations in which eQTLs are sampled for each gene. ‘Shared’ refers to simulations in which eQTLs are sampled and shared among all genes.
Application to lipid GWAS.
Next, we re-analyzed a large-scale GWAS of lipid measurements16 with eQTL weights from adipose tissue. We assumed that the relevant tissue for expression driving lipids is adipose tissue, given its well-characterized role25–28. To account for missing gene prediction models, we incorporated gene expression models for genes not predictable from adipose tissue across 45 tissues measured in 47 reference panels. In detail, for a gene without a predicted model in adipose tissue, we included the prediction model with the best accuracy across all other tissues (Supplementary Table 2; see Methods). Of the 26,292 known genes in RefSeq (version 65) (ref. 29), we found 12,663 covered in our data, with the remaining 2,614 genes not found in RefSeq. Adipose-prioritized TWAS identified 301 (202 unique) significant genes at 108 (63 unique) independent regions after accounting for the total number of per-trait tests performed (P < 0.05/15,277; Supplementary Figs. 16–19, Table 1, and Supplementary Table 3). Of the 160 (89 unique) risk regions found through GWAS, 75 (46 unique) overlapped significant TWAS results, which is increased compared with earlier work30 that found 25% overlap between GWAS and eQTL at risk regions (Table 1). Of the 75 trait–region pairs with a significant TWAS association, 47 had multiple significant TWAS associations, thus motivating our fine-mapping approach.
Table 1 |.
Summary of-based fine-mapping in lipid GWAS gene risk regions
| Lipid trait | GWAS risk regions |
GWAS risk regions with TWAS- significant genes |
TWAS genes at risk regions |
Genes in 90%-credible sets |
|---|---|---|---|---|
| HDL | 43 | 18 | 64 | 30 |
| LDL | 36 | 20 | 56 | 40 |
| Total cholesterol | 51 | 24 | 73 | 53 |
| Triglycerides | 30 | 13 | 33 | 25 |
| Overall | 160 | 75 | 226 | 148 |
| unique | 89 | 46 | 146 | 100 |
A GWAS risk region is defined to be an LD block defined by LDetect41 harboring at least one genome-wide-significant SNP (P < 5 × 10⁻⁸) reported in ref. 16. A TWAS gene is a gene whose predicted expression reaches transcriptome-wide significance of P < 0.05/15,277. Overall results are presented as total counts across traits with unique results discarding repeated elements.
We next applied FOCUS at the 75 GWAS risk regions with evidence for regulatory action on genes driving lipid levels to compute PIPs and estimate credible sets of genes at each of the regions (see Methods). We found that observed risk regions can be explained by 1.5 causal genes on average, with 61 of 75 risk regions containing fewer than 2 causal genes in expectation (Supplementary Figs. 20 and 21). The average maximum PIP across credible sets was 88% (and decreased exponentially for lower ranked genes; Supplementary Fig. 20). Together, these results imply that most risk regions can be explained by a single causal gene. Using computed PIPs, we estimated 90%-credible gene sets for each risk region and found a significant reduction in the number of prioritized genes (mean 1.9) compared with transcriptome-wide-significant genes (mean 3.2; Mann–Whitney U-test P = 7.24 × 10⁻⁴; Supplementary Table 4). We compared the sensitivity of FOCUS to the setting of the prior variance term and found computed PIPs to be highly similar across lipid traits (t-test P < 2.2 × 10⁻¹⁶; Supplementary Fig. 22). Comparing FOCUS results with those of TWAS ranking, we found that in 47 of 75 total trait–region pairs, the gene with the highest TWAS Z-score was also the gene with the highest PIP. When excluding the null model, this proportion increased to 57 of 75. As a positive control, we examined the 1p 13 locus for LDL, as this region harbors risk SNP rs12740374 (NC_000001.10:g.109817590 G>T) which has been shown to perturb transcription of the SORT1 gene and impact downstream LDL levels17. We found 4 of 34 genes included in the 90%-credible set, of which SORT1 had a posterior probability 95% (Fig. 6 and Supplementary Table 5).
Fig. 6 |. 1p13 locus for LDL.
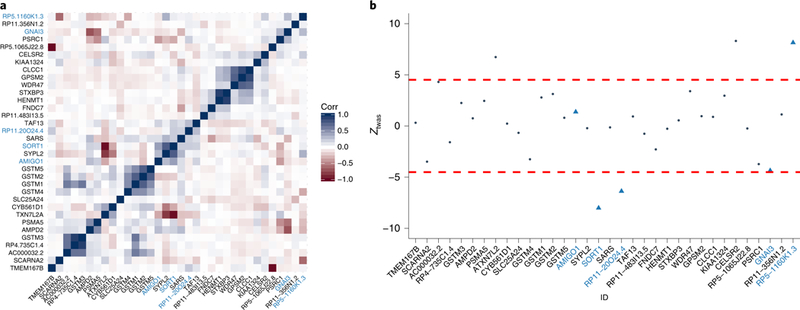
a, Correlation for predicted expression at the 1p13 locus. Genes in the 90%-credible set are labeled in light blue. The direction and magnitude of correlation between predicted expression levels are indicated by color (Corr). b, TWAS Z-scores at the 1p13 locus. Each point represents the association strength for each tested gene. Genes in the 90%-credible gene set are labeled in light blue. Dashed red lines indicate transcriptome-wide-significance threshold. Gene names are indicated by ID.
Finally, we investigated regions whose 90%-credible gene sets contained the null model (that is, regions with weaker evidence for models of gene expression driving risk). An instance that contains the null model in its credible set may be partially consistent with the observed association between expression levels and trait being due to chance. We found 25 of 75 instances of the null model captured in credible sets for lipid traits (Supplementary Table 4), which suggests that most overlapping GWAS risk regions are more consistent with risk contributed from cis-regulated expression levels, compared with statistical noise explaining observed signal. PIP output by FOCUS are conditioned on the FOCUS model being correct. If the FOCUS model does not accurately capture the underlying generative process, then PIPs will be biased. We used a simulation procedure (see Methods) to quantify model fit for each gene and found that the FOCUS model largely agreed with observed data (that is, TWAS Z-scores; see Supplementary Fig. 23).
Discussion
In this work we presented FOCUS, a fine-mapping approach that estimates credible sets of causal genes by using prediction eQTL weights, LD, and GWAS summary statistics. We demonstrated that FOCUS prioritizes the null model in null simulations and is accurate in identifying causal genes when genes at a region impact downstream trait. We found 90%-credible gene sets to be largely stable across a variety of simulations, with the biggest impact in performance due to eQTL reference panel sample size and SNP-heritability of gene expression. We applied FOCUS to four lipid TWASs (for example, high-density lipoprotein (HDL), LDL, triglyceride, and total cholesterol levels) and found that SORT1 was correctly identified as a putative causal gene. Interestingly, our real-data results in lipids suggest that most regions can be explained by a single causal gene. Overall, our results highlight the utility of using credible sets in prioritizing causal genes by jointly assigning posterior probabilities, which are both easily interpretable and comparable across genes and regions.
In addition to providing a quantification of the confidence in how many genes need to be validated to identify the causal genes in the region, our probabilistic approach yields several benefits. First, FOCUS naturally allows for multiple causal SNPs and genes while integrating gene-effect sizes by using conjugate priors; this is particularly important, as recent works have shown that allelic heterogeneity (that is, multiple causal genes and SNPs at a region) is pervasive in both eQTL and GWAS18,31. Second, in this work, we investigated predicted gene expression, but FOCUS could generally be applied to other predicted molecular traits with an established role in complex trait etiology (for example, alternatively spliced exons32,33). For example, several recent works have supporting evidence for splice variation playing an important role in driving risk of schizophrenia34,35.
We conclude with several limitations and caveats of our approach. A broad overview of the challenges in TWAS is presented in ref. 10, and we outline several here. First, our model assumes that complex trait or disease risk is a linear function of steady-state expression levels at causal genes. Several works have demonstrated that risk prediction using a linear combination of predicted steady-state or observed expression levels can outperform standard SNP-based models34,36, which supports a linear model of gene expression impacting complex trait or disease risk. However, higher-order models that capture complex regulatory networks of transcription factors and gene expression may also reflect underlying biology. As reference gene expression data sets grow in size, accurately modeling these assumptions may be possible. Similarly, if risk is mediated through context-specific expression and not steady-state expression levels, then FOCUS will have a loss in performance. Second, while our simulations used the genomic best linear unbiased predictor (GBLUP)37,38 throughout for its straightforward implementation, we recommend a cross-validation approach to select the best fitting linear model (for example, GBLUP, Bayesian sparse linear mixed model (BSLMM)39) using the ratio of out-of-sample prediction accuracy normalized by the total SNP-heritability of gene expression, which is implemented in the FUSION framework1,34. Third, when the causal gene is not present in the data, our approach will partially inflate posterior probabilities at tagging genes. We attempt to mitigate this scenario by adding an intercept term to the model and incorporating gene models measured in proxy tissues. Our simulated results using proxy tissues were performed using a model where causal eQTLs are shared between proxy and relevant tissues18. This assumption may be violated in real data if causal eQTLs are tissue specific. Fourth, our approach assumes that the causal tissue is known (for example, adipose tissue causal for lipids25–28). This cannot always be known for complex traits or diseases with less understood biology. However, recent work has shown that the most relevant (that is, probably causal) tissue for complex traits can be accurately estimated using eQTL data40. Coupled with estimation of the causal tissue, we suggest prioritizing genes with high normalized prediction accuracy in related tissues. We note that our results were strongly dependent on sample size in the eQTL reference panel, which is reflected in expression prediction accuracy. We therefore recommend prioritizing eQTL data with sample sizes greater than 100 if possible, and performing inference on genes with robustly non-zero SNP-heritability.
Methods
Model and sampling distribution of marginal TWAS summary statistics.
Here, we briefly describe our model for a quantitative trait, the sampling distribution for TWAS summary statistics, and the FOCUS model. For a full account please see Supplementary Note. We model a quantitative trait for n individuals y by a linear combination of expression levels for m genes as
Where is the centered and variance-standardized genome-wide genotype matrix at p SNPs, β is the p pleiotropic effects of X on y, α is the vector of causal effects for the m genes, and ∊ is random environmental noise with and We model G as a linear function of genotype weighted by eQTLs for the m genes as G = XW, where is the eQTL effect-size matrix. We note that the scaled environment term for G is absorbed into ∊ (Supplementary Note).
We model marginal TWAS tests on y using predicted expression as where Ω is an estimate of W using independent eQTL reference panels. After marginalizing out unknown causal gene effects α the sampling distribution is
Where is the SNP correlation (LD) matrix, λsnp is the residual-or pleiotropic SNP non-centrality parameter, is the predicted expression covariance, and Dc is the prior variance for effects at causal genes as indicated by a binary status vector c (Supplementary Note).
To perform inference of which genes are causal given TWAS statistics ztwas, we compute the posterior distribution of any set of causal genes c,
where C is the set of all binary vectors of length m. We assume a Bernoulli prior for each causal indicator ci ~ Bern(p). In practice, we set p = 1 × 10⁻³. We compute the marginal PIP for the ith gene as
We compute this expression using direct enumeration for regions with fewer than 20 gene models. For larger regions, we limit enumeration to at most five causal genes. The posterior null under this model, captures the probability that none of the predicted expression models included in our analysis explain the observed TWAS Z-scores. Using PIPs, we can estimate the expected number of causal genes at a risk region mc
Credible gene sets.
PIPs offer a flexible mechanism to generate gene sets for functional follow-up. We generalize the concept of credible SNP sets from SNP fine-mapping14,15 to compute credible gene sets. Here, a ρ-credible gene set contains a causal gene with probability ρ. Formally, if we define the normalized PIP for gene i as
where the denominator sums over the PIP for the null model as well as the remaining gene model PIPs at the region. A ρ-credible gene set is defined as a set of gene models at a region We use a greedy approach to compute a minimal ρ-credible gene set that first sorts gene models at a region and includes models until at least ρ of the normalized-posterior mass is explained.
Model validation using the posterior predictive distribution.
To test the validity of the FOCUS model at GWAS risk regions in real data, we use a posterior predictive sampling procedure19. This approach alternates between sampling causal configurations c from the posterior distribution and sampling Z-scores from the generative distribution after conditioning on the causal configuration. This enables us to compare the distribution of simulated data with our observed statistics ztwas. When our observed data ztwas are not fit within reasonable bounds of the simulated data we can be more confident that the FOCUS model and computed PIPs are inconsistent with the actual data-generating process. Specifically, at each risk region with m genes we perform the following: at each risk region, we sample the causal status for each gene using the posterior distribution Given a complete causal configuration c, we then sample Z-scores We repeat this a fixed number of times and compute a posterior Z-score (and P value) of model fit for the ith gene as Deviations from the null of N (0,1) indicate poor model fit.
Gene expression simulations.
We simulated TWAS association statistics starting from real genotype data and gene definitions. To simulate genotype samples, we first partitioned genotype data for 489 individuals of European ancestry in 1000Genomes42 into independent LD blocks as defined by LDetect41. We annotated LD blocks with all genes in RefSeq29 whose transcription start site was flanked by region boundaries. To simulate GWAS and expression reference panel genotypes, we sampled standardized genotypes using the multivariate Gaussian approximation where V is LD estimated from the 1000Genomes individuals. For both GWAS panel and eQTL reference panel, we simulated gene expression of each gene in the ith LD block annotation list by selecting k causal SNPs preferentially located near 100 kilobases of the transcription start site (TSS) and then computed where X is the n × p centered and standardized genotype matrix, is the causal eQTL effects, and is random environmental noise where Here, k, depending on the simulation, is 1, 2, 1%, or 10% of SNPs. To simulate expression in two correlated tissues, we sample eQTL effects at shared causals under a bi-variate Gaussian distribution as is the SNP-heritability for gene expression in tissue, and ρg is genetic correlation. For proxy tissue simulations, we used values of proxy tissue expression We repeated this for a total of 50 randomly sampled LD blocks. For shared-eQTL simulations, we restrict all genes in a region to share the same zeros across eQTL effects (that is, share the same causal SNPs). Effect sizes at causal SNPs for each gene are then drawn independently according to the above.
Complex trait simulations.
We simulated complex trait for the GWAS panel as a linear combination of the causal gene expression and uniform pleiotropic effects. We first sampled the number of causal genes at each region assuming where is the number of causal genes at region i, with constraints of for mi total number of genes at region i. Let be the matrix of gene expression restricted to the causal genes. Similarly, let be the Ngwas × P genotype matrix across all 50 regions where for pi SNPs at region i. For standard simulations where pleiotropic SNP effects are uniform at each region (that is, expectation of the FOCUS model), we sampled regional effects as Then we computed is causal effects for gene expression, is the centered and variance-standardized version of Gc. The ‘standard null’ simulation fixed α = 0 and β = 0. We performed an association scan on simulated data and computed SNP-trait Z-scores zgwas using Wald statistics from linear regression. To perform a TWAS we fitted weights for the expression reference panel using GBLUP37,38 or least absolute shrinkage and selection operator (LASSO)43, which were then used to compute ztwas. We then performed fine-mapping using the FOCUS algorithm on simulated ztwas vectors. Unless stated otherwise, simulation parameters were set to Ngwas = 50,000, NeQTL = 500, expression (that is, variance explained in trait due to genetic component of gene expression1,4), and
We also simulated complex trait for the GWAS panel as a linear combination of causal gene expression (see above) but differed how pleiotropy manifests for the variance-component model of pleiotropy (see Supplementary Note).Our ‘pleiotropic eQTL’ simulation has SNP effects drawn independently and occurring only at a subset of eQTLs (rather than all SNPs) in the simulation. We first sampled 1–2 eQTLs per region and then sampled pleiotropic effect sizes as where PsQTL is the total number of eQTLs with pleiotropic effects. Next, we set β to βi for selected eQTLs and 0 otherwise.
Data sets.
We downloaded publicly available summary statistics for lipid measurement GWASs16. We filtered sites that were not bi-allelic, were ambiguous (that is, allele 1 is reverse complement with allele 2), or had minor allele frequency (MAF) less than 0.01. To perform TWASs on each of the lipid traits we used the software FUSION (see Code availability). FUSION takes a summary-based approach to TWASs and requires as input GWAS summary statistics (that is, SNP Z-scores) and eQTL weights. We downloaded publicly available expression weight data as part of the FUSION package. Reference LD was estimated in 1000Genomes42 using 489 European individuals. Quality control, cis-heritability of expression, and model fitting have been described elsewhere1,4,34. We prioritized adipose for our TWAS approach and used other reference panels to act as proxy for adipose. That is, for all possible tissue-specific gene models in a region, we first test predicted expression using adipose gene models. Then for the remaining genes found only in proxy tissue models, we select those with the best prediction accuracy (that is, out-of-sample R2 normalized by complete-data estimates). This resulted in 15,277 unique genes. Risk regions for FOCUS are approximately 1-megabase regions obtained from LDetect41 that contain at least 1 genome-wide-significant SNP (Pgwas < 5 × 10⁻⁸).
Supplementary Material
Acknowledgements
We would like to thank C. Giambartolomei for discussions. This work was funded by NIH awards nos. T32NS048004 (N.M.), T32LM012424 (M.K.F.), R01HG009120 (N.M., M.K.F., R.J., G.K., H.S., B.P.), R01MH115676 (N.M., M.K.F., R.J., G.K., H.S., A.G., B.P.), R01HG006399 (N.M., M.K.F., R.J., G.K., H.S., B.P.), and U01CA194393 (N.M., M.K.F., R.J., G.K., H.S., B.P.); NSF award no. DGE-1829071 (R.J.); and the Claudia Adams Barr Award (A.G.). The content is solely the responsibility of the authors and does not necessarily represent the official views of the NIH.
Footnotes
competing interests
The authors declare no competing interests.
Additional information
Supplementary information is available for this paper at https://doi.org/10.1038/s41588–019-0367–1.
Reprints and permissions information is available at www.nature.com/reprints.
Correspondence and requests for materials should be addressed to N.M. or B.P.
Publisher’s note: Springer Nature remains neutral with regard to jurisdictional claims in published maps and institutional affiliations.
Reporting Summary. Further information on research design is available in the Nature Research Reporting Summary linked to this article.
code availability
FUSION TWAS method (http://www.gusevlab.org/projects/fusion/) and FOCUS fine-mapping methods (http://github.com/bogdanlab/focus).
Data availability
Data used in this study are available at the following links: TWAS eQTL weights (http://www.gusevlab.org/projects/fusion/), TWAS and fine-mapping results (http://github.com/bogdanlab/focus_paper/), and lipid GWAS summary data (http://lipidgenetics.org/).
Online content
Any methods, additional references, Nature Research reporting summaries, source data, statements of data availability and associated accession codes are available at https://doi.org/10.1038/s41588–019-0367–1.
References
- 1.Gusev AKA et al. Integrative approaches for large-scale transcriptome-wide association studies. Nat. Genet. 48, 245–252 (2016). [DOI] [PMC free article] [PubMed] [Google Scholar]
- 2.Gamazon ER et al. A gene-based association method for mapping traits using reference transcriptome data. Nat Genet. 47, 1091–1098 (2015). [DOI] [PMC free article] [PubMed] [Google Scholar]
- 3.Zhu Z et al. Integration of summary data from GWAS and eQTL studies predicts complex trait gene targets. Nat. Genet. 48, 481–487 (2016). [DOI] [PubMed] [Google Scholar]
- 4.Mancuso N et al. Integrating gene expression with summary association statistics to identify genes associated with 30 complex traits. Am. J. Hum. Genet. 100, 473–487 (2017). [DOI] [PMC free article] [PubMed] [Google Scholar]
- 5.Shi H, Mancuso N, Spendlove S & Pasaniuc B Local genetic correlation gives insights into the shared genetic architecture of complex traits. Am. J. Hum. Genet. 101, 737–751 (2017). [DOI] [PMC free article] [PubMed] [Google Scholar]
- 6.Lawlor DA, Harbord RM, Sterne JA, Timpson N & Davey SG Mendelian randomization: using genes as instruments for making causal inferences in epidemiology. Stat. Med. 27, 1133–1163 (2008). [DOI] [PubMed] [Google Scholar]
- 7.Pierce BL & Burgess S Efficient design for Mendelian randomization studies: subsample and 2-sample instrumental variable estimators. Am. J. Epidemiol. 178, 1177–1184 (2013). [DOI] [PMC free article] [PubMed] [Google Scholar]
- 8.Bowden J, Davey Smith G & Burgess S Mendelian randomization with invalid instruments: effect estimation and bias detection through Egger regression. Int. J. Epidemiol. 44, 512–525 (2015). [DOI] [PMC free article] [PubMed] [Google Scholar]
- 9.Davey Smith G & Hemani G Mendelian randomization: genetic anchors for causal inference in epidemiological studies. Hum. Mol. Genet. 23, R89–R98 (2014). [DOI] [PMC free article] [PubMed] [Google Scholar]
- 10.Wainberg M et al. Opportunities and challenges for transcriptome-wide association studies. Nat. Genet 10.1038/s41588-019-0385-z (2019). [DOI] [PMC free article] [PubMed] [Google Scholar]
- 11.Barfield R et al. Transcriptome-wide association studies accounting for colocalization using Egger regression. Genet. Epidemiol. 42, 418–433 (2018). [DOI] [PMC free article] [PubMed] [Google Scholar]
- 12.Bowden J, Davey Smith G, Haycock PC & Burgess S Consistent estimation in Mendelian randomization with some invalid instruments using a weighted median estimator. Genet. Epidemiol. 40, 304–314 (2016). [DOI] [PMC free article] [PubMed] [Google Scholar]
- 13.Maller JB et al. Bayesian refinement of association signals for 14 loci in 3 common diseases. Nat. Genet. 44, 1294–1301 (2012). [DOI] [PMC free article] [PubMed] [Google Scholar]
- 14.Hormozdiari F, Kichaev G, Yang W-Y, Pasaniuc B & Eskin E Identification of causal genes for complex traits. Bioinformatics 31, i206–i213 (2015). [DOI] [PMC free article] [PubMed] [Google Scholar]
- 15.Kichaev G et al. Integrating functional data to prioritize causal variants in statistical fine-mapping studies. PLoS Genet. 10, e1004722 (2014). [DOI] [PMC free article] [PubMed] [Google Scholar]
- 16.Teslovich TM et al. Biological, clinical and population relevance of 95 loci for blood lipids. Nature 466, 707–713 (2010). [DOI] [PMC free article] [PubMed] [Google Scholar]
- 17.Musunuru K et al. From noncoding variant to phenotype via SORT1 at the 1p13 cholesterol locus. Nature 466, 714–719 (2010). [DOI] [PMC free article] [PubMed] [Google Scholar]
- 18.Consortium G Genetic effects on gene expression across human tissues. Nature 550, 204–213 (2017). [DOI] [PMC free article] [PubMed] [Google Scholar]
- 19.Gelman A, Meng X-L & Stern H Posterior predictive assessment of model fitness via realized discrepancies. Statistica Sin. 6, 733–760 (1996). [Google Scholar]
- 20.Gusev A et al. Partitioning heritability of regulatory and cell-type-specific variants across 11 common diseases. Am. J. Hum. Genet. 95, 535–552 (2014). [DOI] [PMC free article] [PubMed] [Google Scholar]
- 21.Wray NR et al. Pitfalls of predicting complex traits from SNPs. Nat. Rev. Genet. 14, 507–515 (2013). [DOI] [PMC free article] [PubMed] [Google Scholar]
- 22.Gusev A et al. Atlas of prostate cancer heritability in European and African-American men pinpoints tissue-specific regulation. Nat. Commun. 7, 10979 (2016). [DOI] [PMC free article] [PubMed] [Google Scholar]
- 23.Liu X et al. Functional architectures of local and distal regulation of gene expression in multiple human tissues. Am. J. Hum. Genet. 100, 605–616 (2017). [DOI] [PMC free article] [PubMed] [Google Scholar]
- 24.Giambartolomei C et al. Bayesian test for colocalisation between pairs of genetic association studies using summary statistics. PLoS Genet. 10, e1004383 (2014). [DOI] [PMC free article] [PubMed] [Google Scholar]
- 25.Krause BR & Hartman AD Adipose tissue and cholesterol metabolism. J. Lipid Res. 25, 97–110 (1984). [PubMed] [Google Scholar]
- 26.Le Lay S et al. Cholesterol: a cell size dependent signal which regulates glucose metabolism and gene expression in adipocytes. J. Biol. Chem. 276, 16904–16910 (2001). [DOI] [PubMed] [Google Scholar]
- 27.Berg AH, Combs TP & Scherer PE ACRP30/adiponectin: an adipokine regulating glucose and lipid metabolism. Trends Endocrinol. Metab. 13, 84–89 (2002). [DOI] [PubMed] [Google Scholar]
- 28.de Haan W, Bhattacharjee A, Ruddle P, Kang MH & Hayden MR ABCA1 in adipocytes regulates adipose tissue lipid content, glucose tolerance and insulin sensitivity. J. Lipid Res. 55, 516–523 (2014). [DOI] [PMC free article] [PubMed] [Google Scholar]
- 29.O’Leary NA et al. Reference sequence (RefSeq) database at NCBI: current status, taxonomic expansion, and functional annotation. Nucleic Acids Res. 44, D733–D745 (2016). [DOI] [PMC free article] [PubMed] [Google Scholar]
- 30.Chun S et al. Limited statistical evidence for shared genetic effects of eQTLs and autoimmune-disease-associated loci in three major immune-cell types. Nat. Genet. 49, 600–605 (2017). [DOI] [PMC free article] [PubMed] [Google Scholar]
- 31.Hormozdiari F et al. Widespread allelic heterogeneity in complex traits. Am. J. Hum. Genet. 100, 789–802 (2017). [DOI] [PMC free article] [PubMed] [Google Scholar]
- 32.Battle A et al. Characterizing the genetic basis of transcriptome diversity through RNA-sequencing of 922 individuals. Genome Res. 24, 14–24 (2014). [DOI] [PMC free article] [PubMed] [Google Scholar]
- 33.Li YI et al. RNA splicing is a primary link between genetic variation and disease. Science 352, 600–604 (2016). [DOI] [PMC free article] [PubMed] [Google Scholar]
- 34.Gusev A et al. Transcriptome-wide association study of schizophrenia and chromatin activity yields mechanistic disease insights. Nat. Genet. 50, 538–548 (2018). [DOI] [PMC free article] [PubMed] [Google Scholar]
- 35.Kaalund S et al. Contrasting changes in DRD1 and DRD2 splice variant expression in schizophrenia and affective disorders, and associations with SNPs in postmortem brain. Mol. Psychiatry 19, 1258–1266 (2014). [DOI] [PubMed] [Google Scholar]
- 36.Marigorta UM et al. Transcriptional risk scores link GWAS to eQTLs and predict complications in Crohn’s disease. Nat. Genet. 49, 1517–1521 (2017). [DOI] [PMC free article] [PubMed] [Google Scholar]
- 37.Habier D, Fernando R & Dekkers JC The impact of genetic relationship information on genome-assisted breeding values. Genetics 177, 2389–2397 (2007). [DOI] [PMC free article] [PubMed] [Google Scholar]
- 38.VanRaden PM Efficient methods to compute genomic predictions. J. Dairy Science 91, 4414–4423 (2008). [DOI] [PubMed] [Google Scholar]
- 39.Zhou X, Carbonetto P & Stephens M Polygenic modeling with Bayesian sparse linear mixed models. PLoS Genet. 9, e1003264 (2013). [DOI] [PMC free article] [PubMed] [Google Scholar]
- 40.Ongen H et al. Estimating the causal tissues for complex traits and diseases. Nat. Genet. 49, 1676–1683 (2017). [DOI] [PubMed] [Google Scholar]
- 41.Berisa T & Pickrell JK Approximately independent linkage disequilibrium blocks in human populations. Bioinformatics 32, 283–285 (2016). [DOI] [PMC free article] [PubMed] [Google Scholar]
- 42.The 1000 Genomes Project Consortium. A global reference for human genetic variation. Nature 526, 68–74 (2015). [DOI] [PMC free article] [PubMed] [Google Scholar]
- 43.Tibshirani R Regression shrinkage and selection via the lasso. J. R. Stat. Soc. B 58, 267–288 (1996). [Google Scholar]
Associated Data
This section collects any data citations, data availability statements, or supplementary materials included in this article.