

Abstract
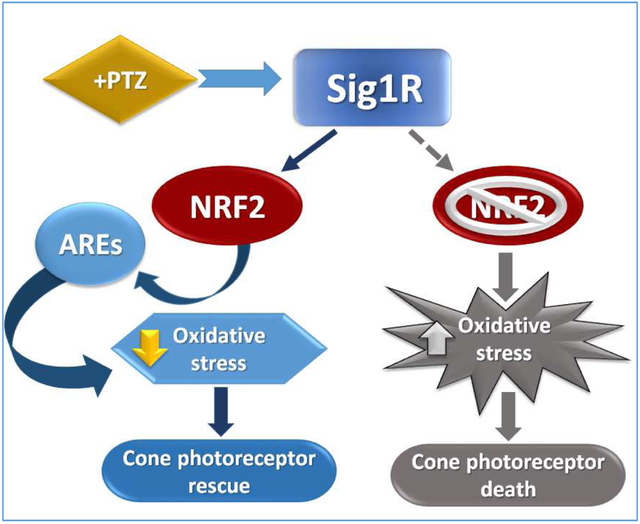
Sigma 1 receptor (Sig1R), a putative molecular chaperone, has emerged as a novel therapeutic target for retinal degenerative disease. Earlier studies showed that activation of Sig1R via the high-affinity ligand (+)-pentazocine ((+)-PTZ) induced profound rescue of cone photoreceptor cells in the rd10 mouse model of retinitis pigmentosa; however the mechanism of rescue is unknown. Improved cone function in (+)-PTZ-treated mice was accompanied by reduced oxidative stress and normalization of levels of NRF2, a transcription factor that activates antioxidant response elements (AREs) of hundreds of cytoprotective genes. Here, we tested the hypothesis that modulation of NRF2 is central to Sig1R-mediated cone rescue. Activation of Sig1R in 661W cone cells using (+)-PTZ induced dose-dependent increases in NRF2-ARE binding activity and NRF2 gene/protein expression, whereas silencing Sig1R significantly decreased NRF2 protein levels and increased oxidative stress, although (+)-PTZ did not disrupt NRF2-KEAP1 binding. In vivo studies were conducted to investigate whether, in the absence of NRF2, activation of Sig1R rescues cones. (+)-PTZ was administered systemically for several weeks to rd10/nrf2+/+ and rd10/nrf2−/− mice. Through post-natal day 42, cone function was significant in rd10/nrf2+/+, but minimal in rd10/nrf2−/− mice as indicated by electroretinographic recordings using natural noise stimuli, optical coherence tomography and retinal histological analyses. Immunodetection of cones was limited in (+)-PTZ-treated rd10/nrf2−/−, though considerable in (+)-PTZ-treated rd10/nrf2+/+mice. The data suggest that Sig1R-mediated cone rescue requires NRF2 and provide evidence for a previously-unrecognized relationship between these proteins.
Keywords: retina, oxidative stress, retinitis pigmentosa, rd10 mouse, retinal neuroprotection, NRF2-KEAP1, NRF2-Neh luciferase assay
Graphical Abstract
Introduction
Sigma 1 Receptor (Sig1R), a unique transmembrane protein, is an evolutionary isolate with no homology to any other known mammalian proteins. Investigations of its structure reveal an unusual single-pass transmembrane protein that crystallizes as an intimately associated triangular trimer [1]. Sig1R is implicated in many cellular functions and is considered a pluripotent modulator with roles in normal and disease states [2]. It has emerged as a novel target for treatment of neurodegenerative diseases including amyotrophic lateral sclerosis, Alzheimer’s disease, Huntington’s disease, and Parkinson’s disease [3-8]. Pathogenic features of these diseases including increased oxidative stress, inflammation and apoptosis, are implicated in retinal dystrophies, which have joined the ranks of neurodegenerative diseases being investigated for benefit from Sig1R targeting [9]. The importance of targeting Sig1R for retinal diseases is underscored by reports of accelerated retinal pathology when it is absent [10-15]. Conversely, targeting Sig1R demonstrated impressive effects in attenuating retinal neuronal loss. Ganglion cell loss was diminished significantly in ischemia-reperfusion retinopathy when rats were administered the Sig1R ligand MR22 [16] and in diabetic retinopathy when Ins2Akita/+ mice were administered (+)-pentazocine ((+)-PTZ), a Sig1R ligand [13,17]. Photoreceptor cell loss was mitigated in a light-induced retinopathy mouse model using the Sig1R ligand SA4503 [18] and in an inherited mouse model of photoreceptor degeneration using (+)-PTZ [19].
Investigations of mechanisms by which Sig1R activation mediates neuroprotection include modulating calcium channels [20,21], preserving mitochondrial function/modulating ER stress [22] and attenuating levels of reactive oxygen species (ROS) [23-25]. Here, a novel mechanism by which Sig1R activation attenuates retinal neuronal loss is addressed, which examines modulation of nuclear erythroid 2-related factor 2 (NRF2). The basic leucine zipper transcription factor, NRF2, regulates transcription of more than 500 antioxidant and cytoprotective genes [26-29]. In the absence of overt stress, NRF2 is sequestered in the cytosol by its repressor protein Kelch ECH associating protein 1 (KEAP1). NRF2 has several highly conserved domains called NRF2-ECH homology (Neh) domains. The Neh1 domain enables NRF2 to heterodimerize with small Maf proteins and subsequently bind to ‘antioxidant response elements’ (ARE), cis-acting regulatory enhancers found in the 5’ flanking region of many phase II detoxification enzymes and antioxidant proteins [30,31]. The Neh2 domain mediates binding with KEAP1. In the absence of overt stress, NRF2 is retained at low levels in the cytoplasm by KEAP1; during cellular stress, KEAP1 releases NRF2, which translocates to the nucleus to activate AREs of genes encoding numerous cellular defense proteins/enzymes.
The current study presents in vitro experiments performed in a cone photoreceptor cell line to examine whether (+)-PTZ directly inhibits the binding of KEAP1 to NRF2. (+)-PTZ is a synthetic benzomorphan with high selectivity and affinity for Sig1R (IC50 (nM) 2.34; Ki (nM) 1.62) [32] and requires Sig1R to mediate retinal neuroprotective effects in vitro [11] and in vivo [19]. We also examined whether (+)-PTZ alters NRF2-ARE binding, Nrf2 gene expression, and NRF2 protein levels in cell cytoplasm versus nucleus. Our results suggest that activation of Sig1R modulates these NRF2-related activities, whereas silencing Sig1R abolishes the effects.
Additionally, in vivo experiments explored whether NRF2 plays a role in Sig1R-mediated retinal neuroprotection. We took advantage of the availability of nrf2−/− mice and the Pde6βrd10 (rd10) mouse model of retinitis pigmentosa (RP) [35]. RP is a group of diseases caused by numerous genetic mutations, which induce death of rod photoreceptors. Cone photoreceptors die following the loss of rods. Oxidative stress, which reflects an imbalance in production/elimination of ROS, is implicated in cone death associated with RP [33]. Under normal conditions, rods constitute the majority of photoreceptors and consume ~95% of the oxygen delivered to retina by choroidal vessels. In RP, after rods die, oxygen levels remain high because choroidal vessels do not auto-regulate tissue oxygen levels and cones die subsequently due to the hyperoxic environment [34]. Previously, we administered (+)-PTZ to rd10 mice and observed significant cone rescue, determined by photopic ERG and a natural luminance noise test, at an age when rd10 cone function is typically non-detectable [19]. Analysis of oxidative stress, lipid peroxidation and protein carbonylation demonstrated that Sig1R activation attenuated oxidative stress in retinas of rd10 mice and importantly normalized levels of NRF2 [19]. In the current in vivo work, we evaluated whether the beneficial effects observed in rd10 mice, when Sig1R was activated using (+)-PTZ, would persist if NRF2 was absent. Our data provide compelling evidence that NRF2 is essential for Sig1R-mediated retinal neuroprotection.
Methods and materials
Cell culture and cell viability assays
661W cells, obtained from Dr. M. Al-Ubaidi (Univ. of Houston), express blue and green cone pigments, transducin and cone arrestin [36] characteristic of cone photoreceptor cells. They were cultured in Dulbecco’s modified Eagle’s medium (DMEM, Thermo Fisher Scientific) supplemented with 1% FBS, 100U/mL penicillin, 100μg/mL streptomycin, in the presence/absence of (+)-PTZ (Sigma-Aldrich, St. Louis, MO), prepared in 10% DMSO in 0.01M phosphate buffered saline (PBS) Viability was assessed using the Vybrant® MTT Cell Proliferation Assay Kit (Thermo Fisher), which measures reduction of yellow 3-(4,5-dimethythiazol-2-yl)-2,5-diphenyl tetrazolium bromide (MTT) by mitochondrial succinate dehydrogenase. In metabolically active cells, MTT enters cells and passes into mitochondria where it is reduced to formazan, an insoluble, dark purple product. Cells were solubilized in isopropanol and released, solubilized formazan reagent was measured spectrophotometrically using a Synergy H1 Hybrid Multi-Mode plate reader (Winooski, VT) at 540nm. The assay was performed in triplicate. Tert-butyl hydroperoxide (tBHP) [5.5M in decane] (Sigma-Aldrich, St. Louis, MO) was dissolved in 0.01M PBS; tBHP is an inducer of oxidative stress [37, 38]. Cells were incubated with (+)-PTZ [0, 3, 10, 20, 50μM] or tBHP [0, 55,110, 220, 440μM] for 24 h.
Immunodetection of Sig1R, NRF2 and oxidative stress
661W cells were seeded on coverslips, grown 24h, fixed with ice-cold paraformaldehyde (Electron Microscopy Science, Hatfield, PA), washed with PBS-Triton X-100, incubated with Power Block (BioGenex, Fremont, CA), and incubated overnight at 4°C with rabbit polyclonal Sig1R antibody (1:1000) [39]. They were incubated with secondary antibodies (anti-rabbit IgG coupled to Invitrogen Alexa Fluor 488, Thermo-Fisher Scientific, Grand Island, NY) for 1 h at 37°C and coverslipped using Fluoroshield with 4’,6-diamidino-2-phenylindol (DAPI) (Sigma-Aldrich) to label the nuclei. Negative controls were treated identically except that PBS replaced primary antibodies. Immunofluorescent signals were visualized using an Axioplan-2 fluorescence microscope (Carl Zeiss, Götingen, Germany) equipped with an HRM camera. Similarly, to detect NRF2 in 661W cells, we used a mouse monoclonal antibody (MAB3925, R&D systems, Minneapolis, MN) and incubated with anti-mouse IgG coupled to Alexa Fluor 488. Images were captured and processed using Zeiss Axiovision software (version 4.7). To assess effects of (+)-PTZ on oxidative stress, 661W cells were seeded on coverslips and were exposed to media containing tBHP [110μM] for 3 h. In companion studies, cells were pretreated 1 h with (+)-PTZ [3μM] and co-treated with tBHP [110μM] for 3 h or were treated with (+)-PTZ [3μM] alone for 3 h. Control experiments were conducted in parallel in which tBHP and (+)-PTZ were omitted from the media. Following treatments, cells were rinsed with PBS and intracellular reactive oxygen species (ROS) were detected in cells using 5μM CellROX Green Reagent (Thermo-Fisher Scientific; 30 min incubation, followed by fixation). CellROX detects hydroxyl, peroxyl, peroxynitrite and hydroxyl radicals. DAPI was used to stain nuclei. Green fluorescent signals representing ROS were visualized using an Axioplan-2 fluorescent microscope (described above). Fluorescence intensity was quantified using NIH Image J 1.48v software.
Quantitative real-time RT-PCR and western blotting
Expression levels of mRNA transcripts specific for Nrf2 (NM_010902) Forward 5’-TAGATGACCATGAGTCGCTTGC-3‘, Reverse5‘-GCCAAACTTGCTCCATGTCC-3‘ (153bp); Gapdh (NM_008084) Forward 5’- AGGTCGGTGTGAACGGATTTG-3’, Reverse 5’-TGTAG ACCATGTAGTTGAGGTCA- 3’ were examined in 661W cells. Total RNA was purified using Trizol (Invitrogen, Carlsbad, CA) per the manufacturer’s protocol and quantified. RNA (2 μg) was reverse-transcribed using the iScript Synthesis kit (BioRad Laboratories, Hercules, CA). cDNAs were amplified 40 cycles using SsoAdvancedTM SYBR Green Supermix (BioRad Laboratories) and gene-specific primers in a CFX96 TouchTM Real-Time PCR Detection System (BioRad Laboratories). Expression levels were calculated by comparison of Ct values (delta-delta Ct) [40].
Protein was extracted from 661W cells as described [25]. Proteins were subjected to SDS-polyacrylamide gel electrophoresis. Immunoblotting was performed to assess the levels of Sig1R (using a rabbit polyclonal antibody generated in our laboratory [39] with specificity confirmed [10]) and NRF2 (Abcam, Cat. ab31163, Lot#GR113841-5). GAPDH (EMD Millipore, Burlington, MA) was used as the protein loading control. Nitrocellulose membranes, to which the proteins had been transferred, were incubated with primary antibodies followed by incubation with horseradish-peroxidase-conjugated goat anti-rabbit or anti-mouse IgG antibody (Santa Cruz, Santa Cruz, CA). Proteins were visualized using SuperSignalWest Pico Chemiluminescent Substrate detection system (Pierce Biotechnology, Rockford, IL). Western blotting images are representative of three or more independent experiments; bands were quantified using NIH Image J 1.48v software. To analyze nuclear versus cytoplasmic proteins, protein was extracted from cells using NE-PER Nuclear and Cytoplasmic Extraction Reagents (Thermo Fisher Scientific) per the manufacturer’s protocol. Fraction purity was confirmed using anti-HDAC1 (Santa Cruz) and anti-GAPDH for nuclear and cytoplasmic fractions, respectively. Protein band densities were quantified as described above for whole cell lysates.
Analysis of KEAP1-NRF2 binding
The KEAP1-NRF2 inhibitor screening assay kit (72020, BPS Biosciences, San Diego, CA) was used to determine whether (+)-PTZ directly inhibits binding of KEAP1 to NRF2. The kit contains: purified KEAP1 protein, fluorescently labeled NRF2 peptide with the ETGE motif. The NRF2 peptide was added to the 96-well plate (provided with the kit), (+)-PTZ [concentrations: 1μM, 3μM, 10μM, 100μM] was added and the binding reaction, initiated by adding purified KEAP1, proceeded for 30 min. Change in fluorescence polarization (FP) was detected using a Synergy 2 Multi-mode reader with FP capability (BioTek Corp., Winooski, VT). FP detects fluorescent molecule rotation in solution (the smaller the molecule, the faster the rotation). NRF2-FITC rotates faster when not bound to KEAP1; when bound in the larger complex it rotates more slowly. From the FP value, the percentage of inhibition of KEAP1-NRF2 binding is calculated. Experiments included blank controls, NRF2 negative binding controls, NRF2 positive binding controls and assays using a known KEAP1-NRF2 peptide inhibitor (70042, BPS Biosciences). Experiments were performed in triplicate.
Additionally, a luciferase (Luc) reporter assay was used to assess the influence of (+)-PTZ on KEAP1-NRF2 binding. Human neuroblastoma SH-SY5Y cells stably expressing Neh2-Luc were grown in the presence of 500 mg/mL Geneticin (Gibco Thermo Fisher Scientific) in DMEM/F12 + GlitaMAX (1:1) (Gibco 10565) medium. The cells were used to measure disruption of KEAP1-NRF2, which leads to expression of transcriptionally active NRF2, by (+)-PTZ [1, 3, 10, 100μM for 3h] compared to the canonical NRF2 activator tBHQ. Luciferase activity was measured on an Lmax11384 luminometer (Molecular Devices, Sunnyvale, CA) with BrightGlo reagent (Promega, Madison, WI) after cell number was estimated using Presto-Blue cell viability assay (ThermoFisher Scientific). The reporter activation was normalized to background luminescence. Kinetics of reporter activation was measured by adding varied fixed concentrations of (+)-PTZ at different time points followed by simultaneous cell lysis and activity measurement in the 96-well plate. Experiments were performed with six replicates. The Neh2-Luc reporter results in constitutive, intracellular synthesis of a novel fusion protein composed of the Neh2 domain of NRF2 and firefly luciferase. The NRF2 Neh2 domain binds KEAP1 and is sufficient for recognition by the ubiquitin-ligase complex and subsequent ubiquitinylation/ degradation of the fusion protein. Neh2-Luc reporter is the ideal tool to monitor direct effects of a compound on the first step controlling NRF2 stability, that is, KEAP1-NRF2 interactions [41].
Analysis of NRF2 activation of AREs
The effects of (+)-PTZ on NRF2 activation and ARE binding efficacy were evaluated in two systems. First, AREc32 cells stably expressing ARE-Luc were grown in DMEM (10% FBS, penicillin-streptomycin plus G418 250mg/mL) and were used to measure activation by (+)-PTZ [3μM, 10μM, 20μM, 50μM, 100μM] v. tBHQ (positive control). Luciferase activity was measured using an Lmax11384 luminometer with BrightGlo as described above. Kinetics of reporter activation was measured by adding varied fixed concentrations of (+)-PTZ at different time points followed by simultaneous cell lysis and activity measurement in a 96-well plate; this assay format minimizes experimental error originating from instability of the luciferase reagent. Experiments were performed in quadruplicate. The second assay was performed using the TransAM NRF2 kit (50296, Active Motif, Carlsbad, CA, USA). The assay is performed in nuclear extracts and is considered highly sensitive and specific for transcription factors. Aliquots of nuclear protein (5-8 μg) extracted from 661W cells treated with (+)-PTZ [3-100μM] were incubated with immobilized oligonucleotides containing the ARE consensus binding site (5’-GTCACAGTACTCAGCAGAATCTG-3’). The active form of NRF2 that bound to the oligonucleotides was detected using anti-NRF2 primary antibody (provided with the kit) followed by incubation with HRP-conjugated secondary antibody. The activity of NRF2 in nuclear extracts, demonstrated by DNA-binding activity of NRF2, was measured by colorimetric detection using a VersaMax microplate reader (Molecular Devices, Sunnyvale, CA, USA) at 450 nm; absorbance values reflected the activity of NRF2.
siRNA transfection to silence Sig1R expression
Sig1R siRNA (ON-TARGETplus Mouse Sigmar1 (18391) siRNA-SMARTpool), and non-targeting, negative control siRNA (scrambled siRNA) were purchased from Dharmacon (Lafayette, CO). Sig1R or scrambled siRNA were transfected into 661W cells using Lipofectamine RNAiMAX transfection reagent (Invitrogen) per instructions. Briefly, the night before transfection, cells were plated 50,000 cells/mL onto 24 well plates. For transfection, 10pmol Sig1R siRNA or scrambled siRNA were mixed with RNAiMax reagent 5 min at room temperature after which RNA-lipid complexes were added to cells. For confirmation of Sig1R knockdown, cells were harvested 3 days post-transfection and lysed in RIPA buffer. Lysates were assayed for Sig1R protein by western blotting. The mouse Sig1R siRNA target sequences were: UAUUCAGACAG CAGCGUAU; GAAAGAGGGCACCACGAAA; GAGAAGAAAUAGCGCAGCU; GCUUGA GCUUACCACCUA. The scrambled siRNA target sequence was: UGGUUUACAUGUC GACUAA.
Animals, administration of (+)-PTZ, and analysis of retinal function and structure
Mice were used according to guidelines of the Institutional Animal Care and Use Committee following our approved protocol. Four groups of mice were used: (1) rd10 mice receiving no treatment (rd10-non), (2) rd10 mice administered (+)-PTZ (rd10+PTZ), (3) rd10/Nrf2−/− mice receiving no treatment (rd10/Nrf2−/− non), (4) rd10/Nrf2−/− mice administered (+)-PTZ (rd10/Nrf2−/−+PTZ). Breeding pairs of homozygous rd10 (B6.CXBI-Pde6βrd10/J) and C57BL/6J (WT) mice were obtained from Jackson Laboratory (Bar Harbor, ME). The rd10 mutation in exon 13 of Pde6β was identified by PCR as described [19]. Nrf2−/− mice (Dr. M. Yamamoto, Tohoku Univ.) used in the study were on a pure C57BL/6 background [42]. Genotyping of Nrf2−/− mice was performed as described [43]. Mice in the treatment groups received intraperitoneal injections of (+)-PTZ (0.5 mg/kg−1) (Sigma-Aldrich) on alternate days beginning P14. The dosage was based on previous studies showing rescue of cone function in rd10 mice [19]. To assess retinal function, mice were subjected to scotopic and photopic electroretinography (ERGs) as well as photopic stimuli that included ‘natural noise’ a slowly varying luminance time series with amplitude inversely proportional to temporal frequency. Retinal architecture was evaluated in vivo using spectral domain-optical coherence tomography (SD-OCT). Following functional analyses, mice were euthanized and eyes harvested for histological evaluation. Additional cryosections of eyes were harvested to assess cone-specific markers. Retinas were prepared also from C57BL/6 wildtype mice for laser scanning confocal imaging and immunoelectron microscopy to detect Sig1R. Retinas of Nrf2−/− mice were used to validate the specificity of antibody against NRF2 and to obtain baseline SD-OCT images. The functional analyses (ERG, OCT), histological assessments and immunodetection of cone-specific markers were performed following our published methods, which are described below. The numbers of mice used for each analysis is provided in Suppl. Table 1.
Evaluation of retinal function by ERG, and structure by SD-OCT and histology
Electroretinograms (ERGs).
Mice were dark-adapted and were anesthetized with isoflurane. ERGs were performed using silver-coated nylon fiber corneal electrodes. To improve electrical contact and prevent drying, the eye was coated with a drop of hypromellose. The stimulating and recording apparatus was custom-made. A 5500° white LED (Lightspeed Technologies, Campbell CA) provided highly controllable illumination, which was delivered to the eyes through 1 mm optic fibers positioned in front of the pupils. Signals were led to a Psychlab EEG8 amplifier (Cambridge MA) and a National Instruments NI-6229 (Austin TX) digitizer connected to a computer running Igor Pro (WaveMetrics Inc., Lake Oswego, OR). Custom software written in Igor generated stimuli and recorded and analyzed the results. Experiments consisted of a series of scotopic tests with 5 ms flashes of increasing luminance, followed by photopic testing with 5 and 500 ms flashes above a pedestal, and photopic stimuli that included a “natural” noise stimulus. The natural noise is a slowly varying continuous luminance time series with amplitude inversely proportional to temporal frequency. Kernels were computed from responses to natural noise stimuli.
Spectral domain-optical coherence tomography (SD-OCT).
Mice were anesthetized with ketamine/xylazine as described [19]. Retinal architecture was assessed in vivo using a Bioptigen Spectral Domain Ophthalmic Imaging System (SDOIS; Bioptigen Envisu R2200, NC). The imagine protocol included averaged single B scan and volume intensity scans with images centered on optic nerve head. Post-imaging analysis included autosegmentation report analysis and manual assessment of retinal layers using InVivoVue™ Diver 2.4 software (Bioptigen). We measured total retinal thickness, inner nuclear layer, outer plexiform layer, and outer nuclear layer. Each layer thickness was plotted separately; data for a given retinal layer in each group were averaged.
Histologic processing of tissue and microscopic analysis:
Eyes enucleated from euthanized mice (age: P42) were prepared for cryosectioning or embedding in JB-4 methacrylate (Electron Microscopy Sciences (EMS), Hatfield, PA) as described [19]. Briefly, eyes to be used for cryosections were flash frozen in liquid nitrogen and embedded in optimal cutting temperature compound (OCT, Elkhart, IN). 10 μm thick cryosections were obtained, which were fixed 10 min in 4% paraformaldehyde, blocked with 10% goat serum in 0.1%Triton-X100/phosphate-buffered saline for 1h at room temperature. Sections were incubated with primary antibodies to detect cones (cone-arrestin, EMD) followed by incubation with Alexa Fluor 488 anti-rabbit IgG (Invitrogen) or with FITC-conjugated peanut agglutinin (PNA) Sigma).Retinas were examined using a Zeiss LSM 780 upright laser scanning confocal microscope (LSCM) equipped with ZEN lite software. For plastic embedding, eyes were immersion-fixed in 2% paraformaldehyde/2% glutaraldehyde in 0.1M cacodylate buffer and processed for JB-4 embedding. Sections were stained with hematoxylin-eosin (H&E), retinal images captured using an Axio Imager D2 microscope equipped with a high-resolution camera and processed using Zeiss Zen23pro software.
Statistical Analysis
Statistical analysis used GraphPad Prism analytical program (LaJolla, Calif., USA), or for the ERG results, Igor Pro (Lake Oswego, OR, USA). Significance was established as p<0.05. Data were analyzed by t-test for studies comparing two samples, by one-way analysis of variance (ANOVA) for studies comparing one parameter among several treatment groups, or two-way ANOVA (factors: mouse group and retinal measurement). We followed the recommendations within the program for appropriate post-hoc testing which included Holm-Bonferroni, Tukey’s and Newman-Keul’s Multiple Comparison Tests. The number of mice needed to achieve statistical power was determined using nQuery Advisor Version 7.0.
Results
Sig1R activation enhances cell viability and attenuates oxidative stress in cone cells
The 661W cell line was used as an in vitro model of cone photoreceptors. There have been more than 150 papers published using this cell line, however only one has examined Sig1R [18]. Therefore, we confirmed the presence of Sig1R in these cells. By western blotting, we established Sig1R labeling in control cells versus those in which Sig1R had been silenced using siRNA technology (Fig. 1A). Using immunocytochemistry and confocal microscopy, we detected Sig1R labeling abundantly in the nucleus and in nuclear membranes of 661W cells (Fig. 1B).
Fig. 1. Activation of Sig1R enhances viability and attenuates oxidative stress.

(A) Immunoblotting to detect SIG1R was performed in 661W cells using a rabbit polyclonal antibody. A band of the expected size (27kD Mr) was detected in 661W cells (control); there was only a faint band detected in 661W cells in which Sig1R gene expression had been silenced using siRNA technology; GAPDH was used as the protein loading control. (B) Immunofluorescence in 661W cells detected Sig1R (green fluorescence), especially in the nucleus and nuclear membrane, the nucleus is labeled with DAPI (blue fluorescence). The viability of 661W cells incubated 24 h with (C) increasing concentrations of (+)-PTZ [0-50μM]; (D) increasing concentrations of tBHP [0-440μM]; or (E) 110μM tBHP in the presence of increasing concentrations of (+)-PTZ [0-50μM] was assessed using the MTT assay. (F) 661W cells were seeded on coverslips for 18 h. Cells either were or were not (control) exposed for 3 h to 110μM tBHP in the presence or absence of (+)-PTZ, including cells treated with (+)-PTZ alone. They were incubated with CellROX® Green Reagent to detect ROS; green fluorescent signals indicating ROS were visualized by epifluorescence; DAPI was used to label nuclei (blue). Scale bar, 50 μm. (G) Quantification of fluorescent intensity reflecting ROS levels of data shown in panel F. Data are presented as mean ± standard error of the mean (SEM). Data represent three independent experiments performed in duplicate. Significant differences are indicated: ** p<0.01, *** p<0.001****p<0.0001. (CT = control, (+)-PTZ = (+)-pentazocine, tBHP = tertiary butyl hydroperoxide).
In previous studies using intact retinal tissue, Sig1R was detected in the nuclear membrane of photoreceptor cells [44], which we confirmed in intact mouse retina using laser scanning confocal microscopy and immunoelectron microscopy (Suppl. Figure 1). There is labeling also in the cytoplasm of 661W cells (Fig. 1B), consistent with its localization to the ER [22, 23, 44-46]. We asked whether incubation of 661W cells with increasing concentrations of the high affinity Sig1R ligand, (+)-PTZ, would alter cell viability. Over a concentration range of 0-50μM, we did not observe altered viability using the MTT assay (Fig. 1C). We evaluated effects of incubation of cells with tBHP, a known inducer of oxidative stress, on cell viability. Over a concentration range of 0-440μM, there was a dose-dependent decrease in cellular viability. In cells exposed 24 h to 55μM or 100μM tBHP there was, respectively, ~40% or 65% decrease in viability (Fig. 1D). We then evaluated whether (+)-PTZ would alter viability in tBHP-treated cells. We observed a dose-dependent improvement in viability when cells, exposed to 110μM tBHP, were incubated 24h with increasing concentrations of (+)-PTZ. There was a significant increase in viability at all (+)-PTZ concentrations tested (Fig. 1E).
We determined whether oxidative stress would be attenuated by treatment with (+)-PTZ. Cells were treated with tBHP [110μM] in the presence or absence of (+)-PTZ and ROS levels were analyzed using CellROX reagent followed by immunofluorescence detection. This fluorogenic probe is weakly fluorescent while in a reduced state, but exhibits bright green photostable fluorescence upon oxidation by ROS. There was minimal ROS detected in control (non-treated cells) and in (+)-PTZ treated cells, but a significant increase in ROS in cells exposed to tBHP (Fig. 1F). tBHP-exposed cells treated with (+)-PTZ showed a marked decrease in ROS production compared to un-treated tBHP–exposed cells suggesting that activation of Sig1R attenuates oxidative stress in 661W cells (Fig. 1F). The data were quantified as fluorescence intensity (Fig. 1G). There was no difference in ROS levels between control and (+)-PTZ-only treated cells, but a highly significant elevation of ROS in tBHP-exposed cells (nearly 2-fold). The level of ROS was dramatically reduced in tBHP-exposed cells treated with (+)-PTZ.
Sig1R activation does not inhibit KEAP1-NRF2 binding, but does increase NRF2-ARE binding and Nrf2 gene expression
NRF2 invokes a powerful cytoprotective response when it translocates from the cytoplasm to the nucleus and activates transcription of many ARE-containing genes [26, 27]. Typically, cytoplasmic NRF2 is released from KEAP1 for nuclear translocation to ensue. One mechanism by which this occurs is via direct inhibition of KEAP1-NRF2 binding, as has been described for tBHQ [30]. To determine whether (+)-PTZ directly inhibits KEAP1-NRF2 binding, we used the fluorescence polarization (FP)-detection method in a cell free system (a KEAP1-NRF2 inhibitor screening assay kit). We incubated the fluorescent NRF2 peptide (provided in the kit) with increasing concentrations of (+)-PTZ [1μM-100μM], added KEAP1 and assessed FP. In this assay, the inhibition of binding in the presence of (+)-PTZ was minimal (generally <1%), whereas inhibition was ~20% and 75% in the presence of KEAP1:NRF2 peptide inhibitor [10μM and 100μM, respectively] (Fig. 2A). The data suggest that (+)-PTZ does not directly inhibit KEAP1-NRF2 binding. The assay is conducted under cell-free circumstances, thus there is no Sig1R present. The findings support earlier studies suggesting that Sig1R is required for (+)-PTZ-mediated neuroprotection in vivo [19] and in vitro [11]. The notion that (+)-PTZ does not disrupt KEAP1-NRF2 binding directly was confirmed using SH-SY5Y cells expressing Neh2-Luc reporter. The Neh2-Luc SH-SY5Y cell-based reporter system features a neuronal cell line (in which Sig1R is present [47,48]) expressing the minimum portion of NRF2 sufficient for recognition by KEAP1 (and subsequent ubiquitination) fused to firefly luciferase. The luciferase response corresponds to NRF2 stabilization and accumulation; it is elevated when NRF2 activators inhibit KEAP1-NRF2 binding. Compounds that disrupt KEAP1-NRF2 binding cause NRF2 to become transcriptionally active, thus luciferase detection increases. In our experiments, treatment of the SH-SY5Y-Neh2-Luc cells did not lead to increased luciferase detection, although incubation with the canonical NRF2 activator tBHQ led to robust luciferase activity (Fig. 2B). The data provide further support that (+)-PTZ is not a direct inhibitor of KEAP1-NRF2 binding.
Fig. 2. Activation of Sig1R does not disrupt KEAP1-NRF2 binding directly, but does increase NRF2-ARE binding and Nrf2 expression.

661W cells were exposed to varying concentrations of (+)-PTZ after which KEAP1-NRF2 binding was analyzed using two methods: (A) fluorescence polarization-based detection assay, and (B) Neh2-Luciferase reporter assay. 661W cells were exposed to varying concentrations of (+)-PTZ and NRF2-ARE binding activity was analyzed using two methods: (C) AREc32 cells stably expressing ARE-Luc and (D) nuclear extracts from 661W cells using TransAM NRF2 kit. 661W cells were exposed (E) to (+)-PTZ [3μM] over a 24 h time course; and (F) to (+)-PTZ [10μM] for 6 and 24 h following which the expression of Nrf2 was determined by qRT-PCR using primer pairs specific for Nrf2. Data are mean ± SEM of triplicate or quadruplicate measurements *p< 0.05. ** p< 0.01; *** p< 0.001, **** p< 0.0001. (CT = control, (+)-PTZ = (+)-pentazocine, tBHQ = tertiary butyl hydroquinone).
The experiments described in Fig. 2A and 2B indicate that neither (+)-PTZ alone nor (+)-PTZ activation of Sig1R, disrupt KEAP1-NRF2 binding directly. Yet earlier studies performed in liver [24] and in retinal Müller glial cells [25] demonstrated that Sig1R activation increased NRF2-ARE binding. Here, we investigated whether activation of Sig1R alters NRF2-ARE binding activity in AREc32 cells stably expressing ARE-Luc. In this assay (+)-PTZ treatment [50, 100μM] increased NRF2-ARE activation (Fig. 2C). We confirmed this finding using the TransAM NRF2 assay, which was conducted in nuclear extracts from 661W cells. In this assay, we observed increased NRF2-ARE binding activity with all concentrations of (+)-PTZ tested compared to non-treated cells (Fig. 2D). Incubation of 661W cells with 3μM, 50μM and 100μM (+)-PTZ resulted in binding that was significantly greater than non-treated cells (Fig. 2D). We then evaluated Nrf2 gene expression in 661W cells treated over a 24 h time period with (+)-PTZ [3μM] and observed an upregulation of Nrf2 when Sig1R was activated, noting that the temporal response was bi-modal. That is, at 30 min, 1 and 2 h there was a significant increase in Nrf2 expression with (+)-PTZ treatment. Over the next several hours, the expression of Nrf2 was similar to baseline (non-treated cells), yet was elevated again at 18 and 24 h exposure times (Fig. 2E). To evaluate whether this was concentration dependent, we exposed 661W cells to a higher concentration of (+)-PTZ [10μM] and observed no change in Nrf2 expression at 6 h, but a marked increase at 24 h (Fig. 2F).
Sig1R activation alters NRF2 protein levels
Given that activation of Sig1R upregulated Nrf2 expression (Fig. 2), we evaluated protein levels of Sig1R and NRF2 in whole lysates of 661W cells exposed 24h to (+)-PTZ over a concentration range of [0-100μM]. There was a dose dependent increase in Sig1R levels with increasing concentrations of (+)-PTZ (Fig. 3A). Quantification of the data showed ~2.0-fold increase in Sig1R at 20μM and 50μM compared with no (+)-PTZ treatment or low (+)-PTZ concentration ([3μM]) (Fig. 3B). Similarly, there was a dose-dependent increase in NRF2 levels with increasing concentrations of (+)-PTZ (Fig. 3C), which, when quantified, reflected a ~2.0-2.5-fold increase in NRF2 at 20μM and 50μM compared with no (+)-PTZ treatment or low (+)-PTZ concentration ([3μM]) (Fig. 3D). (We verified the specificity of the anti-NRF2 antibody using retinal protein from WT mice and from mice lacking NRF2 (Nrf2−/−, Suppl. Fig. 2)). Within cells, Sig1R and NRF2 reside in the cytoplasm and the nucleus, therefore we exposed 661W cells 24h to (+)-PTZ over a concentration range of [0-100 μM] and extracted protein from cytosolic versus nuclear fractions to evaluate levels of SIG1R and NRF2. The purity of the fractions was confirmed by assessing levels of either GAPDH (a cytosolic protein) or HDAC1 (a nuclear protein). Representative immunoblotting data from the two fractions are shown along with quantitation of repetitions of the experiments (Figs. 3E-3L); the ratio of either Sig1R or NRF2 to the respective protein loading control in cells (no (+)-PTZ treatment) was assigned a value of 1. Regarding SIG1R, exposure of cells to (+)-PTZ resulted in a 4-6 fold increase in cytosolic SIG1R (Fig. 3E and 3F). The most significant increase in Sig1R occurred at 20 μM (+)-PTZ, but was still substantial at other (+)-PTZ concentrations (Fig. 3F). Sig1R levels increased in the nucleus as well. We observed a 2-3 fold bi-phasic increase in nuclear Sig1R over a 10-50μM (+)-PTZ concentration range (Fig. 3G and 3H). Regarding NRF2 in the cytosolic fraction, protein levels increased upon exposure to (+)-PTZ, peaking at 20μM (+)-PTZ concentration (3-fold increase) (Fig. 3I,J). Nuclear NRF2 levels increased by ~2-fold with exposure to increasing concentrations of (+)-PTZ (Fig. 3K,L). Thus, not only is the Sig1R protein level increased when SIG1R is activated by (+)-PTZ, but NRF2 levels are also increased in both the cytosol and the nucleus. We used immunocytochemical methods to investigate the location of NRF2 in 661W cells that had been exposed to 20μM (+)-PTZ for 24h compared to untreated cells. Using confocal microscopy we detected increased NRF2 labeling in the cytoplasm and the nucleus of (+)-PTZ-treated cells versus control (untreated) cells (Fig. 3M).
Fig. 3. Sig1R activation increases NRF2 protein level.

661W cells were exposed 24 h to varying concentrations of (+)-PTZ; levels of SIG1R and NRF2 proteins in whole cell lysates (A-D) or in cytosolic/nuclear fractions (E-L) were determined by western blotting. Band densities were quantified using ImageJ and expressed as fold change compared to GAPDH. Representative western blots for (A) SIG1R (C) NRF2 in whole cell lysates and graphical depiction of fold change (protein versus GAPDH) for (B) SIG1R, (D) NRF2. Cytosolic and nuclear protein fractions were prepared and extracts were subjected to western blot analysis to evaluate levels of (E) cytosolic SIG1R, (G) nuclear SIG1R, (I) cytosolic NRF2; (K) nuclear NRF2. Each experiment was performed in triplicate. Band density was quantified as a ratio to GAPDH for the cytosolic fractions of (F) SIG1R and (H) NRF2, and as a ratio to HDAC1 for the nuclear fractions of (J) SIG1R and (L) NRF2. Data are mean ± SEM of triplicate measurements, *p< 0.05. ** p< 0.01; *** p< 0.001, **** p< 0.0001, ns = not significant. (CT = control, (+)-PTZ = (+)-pentazocine). (M) Immunofluorescent detection of NRF2 (green fluorescence) in 661W cells treated with 20μM (+)-PTZ, the nucleus is labeled with DAPI (blue fluorescence). Calibration bar = 20μm.
Silencing Sig1R attenuates NRF2 gene and protein levels
The data from aforementioned experiments demonstrated that activation of Sig1R increases NRF2-ARE activity and NRF2 expression at the gene and protein level. To examine effects on NRF2 levels when SIG1R levels were minimal, we silenced Sig1R in 661W cells and evaluated NRF2 protein levels by western blot analysis. We confirmed that SIG1R protein levels were significantly reduced in cells transfected with Sig1R siRNA compared to cells transfected with scrambled siRNA (Fig. 4A and 4B). Western blot analysis to detect NRF2 levels under these same conditions (i.e. Sig1R siRNA versus scrambled siRNA) showed a marked attenuation of NRF2 protein in cells transfected with Sig1R siRNA (Fig. 4C,4D). Thus, not only does activation of Sig1R via the high affinity ligand (+)-PTZ increase levels of NRF2 (Fig. 3), silencing Sig1R attenuates its expression. There was minimal effect on NRF2 protein levels in cells transfected with scrambled siRNA (Fig. 4C, 4D). Sig1R siRNA transfection did not alter the viability of 661W cells compared to scrambled siRNA-transfected cells (Fig. 4E). We evaluated the viability of Sig1R siRNA-transfected 661W cells treated with (+)-PTZ in the presence or absence of oxidative stress induced by exposure to tBHP. There was no difference in viability of control cells versus (+)-PTZ-treated cells (Fig.4F). There was a significant decrease in viability of Sig1R siRNA-transfected-661W cells exposed to tBHP, which was not improved by treatment with (+)-PTZ (Fig. 4F). These data are in contrast to that shown in Fig. 1E in which the viability of 661W cells (containing Sig1R) showed reduced viability upon exposure to tBHP, but significant improvement in the presence of (+)-PTZ.
Fig. 4. NRF2 levels are attenuated and oxidative stress is increased in 661W cells in which Sig1R has been silenced.

(A) Immunoblotting to detect SIG1R in 661W cells transfected with either “scrambled” siRNA or Sig1R siRNA. (B) Quantitation of multiple repetitions of the experiment shown in A. (C) Immunoblotting to detect NRF2 in 661W cells in cells transfected with either “scrambled” siRNA or Sig1R siRNA. (D) Quantitation of multiple repetitions of the experiment shown in C. (E) Cell viability was assessed using the MTT assay in 661W cells 3 days after transfection with either “scrambled” siRNA or Sig1R siRNA; there was no significant difference in viability between the two groups. 3 days after transfection with Sig1R siRNA, 661W cells were treated 18h with 110μM tBHP in the presence/absence of PTZ ([10μM], 30 min pretreatment followed by co-treatment). Cell viability was assessed using the MTT assay. Data were analyzed using one-way ANOVA and in cases of multiple comparisons (F) the Tukey-Kramer post-hoc test for multiple comparisons. (G) Cells were incubated with CellROX® Green Reagent to detect ROS; green fluorescent signals indicating ROS were visualized by epifluorescence; DAPI was used to label nuclei (blue). Scale bar, 100 μm. (H) Quantification of fluorescent intensity reflecting ROS levels of data shown in panel G. (I) Cells transfected as described for panel A were exposed to 110 μM tBHP, a known oxidative stress inducer in the presence or (+)-PTZ [10μM] and oxidative stress was assessed using CellROX® Green Reagent. (J) Quantification of fluorescent intensity reflecting ROS levels of data shown in panel (B). Data are mean ± SEM of triplicate measurements *** p< 0.001; ****p<0.0001. (CT = control, (+)-PTZ = (+)-pentazocine, tBHP = tertiary butyl hydroperoxide, ns = not significant).
We investigated whether, in the absence of Sig1R, levels of oxidative stress would be altered in 661W cells. We transfected cells with Sig1R siRNA and assessed ROS levels using CellROX reagent. In cells that had not been transfected, there was minimal detection of oxidative stress (Fig. 4G). ROS levels, detected by fluorescence intensity, increased significantly in Sig1R siRNA-transfected cells compared with cells transfected with scrambled siRNA or cells that had not been transfected (Fig. 4G). Quantitation of the data from this experiment, which was performed in triplicate, is shown in Fig. 4H. We used the CellROX reagent to assess oxidative stress in Sig1R siRNA-transfected 661W cells treated with (+)-PTZ compared to cells receiving no treatment, as well as cells that were exposed to tBHP, in the presence or absence of (+)-PTZ. Oxidative stress levels in non-transfected, non-treated cells were minimal; they increased substantially in Sig1R siRNA-transfected 661W cells (Fig. 4I and 4J). Moreover, there was significantly more oxidative stress detected in the Sig1R siRNA-transfected cells exposed to tBHP compared to control or (+)-PTZ-only treated cells. (+)-PTZ treatment of Sig1R siRNA-transfected cells exposed to tBHP did not attenuate oxidative stress (Fig. 4J).
Sig1R activation does not rescue cone photoreceptor cells in rd10 mice lacking NRF2: functional and in situ structural analyses
The data presented in Figs 1-4 indicate that, in vitro, activation of Sig1R attenuates oxidative stress, increases NRF2-ARE binding, and increases NRF2 expression at the gene and protein level, while silencing Sig1R is associated with decreased levels of NRF2 and increased oxidative stress. Whether NRF2 is actually involved in Sig1R-mediated retinal neuroprotection in vivo was addressed by crossing a murine model of severe retinal degeneration (Pde6βrd10, hereafter termed rd10 mouse) with mice that lacked NRF2 (Nrf2−/− mouse), thereby generating rd10/Nrf2−/− mice. We assessed consequences of Sig1R activation on retinal function and structure in these mutant mice. The numbers of mice used for the analyses are provided in Suppl. Table 1.
Rd10 and rd10/Nrf2−/− mice administered (+)-PTZ on alternate days, beginning at P14, were subjected to comprehensive ERG analysis at P35 to assess cone (photopic) and rod (scotopic) function. Responses were compared with age-matched rd10-non-treated (rd10-non) and rd10/Nrf2−/− (rd10/Nrf2−/−-non) mice. There were more detectable responses to photopic flash in rd10+PTZ mice compared to non-treated rd10 mice, but minimal cone response in (+)-PTZ-treated rd10/Nrf2−/− mice (Fig. 5A,5B). An even stronger rescue of cone function was observed in rd10+PTZ mice when tested with a stimulus that changed more slowly in time (Fig. 5C). This natural stimulus (“green noise”) produced responses in rd10+PTZ mice that were greater than non-treated rd10 mice (Fig. 5C, blue trace). This improved response was not observed in (+)-PTZ-treated rd10/Nrf2−/− mice (Fig. 5C, orange trace). The response in rd10/Nrf2−/− mice ((+)-PTZ treated and non-treated) was diminished compared to rd10 mice. In both groups of mice, the response was markedly attenuated compared to (+)-PTZ-treated rd10 mice. The data suggest that the Sig1R-mediated cone rescue observed in rd10 mice is attenuated markedly when NRF2 is absent. Regarding retinal function obtained under dark-adapted conditions (scotopic responses) for mice in the four groups (rd10, rd10+PTZ, rd10/Nrf2−/−, rd10/Nrf2−/− +PTZ), the scotopic a-waves were minimal for all mice regardless of (+)-PTZ treatment. The a-wave represents rod function, which is virtually non-existent in the mice; moreover the tracings obtained under this condition were abnormal (as the b-waves show clear negative scotopic thresholds). Representative tracings are shown in Suppl. Fig. 3A. Typically in normal mice, there is a prominent a-wave, the b-wave amplitude registers 100-700mV and there is no negative response following the b-wave (illustrated in the inset, Suppl. Fig. 3), whereas the responses for mice tested in this study were atypical. The average scotopic a-wave data for the animals studied are provided in Fig. 3B, and the amplitude achieved at the highest luminous intensity was ~15μV. There was a significant improvement in the scotopic b-wave amplitude (highest luminous intensity) in rd10+PTZ mice compared to the other three groups (Fig. 5D). The b-wave reflects bipolar function, which in the absence of rods, likely reflects contributions of other retinal cells.
Fig. 5. Photopic ERG responses and in vivo retinal structure are not improved in rd10/Nrf2−/− mice treated with (+)-PTZ.

Photopic ERG responses were performed on four groups of mice: (1) rdl0 mice receiving no treatment, (2) rdl0 mice administered (+)-PTZ (rdl0+PTZ), (3) rdl0/Nrf2−/− mice receiving no treatment, (4) rd10/Nrf2−/− mice administered (+)-PTZ (rd10/Nrf2−/−+PTZ). Averaged responses to photopic flashes are shown for (A) 0.5 sec and (B) 2.0 sec testing periods. (C) Averaged kernels derived from responses to natural noise stimuli. (D) Averaged scotopic ERG responses to 5 ms flashes at a series of intensities for rd10, rd10+PTZ, rd10/Nrf2−/−, rd10/Nrf2−/−+PTZ. Intensities are in units of candela-seconds per meter squared. (***p=0.002 for rd10+PTZ at highest intensity compared to all other groups). Panels E-H: Representative SD-OCT data obtained from rd10, rd10+PTZ, rd10/Nrf2−/−, rd10/Nrf2−/−+PTZ at P42. (I-L) Data from segmentation analysis for (I) total retinal thickness; (J) outer nuclear layer (ONL) thickness; (K) outer plexiform layer (OPL) thickness, (L) inner nuclear layer (INL) thickness. OCT data are the mean ± SEM of analyses in 7-12 mice per group (Table S1). Significance: *p < 0.05,**p < 0.01, ***p < 0.001 ****p < 0.0001. (nfl = nerve fiber layer, ipl = inner plexiform layer, inl = inner nuclear layer, opl = outer plexiform layer, rpe = retinal pigment epithelium). Note: The onl (outer nuclear layer) is visible in the rd10+PTZ mouse retina (F) as indicated by white arrow, but is not visible in retinas of mice in the other 3 groups.
We visualized the structure of retinas in situ using SD-OCT, representative images are shown (Fig. 5E-5H). At P42, the rd10 mouse retina is ~110-115 μm thick (Fig. 5E). There is often significant detachment in rd10 mice by this age as the inner and outer segments are markedly diminished. As reported previously [19], (+)-PTZ-treated rd10 mice have retinas that are significantly thicker (~125μm) (Fig. 5I) and the area of detachment is reduced (Fig. 5F). The outer nuclear layer (ONL) is significantly thicker in the rd10+PTZ mice compared to non-treated rd10 mice (Fig. 5J). The outer plexiform (OPL) and inner nuclear layers (INL) are also thicker in the rd10+PTZ mice compared to non-treated rd10 mice (Fig. 5K, 5L). SD-OCT analysis of retinas of rd10/Nrf2−/− were similar in thickness to rd10 mice and there was no improvement in the total retinal thickness, nor the thickness of ONL, OPL or INL in (+)-PTZ-treated rd10/Nrf2−/− mice. It is relevant to this experimental design that retinas of Nrf2−/− mice develop normally; they do not manifest retinal pathology until ~12 months of age when drusen-like deposits, lipofuscin accumulation, choroidal neovascularization are detected [49]. We performed SD-OCT on four Nrf2−/− mice (age P42) and observed no retinal thinning, no detachment and no disruption in any animals. Data for left and right eyes are shown (Suppl. Fig. 4).
Sig1R activation does not rescue cone photoreceptor cells in rd10 mice lacking NRF2: histological and immunohistochemical analyses
Following the functional analyses (Fig. 5), animals from each of the four groups were euthanized and eyes were processed to evaluate retinal histology. Representative histologic sections of (+)-PTZ-treated rd10 and rd10/Nrf2−/− mice compared with untreated rd10 and rd10/Nrf2−/− mice are shown in Fig. 6A-D. By post-natal day 42, the rd10 retina (Fig. 6A), is less than half the thickness of the wildtype (WT) mouse retina (Fig. 6, inset) and the rd10 ONL is rudimentary; it is characterized by less than one row of cells, a marked reduction compared to the typical 10-12 rows of cells observed in WT. The histology of the (+)-PTZ-treated rd10 retina (Fig. 6B) reflects ~2 rows of cells in the ONL and a significantly thicker retina overall compared with the rd10 non-treated retina (146.9 ± 2.7μm versus 131.1 ± 3.6μm, respectively p<0.01). The rd10/nrf2−/− non-treated retina is similar in appearance to the rd10 non-treated with only ~1 row of photoreceptors in the ONL and an average retinal thickness of 127.4 ± 3.8μm (Fig. 6C). Regarding the effectiveness of Sig1R activation in rescuing cones in the absence of NRF2, there was not an improvement in total retinal thickness (126.8±6.8μm) nor number of rows of photoreceptor cells in the (+)-PTZ-treated rd10/nrf2−/− retina (Fig. 6D). To evaluate the outer nuclear layer for the presence of cones, we used two antibodies that are known cone markers, cone-arrestin and PNA-FITC. In the rd10-non-treated retinas, there was minimal labeling for cone arrestin (Fig. 6E), whereas there was robust detection of cone arrestin in the (+)-PTZ-treated rd10 retinas (Fig. 6F). For the rd10/nrf2−/− retina, the labeling for cone arrestin was minimal (Fig. 6G) and detection of this marker was not increased in the (+)-PTZ-treated rd10/nrf2−/− retinas (Fig. 6H). Similar results were obtained when PNA-FITC was used to label cones. There was minimal detection in rd10-non-treated (Fig. 6I), rd10/nrf2−/− non-treated (Fig. 6K) and rd10/nrf2−/−-(+)-PTZ treated mice (Fig. 6L), whereas PNA levels were clearly visible in rd10+PTZ-treated mice (Fig. 6J). The data suggest that cones are preserved in the (+)-PTZ-treated rd10 retinas, at least through P42, whereas they are not in retinas of rd10 mice lacking Nrf2 (rd10/nrf2−/− retinas). Thus, activation of Sig1R via the treatment with (+)-PTZ was not effective in rescuing cones in the rd10 retina when NRF2 is absent. We isolated protein from retinas of rd10 mice to investigate Sig1R levels by immunoblotting and observed that protein levels were elevated in (+)-PTZ-treated rd10 mice compared with non-treated rd10 mice (Suppl. Fig. 5A). Earlier results from our lab showed that (+)-PTZ treatment yields a significant increase in Sig1R protein in WT retinas [50], which we confirmed as well (Suppl. Fig. 5B).
Fig. 6. Cone photoreceptor cells are not rescued in rd10/Nrf2−/− mice treated with (+)-PTZ.

Retinal sections of eyes embedded in JB-4 and stained with H&E from a WT mouse (boxed side panel) and four groups of mice: (A) rd10 mice receiving no treatment, (B) rd10 mice administered (+)-PTZ (rd10+PTZ), (C) rd10/Nrf2−/− mice receiving no treatment, (D) rd10/Nrf2−/− mice administered (+)-PTZ (rd10/Nrf2−/−+PTZ). Note that two rows of photoreceptor cells are present in the rd10+PTZ retinas, but not in the other mouse groups. The sections are representative of the retinas analyzed; the numbers of mice evaluated are provided in Suppl. Table 1. Additional eyes were harvested from the four groups and processed for cryosectioning to detect cone-arrestin or PNA-FITC, both markers of cone photoreceptors. Cone arrestin labeling for (E) rd10-no treatment, (F) rd10+PTZ, (G) rd10/nrf2−/−-no treatment, (H) rd10/nrf2−/−+PTZ; PNA-FITC labeling for (I) rd10-no treatment, (J) rd10+PTZ, (K) rd10/nrf2−/−-no treatment, (L) rd10/nrf2−/−+PTZ. Abbreviations: nfl, nerve fiber layer; gcl, ganglion cell layer, ipl, inner plexiform layer; inl, inner nuclear layer; opl, outer plexiform layer; onl, outer nuclear layer; is, inner segment; os, outer segment; rpe, retinal pigment epithelium.
Discussion
The present study investigated the role of NRF2 in Sig1R-mediated retinal photoreceptor protection in vitro and in vivo. The in vitro studies detected Sig1R in the cytoplasm and nuclear membrane of 661W cells consistent with previous immunolocalization studies performed in Müller and photoreceptor cells [23,44]. Exposing these cells to an oxidative stressor (tBHP) decreased their viability, which was reversed when Sig1R was activated using the high-affinity ligand (+)-PTZ. These data are consistent with Sig1R-mediated protection against oxidative stress [24,25].
One potential explanation for these effects is that (+)-PTZ treatment alters NRF2 binding to KEAP1, a sensor for oxidative and electrophilic stress. KEAP1 is a substrate-recognition subunit for a cullin3-based ubiquitin E3 ligase. In the absence of cellular stress NRF2 is bound to KEAP1, which enables ubiquitination and proteolytic degradation of excess NRF2 [51]. During stress, modifications of cysteine residues in KEAP1 prevent NRF2 degradation permitting it to translocate to the nucleus. We used a cell-free FP-based assay, which detects the rotation of NRF2-FITC and observed minimal inhibition of KEAP1-NRF2 binding in (+)-PTZ-treated samples, but robust inhibition in samples incubated with KEAP1:NRF2 peptide inhibitor. We verified these results using SH-SY5Y cells stably expressing Neh2-luciferase; Neh2 is the portion of NRF2 that directly binds KEAP1. There is considerable interest in compounds that can disrupt KEAP1-NRF2 interactions [52]. Our data indicate that (+)-PTZ is not such a compound; it does not inhibit KEAP1-NRF2 binding (in the cell-free assay) nor disrupt KEAP1-NRF2 binding in SH-SY5Y cells, which are known to express Sig1R [47,48].
Nevertheless, (+)-PTZ-induced activation of Sig1R in 661W cells significantly increased the binding of NRF2 to AREs. This binding activity is the pivotal molecular event in activating cytoprotective genes. In addition to increasing NRF2-ARE binding, activation of Sig1R by (+)-PTZ significantly increased Nrf2 expression. To our knowledge, this is the first evidence that activation of Sig1R alters expression levels of this key antioxidant transcription factor. We find it intriguing that activation of Sig1R can modulate NRF2 activity and Nrf2 expression despite having no apparent role in disrupting KEAP1-NRF2 interaction. These findings prompted investigation of NRF2 protein levels.
NRF2 protein levels increased in whole cell lysates of (+)-PTZ-treated 661W cells and as well as cytosolic and nuclear fractions of these cells. This was confirmed using fluorescence immunocytochemistry. Studies from the Ruoho laboratory reported increased activation of AREs in Sig1R-transfected COS-7 cells, while cells treated with Sig1R antagonists reduced ARE activation [24]. They also reported significantly increased ROS levels in liver and lung harvested from Sig1R−/− mice. Similarly, in studies using retinal Müller cells isolated from Sig1R−/− mice, ROS levels increased whereas ARE activity and NRF2 levels decreased [25]. In the current study, we silenced Sig1R in 661W cells and observed decreased NRF2 levels. In Sig1R siRNA-transfected cells we observed increased levels of ROS, consistent with the earlier findings in cells isolated from Sig1R−/− mice [24,25]. Taken collectively, it appears that activation of Sig1R increases NRF2 activity and expression, whereas eliminating Sig1R has the opposite effect. These novel findings suggest a new mechanism by which Sig1R mediates cell survival.
The in vitro studies suggest a relationship between Sig1R activation and NRF2, but do not test the extent to which NRF2 is involved in Sig1R-mediated retinal neuroprotection in vivo. Earlier studies of rd10 mice revealed increased retinal oxidized lipids and proteins, which diminished significantly in rd10+PTZ mice [19]. The (+)-PTZ treatment was associated with decreased superoxide levels and normalization of NRF2 levels (similar to retinas of WT mice) [19]. Oxidative stress is prominent in the rd10 retinal phenotype [14,19,53,54]; whether Sig1R activation quells oxidative stress via NRF2, however, remained to be tested. We approached this question by generating rd10/nrf2−/− mice, administering (+)-PTZ over the course of several weeks and assessing retinal function and structure. We reasoned that if NRF2 is a factor underlying cone rescue due to Sig1R activation, then (+)-PTZ treated rd10/nrf2−/− mice would show minimal improvement in cone function or survival.
(+)-PTZ treatment of rd10/nrf2−/− mice did not improve functional outcomes compared to non-treated rd10/nrf2−/− mice. For example, while (+)-PTZ treatment of rd10 mice yielded improved responses in an electrophysiological visual test utilizing natural noise stimuli (termed “green noise”), this was not the case in rd10/nrf2−/− mice administered (+)-PTZ. Additionally OCT studies showed total retinal thickness and thickness of individual retinal layers was greater in rd10-(+)-PTZ treated mice than rd10 non-treated, but not in rd10/nrf2−/− regardless of (+)-PTZ treatment. Histological examination of retinal architecture yielded similar findings. The preservation of cones observed in rd10-(+)-PTZ treated mice was not evident in (+)-PTZ-treated rd10/nrf2−/− mice. We conclude that in the absence of NRF2, activation of Sig1R does not mediate robust rescue of cone cells in rd10 mice. These findings implicate NRF2 as a critical component by which Sig1R confers cone neuroprotection.
Sig1R was originally confused with opioid receptors and then orphan receptors with no biological function, however the ubiquitously-expressed Sig1R is now recognized as relevant to many neurodegenerative diseases with remarkable potential as therapeutic targets [55]. Given its location in several organelles including the ER and ER-mitochondrial associated membrane (MAM), Sig1R has been proposed to act as a molecular chaperone with pluripotent survival-enhancing properties [2]. Early investigations of these properties focused on interactions between Sig1R, IP3R3 and ankyrin [56,57] and Sig1R with ER stress-related proteins such as BiP (binding protein, GRP78) [22]. In studies of retinal ganglion cells, mechanisms proposed for Sig1R-mediated protection in vitro include modulation of calcium channels [58] and extracellular signal-regulated protein kinase (ERK1/2) [59,60]. We submit that based on our current study, another mechanism by which Sig1R enhances cellular survival, at least in cone photoreceptor cells, is via NRF2 activation. Sig1R is present in the cytosol and nuclear membrane of photoreceptor cells [36], which we confirmed in the present study. Whether Sig1R interacts directly with NRF2 in photoreceptor cells is an important question that is under investigation.
Duh’s laboratory demonstrated beneficial effects of activating NRF2 in retinal disease, including light-induced photoreceptor cell degeneration [61] retinal ischemia-reperfusion [62, 63, 64] and diabetic retinopathy [65]. To our knowledge, the current study represents the first evidence that Sig1R may delay cone loss through its impact on NRF2 function. Understanding mechanism(s) by which Sig1R activation protects cones is needed if this receptor is to be considered seriously as a target for treating severe retinopathies. Cones allow us to read, to recognize faces, and to perform visual functions in bright light; they are responsible for “best” vision. Developing novel therapies that can retain cone function, even if rods are lost, would have a major impact on humans afflicted with severe retinal dystrophy.
Supplementary Material
Supplemental Fig 1. Detection of Sig1R in mouse photoreceptor cells. Adult wildtype C57BL/6 mice were euthanized per our IACUC-approved protocol and eyes were harvested for cryosections. (A) Sig1R was detected by laser scanning confocal microscopy (LSCM). The image shows the nuclei within the outer nuclear layer and there is distinct labeling of Sig1R around the nuclei (green fluorescence is Sig1R, blue fluorescence is DAPI, which labels nuclei). The inset shows higher magnification of the nuclear membrane labeling. Eyes were also prepared for post-embedding electron microscopy (EM) and anti-Sig1R conjugated to an 18nm gold particle was used. At this high magnification using EM we can distinguish (B) rod photoreceptor (PRC) nuclei from (C) cone PRC nuclei. In both rods and cones, Sig1R is detected on the nuclear membrane (arrows) and there is labeling within the nucleus as well.
Supplemental Fig 2. Evaluation of the specificity of the NRF2 antibody in retinas isolated from WT and Nrf2−/− mice. Retinas were isolated from euthanized, age-matched WT and Nrf2−/− mice, protein extracted and subjected to SDS-PAGE followed by immunoblotting to detect NRF2. In the WT retina, a band was detected (~95 Mr) corresponding to the biologically relevant molecular weight of NRF2, whereas in retinal protein isolated from Nrf2−/− mice, there was minimal detection of a band. The data suggest that the antibody used in immunoblotting experiments (Fig. 3) detected NRF2. GAPDH served as the loading control.
Supplemental Fig 3. Scotopic a-wave amplitudes. Scotopic ERG responses were performed on four groups of mice: (1) rd10 mice receiving no treatment, (2) rd10 mice administered (+)-PTZ (rd10+PTZ), (3) rd10/Nrf2−/− mice receiving no treatment, (4) rd10/Nrf2−/− mice administered (+)-PTZ (rd10/Nrf2−/−+PTZ). (A) Representative tracings at five increasing intensities of light are shown (upper left panel is dimmest, lower right panel is brightest). The a-waves are minimal in all animals tested indicating very limited rod function and there is an unusual negative response following the b-waves. For comparison, the inset shows a typical tracing for normal rod function (“a-wave”) and normal (robust) bipolar cell function (“b-wave”). (B) Averaged a-wave amplitude of scotopic ERG responses to 5 ms flashes at a series of intensities for rd10, rd10+PTZ, rd10/Nrf2−/−, rd10/Nrf2−/−+PTZ. Intensities are in units of candela-seconds per meter squared (cd-s/m2).
Supplemental Fig 4. SD-OCT of nrf2−/− mice. SD-OCT was performed on four nrf2−/− mice age-matched with animals analyzed in Fig. 5 (P42). Images for the left (L) and right (R) eyes of the mice (numbered 1-4) show a normal retinal phenotype with clear delineation of inner and outer nuclear and plexiform layers. (gcl = ganglion cell layer, inl = inner nuclear layer, onl = outer nuclear layer).
Supplemental Fig 5. Analysis of Sig1R protein levels in retinas of rd10 mice. Retinas were isolated from (A) rd10 non-treated and rd10+PTZ mice or (B) WT non-treated and WT+PTZ mice; protein was extracted and subjected to SDS-PAGE followed by immunoblotting to detect Sig1R; β-tubulin was used as the loading control. Band density was quantified using ImageJ. Significance: *p < 0.02.
Highlights.
Oxidative stress is a major contributor to retinal degenerative disease
Sigma 1 receptor (Sig1R) activation attenuates oxidative stress in retinal disease
Sig1R activation increases NRF2 gene/protein expression and NRF2-ARE binding
In the absence of NRF2, Sig1R activation does not rescue mouse cone photoreceptors
Acknowledgements
We acknowledge Dr. Brendan Marshall, Mrs. Elizabeth Perry and Mrs. Penny Roon for excellent assistance with light/electron microscopic studies; we acknowledge the Imaging Core for technical advice in capturing LSCM images in this study. We acknowledge Prof. Roland Wolf (University of Dundee) for AREc32 cells. We acknowledge Dr. Masayuki Yamamoto, Tohoku University, Sendai, Japan for his generous gift of the Nrf2−/− mice to Dr. B. Thomas. This work was supported by the National Institutes of Health (R01 EY014560, EY028103, R01 EY027406, R01NS101967, GM130142), the Foundation Fighting Blindness (TA-NMT-0617-021-AUG) and the James and Jean Culver Vision Discovery Institute of Augusta University.
Footnotes
Publisher's Disclaimer: This is a PDF file of an unedited manuscript that has been accepted for publication. As a service to our customers we are providing this early version of the manuscript. The manuscript will undergo copyediting, typesetting, and review of the resulting proof before it is published in its final citable form. Please note that during the production process errors may be discovered which could affect the content, and all legal disclaimers that apply to the journal pertain.
References
- 1.Schmidt HR, Zheng S, Gurpinar E, Koehl A, Manglik A, Kruse AC. Crystal structure of the human σ1 receptor. Nature. 532:527–30;2016. [DOI] [PMC free article] [PubMed] [Google Scholar]
- 2.Su TP, Su TC, Nakamura Y, Tsai SY. The Sigma-1 Receptor as a Pluripotent Modulator in Living Systems. Trends Pharmacol Sci. 37:262–278;2016. [DOI] [PMC free article] [PubMed] [Google Scholar]
- 3.Tadić V, Malci A, Goldhammer N, Stubendorff B, Sengupta S, Prell T, Keiner S, Liu J, Guenther M, Frahm C, Witte OW, Grosskreutz J. Sigma 1 receptor activation modifies intracellular calcium exchange in the G93A(hSOD1) ALS model. Neuroscience. 359:105–118;2017. [DOI] [PubMed] [Google Scholar]
- 4.Mavlyutov TA, Baker EM, Losenegger TM, Kim JR, Torres B, Epstein ML, Ruoho AE. The Sigma-1 Receptor-A Therapeutic Target for the Treatment of ALS? Adv Exp Med Biol. 964:255–265;2017. [DOI] [PubMed] [Google Scholar]
- 5.Mancuso R, Oliván S, Rando A, Casas C, Osta R, Navarro X. Sigma-1R agonist improves motor function and motoneuron survival in ALS mice. Neurotherapeutics. 9:814–26;2012. [DOI] [PMC free article] [PubMed] [Google Scholar]
- 6.Estrada Valencia M, Herrera-Arozamena C, de Andrés L, Pérez C, Morales-García JA, Pérez-Castillo A, Ramos E, Romero A, Viña D, Yáñez M, Laurini E, Pricl S, Rodríguez-Franco MI. Neurogenic and neuroprotective donepezil-flavonoid hybrids with sigma-1 affinity and inhibition of key enzymes in Alzheimer's disease. Eur J Med Chem. 156:534–553;2018. [DOI] [PubMed] [Google Scholar]
- 7.Hyrskyluoto, Pulli I, Tornqvist K, Ho TH, Korhonen L, Lindholm D. Sigma-1 receptor agonist PRE084 is protective against mutant huntingtin-induced cell degeneration: involvement of calpastatin and the NF-kappaB pathway Cell Death Dis. 4, p. e646;2013. [DOI] [PMC free article] [PubMed] [Google Scholar]
- 8.Francardo V, Schmitz Y, Sulzer D, Cenci MA. Neuroprotection and neurorestoration as experimental therapeutics for Parkinson's disease. Exp Neurol. 298(Pt B):137–147;2017. [DOI] [PubMed] [Google Scholar]
- 9.Smith SB, Wang J, Cui X, Mysona B, Zhao J, Bollinger KE Sigma 1 Receptor as a therapeutic target in retinal disease. Progress in Retinal and Eye Research. . 67:130–149;2018. [DOI] [PMC free article] [PubMed] [Google Scholar]
- 10.Ha Y, Saul A, Tawfik A, Williams C, Bollinger K, Smith R, Tachikawa M, Zorrilla E, Ganapathy V, Smith SB. Late-onset inner retinal dysfunction in mice lacking sigma receptor 1 σR1). Invest Ophthalmol Vis Sci. 52:7749–60;2011. [DOI] [PMC free article] [PubMed] [Google Scholar]
- 11.Ha Y, Saul A, Tawfik A, Zorrilla EP, Ganapathy V, Smith SB. Diabetes accelerates retinal ganglion cell dysfunction in mice lacking sigma receptor 1. Mol Vis. 18, 2860–2870;2012. [PMC free article] [PubMed] [Google Scholar]
- 12.Mavlyutov TA, Nickells RW, Guo LW. 2011. Accelerated retinal ganglion cell death in mice deficient in the Sigma-1 receptor. Mol Vis. 17, 1034–1043. 2012. [PMC free article] [PubMed] [Google Scholar]
- 13.Wang J, Cui X, Roon P, Smith SB. Role of Sigma 1 Receptor in Retinal Degeneration of the Ins2Akita/+ Murine Model of Diabetic Retinopathy. Invest Ophthalmol Vis Sci. 57:2770–81;2016. [DOI] [PMC free article] [PubMed] [Google Scholar]
- 14.Wang J, Saul A, Cui X, Roon P, Smith SB. Absence of Sigma 1 Receptor accelerates photoreceptor cell death in a murine model of retinitis pigmentosa. Invest Ophthalmol Vis Sci. 58, 4545–4558;2017. [DOI] [PMC free article] [PubMed] [Google Scholar]
- 15.Yang H, Fu Y, Liu X, Shahi PK, Mavlyutov TA, Li J, Yao A, Guo SZ, Pattnaik BR, Guo LW. Role of the sigma-1 receptor chaperone in rod and cone photoreceptor degenerations in a mouse model of retinitis pigmentosa. Mol Neurodegener. 12,68;2017. [DOI] [PMC free article] [PubMed] [Google Scholar]
- 16.Bucolo C, Marrazzo A, Ronsisvalle S, Ronsisvalle G, Cuzzocrea S, Mazzon E, Caputi A, Drago F. A novel adamantane derivative attenuates retinal ischemia-reperfusion damage in the rat retina through sigma1 receptors. Eur J Pharmacol. 536, 200–203;2006. [DOI] [PubMed] [Google Scholar]
- 17.Smith SB, Duplantier J, Dun Y, Mysona B, Roon P, Martin PM, Ganapathy V. In vivo protection against retinal neurodegeneration by sigma receptor 1 ligand (+)-pentazocine. Invest Ophthalmol Vis Sci. 49:4154–61;2008. [DOI] [PMC free article] [PubMed] [Google Scholar]
- 18.Shimazawa M, Sugitani S, Inoue Y, Tsuruma K, Hara H. Effect of a sigma-1 receptor agonist, cutamesine dihydrochloride (SA4503), on photoreceptor cell death against light-induced damage. Exp Eye Res. 132, 64–72;2015. [DOI] [PubMed] [Google Scholar]
- 19.Wang J, Saul A, Roon P, Smith SB. Activation of the molecular chaperone, sigma 1 receptor, preserves cone function in a murine model of inherited retinal degeneration. Proc Natl Acad Sci U S A. 113:E3764–72;2016. [DOI] [PMC free article] [PubMed] [Google Scholar]
- 20.Klette KL, DeCoster MA, Moreton JE, Tortella FC. Role of calcium in sigma-mediated neuroprotection in rat primary cortical neurons. Brain Res. 704, 31–41; 1995. [DOI] [PubMed] [Google Scholar]
- 21.Tchedre KT, Huang RQ, Dibas A, Krishnamoorthy RR, Dillon GH, Yorio T. Sigma-1 receptor regulation of voltage-gated calcium channels involves a direct interaction. Invest Ophthalmol Vis Sci. 49:4993–5002;2008. [DOI] [PubMed] [Google Scholar]
- 22.Hayashi T, Su TP. Sigma-1 receptor chaperones at the ER-mitochondrion interface regulate Ca(2+) signaling and cell survival. Cell. 131:596–610;2007. [DOI] [PubMed] [Google Scholar]
- 23.Jiang G, Mysona B, Dun Y, Gnana-Prakasam JP, Pabla N, Li W, Dong Z, Ganapathy V, Smith SB. Expression, subcellular localization, and regulation of sigma receptor in retinal Müller cells. Invest Ophthalmol Vis Sci. 47:5576–82;2006. [DOI] [PMC free article] [PubMed] [Google Scholar]
- 24.Pal A, Fontanilla D, Gopalakrishnan A, Chae YK, Markley JL, Ruoho AE. The sigma-1 receptor protects against cellular oxidative stress and activates antioxidant response elements. Eur J Pharmacol. 682:12–20;2012. [DOI] [PMC free article] [PubMed] [Google Scholar]
- 25.Wang J, Shanmugam A, Markand S, Zorrilla E, Ganapathy V, Smith SB. Sigma 1 receptor regulates the oxidative stress response in primary retinal Müller glial cells via NRF2 signaling and system xc(−), the Na(+)-independent glutamate-cystine exchanger. Free Radic Biol Med. 86:25–36;2015. [DOI] [PMC free article] [PubMed] [Google Scholar]
- 26.Sporn MB, Liby KT. NRF2 and cancer: the good, the bad and the importance of context. Nat Rev Cancer. 12:564–71;2012. [DOI] [PMC free article] [PubMed] [Google Scholar]
- 27.Gorrini C, Harris IS, Mak TW. Modulation of oxidative stress as an anticancer strategy. Nat Rev Drug Discov. 12:931–47;2013. [DOI] [PubMed] [Google Scholar]
- 28.Yamamoto M, Kensler TW, Motohashi H. The KEAP1-NRF2 system: a thiol-based sensor-effector apparatus for maintaining redox homeostasis. Physiol Rev 98:1169–1203;2018. [DOI] [PMC free article] [PubMed] [Google Scholar]
- 29.Malhotra D, Portales-Casamar E, Singh A, Srivastava S, Arenillas D, Happel C, Shyr C, Wakabayashi N, Kensler TW, Wasserman WW, Biswal S. Global mapping of binding sites for Nrf2 identifies novel targets in cell survival response hrough ChIP-Seq profiling and network analysis. Nucleic Acids Res. 38:5718–34;2010. [DOI] [PMC free article] [PubMed] [Google Scholar]
- 30.Li W, Kong AN. Molecular mechanisms of Nrf2-mediated antioxidant response. Mol Carcinog. 48:91–104;2009. [DOI] [PMC free article] [PubMed] [Google Scholar]
- 31.Nguyen T, Sherratt PJ, Pickett CB. Regulatory mechanisms controlling gene expression mediated by the antioxidant response element. Annu. Rev. Pharmacol. Toxicol. 43, 233–260;2003. [DOI] [PubMed] [Google Scholar]
- 32.de Costa BR, Bowen WD, Hellewell SB, Walker JM, Thurkauf A, Jacobson AE, Rice KC. Synthesis and evaluation of optically pure [3H]-(+)-pentazocine, a highly potent and selective radioligand for sigma receptors. FEBS Lett. 251, 53–58;1989. [DOI] [PubMed] [Google Scholar]
- 33.Campochiaro PA, Mir TA. The mechanism of cone cell death in Retinitis Pigmentosa. Prog Retin Eye Res. 62:24–37;2018. [DOI] [PubMed] [Google Scholar]
- 34.Yu DY, Cringle SJ. Retinal degeneration and local oxygen metabolism. Exp Eye Res. 80:745–51;2005. [DOI] [PubMed] [Google Scholar]
- 35.Gargini C, Terzibasi E, Mazzoni F, Strettoi E. Retinal organization in the retinal degeneration 10 (rd10) mutant mouse: a morphological and ERG study. J Comp Neurol. 500(2):222–38;2007. [DOI] [PMC free article] [PubMed] [Google Scholar]
- 36.Tan E, Ding XQ, Saadi A, Agarwal N, Naash MI, Al-Ubaidi MR. Expression of cone-photoreceptor-specific antigens in a cell line derived from retinal tumors in transgenic mice. Invest Ophthalmol Vis Sci. 45:764–8;2004. [DOI] [PMC free article] [PubMed] [Google Scholar]
- 37.Hanus J, Kolkin A, Chimienti J, Botsay S, Wang S. 4-A cetoxyphenol Prevents RPE Oxidative Stress-Induced Necrosis by Functioning as an NRF2 Stabilizer. Invest Ophthalmol Vis Sci. 56:5048–59;2015. [DOI] [PMC free article] [PubMed] [Google Scholar]
- 38.Wang X, Ye XL, Liu R, Chen HL, Bai H, Liang X, Zhang XD, Wang Z, Li WL, Hai CX. Antioxidant activities of oleanolic acid in vitro: possible role of Nrf2 and MAP kinases. Chem Biol Interact. 184:328–37;2010. [DOI] [PubMed] [Google Scholar]
- 39.Ola MS, Moore P, Maddox D, El-Sherbeny A, Huang W, Roon P, Agarwal N, Ganapathy V, Smith SB. Analysis of sigma receptor (sigmaR1) expression in retinal ganglion cells cultured under hyperglycemic conditions and in diabetic mice. Brain Res Mol Brain Res. 107:97–107;2002. [DOI] [PMC free article] [PubMed] [Google Scholar]
- 40.Schmittgen TD, Livak KJ. Analyzing real-time PCR data by the comparative C(T) method. Nat Protoc. 3:1101–8;2008. [DOI] [PubMed] [Google Scholar]
- 41.Smirnova NA, Haskew-Layton RE, Basso M, Hushpulian DM, Payappilly JB, Speer RE, Ahn YH, Rakhman I, Cole PA, Pinto JT, Ratan RR, Gazaryan IG. Development of Neh2-luciferase reporter and its application for high throughput screening and real-time monitoring of Nrf2 activators. Chem Biol. 18:752–65;2011. [DOI] [PMC free article] [PubMed] [Google Scholar]
- 42.Itoh K, Chiba T, Takahashi S, Ishii T, Igarashi K, Katoh Y, Oyake T, Hayashi N, Satoh K, Hatayama I, Yamamoto M, Nabeshima Y. An Nrf2/small Maf heterodimer mediates the induction of phase II detoxifying enzyme genes through antioxidant response elements. Biochem Biophys Res Commun. 236:313–22;1997. [DOI] [PubMed] [Google Scholar]
- 43.Kaidery NA, Banerjee R, Yang L, Smirnova NA, Hushpulian DM, Liby KT, Williams CR, Yamamoto M, Kensler TW, Ratan RR, Sporn MB, Beal MF, Gazaryan IG, Thomas B. Targeting Nrf2-mediated gene transcription by extremely potent synthetic triterpenoids attenuate dopaminergic neurotoxicity in the MPTP mouse model of Parkinson's disease. Antioxid Redox Signal. 18:139–57;2013. [DOI] [PMC free article] [PubMed] [Google Scholar]
- 44.Mavlyutov TA, Epstein M, Guo LW. Subcellular localization of the sigma-1 receptor in retinal neurons - an electron microscopy study. Sci Rep. 5:10689;2015. [DOI] [PMC free article] [PubMed] [Google Scholar]
- 45.Mavlyutov TA, Duellman T, Kim HT, Epstein ML, Leese C, Davletov BA, Yang J. Sigma-1 receptor expression in the dorsal root ganglion: Reexamination using a highly specific antibody. Neuroscience. 331:148–57;2016. [DOI] [PMC free article] [PubMed] [Google Scholar]
- 46.Mori T, Hayashi T, Hayashi E, Su TP. Sigma-1 receptor chaperone at the ER-mitochondrion interface mediates the mitochondrion-ER-nucleus signaling for cellular survival. PLoS One. 8:e76941;2013. [DOI] [PMC free article] [PubMed] [Google Scholar]
- 47.Heiss K, Raffaele M, Vanella L, Murabito P, Prezzavento O, Marrazzo A, Arico G, Castracani CC, Barbagallo I, Zappala A, Avola R, Li Volti G. (+)-Pentazocine attenuates SH-SY5Y cell death, oxidative stress and microglial migration induced by conditioned medium from activated microglia. Neurosci Lett. 642:86–90;2017. [DOI] [PubMed] [Google Scholar]
- 48.Hong W, Nuwayhid SJ, Werling LL. Modulation of bradykinin-induced calcium changes in SH-SY5Y cells by neurosteroids and sigma receptor ligands via a shared mechanism.Synapse. 54:102–10;2004. [DOI] [PubMed] [Google Scholar]
- 49.Zhao Z, Chen Y, Wang J, Sternberg P, Freeman ML, Grossniklaus HE, Cai J. Age-related retinopathy in NRF2-deficient mice. PLoS One. 6:e19456;2011. [DOI] [PMC free article] [PubMed] [Google Scholar]
- 50.Mysona BA, Zhao J, Smith S, Bollinger KE. Relationship between Sigma-1 receptor and BDNF in the visual system. Exp Eye Res. 167:25–30;2018. [DOI] [PMC free article] [PubMed] [Google Scholar]
- 51.Hayes JD, Dinkova-Kostova AT. The Nrf2 regulatory network provides an interface between redox and intermediary metabolism. Trends Biochem Sci. 39:199–218;2014. [DOI] [PubMed] [Google Scholar]
- 52.Schmoll D, Engel CK, Glombik H. The Keap1-Nrf2 protein-protein interaction: A suitable target for small molecules. Drug Discov Today Technol. 24:11–17;2017. [DOI] [PubMed] [Google Scholar]
- 53.Obolensky A, Berenshtein E, Lederman M, Bulvik B, Alper-Pinus R, Yaul R, Deleon E, Chowers I, Chevion M, Banin E. Zinc-desferrioxamine attenuates retinal degeneration in the rd10 mouse model of retinitis pigmentosa. Free Radic Biol Med. 51:1482–91,2011. [DOI] [PubMed] [Google Scholar]
- 54.Xiong W, MacColl Garfinkel AE, Li Y, Benowitz LI, Cepko CL. NRF2 promotes neuronal survival in neurodegeneration and acute nerve damage. J Clin Invest. 125:1433–45;2015. [DOI] [PMC free article] [PubMed] [Google Scholar]
- 55.Nguyen L, Lucke-Wold BP, Mookerjee S, Kaushal N, Matsumoto RR. Sigma-1 Receptors and Neurodegenerative Diseases: Towards a Hypothesis of Sigma-1 Receptors as Amplifiers of Neurodegeneration and Neuroprotection. Adv Exp Med Biol. 964:133–152;2017. [DOI] [PMC free article] [PubMed] [Google Scholar]
- 56.Hayashi T, Su TP. Regulating ankyrin dynamics: Roles of sigma-1 receptors. Proc Natl Acad Sci U S A. 98:491–6;2001. [DOI] [PMC free article] [PubMed] [Google Scholar]
- 57.Hayashi T, Su TP. Sigma-1 receptors (sigma(1) binding sites) form raft-like microdomains and target lipid droplets on the endoplasmic reticulum: roles in endoplasmic reticulum lipid compartmentalization and export. J Pharmacol Exp Ther. 306:718–25;2003. [DOI] [PubMed] [Google Scholar]
- 58.Mueller BH 2nd, Park Y, Daudt DR 3rd, Ma HY, Akopova I, Stankowska DL, Clark AF, Yorio T. Sigma-1 receptor stimulation attenuates calcium influx through activated L-type Voltage Gated Calcium Channels in purified retinal ganglion cells. Exp Eye Res. 107:21–31;2013. [DOI] [PubMed] [Google Scholar]
- 59.Mueller BH 2nd, Park Y, Ma HY, Dibas A, Ellis DZ, Clark AF, Yorio T. Sigma-1 receptor stimulation protects retinal ganglion cells from ischemia-like insult through the activation of extracellular-signal-regulated kinases 1/2. Exp Eye Res. 128:156–69;2014. [DOI] [PubMed] [Google Scholar]
- 60.Zhao J, Mysona BA, Wang J, Gonsalvez GB, Smith SB, Bollinger KE. Sigma 1 receptor regulates ERK activation and promotes survival of optic nerve head astrocytes. PLoS One. 12(9):e0184421;2017. [DOI] [PMC free article] [PubMed] [Google Scholar]
- 61.Chen WJ, Wu C, Xu Z, Kuse Y, Hara H, Duh EJ. Nrf2 protects photoreceptor cells from photo-oxidative stress induced by blue light. Exp Eye Res. 154:151–158;2017. [DOI] [PMC free article] [PubMed] [Google Scholar]
- 62.Cho H, Hartsock MJ, Xu Z, He M, Duh EJ. Monomethyl fumarate promotes Nrf2-dependent neuroprotection in retinal ischemia-reperfusion. J Neuroinflammation. 12:239;2015. [DOI] [PMC free article] [PubMed] [Google Scholar]
- 63.Wei Y, Gong J, Xu Z, Thimmulappa RK, Mitchell KL, Welsbie DS, Biswal S, Duh EJ. Nrf2 in ischemic neurons promotes retinal vascular regeneration through regulation of semaphorin 6A. Proc Natl Acad Sci U S A. 112:E6927–36;2015. [DOI] [PMC free article] [PubMed] [Google Scholar]
- 64.Xu Z, Cho H, Hartsock MJ, Mitchell KL, Gong J, Wu L, Wei Y, Wang S, Thimmulappa RK, Sporn MB, Biswal S, Welsbie DS, Duh EJ. Neuroprotective role of Nrf2 for retinal ganglion cells in ischemia-reperfusion. J Neurochem. 133:233–41;2015. [DOI] [PMC free article] [PubMed] [Google Scholar]
- 65.Xu Z, Wei Y, Gong J, Cho H, Park JK, Sung ER, Huang H, Wu L, Eberhart C, Handa JT, Du Y, Kern TS, Thimmulappa R, Barber AJ, Biswal S, Duh EJ. NRF2 plays a protective role in diabetic retinopathy in mice. Diabetologia. 57:204–13;2014. [DOI] [PMC free article] [PubMed] [Google Scholar]
Associated Data
This section collects any data citations, data availability statements, or supplementary materials included in this article.
Supplementary Materials
Supplemental Fig 1. Detection of Sig1R in mouse photoreceptor cells. Adult wildtype C57BL/6 mice were euthanized per our IACUC-approved protocol and eyes were harvested for cryosections. (A) Sig1R was detected by laser scanning confocal microscopy (LSCM). The image shows the nuclei within the outer nuclear layer and there is distinct labeling of Sig1R around the nuclei (green fluorescence is Sig1R, blue fluorescence is DAPI, which labels nuclei). The inset shows higher magnification of the nuclear membrane labeling. Eyes were also prepared for post-embedding electron microscopy (EM) and anti-Sig1R conjugated to an 18nm gold particle was used. At this high magnification using EM we can distinguish (B) rod photoreceptor (PRC) nuclei from (C) cone PRC nuclei. In both rods and cones, Sig1R is detected on the nuclear membrane (arrows) and there is labeling within the nucleus as well.
Supplemental Fig 2. Evaluation of the specificity of the NRF2 antibody in retinas isolated from WT and Nrf2−/− mice. Retinas were isolated from euthanized, age-matched WT and Nrf2−/− mice, protein extracted and subjected to SDS-PAGE followed by immunoblotting to detect NRF2. In the WT retina, a band was detected (~95 Mr) corresponding to the biologically relevant molecular weight of NRF2, whereas in retinal protein isolated from Nrf2−/− mice, there was minimal detection of a band. The data suggest that the antibody used in immunoblotting experiments (Fig. 3) detected NRF2. GAPDH served as the loading control.
Supplemental Fig 3. Scotopic a-wave amplitudes. Scotopic ERG responses were performed on four groups of mice: (1) rd10 mice receiving no treatment, (2) rd10 mice administered (+)-PTZ (rd10+PTZ), (3) rd10/Nrf2−/− mice receiving no treatment, (4) rd10/Nrf2−/− mice administered (+)-PTZ (rd10/Nrf2−/−+PTZ). (A) Representative tracings at five increasing intensities of light are shown (upper left panel is dimmest, lower right panel is brightest). The a-waves are minimal in all animals tested indicating very limited rod function and there is an unusual negative response following the b-waves. For comparison, the inset shows a typical tracing for normal rod function (“a-wave”) and normal (robust) bipolar cell function (“b-wave”). (B) Averaged a-wave amplitude of scotopic ERG responses to 5 ms flashes at a series of intensities for rd10, rd10+PTZ, rd10/Nrf2−/−, rd10/Nrf2−/−+PTZ. Intensities are in units of candela-seconds per meter squared (cd-s/m2).
Supplemental Fig 4. SD-OCT of nrf2−/− mice. SD-OCT was performed on four nrf2−/− mice age-matched with animals analyzed in Fig. 5 (P42). Images for the left (L) and right (R) eyes of the mice (numbered 1-4) show a normal retinal phenotype with clear delineation of inner and outer nuclear and plexiform layers. (gcl = ganglion cell layer, inl = inner nuclear layer, onl = outer nuclear layer).
Supplemental Fig 5. Analysis of Sig1R protein levels in retinas of rd10 mice. Retinas were isolated from (A) rd10 non-treated and rd10+PTZ mice or (B) WT non-treated and WT+PTZ mice; protein was extracted and subjected to SDS-PAGE followed by immunoblotting to detect Sig1R; β-tubulin was used as the loading control. Band density was quantified using ImageJ. Significance: *p < 0.02.