

Abstract
Astrocytes show a complex structural and physiological interplay with neurons and respond to neuronal activation in vitro and in vivo with intracellular calcium elevations. These calcium changes enable astrocytes to modulate synaptic transmission and plasticity through various mechanisms. However, the response pattern of astrocytes to single neuronal depolarization events still remains unresolved. This information is critical for fully understanding the coordinated network of neuron–glial signaling in the brain. To address this, we developed a system to map astrocyte calcium responses along apical dendrites of CA1 pyramidal neurons in hippocampal slices using single-neuron stimulation with channelrhodopsin-2. This technique allowed selective neuronal depolarization without invasive manipulations known to alter calcium levels in astrocytes. Light-evoked neuronal depolarization was elicited and calcium events in surrounding astrocytes were monitored using the calcium-sensitive dye Calcium Orange. Stimulation of single neurons caused calcium responses in populations of astrocytes along the apical axis of CA1 cell dendrites. Calcium responses included single events that were synchronized with neuronal stimulation and poststimulus changes in calcium event frequency, both of which were modulated by glutamatergic and purinergic signaling. Individual astrocytes near CA1 cells showed low ability to respond to repeated neuronal depolarization events. However, the response of the surrounding astrocyte population was remarkably accurate. Interestingly, the reliability of responses was graded with respect to astrocyte location along the CA1 cell dendrite, with astrocytes residing in the primary dendrite subregion being most responsive. This study provides a new perspective on the dynamic response property of astrocyte ensembles to neuronal activity.
Introduction
Astrocytes are important for information processing in the brain (Volterra and Meldolesi, 2005). This concept gained support when astrocytes were shown to respond to glutamate by elevating intracellular calcium ([Ca2+]i) (Cornell-Bell et al., 1990). Astrocyte calcium signaling triggers gliotransmitter release that can regulate NMDA receptors (Parri et al., 2001), AMPA receptors (Fiacco and McCarthy, 2004), and inhibitory synapses (Kang et al., 1998) and modulates heterosynaptic depression (Serrano et al., 2006), presynaptic glutamate release (Jourdain et al., 2007), and long-term potentiation (Henneberger et al., 2010). Neuron–glial signaling also scales synaptic weight in the hypothalamus (Gordon et al., 2009) and modulates cortical network activity in vivo (Fellin et al., 2009). However, a few studies have questioned the importance of astrocyte calcium signaling in synaptic transmission and plasticity (Fiacco et al., 2007; Petravicz et al., 2008; Agulhon et al., 2010). Thus, additional studies addressing the complex nature of neuron–glial interactions and the properties of neuron-evoked astrocyte calcium events are needed.
Astrocytes show intricate morphological interactions with neurons and other astrocytes. A single astrocyte associates with hundreds of dendrites (Halassa et al., 2007) and up to 105 synapses (Bushong et al., 2002) and is coupled with other astrocytes through gap junctions (Giaume and Venance, 1998). At the same time, a single neuron passes through the territory of many astrocytes (∼5 astrocytes/8000 μm2) in the hippocampus (Nixdorf-Bergweiler et al., 1994). Thus, a population of astrocytes is likely responsive to the activity of an individual neuron. Indeed, Schaeffer collateral stimulation causes [Ca2+]i changes in 15% (Pasti et al., 1997) to 62% (Porter and McCarthy, 1996) of astrocytes within a microscope field of view. Groups of cortical astrocytes also respond to visual stimuli (Schummers et al., 2008) and show activation patterns coordinated with neuronal subpopulations (Schipke et al., 2008), suggesting that astrocytes form functional domains near neurons (Fellin, 2009). However, the spatial relationship between a single neuron and a responding astrocyte population has not been reported.
To understand how neuron–astrocyte domains are organized, a method for single-neuron activation needs to be used. Depolarization of interneurons (Kang et al., 1998) or CA1 cells (Navarrete and Araque, 2008) using patch-clamp techniques can trigger astrocyte calcium responses. However, direct mechanical and electrical stimulation of astrocytes can cause glial calcium events (Hassinger et al., 1996; Angulo et al., 2004; Bernardinelli et al., 2004) and complicate [Ca2+]i measurements. Recent advances in optogenetics have provided powerful approaches to non-invasively map neuronal circuits (Wang et al., 2009). Here we applied this technology using channelrhodopsin-2 (ChR2) (Nagel et al., 2003) to control single-neuron activation in situ and probe neuron–glial interactions without acute physical perturbation of cells. Stimulation of a single hippocampal CA1 cell induced [Ca2+]i changes in astrocytes with a reliability that was related to astrocyte position and dependent on glutamatergic and purinergic pathways. Furthermore, astrocyte ensembles accurately responded to neuronal stimulation, suggesting that astrocytes organize into functional domains and respond as a network of cells. This type of coordination is likely essential for modulating neuronal activity within hippocampal microcircuits.
Materials and Methods
Animals.
For all experiments, both male and female mice (C57BL/6J) were used. Animal procedures were performed in accordance with the guidelines of the Canadian Council for Animal Care and the Montreal General Hospital Facility Animal Care Committee.
Organotypic hippocampal slice preparation.
Organotypic hippocampal slices were prepared as described previously (Haber et al., 2006). Briefly, 300 μm hippocampal slices were prepared from postnatal day 6–7 mice and transferred onto semi-porous tissue culture inserts (0.4 μm pore size; Millipore). Culture media consisted of 50% Minimum Essential Medium, 25% horse serum, 25% HBSS, 6.5 mg/ml d-glucose, and 0.5% penicillin/streptomycin. Medium was replaced three times a week.
Acute hippocampal slice preparation.
Hippocampal slices (300 μm) from 15- to 21-d-old mice were cut in slice cutting solution (SCS) (see below) using a vibrating slicer (Leica). The SCS solution contained the following (in mm): 2.5 KCl, 25 NaHCO3, 0.5 CaCl2, 7 MgSO4, 1.25 NaH2PO4, 25 glucose, 110 choline chloride, 11.6 Na-l-ascorbate, and 3.1 Na-pyruvate (bubbled with 5% CO2/95% oxygen). Slices were then incubated in artificial CSF (ACSF) (see below) at 35°C.
Semliki Forest virus production.
For expressing ChR2 in hippocampal slices, Semliki Forest virus (SFV) constructs were created as described previously (Ehrengruber et al., 1999; Haber et al., 2006; Zhou et al., 2007). The vector pCAGGS–ChR2–Venus was obtained from Addgene (Petreanu et al., 2007). Farnesylated mCherry (mCherry-f) was created by cloning the farnesylation sequence of Ha–Ras onto the C terminus of mCherry (from R. Tsien, Howard Hughes Medical Institute, University of California, San Diego, La Jolla, CA). Genes for ChR2–Venus and mCherry-f were each cloned 3′ to a viral subgenomic promoter in a modified SFV vector (SFV-PD) (Lundstrom et al., 2003; Zhou et al., 2007). The SFV-PD vector containing eGFP-f alone was described previously (Haber et al., 2006). Viral particles were created by cotransfecting SFV-PD vectors with a viral packaging vector (SFV-Helper) into baby hamster kidney cells (DiCiommo and Bremner, 1998; Haber et al., 2006). At 72 h after transfection, cell media was collected and purified on a sucrose gradient (20 and 55% w/v) by ultracentrifugation. Fractions containing viral particles were then diluted with PBS and concentrated using a high-molecular-weight cutoff filter column (Amicon) and low-speed centrifugation. Viral particles were resuspended in ice-cold PBS and activated by chymotrypsin (10 mg/ml), followed by aprotinin (10 mg/ml) treatment. Viruses were injected into 10–14 DIV hippocampal slices with a Picospritzer (General Valve).
Calcium imaging.
Crystals of Calcium Orange AM (CaO-AM) were dissolved in anhydrous DMSO containing 14% pluronic F-127 (Sigma-Aldrich) to reach a 2 mm concentration and stored at 4°C until use. Loading of astrocytes in organotypic and acute slices with CaO-AM (10 μm) was performed at 37°C in ACSF (see below) bubbled with 5% CO2/95% oxygen for 70 min. Once loaded with dye, slices were placed in an open chamber (Warner Instruments) on the stage of an upright Leica DMS microscope connected to an Ultraview confocal spinning disk system (PerkinElmer Life and Analytical Sciences) and perfused with 34°C ACSF. The ACSF solution contained the following (in mm): 130 NaCl, 3 KCl, 26 NaHCO3, 2 CaCl2, 1.48 MgCl2, 1.23 NaH2PO4, and 10 glucose (bubbled with 5% CO2/95% oxygen). CaO was excited by a 568 nm Kr/Ar laser band, and emission was collected through a rhodamine emission filter (Chroma Technology) with a 40× Achroplan, 0.8 NA water-immersion objective (Leica). Single-plane images were acquired at 0.5 Hz using Metafluor software (Molecular Devices). CaO fluorescence intensities were monitored offline in every astrocyte soma in the field of view using Metafluor, and calcium events were analyzed in Clampfit (Molecular Devices). All calcium increases >2 SDs were collected. Events occurring 0–15 s after neuronal stimulation were considered as synchronized calcium events. This time window corresponds to the time needed for an intercellular calcium wave to propagate over a distance of 275 μm [mean distance of propagation of calcium waves (Kang and Othmer, 2009) with a speed of 21 μm/s (mean calcium wave speed) (Kang and Othmer, 2009)] plus a 2 s latency (Dani et al., 1992). The calculation made here corresponds to the time window previously used by others (Navarrete and Araque, 2008). For uncoupling experiments, the time window was reduced to 5 s. This is the time needed for an intracellular calcium wave to cross a single astrocyte having a 50 μm diameter and with a 2 s latency. Astrocytes diameter was calculated by approximating their shape as a sphere and having a volume of 65,900 μm3 (Bushong et al., 2002).
Immunofluorescence labeling.
For immunofluorescence after astrocyte loading with CaO, slices were fixed in 4% paraformaldehyde/0.1 m phosphate buffer for 30 min, washed with Tris-buffered saline (TBS), and blocked for 1 h at room temperature in 10% normal goat serum (Jackson ImmunoResearch) in TBS containing 0.1% Triton X-100 (TBS-T). Slices were then incubated with primary antibodies against glial fibrillary acid protein (GFAP) (1:300; mouse monoclonal; Sigma-Aldrich) or glutamine synthetase (1:100; mouse monoclonal; Millipore) overnight. The next day, slices were washed four times with TBS-T before incubation with goat anti-mouse Alexa Fluor-488 (Invitrogen). For SFV-infected hippocampal slices, slices were fixed for 1 h in 4% paraformaldehyde/0.1 m phosphate buffer and then washed in TBS. The slices were then permeabilized overnight in 1% TBS-T and then blocked for 1.5 h in 10% normal donkey serum (Jackson ImmunoResearch) and 0.1% TBS-T. Mouse anti-NeuN (1:500; Millipore Bioscience Research Reagents) and/or rabbit anti-GFP (1:1000; Invitrogen) were applied overnight in 1% normal donkey serum and 0.1% TBS-T. The slices were then washed thoroughly in 0.1% TBS-T before labeling with donkey anti-mouse Alexa Fluor-647 and/or donkey anti-rabbit Alexa Fluor-488 (Invitrogen) for 1.5 h in 0.1% TBS-T. After three washes in 0.1% TBS-T, the slices were mounted and imaged on an Ultraview spinning disk confocal system (PerkinElmer Life and Analytical Sciences) connected to a Eclipse TE2000 (Nikon). Images were collected using MetaMorph imaging software (Molecular Devices).
ChR2 photostimulation setup.
The setup was assembled on an optical breadboard (Siskiyou) placed on a marble table for stability. A blue light beam from a 445 nm CUBE laser diode (Coherent) was reflected onto a helium–neon laser mirror (model NT43-532; Edmund Optics) in front of a violet–green dichroic plate (Edmund Optics). The light beam was then focused onto a 100 μm inner core diameter optical fiber (polyimide-coated silica low-OH optical fiber; model FVP100110125; Polymicro Technologies) using a 12 × 24 Plano-convex lens (model NT47-332-INK; Edmund Optics). The optical fiber was cleaved at both sides using a ceramic cleaving stone (Polymicro Technologies). To aid in aiming the 445 nm light, a 635 nm CUBE laser diode (Coherent) was used to produce red laser light that was also sent through the violet–green dichroic mirror and focused onto the same optical fiber through the same lens. All lens, mirrors, and optical fiber (x, y, and z and tilt) translators and holders were obtained from Siskiyou. The optical alignment was optimized by monitoring the light exiting the fiber with a photodiode coupled to a power meter (Thorlabs). Laser light, 445 nm, was controlled by means of transistor–transistor logic (TTL) pulses through pClamp9 (Molecular Devices) synchronized with image acquisition in Metafluor (Molecular Devices). The optical fiber tip was placed ∼20 μm above the slice surface with a 30° angle. This resulted in a spot of light with an elliptical shape of 121 ± 6 × 162 ± 28 μm (n = 4). The spot size measurement was performed by confocal imaging of emitted fluorescence of an Alexa Fluor-647 nm antibody in an agar preparation.
Electrophysiology.
Action potentials (APs) were recorded by cell-attached recordings made on CA1 pyramidal cells from organotypic hippocampal slices infected with SFV-PD virus driving the expression of ChR2–Venus and mCherry-f. At 12–24 h after infection, slices were mounted onto the microscope stage and perfused with ACSF heated to 34°C. Infected neurons were recognized by the presence of mCherry-f. Recordings were made with an Axopatch 200B amplifier (Molecular Devices) using pipettes with resistance in the 4–8 MΩ range and containing the following (in mm): 140 K-gluconate, 5 NaCl, 2 MgCl2, 0.1 CaCl2, 1.1 EGTA, 7 Na2-phosphocreatine, 10 HEPES, 4 Mg-ATP, and 0.4 Na3-GTP. Currents were monitored in voltage-clamp mode using pClamp9 software (Molecular Devices), filtered at 1 kHz, and sampled at 5 kHz. Seal resistance and seal test signal shape were checked before and after each recording period. Seal resistances lower than 100 MΩ and spontaneously opened cells were excluded. TTL signals triggering blue light stimuli were generated through pClamp9 software and were simultaneously recorded. APs triggered during 445 nm light stimulation were analyzed offline in Clampfit (Molecular Device).
Whole-cell patch clamp in acute slices was performed by using 5–8 MΩ pipettes filled with the above mentioned internal solution containing 150 μm Alexa Fluor-488 (Invitrogen). Neurons were clamped at −70 mV and were depolarized by clamping the membrane potential at +40 mV for 10 ms at a rate of 25 Hz for 1 s. Field recordings were performed in organotypic slices by positioning a 6–8 MΩ pipette in the CA1 pyramidal layer while stimulating Schaeffer collaterals with a bipolar electrode by applying single 4 μs square pulse (5–20 V) generated by a DS2A-Mk.II stimulator (Digitimer).
For electrically evoked calcium signals, Schaeffer collaterals were stimulated by applying a 400 ms, 50 Hz train of depolarization square pulses through a fine-tip-diameter concentric bipolar tungsten electrode (Micro Probe). The stimulating electrode was positioned ∼200 μm from the field of view. The stimulus strength was adjusted until astrocytic responses were observed (typically 2–10 V).
Mapping astrocyte calcium responses.
Organotypic slices were placed in a perfusion chamber (Warner Instruments) on the microscope stage and superfused with carboxygenated ACSF heated to 34°C. Venus fluorescence in infected CA1 neurons was detected with a standard yellow fluorescent protein (YFP) epifluorescence cube (Chroma Technology) equipped with a custom-made excitation filter (510–530 nm bandpass; Chroma Technology). The white light coming from a mercury bulb was attenuated by 50% using a neutral density filter. Under these illumination conditions, ChR2 was not activated (see Results). Whole apical dendrite projections (including the CA1 cell body) were imaged by recording Z-stacks of confocal images of the mCherry-f fluorescence. mCherry-f was excited using the 568 nm Kr/Ar laser band and collected through a rhodamine epifluorescence cube (Chroma Technology). Images were acquired with MetaMorph software (Molecular Devices). Once the neuron was imaged, slices were removed from the perfusion chamber and placed into a loading chamber to load CaO-AM as described above and returned to the perfusion chamber. The previously imaged neuron was recognized using the Venus signal in epifluorescence mode. The optical fiber end was placed above the slice surface in the field of view, and the neuronal soma was aimed using the 635 nm laser diode light. A single plane along the apical dendritic projection of a CA1 cell was chosen, and images of CaO fluorescence were recorded (as described above). Ten consecutive blue light stimuli were triggered through Metafluor at a rate of once every 2 min after an initial 2 min of baseline calcium signal recording. After calcium imaging, Z-stack confocal images of the neuronal projection were recorded by exciting Venus fluorescence using the 488 nm Kr/Ar band. Neuronal dendritic projections of both preimaged mCherry-f and postexperiment Venus confocal images were reconstructed using the NIH ImageJ plugin Mosaic (Abramoff et al., 2004; Thévenaz and Unser, 2007). Single-plane images of the CaO signal were positioned with respect to the dendritic projection imaged with Venus. CaO–Venus images were aligned with the mCherry-f neuronal image using Gimp2 freeware (Free Software Foundation). Responding astrocytes were manually localized in the reconstructed mCherry–CaO images.
We developed an NIH ImageJ macro to map dendritic arbors, astrocytes, and soma positions. The macro was also able to calculate the distances between astrocytes and dendrites (astrocyte–dendrite) and astrocytes and soma (astrocyte–soma). The macro is available from the Murai Laboratory on request.
The macro allows multiple astrocytes to be manually traced and their centers of mass to be drawn, numbered, and recorded. If necessary, the soma can also be drawn, labeled, and recorded. Dendrites are traced by clicking the mouse sequentially along each dendritic branch, generating a series of short connected lines along the branch. This is done separately for each dendritic branch. To determine the shortest distance between each astrocyte and the dendritic arbor, the program calculates the shortest distance in pixels from a single astrocyte to every line making up the trace of a branch using the following implementation of the linear algebraic solution for the smallest distance from a point to a line (adapted from Bourke, 1988, http://local.wasp.uwa.edu.au/∼pbourke/geometry/pointline/):
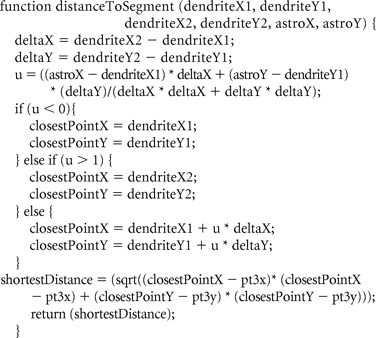 |
This process is repeated for every separate dendritic branch, and the shortest distance of that pool is stored in a Microsoft Excel output file containing the coordinates of the astrocytes, the coordinates on dendritic traces that subtend the shortest distances from each astrocyte, the shortest astrocyte–dendrite distance in pixels, as well as the soma coordinates and the astrocyte–soma distance.
For our analyses, three rounds of astrocyte mapping were completed using this macro. The first round mapped the shortest astrocyte–dendrite distance, taking all visible dendrites into consideration; the second mapped the shortest astrocyte–dendrite distance, taking only the main dendritic branches into consideration; and the third mapped the vertical component of the astrocyte–soma distance. We extracted the vertical component of the astrocyte–soma distance using a rotation matrix yielding the following equation:
where θ is the angle swept out clockwise from the dendritic projection to the closest vertical.
Chemicals.
Probenecid [4-(dipropylsulfamoyl)benzoic acid], (S)-3,5-dihydroxyphenylglycine (DHPG), AM251 [1-(2,4-dichlorophenyl)-5-(4-iodophenyl)-4-methyl-N-(1-piperidyl)pyrazole-3-carboxamide], LY367385 [(S)-(+)-a-amino-4-carboxy-2-methylbenzeneacetic acid], 2-methyl-6-(phenylethynyl)pyridine hydrochloride (MPEP), carbenoxolone (CBX) [(3β,20β)-3-(3-carboxy-1-oxopropoxy)-11-oxoolean-12-en-29-oic acid disodium], WIN55,212-2 [(R)-(+)-[2,3-dihydro-5-methyl-3-(4-morpholinylmethyl)pyrrolo[1,2,3-de]-1,4-benzoxazin-6-yl]-1-naphthalenylmethanone mesylate], TFB–TBOA [(3S)-3-[[3-[[4-(trifluoromethyl)benzoyl]amino]phenyl]methoxy]-l-aspartic acid], and suramine (8,8′-[carbonylbis[imino-3,1-phenylenecarbonylimino(4-methyl-3,1-phenylene)carbonylimino]]bis-1,3,5-naphthalenetrisulfonic acid hexasodium salt) were obtained from Tocris Biosciences. Tetanus toxin (TeNT) from Clostridium tetani and tetrodotoxin (TTX) were purchased from Alomone Labs. Calcium Orange AM and penicillin/streptomycin were from Invitrogen. All other compounds were from Sigma-Aldrich.
Data and statistics.
Data are presented as mean ± SEM. Unless specified otherwise, two-tailed unpaired Student's t test or ANOVA with Dunnett's pairwise comparison was performed to assess the statistical significance of results with p < 0.05 considered as significant (n.s. indicates not significant; *p < 0.05; **p < 0.01; ***p < 0.001). The N represents independent experiments performed on different organotypic slices, and n represents the number of cells.
Results
Stimulating hippocampal pyramidal neurons in situ using ChR2
Studies examining neuron–glial interactions in situ are technically challenging because of difficulties in obtaining cell specificity and single-cell resolution. A common approach to studying these interactions in slices is the use of patch-clamp techniques to stimulate neurons and/or direct electrical stimulation with an electrode. Both techniques induce some level of acute mechanical disruption to the tissue and can directly trigger intracellular calcium increases in astrocytes (Hassinger et al., 1996; Angulo et al., 2004; Bernardinelli et al., 2004). However, recent advances in optogenetic techniques have overcome many of these issues and now provide a powerful alternative for stimulating neurons without the requirement of external pipettes or electrodes (Zhang et al., 2006). Furthermore, targeted expression of ChR2 has been shown to provide the needed cell specificity and single-cell resolution to activate neurons and map neural circuits (Petreanu et al., 2007).
We were interested in determining whether ChR2 could be used to probe neuron–glial relationships in organotypic hippocampal slices, in which the architecture and circuitry of the hippocampus is largely preserved (Bekenstein and Lothman, 1991; Caeser and Aertsen, 1991; Frotscher and Gähwiler, 1988; Frotscher et al., 1990; Gähwiler, 1981; Zimmer and Gähwiler, 1984). We made use of a Semliki Forest viral strain that selectively drives expression in neurons (Lundstrom et al., 2003; Haber et al., 2006) to deliver ChR2 to single CA1 pyramidal neurons in 10–14 DIV organotypic hippocampal slices. Viral particles were created to simultaneously drive expression of the genes for ChR2–Venus and membrane-targeted mCherry (mCherry-f) to delineate the morphology of pyramidal cells. Picoliter quantities of virus were injected into the pyramidal cell layer of CA1 with a micropipette to achieve single-cell expression. Within 20 h of viral delivery, single NeuN-positive pyramidal neurons were found to express ChR2–Venus and mCherry-f (Fig. 1A,B). ChR2–Venus was detected throughout the cell body, axon, and dendrites of pyramidal cells and also found in dendritic spines (Fig. 1B). Thus, SFV can be used to target ChR2 to individual pyramidal cells.
Figure 1.

Viral delivery system for the expression of channelrhodopsin-2 in single hippocampal pyramidal neurons and the cellular response to light. A, Confocal Z-stack image projection of a single CA1 pyramidal cell in a hippocampal organotypic slice infected by SFV driving the expression of ChR2–Venus and mCherry-f. Venus signal was amplified with anti-GFP. NeuN immunostaining (blue) shows the nucleus of CA1 pyramidal cells. Localization of Venus illustrates the cellular ChR2 localization, whereas mCherry-f fluorescence (red) shows the morphology of the CA1 cell. B, Scheme of the viral vector (pSCA PD) used to generate Semliki Forest viruses (top) and an image of a secondary apical dendrite of a CA1 pyramidal neuron expressing ChR2–Venus (green), mCherry (red), and the image overlay (yellow). C, Representative cell-attached recording of a ChR2-infected pyramidal cell. Infected cells fire APs when illuminated with blue light from a Kr/Ar laser band (488) or a Hg lamp filtered for FITC (FITC). In contrast, 568 nm Kr/Ar laser light (568), transmitted white light of the scope (TWL), or laboratory room white light (LWL) do not induce firing. D, A custom excitation filter (510–530 nm) with a 50% neutral density filter (50%) can be used to visualize Venus-expressing cells without activating ChR2. As a positive control, blue light was applied (FITC) to ensure that the neuron was able to show spiking behavior. Scale bars: A, 50 μm; B, 10 μm.
ChR2 is a light-gated cation channel that opens when illuminated in the 350–550 nm range of light (Nagel et al., 2003). We verified that ChR2-infected pyramidal cells in organotypic culture depolarize in response to blue light illumination by measuring the occurrence of APs with cell-attached recordings. Indeed, APs were elicited from various light sources, including a 488 nm Kr/Ar laser band and an Hg lamp filtered for FITC (Fig. 1C). Sustained exposure of ChR2-expressing pyramidal neurons to these blue light sources induced APs. However, under these conditions, the frequency of AP spiking behavior was rapidly attenuated within a few seconds, suggesting neuronal fatigue or ChR2 dark state (Ritter et al., 2008). In contrast, 568 nm Kr/Ar laser light did not trigger APs (Fig. 1C). To visualize ChR2 protein in infected neurons without activating ChR2, we made use of the Venus tag on ChR2. Venus is a green–yellow shifted variant of YFP (Nagai et al., 2002) that is commonly excited with YFP excitation filters in the 490–510 nm range. This wavelength range has been shown to open ChR2 but cause smaller current intensities than those with 450–490 nm light (Boyden et al., 2005). A custom-made filter (510–530 nm range) coupled to a 50% neutral density filter to reduce light intensity was added to visualize Venus without inducing APs (Fig. 1D). Thus, whereas blue light illumination generates APs in pyramidal cells, both 568 and 510–530 nm (partially attenuated) light do not and thus can be safely used for imaging.
ChR2 allows precise temporal control over neuronal activity and has been useful for regulating spike frequency (Boyden et al., 2005; Zhang et al., 2006). To map astrocytic responses to neuronal activity in hippocampal slices, we first developed a system for activating ChR2 with precise light pulses. A small-diameter optical fiber (100 μm inner core) connected to a 445 nm laser diode was used to deliver light to the slice surface independently of the microscope light path. This technique has been successfully used for flash photolysis (Parpura and Haydon, 1999; Bernardinelli et al., 2005). A 635 nm beam generated from a separate diode was directed along the same optical path to aim the optical fiber at infected neurons without activating ChR2 (data not shown). Light pulse duration and intensities were computer controlled and coordinated with cell-attached recordings. To determine which illumination conditions (e.g., power and duration) could be used to efficiently generate single APs in infected CA1 neurons, cells were exposed to sequences of 1, 5, 10, and 100 ms 445 nm light pulses with varying intensities (0.002, 0.1, 0.22, 0.71, and 1 mW light power) (Fig. 2A,B). The synchronization of light pulses and elicited APs for each condition were analyzed (Fig. 2B) and pulse duration and intensity settings giving single APs were extracted from the data. Stimulation at 5 ms, 0.22 mW gave reliable APs. The maximum frequency of APs that can be reliably generated by ChR2 stimulation was then determined by sending trains of 5 ms (0.22 mW intensity) light at 5, 10, 20, 25, 50, and 100 Hz (Fig. 2C). For each frequency, the percentage of APs (of 50 possible) was determined as well as the proportion of extra-numerous APs (Fig. 2D). We found that APs can be accurately evoked for frequencies up to 25 Hz. At higher frequencies, the reliability of the response was decreased. Altogether, these results demonstrate that viral expression of ChR2 and laser light stimulation can be used to selectively activate single hippocampal pyramidal neurons in situ and the frequency of APs can be accurately controlled (up to 25 Hz) in CA1 pyramidal neurons.
Figure 2.
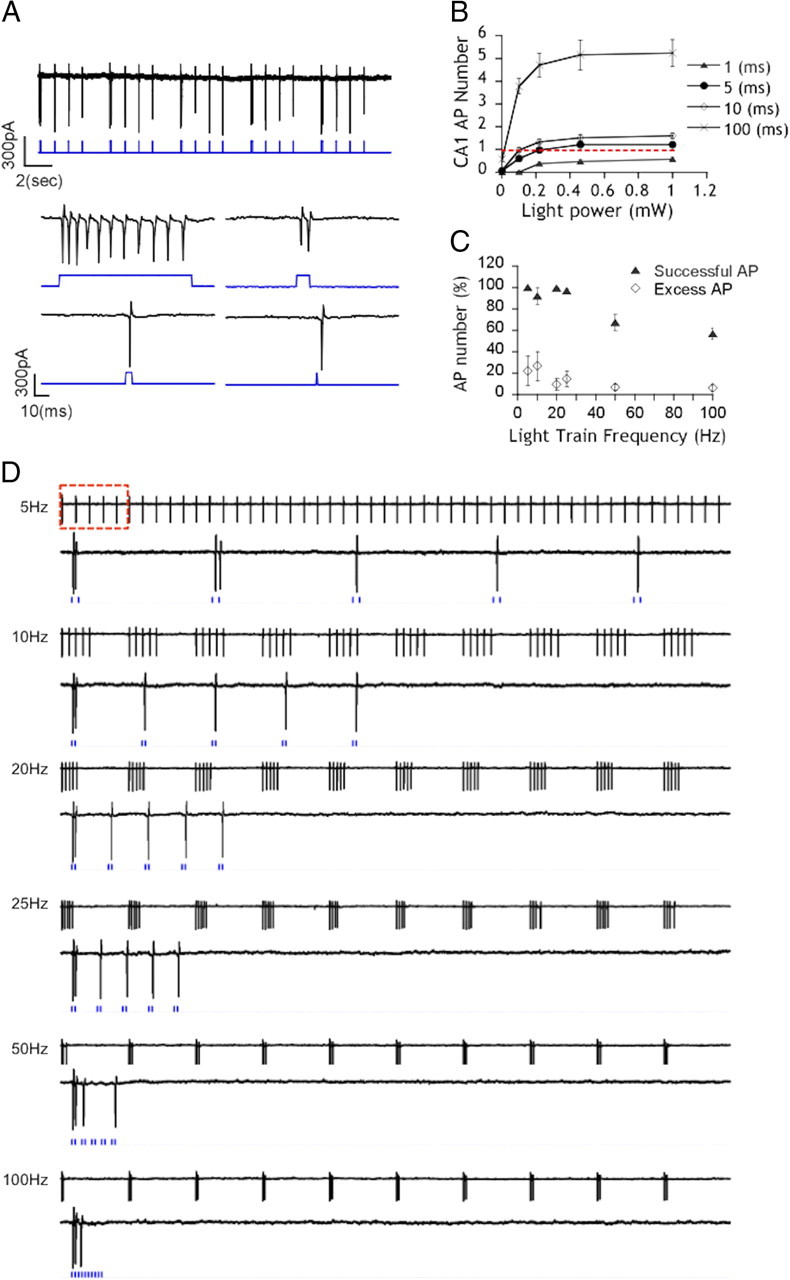
Light-evoked action potential trains in CA1 pyramidal neurons in organotypic slices. A, Cell-attached recordings of a ChR2-expressing CA1 pyramidal cell. APs (black traces) generated by five consecutive sequences of 100-10-5-1 ms light pulses (blue trace) are shown. Bottom panels show higher magnifications of 100-10-5-1 ms light pulses, respectively. Illumination at 100 ms can evoke up to 11 APs, and light pulses as short as 1 ms are able to generate single APs. B, Illumination parameters allowing the accurate generation of single APs in CA1 pyramidal cells. The number of APs generated at various illumination times (100, 10, 5, 1 ms) with various light intensities (0.002 mW, n = 44, N = 9; 0.1 mW, n = 50, N = 10; 0.22 mW, n = 50, N = 10; 0.71 mW, n = 45, N = 9; 1 mW, n = 50, N = 10). The optimal duration and power of the stimulus giving single APs was extracted from the plot [dotted red line; 5 ms (black circles) at 0.22 mW or 10 ms (open diamond)]. C, Cell-attached recordings of CA1 cells showing APs evoked by 10 consecutive 5-10-20-25-50-100 Hz trains of five light pulses (black lines, cell recordings; blue lines, light pulses). Bottom traces show higher magnifications for each train frequency of five light pulses. D, Population data for the experiment described in C showing the percentage of APs of 50 possible (black triangles; N = 9) evoked at different light trains frequency and the percentage of extra-numerous APs (open diamonds; N = 9). The plot shows that APs cannot be accurately evoked for frequencies higher than 25 Hz (n indicates event number; N indicates number of experiments).
Calcium imaging in astrocytes when using ChR2 to stimulate neurons
Calcium imaging in astrocytes is facilitated by the fact that AM ester dyes preferentially load into glial cells in situ (Kang et al., 1998) and in vivo (Hirase et al., 2004). Indicator dyes with blue excitation and green emission spectra, such as Fluo-3 AM (Dani et al., 1992; Araque et al., 2002), Fluo-4 AM (Simard et al., 2003; Schipke et al., 2008), Calcium Green 1 (Fiacco and McCarthy, 2004), and Oregon Green–BAPTA-1 (Agulhon et al., 2010), are commonly used to detect intracellular calcium elevations. However, these dyes are incompatible with ChR2 because they have overlapping excitation wavelengths. Longer-wavelength calcium indicators are available, such as the rhodamine-based dye Rhod-2 with fluorescence excitation and emission maxima at 552 nm and 581 nm, respectively. This dye was successfully used to measure calcium changes in astrocytes (Gordon et al., 2009; Gourine et al., 2010). However, this dye may not be optimal for our studies because it loads into mitochondria (Hajnóczky et al., 1995) and is used to detect calcium changes in astrocytic mitochondria (Boitier et al., 1999). CaO is another available long-wavelength dye (excitation and emission maxima at 549 and 576 nm, respectively) that is potentially compatible with the use of ChR2 and previously used to measure cytosolic calcium elevations in corpus callosum glia by bulk loading of the AM form (Schipke et al., 2002) or by iontophoresis in acute slices (Duffy and MacVicar, 1995). We found that the AM form of CaO preferentially loaded into astrocytes of organotypic hippocampal slices. As shown in Figure 3, A and B, glutamine synthetase- and GFAP-positive astrocytes were selectively loaded with the AM form of CaO. CaO staining was abundant throughout the astrocyte, including cellular processes, suggesting cytoplasmic and nuclear localization of the dye. Importantly, neurons did not incorporate CaO (Fig. 3A,B). These results show that CaO can be successfully loaded into astrocytes and is potentially useful for revealing calcium changes in astrocytes of organotypic slices.
Figure 3.
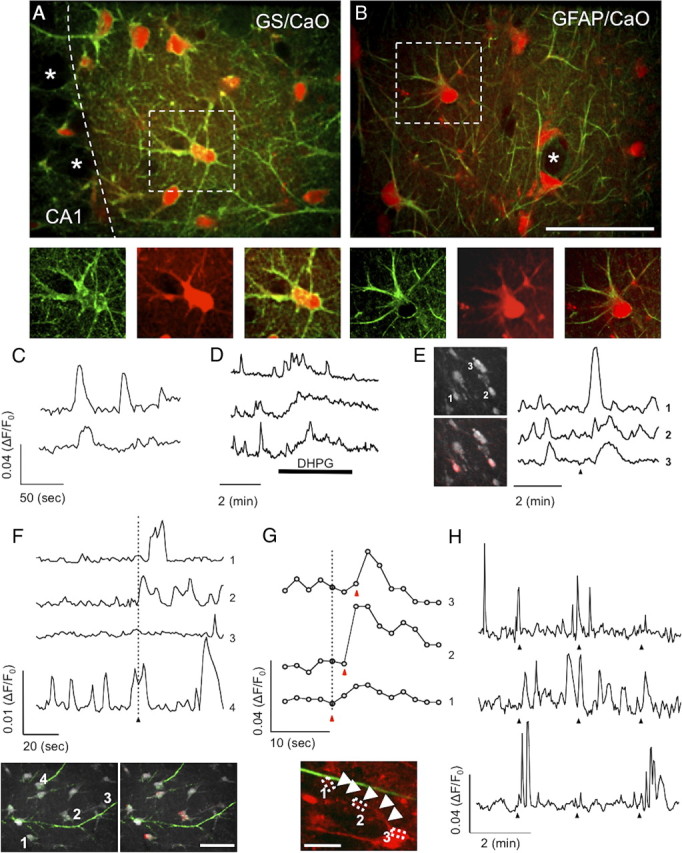
Monitoring spontaneous and evoked astrocyte Ca2+ elevations with Calcium Orange AM. A, An image taken from a representative organotypic hippocampal slice bulk loaded with CaO. CaO (red) colocalized with the astrocytic marker glutamate synthetase (GS; green). Neuronal cell bodies of the CA1 pyramidal layer are not loaded by CaO (asterisks). B, GFAP-positive astrocytes (green) in the stratum radiatum were also loaded with CaO (red), whereas GFAP-negative cells (asterisk) were not. Bottom images in A and B are higher magnifications of the dotted boxes. C–E, Representative traces showing changes in CaO fluorescence plotted over time. CaO reported spontaneous Ca2+ oscillations in astrocytes (C), Ca2+ events induced by the mGluR agonist DHPG (D, bar shows timing of DHPG application; N = 3), and evoked Ca2+ increases by direct Schaeffer collateral stimulation with an electrode (E, arrowhead indicates the time of electrical stimulation; N = 3). Images in E show single confocal planes of CaO-loaded astrocytes (gray). The pseudocolor overlay in the bottom image represents the poststimulation increase in CaO fluorescence (red). F, Representative traces of CaO intensities monitored in the soma of four selected astrocytes (see numbered cells in the left image) adjacent to the apical dendritic projection of a CA1 ChR2-expressing neuron. Illumination at 1 s of 25 Hz light trains aimed at the neuronal cell body triggered Ca2+ elevations in various astrocytes. Observed Ca2+ changes were either single events (trace 1) or multiple events (trace 2), occurring after the light stimulus and with various time delays. Some astrocytes did not respond to the neuronal stimulation (trace 3) or showed complex responses (trace 4). Pseudocolor image to the lower right shows a single confocal plane of CaO-loaded astrocytes (gray) and ChR2–Venus-expressing dendrites (green) 2 s after neuronal stimulation. Red color shows the poststimulation increase in CaO signal. G, Representative traces of CaO intensities monitored along astrocytic process. Ca2+ increases were commonly initiated at the interface between astrocytic processes and neuronal dendrites (boxed area 1; trace 1) and were found to spread along the astrocytic processes (boxed area 2; trace 2) to reach the cell body (boxed area 3; trace 3). Calcium event timing (red arrowhead) after the stimulus (dotted line) are indicated on the plot. Image shows CaO (red) and ChR2–Venus (green). Astrocytic processes are highlighted with white arrowheads. H, Traces from three representative astrocytes to three consecutive stimuli (sent every 2 min) are shown. Top trace shows a missing Ca2+ event after the third stimulus, middle trace shows matching between stimuli and responses, and bottom trace shows a missing Ca2+ event to the second stimulus. Scale bars: B, 50 μm; F, 40 μm; G, 20 μm.
We next verified that CaO was able to report [Ca2+]i events in astrocytes under various conditions. Astrocytes are known to experience spontaneous [Ca2+]i oscillations in situ that are independent of neuronal activity (Fatatis and Russell, 1992; Parri et al., 2001; Nett et al., 2002). CaO-loaded astrocytes showed spontaneous increases of CaO intensity (Fig. 3C), which persisted even in the presence of the sodium channel blocker TTX (data not shown) (Nett et al., 2002). CaO fluorescence intensity and event frequency in stratum radiatum astrocytes were also increased by bath application of the metabotropic glutamate receptor (mGluR) agonist DHPG (Fig. 3D) (Bernstein et al., 1998; Zur Nieden and Deitmer, 2006) and induced by Schaeffer collateral stimulation with an electrode (Fig. 3E) (Perea and Araque, 2005a). Thus, CaO is a useful dye for reporting spontaneous and evoked cytosolic calcium changes. Importantly, CaO has an excitation wavelength that is compatible with the simultaneous use of ChR2 (Fig. 1C).
ChR2 activation in CA1 cells evokes [Ca2+]i responses in astrocytes
Single CA1 pyramidal neuron depolarization by whole-cell patch-clamp techniques has been reported to induce [Ca2+]i increases in astrocytes in the stratum radiatum (Navarrete and Araque, 2008). We followed up on this finding by testing whether single CA1 cell stimulation with ChR2 could trigger [Ca2+]i elevations in stratum radiatum astrocytes. The cell bodies of individual cells expressing ChR2 were illuminated with 445 nm light through an optical fiber placed between the slice surface and the microscope objective without physically disturbing the slice. The imaging field of view was moved along the apical dendrite of the CA1 cells in the stratum radiatum by following ChR2–Venus fluorescence as described. Light trains delivered at 25 Hz for 1 s caused [Ca2+]i increases in astrocytes adjacent to apical dendrites (Fig. 3F). Changes in [Ca2+]i were observed as either single calcium events or a succession of events occurring after the light stimulus with various time delays as described previously (Navarrete and Araque, 2008). A portion of astrocytes did not respond, whereas some showed highly complex responses, especially in cases in which the cell had elevated basal spontaneous Ca2+ activity (Fig. 3F). Evoked [Ca2+]i elevations were commonly initiated at the contact point between an astrocytic process and a dendrite and were found to spread to the soma (Fig. 3G) (Nett et al., 2002). These results demonstrate that astrocytes along apical dendrite projections of ChR2-expressing CA1 cells show [Ca2+]i elevations evoked by neuronal light stimulation.
Surprisingly, we observed that many astrocytes showing [Ca2+]i elevations evoked by the first of three stimuli showed variable responsiveness to the subsequent two stimuli (Fig. 3H). The possibility of light-induced neuronal fatigue and failure to induce consistent neuronal depolarization was unlikely because APs were successfully triggered at 25 Hz when trains were repeated for 10 consecutive trials (Fig. 2C). This suggested that astrocytes either showed a low response probability or exhibited a physiological adaptation to consecutive neuronal stimuli. To address this, 10 consecutive neuronal stimuli were given at 2 min intervals (Fig. 4A,B), and the percentage of responding astrocytes as well as the percentage of cells showing frequency oscillation changes were measured for each stimulus. An astrocyte calcium rise with an amplitude >2 SDs above baseline within a 15 s time window after the stimulus was considered an evoked, synchronized calcium response (Fig. 4C, top) (for details on the time window used, see Materials and Methods) (Navarrete and Araque, 2008). Changes in calcium oscillation frequency were measured by comparing the event frequency 1 min before the stimulus and 1 min after stimulus (Fig. 4C, bottom). Interestingly, only 1.5 ± 1.0% of astrocytes showed synchronized responses, and only 2.7 ± 1.9% of astrocytes elevated their oscillation frequency to 8 of 10 neuronal stimuli (N = 7, n = 124). In fact, 0 of 124 astrocytes across seven experiments responded to >8 of 10 stimuli with synchronized responses or oscillation frequency changes (Fig. 4D,E). We then determined the percentage of astrocytes showing evoked calcium increases for each of the 10 stimuli. On average, each stimulus caused synchronized responses or oscillations changes in 16–26 and 19–21% of observed astrocytes, respectively (Fig. 4F,G). These ranges remained constant throughout the 10 stimuli, with the 1st and 10th stimulus having a similar number of responding astrocytes (Fig. 4H). This suggests that astrocytes have a relatively low reliability of response to neuronal stimuli and do not exhibit significant adaptive changes to consecutive neuronal depolarization events.
Figure 4.
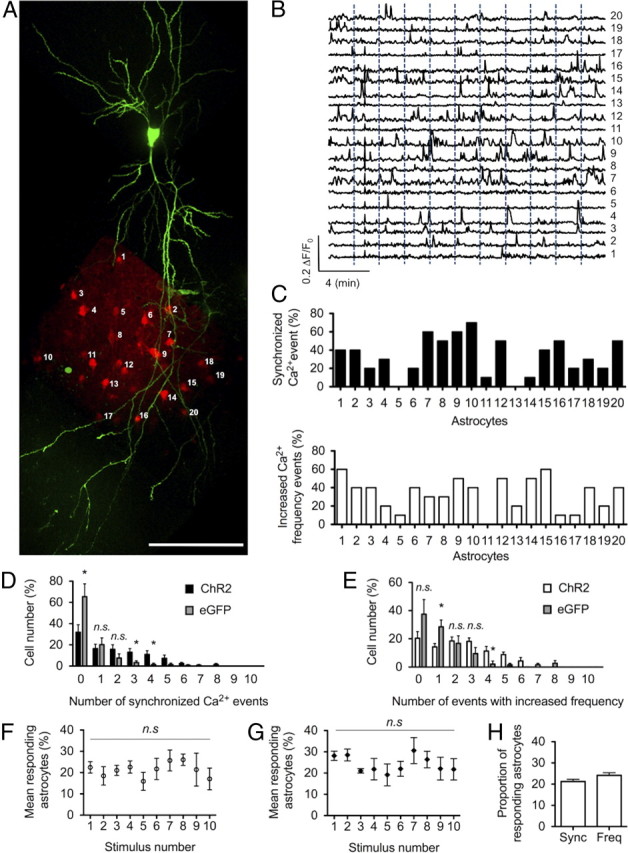
Stratum radiatum astrocytes show variable responses to single CA1 cell stimulation. A, Image showing a Z-stack maximum projection of ChR2-expressing CA1 cell (green; mCherry-f) and a single-plane image of CaO-loaded astrocytes (red) corresponding to the field used for calcium imaging in this experiment. Individual astrocytes are numbered. B, Representative traces of calcium events in numbered astrocytes in A. Ten consecutives stimuli (1 s duration, 25 Hz) were sent every 2 min (dotted blue line). C, Each calcium event with amplitude >2 SDs within a 15 s time window after stimulus was considered an evoked synchronized calcium event. The numbers of evoked synchronized response were counted for each astrocyte in the field of view (top graph; black bars). Elevations of calcium event frequency were also measured by comparing event frequency 1 min before and 1 min after stimulation. The numbers of evoked increases in calcium oscillation were counted for each astrocyte (bottom graph; white bars). D, E, Astrocytes were ranked by their responsiveness to 0–10 of 10 neuronal stimuli. Evoked synchronized responses (black bars in D; n = 124, N = 7) and evoked increases of calcium oscillations (white bars in E) are shown. To measure background events caused by spontaneous calcium events in astrocytes, the same measurements were made when stimulating a CA1 cell expressing eGFPf instead of ChR2 (gray bars in D and E; n = 105, N = 7). Astrocytes showing >2 of 10 evoked synchronized responses (D) or 3 of 10 evoked increases in calcium oscillations (E) were considered to have significant responses above background. Unresponsive astrocytes are more numerous after light stimulation of eGFPf versus ChR2 cells. F, G, The number of responding astrocytes was counted per stimulus. The proportion of responding astrocytes remained constant throughout the 10 stimuli for measured synchronized responses (F) or changes in oscillation frequency (G) (nonsignificant; ANOVA). H, Average proportion of responding glia across 10 stimuli. Scale bar, 100 μm.
Next we were interested in investigating how spontaneous calcium signaling events in astrocytes may have confounded our measurements of evoked calcium events. To determine this, we performed control experiments in which we measured the level of background calcium events in astrocytes after 445 nm laser stimulation. In these experiments, we used an SFV to drive the expression of membrane-targeted eGFP instead of ChR2. We found that ∼2 of 10 synchronized responses and 3 of 10 changes in oscillatory frequency were likely attributable to spontaneous calcium events in astrocytes (Fig. 4D,E). Pooling the percentage of cells above these measured background levels revealed that 35.9 ± 3.7% of all astrocytes showed synchronized responses (Fig. 5A, percentage cells showing >2 of 10 synchronized responses), and 28.7 ± 3.7% exhibited oscillatory changes (Fig. 5B, percentage cells showing >3 of 10 frequency changes), now referred to as responders. In these respective ranges, 6.9 ± 4.8 and 4.4 ± 2.8% of synchronized responses and oscillatory changes in astrocytes were attributable to chance matching of spontaneous calcium rises with evoked events (Fig. 5A,B).
Figure 5.
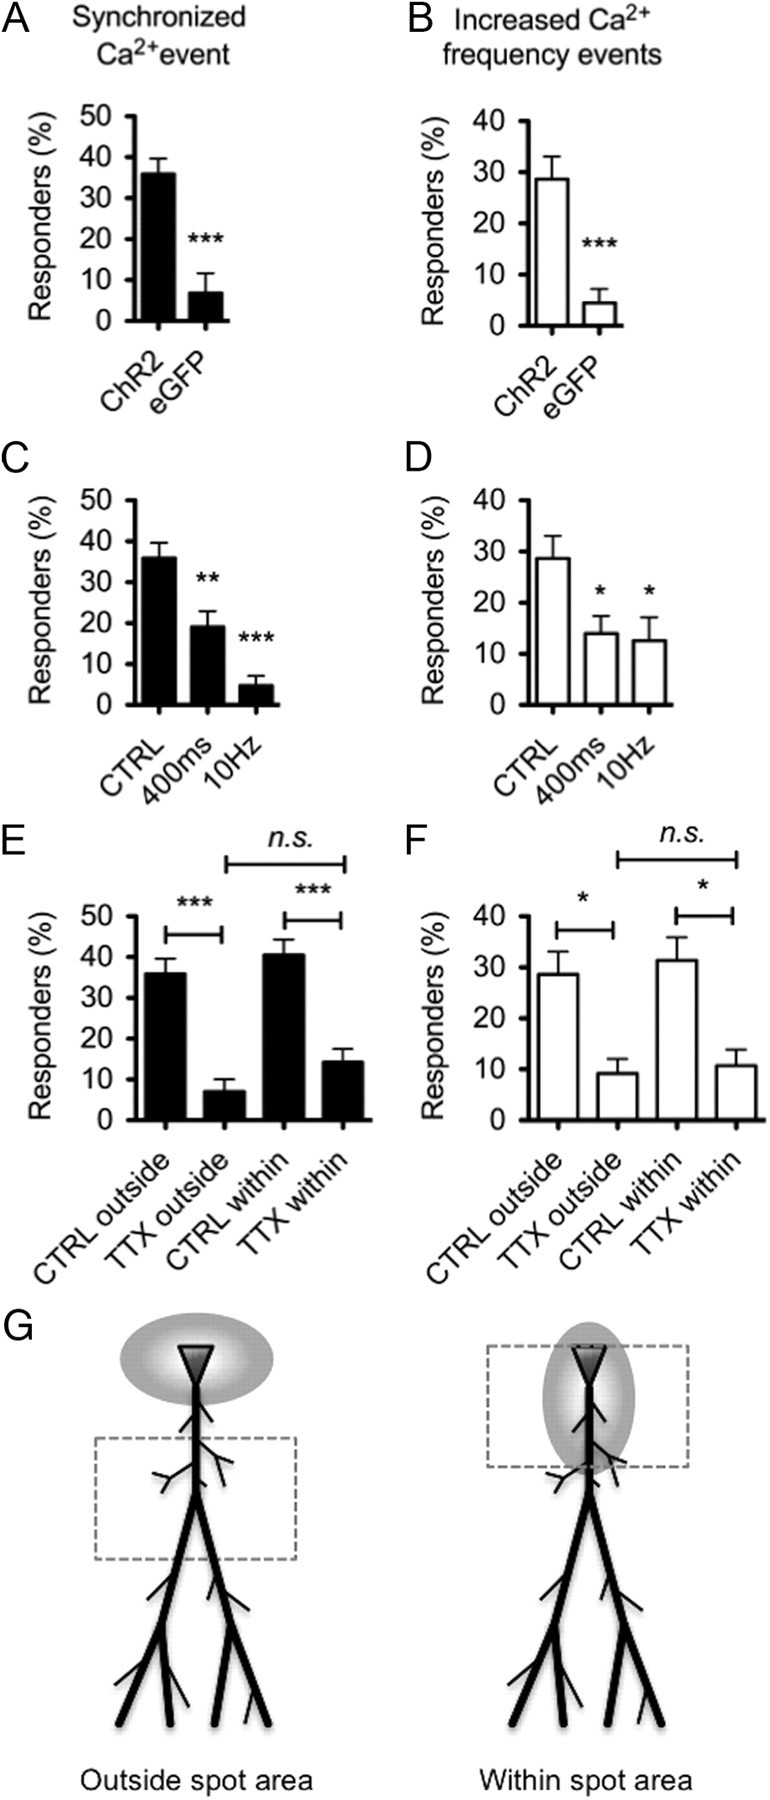
Evoked calcium responses of astrocytes are stimulus strength dependent and need AP propagation through neuronal Na+ channels. A, Number of astrocytes showing >2 of 10 evoked synchronized responses was significantly greater when CA1 cells expressed ChR2 versus eGFPf (two-tailed, unpaired t test). B, Number of astrocytes showing >3 of 10 evoked increases in calcium oscillation frequency was significantly greater when CA1 cells expressed ChR2 versus eGFPf (two-tailed, unpaired t test). C, D, The proportion of responding astrocytes was significantly lower when CA1 cell illumination time is reduced to 400 ms (n = 109, N = 8) or when the frequency of illumination is decreased to 10 Hz (n = 110, N = 7) for both synchronized responses (C) and frequency changes (D). E, F, Blocking APs with 1 μm TTX decreased the number of responding astrocytes to background levels (n = 135, N = 8) when calcium changes were monitored either outside or inside (n = 109, N = 9) the spot area (see scheme in G). No differences were observed between TTX treatment within and outside the illuminated region, suggesting that direct dendritic stimulation was not responsible for the observed calcium responses (two-tailed, unpaired t test). G, Scheme of the stimulated regions (gray ellipse area) versus monitored regions (boxed area) used for the analysis in E and F. CTRL, Control.
We also determined the impact of stimulus strength and duration on the percentage of responding astrocytes. Both shortening the stimulus duration (from 1 s to 400 ms) and decreasing the frequency of light stimulation (from 25 to 10 Hz) significantly decreased the number of responders (Fig. 5C,D). Thus, more robust stimulation increases the reliability of astrocyte responses.
To rule out the possibility that the basic profile of astrocyte calcium responses were unique to the properties of organotypic slices, we performed additional experiments in acute hippocampal slices. We loaded astrocytes with CaO in acute hippocampal slices and patch-clamped CA1 pyramidal neurons. We then subjected CA1 cells to trains of depolarizing voltage pulses (cells depolarized from −70 to +40 mV for 10 ms at a rate of 25 Hz for 1 s) to generate action potentials (Fig. 6A) at an equivalent rate to those induced by ChR2 in organotypic slices (Fig. 4). We found that astrocytes in acute slices behaved similarly to astrocytes in organotypics slices. Neuronal depolarization induced synchronized calcium increases in some astrocytes located in the vicinity of CA1 apical dendrites (Fig. 6A). Importantly, astrocytes showed variable responsiveness to trains of stimuli and followed a distribution that was similar to astrocytes in organotypic slices (Fig. 6B). On average, as was observed with ChR2 in organotypic slices, a low proportion of astrocytes responded to a single stimulus (22.4 ± 3.1% in acute slices vs 21.3 ± 1.1% in organotypic slices) (Fig. 6C). During 10 consecutive neuronal stimuli, very few astrocytes responded to 80% of the stimulus in both acute (2.7 ± 1.4%) and organotypic (1.5 ± 1.0%) slices. This proportion remained fairly constant during repeated stimuli (Fig. 6D). We did find an average drop in astrocyte response to stimuli 8 through 10 in acute slices. However, this reduction was not significant (ANOVA, p > 0.05). Thus, the basic profile of astrocyte calcium responses is similar in organotypic and acute slices after channelrhodopsin-2 and patch-clamp stimulating techniques, respectively.
Figure 6.
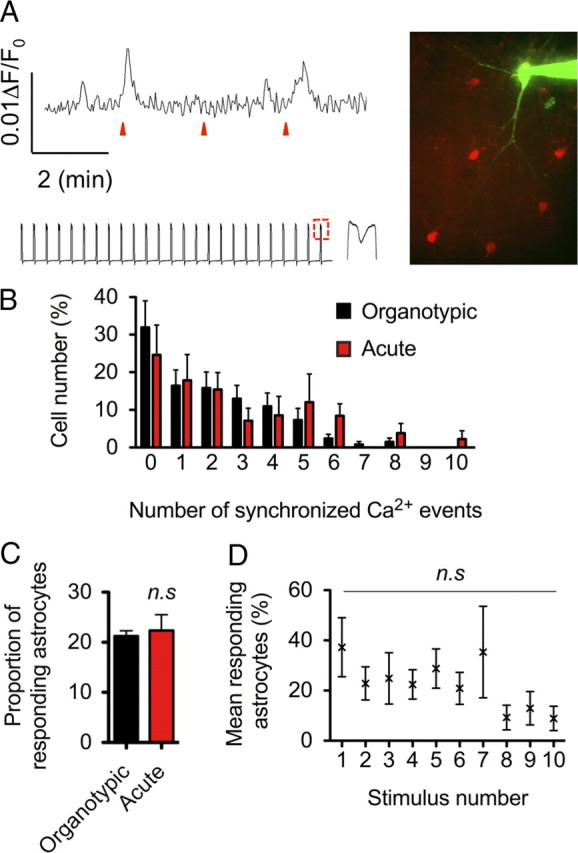
Comparison of evoked calcium responses in astrocytes from organotypic and acute hippocampal slices. A, Representative trace (top trace) of CaO intensity changes in an astrocyte from an acute slice. The trace shows synchronized astrocyte calcium elevations in two of three neuronal depolarization events induced by whole-cell patch-clamp techniques (red arrowheads). The bottom trace shows the 25 Hz train of depolarizing pulse generated in patch clamp. Inset is a higher magnification of the trace (dotted red box) showing the occurrence of an AP during the 10 ms pulse of +40 mV. Image to the right shows CaO-loaded astrocytes (red) around a CA1 pyramidal neuron filled with Alexa Fluor-488 (green) through the patch-clamp pipette. B, Astrocytes were ranked by their responsiveness to 0–10 of 10 consecutive neuronal stimuli. Whole-cell patch-clamp-evoked responses in acute slices (red bars; N = 9) were compared with ChR2-evoked synchronized responses in organotypic slices (black bars; N = 16). C, Average proportion of responding astrocytes across 10 stimuli in organotypic slices (black bar) versus acute slices (red bar). D, The proportion of responding astrocytes remained constant throughout seven stimuli and show a small attenuation from stimuli 8 to 10 (nonsignificant; ANOVA).
Properties of evoked calcium events in astrocytes
Having established that ChR2-mediated evoked activity regulates astrocyte calcium events, we next tested the events that lead to astrocyte calcium responses. We found that reductions in neural activity using the Na+ channel blocker TTX significantly reduced the number of responders to background levels (Fig. 5E,F, TTX outside). This result was not likely attributable to direct effects of TTX on ChR2 because the channel is functional in the presence of this inhibitor (Zhang and Oertner, 2007). We then tested whether the observed calcium events were attributable to direct ChR2 activation (e.g., local neuronal depolarization) or whether action potential propagation was involved. Although direct illumination was unlikely because the light spot area was kept at least half of a field of view away (75 μm) from the imaging area (Fig. 5G, left), we found no significant increase in calcium events (Fig. 5E,F, TTX within) when monitoring astrocytes within the illuminated area (Fig. 5G, right). These data suggest that stimulation of ChR2 in neurons does not directly activate local astrocytes; rather, functional neuronal Na+ channels are required for the evoked calcium events on astrocytes.
Interestingly, backpropagating action potentials (BP APs) in CA1 cells are reduced by TTX (Jaffe et al., 1992; Stuart and Sakmann, 1994; Spruston et al., 1995) and may elicit calcium responses in astrocytes through an endocannabinoid pathway (Navarrete and Araque, 2008). We followed up on the possibility that BP APs and endocannabinoid receptor activation were required for astrocyte calcium responses in our system. However, bath application of the cannabinoid receptor type 1 (CB1) antagonist AM251 did not reduce the percentage of responding cells (Fig. 7A,B). In contrast, inhibition of class I mGluRs, mGluR1 and mGluR5, with LY367385 and MPEP, respectively, significantly decreased the number of synchronized responders without significantly affecting responders experiencing an increase of calcium event frequency. Blocking glutamate transporters with 100 nm TFB–TBOA (Bozzo and Chatton, 2010) did not significantly alter the percentage of responders (Fig. 7A,B). However, in four of nine experiments, evoked calcium elevations in the entire astrocytic population were observed after TFB–TBOA application (Fig. 7C), suggesting some effects of increasing extracellular glutamate levels. These results show that TTX-sensitive Na+ channels and glutamate signaling through mGluR1/5 are important for regulating the reliability of astrocyte calcium responses.
Figure 7.

Properties of evoked calcium events in astrocytes. A, Bath application of the CB1 receptor antagonist AM251 (2 μm) did not modify the number of astrocytes showing evoked synchronized responses (n = 136, N = 8). Inhibiting astrocytic metabotropic glutamate receptors mGluR5 and mGluR1 with MPEP (50 μm) and LY367385 (LY; 100 μm), respectively, significantly reduced the responsiveness of astrocytes (n = 111, N = 8). Inhibiting glial glutamate transporter with TFB–TBOA (100 nm) did not significantly change the proportion of responding astrocytes (n = 126, N = 7). Both 12 h slice treatment with the VAMP/synaptobrevin toxin TeNT (100 ng/ml, n = 135, N = 9) and blocking gap junctions and hemichannels with CBX (20 μm, n = 135, N = 7) had no effect on evoked calcium responses. However, when applied with CBX, the P2Y1–2 purinergic receptor antagonist suramine (100 μm, n = 110, N = 7) blocked the astrocyte responses. The pannexin-1 blocker probenecid (1 mm, n = 119, N = 8) also strongly inhibited evoked calcium increase. B, Pharmacological compounds used in A had less pronounced effects on the evoked calcium frequency elevations. CTRL in A and B refers to ChR2 stimulation at 25 Hz for 1 s in the absence of inhibitors. C, Representative traces (20 superimposed) of evoked responses when TFB–TBOA was bath applied. During some stimuli, TFB–TBOA caused a highly synchronized astrocyte calcium response across the astrocyte population. Arrowheads show the timing of neuronal excitation. D, Superimposed mean trace of evoked events recorded in CA1 while stimulating Schaeffer collaterals in nontreated (black line; n = 120 events, N = 6) and TeNT-treated (gray line; n = 140, N = 7) slice cultures. Bar graph shows the mean values of peak maximum amplitude of control (black bar) and TeNT-treated (gray bar) slices (p < 0.0001, Student's t test). E, Astrocyte responsiveness when the detection window of calcium events was reduced to 5 s. ChR2-evoked synchronized response (black bars; n = 124, N = 7) and eGFPf controls (gray bars; n = 105, N = 7) are shown. F, Astrocytes showing >1 of 10 evoked synchronized responses (instead of 2 with a 15 s detection window) had significant responses above background. G, Using both 5 and 15 s time windows gives the same amount of evoked astrocyte responses.
Astrocytes can communicate with each other over long distances by propagating intercellular [Ca2+]i responses through Ca2+ waves (Cornell-Bell et al., 1990). Waves propagate with a speed of 15–27 μm/s and can recruit hundreds of cells over a radius of 200–350 μm (Kang and Othmer, 2009). Ca2+ waves have been shown to occur in organotypic hippocampal cultures (Dani et al., 1992) and in vivo (Hirase et al., 2004; Nimmerjahn et al., 2009). Both ATP and gap junctions contribute to glial calcium waves in acute isolated CNS tissues (Dani et al., 1992; Newman, 2001; Charles and Giaume, 2002; Haas et al., 2006). To investigate whether astrocyte coupling can contribute to the percentage of responding astrocytes, we applied the gap junction blocker CBX. Because CBX has an inhibitory effect on action potentials at concentrations higher than 50 μm (Zsiros and Maccaferri, 2005; Tovar et al., 2009), we chose a 20 μm concentration that has successfully been used by others to block gap junctions in organotypic slices (Hanstein et al., 2009). However, blocking gap junctions did not change the reliability of the astrocyte events. This suggests that direct astrocyte coupling is not critical for the evoked glial calcium responses we observed (Fig. 7A,B). However, we did find that simultaneous inhibition of purinergic receptors (to block possible ATP-mediated inter-astrocyte communication) and gap junctions strongly blocked the glial calcium responses (Fig. 7A,B). To further assess the contribution of inter-astrocyte associations in mediating evoked responses, we performed an additional analysis in which we reduced the time window for detecting glial calcium events (from 15 to 5 s) (for details, see Materials and Methods). However, we found that the proportion of responding astrocytes and their proximity to dendrites were independent of the selected time window (Fig. 7E–G). This indicates that inter-astrocyte associations are not involved in driving the evoked response pattern observed. It also suggests that ATP signaling may be regulating glial calcium responses independent of its role in calcium wave propagation.
Mapping astrocyte responses to neuronal stimulation
Our previous results indicate that, on average, individual astrocytes in the stratum radiatum show a low ability to respond to repeated CA1 cell stimulation (1.5 ± 1.0% of astrocytes responded to 8 of 10 stimuli with a synchronized calcium increase). In contrast, the reliability of the response across the surrounding astrocyte population of a CA1 cell was actually high, with a 100% chance that at least one astrocyte will respond [∼ 20% of astrocytes respond to each of 10 stimuli (Fig. 4F,G)]. This suggests that astrocytes organize into functional domains and show cooperative responses to single-cell activation. To investigate whether astrocytes in the hippocampus showed any form of patterned organization around CA1 cells, we mapped the position of responding astrocytes along the apical dendrite projection of CA1 cells. The stereotypical CA1 apical dendritic tree is composed of a primary dendrite that bifurcates in the stratum radiatum and gives rise to secondary dendrites. Secondary dendrites also branch into tertiary dendrites before producing a dendritic tuft (Spruston, 2008). Additional small branches (now referred to as obliques) also emanate from primary, secondary, and tertiary dendrites (Spruston, 2008). To determine whether the position of an astrocyte relative to the stimulated neuron affected its ability to respond to evoked activity in that neuron, we measured synchronized calcium responses of astrocytes in the major dendritic subregions. We analyzed the proportion of responders in the primary, secondary, and tertiary subregions of the dendritic tree. We found that the primary dendrite region of CA1 cells supported the highest proportion of responders (Fig. 8A) (53.3 ± 8.9%, N = 9). The proportion of responders was smaller in the secondary and significantly reduced within the tertiary subregions (13.8 ± 3.7%, N = 6). Thus, astrocytes in the primary dendritic subregion showed the greatest chance of responding. Consistent with this, most responders were vertically closer to the soma of the CA1 cell (Fig. 8B). Furthermore, the averaged maximum responsiveness of astrocytes in the primary subregion was significantly greater than in the tertiary subregion (Fig. 8C). Responders were not significantly closer to dendrites (primary, secondary, tertiary, or oblique) than non-responders (Fig. 8D), indicating a relatively homogenous radial distribution of responders in the area covered by apical dendrites. Interestingly, responders were, on average, significantly farther away from the main dendrite (primary, secondary, or tertiary) than they were from the closest oblique (Fig. 8E). Adjusting the time window for detecting astrocyte events from 15 to 5 s revealed the same finding (Fig. 8F), suggesting that inter-astrocyte interactions were not contributing to the organization of the responses. From these collective results, it appears that there is a “vertical” response gradient of evoked calcium increases in astrocytes, with high responsiveness near the soma that gradually decreases into the secondary and tertiary dendritic subregions. This response gradient is restricted to a mean radial distance of 18.9 ± 1.6 μm from the dendritic arbor. These findings reveal the mean activation zone of astrocytes surrounding a single CA1 cell (Fig. 8G).
Figure 8.
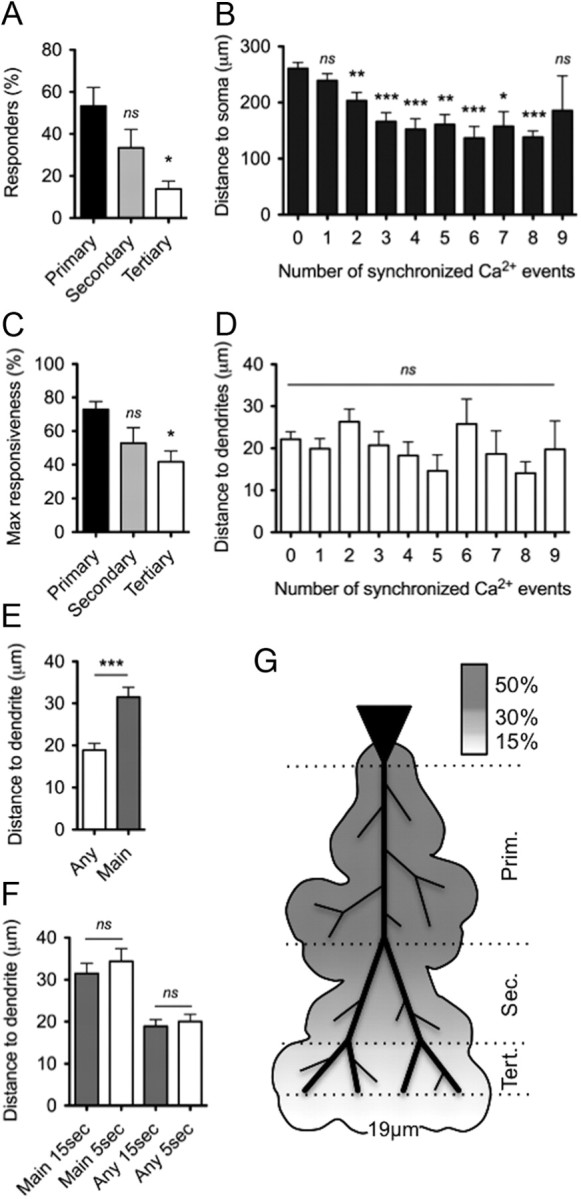
Mapping the location of astrocyte calcium responses. A, The proportion of responders (astrocytes experiencing >2 of 10 synchronized Ca2+ elevations evoked by ChR2 photostimulation) were calculated for the three apical dendrite subregions depicted in G (average values: primary, 53.3 ± 8.9%, N = 9; secondary, 33.4 ± 8.7%, N = 8; and tertiary, 13.8 ± 3.7%, N = 7). Averages for primary and tertiary dendritic regions were significantly different (p = 0.0077, ANOVA with Dunnett's comparison with the primary dendritic region). B, The vertical distance to cell soma was determined for each astrocyte along the apical dendrites of CA1 cells. Distances were plotted for each astrocyte against the number of synchronized responses (0, 260.8 ± 10.6 μm, n = 137; 1, 239.1 ± 12.4 μm, n = 93; 2, 203.3 ± 14.7 μm, n = 76; 3, 166.3 ± 15.7 μm, n = 46; 4, 152.2 ± 19.0 μm, n = 35; 5, 161.0 ± 17.6 μm, n = 23; 6, 136.8 ± 20.6 μm, n = 18; 7, 157.5 ± 26.3 μm, n = 12; 8, 138.3 ± 11.1 μm, n = 19; 9, 185.7 ± 62.0 μm, n = 3). The averages were significantly different (p < 0.0001, ANOVA with Dunnett's comparison with the first column are indicated on graph), indicating that responders are closer to the neuronal soma. C, Astrocytes in the primary subregion showed the greatest maximum response when compared with the other subregions (average values: primary, 72.9 ± 4.7%, N = 7; secondary, 52.9 ± 9.2%, N = 7; and tertiary, 41.7 ± 6.5%, N = 6) (p = 0.021, ANOVA with Dunnett's comparison). D, Astrocyte to dendrite distance did not determine the level of response (p = n.s.). E, Responders are, on average, farther away from main dendrites than from any other dendrite (two-tailed Mann–Whitney test). F, Astrocytes to dendrites (either any or main dendrites) distance is not significantly different (two-tailed Mann–Whitney test) when the window of detection is reduced from 15 to 5 s. G, Two-dimensional schematic illustrating the location of responders along the apical dendrites of CA1 cells.
One complication in the interpretation of the mapping study is that reorganization of axonal connectivity (such as CA1 axon collaterals) in organotypic slices may contribute to the patterned glial response (Aniksztejn et al., 2001). To address whether neurotransmitter released from axons of ChR2-infected neurons was responsible for glial calcium signaling after stimulation, we performed experiments in slices pretreated with TeNT (16–24 h), which potently blocks synaptic transmission by cleaving vesicle-associated membrane protein (VAMP)/synaptobrevin (Schiavo et al., 1992; Capogna et al., 1997; Verderio et al., 1999). We verified the effectiveness of this toxin by measuring evoked potentials in CA1 cells of organotypic slices incubated with and without TeNT. TeNT significantly reduced the amplitude of evoked events (Fig. 7D) (−68.7 ± 3.6 pA, N = 7, n = 140 vs −23.3 ± 2.6 pA, N = 6, n = 120; p < 0.0001, unpaired t test). Despite the significant effect on vesicle release and neurotransmission, TeNT did not reduce the ChR2-mediated evoked glial calcium events (Fig. 7A,B). These results suggest that reorganization of axonal terminals within the stratum radiatum of organotypic slices is not significantly contributing to the patterned glial response.
Because astrocyte responses were not modulated by inhibition of vesicular-mediated release with TeNT (Fig. 7A,B), we investigated other pathways that may lead to increased extracellular ATP and glutamate signaling in response to neuronal activity. Among these pathways, release of ATP and possibly glutamate through neuronal pannexin hemichannels has been postulated (Thompson and Macvicar, 2008). Indeed, ATP release through pannexin-1 has been demonstrated in non-neuronal cells (Bao et al., 2004; Locovei et al., 2006; Huang et al., 2007). Interestingly, we found that applying probenecid, a blocker of pannexin but not connexin hemichannels (Silverman et al., 2008; Silverman et al., 2009), significantly decreased the proportion of responding astrocytes and also reduced calcium event frequency (Fig. 7A,B). Because pannexin-1 is enriched in the dendrites of CA1 cells (Ray et al., 2005; Zoidl et al., 2007), this finding raises the possibility that pannexins allow neurons to promote calcium elevations in nearby astrocytes through a non-vesicular release of molecules such as ATP and glutamate.
Discussion
Intracellular calcium transients are among the most fascinating properties of astrocytes. They occur spontaneously and in response to neuronal stimulation both in vitro and in vivo and are implicated in several physiological functions of both neurons and glial cells (Perea and Araque, 2005b). Recent studies have found that astrocyte calcium signaling regulates synaptic transmission and plasticity in various regions of the CNS (Serrano et al., 2006; Jourdain et al., 2007; Gordon et al., 2009; Henneberger et al., 2010), and neuron–astrocyte signaling is believed to contribute to higher-order information processing in the brain (Schipke et al., 2008; Fellin, 2009).
Here we uncovered several important aspects of astrocyte calcium events in the hippocampus. We first established a viral gene delivery system to selectively drive the expression of ChR2 in single CA1 pyramidal neurons and demonstrated that light pulses can effectively control their spiking pattern in the hippocampus, consistent with other reports (Schoenenberger et al., 2008). We also determined the minimal requirements for light activation of ChR2 in organotypic slices and the maximal output of CA1 cells in our system. This was critical because we observed that astrocytes showed a variable response to single CA1 cell stimulation. We found that individual astrocytes, on average, had relatively low accuracy when responding to consecutive stimuli. Populations of astrocytes, in contrast, were found to have high reliability. To understand how responding astrocytes were functionally organized, we probed responses along the dendritic tree of single CA1 cells and found that cells in the primary dendrite region and located closest to the soma had the most robust responses. Our results further reveal the complexity of activity-dependent neuron–glial communication and provide new insight into the organization of astrocyte–neuron networks in the brain.
We found that astrocyte calcium events were dependent on stimulus strength and required class I mGluRs and TTX-sensitive sodium channels. The reduction in the number of responding cells after inhibition of mGluR1/5 is consistent with the importance of mGluRs in mediating astrocyte calcium events in response to glutamate (Schools and Kimelberg, 1999; Fiacco and McCarthy, 2004; Zur Nieden and Deitmer, 2006; D'Ascenzo et al., 2007). Dendrites are known to release neurotransmitters (Rall and Shepherd, 1968) and several other compounds (Waters et al., 2005). In pyramidal neurons, both endocannabinoids (Sjöström et al., 2003) and glutamate (Zilberter, 2000) are potential feedback transmitters released from dendrites. The mechanisms underlying the release of these factors from neurons remains to be fully understood but may be attributable to BP APs in dendrites (Kreitzer and Regehr, 2002). Astrocytic processes are interdigitated with dendritic branches and are well positioned to detect BP APs in dendrites. In fact, we observed that astrocyte calcium signaling was commonly initiated at contact points between astrocytes and dendrites (Fig. 3G). Consistent with a role of BP APs in astrocyte calcium responses, we found that ChR2-mediated astrocyte responses were effectively blocked by TTX (Fig. 5E,F), which is known to block BP APs in the apical dendrites of CA1 pyramidal cells (Jaffe et al., 1992). Importantly, only a few very distal astrocytes (up to 487 μm away from the pyramidal cell soma along the apical dendritic tree) showed evoked calcium events, whereas astrocytes closer to the soma were more responsive. This proximal–distal gradient of astrocyte calcium responses to neuronal stimulation may be related to the decreased efficiency of BP APs to invade distal dendrites (Callaway and Ross, 1995; Spruston et al., 1995). Additional work is necessary to determine how BP APs may drive patterned glial responses.
Recent work by Navarette and Araque (2008, 2010) showed that CA1 neuron depolarization caused local calcium signaling in astrocytes located near apical dendrites. This was mediated by neuronal release of endocannabinoids and the activation of CB1 receptors on astrocytes. CB1 receptor activation, in turn, promoted the release of glutamate from astrocytes and the stimulation of neuronal NMDA receptors and presynaptic mGluRs. The fact that CB1 receptors are not required for astrocyte responses in our system may be attributable to the mode and level of neuronal stimulation. Perhaps lower levels of neuronal stimulation lead to astrocyte calcium events that are CB1 receptor independent, whereas strong and sustained neuronal depolarization through patch clamp facilitates endocannabinoid release. Additional studies using new variants of ChR2 that show less inactivation in response to persistent light (Lin et al., 2009) may be helpful in assessing the effects of stronger neuronal stimulation in triggering astrocyte calcium responses.
Dendrites of pyramidal neurons of the neocortex (Zilberter, 2000) and Purkinje cells of the cerebellum (Levenes et al., 2001) are believed to release glutamate, and this may serve to activate nearby astrocytes. Here, we identified glutamate, as well as ATP, as a part of the mechanism evoking calcium events in astrocytes. One candidate protein that may regulate their release from dendrites is pannexin-1. Indeed, pannexin-mediated efflux of ATP has been described for erythrocytes and taste cells (Locovei et al., 2006; Huang et al., 2007). Interestingly, in hippocampal pyramidal cells, pannexin-1 is expressed at postsynaptic densities (Ray et al., 2005; Zoidl et al., 2007) in which it may serve as a conduit for the transfer of molecules such as ATP and possibly glutamate (Thompson and Macvicar, 2008). Consistent with a role of pannexins in mediating signaling that modulates astrocyte calcium responses, application of the pannexin inhibitor probenecid (Silverman et al., 2008) reduced both the percentage of responding astrocytes and the frequency of their calcium events. Surprisingly, treatment of slices with carbenoxolone (which also blocks pannexin-1) (Locovei et al., 2007) did not reduce glial calcium responses. However, because carbenoxolone is known to inhibit APs in a dose-dependent manner (Tovar et al., 2009), we used a low concentration of CBX (20 μm) to increase the specificity of the drug toward inhibition of gap junctions (Hanstein et al., 2009). This CBX concentration in organotypic slices may not be effective in blocking pannexin-1 because higher concentrations have been used (Locovei et al., 2007). Experiments aimed at reducing pannexin-1 expression selectively in CA1 neurons will be helpful in investigating the role of pannexin-1 in stimulating calcium events in neighboring astrocytes through activity-dependent release of ATP and/or glutamate from dendrites.
There is now strong debate in the field regarding the importance of astrocyte calcium signaling in regulating synaptic properties. Several groups have found that astrocyte calcium signals and the release of gliotransmitters such as glutamate, ATP, and d-serine serve to activate neuronal receptors and modify the properties of synaptic transmission through various pathways. This has significant implications for both basal synaptic transmission (Angulo et al., 2004; Pascual et al., 2005; Perea and Araque, 2007; Gordon et al., 2009) and long-term plasticity (Yang et al., 2003; Panatier et al., 2006; Henneberger et al., 2010). However, some recent studies suggest that astrocyte calcium events do not cause changes in basal transmission or plasticity (Fiacco et al., 2007; Petravicz et al., 2008; Agulhon et al., 2010). In these studies, calcium events in astrocytes failed to change any parameters of synaptic transmission. The reasons behind these discrepancies are unclear but may be attributable to the intricate nature of neuron–astrocyte communication. Our results suggest that activity of a single neuron can influence the calcium properties of a complex network of astrocytes. Remarkably, the ability of an individual astrocyte to show repeated responses to consecutive neuronal stimulation is fairly low (1–3% of astrocytes respond to a maximum of 8 of 10 consecutive stimuli). However, when taking into account the entire surrounding astrocyte population of a CA1 cell, the response is accurate. Interestingly, inhibition of gap junctions and altering the time window for detecting calcium events showed that inter-astrocyte coupling was not likely accounting for the complex pattern of glial responses observed. However, the location of the astrocyte plays a significant role in setting the reliability of the astrocyte response. The impact of these variables (low reliability of single astrocytes and astrocyte location) is important and should be considered when interpreting neuron-evoked astrocyte calcium signaling events.
The results presented here advance our understanding of the spatial and functional relationship between neurons and glia in the brain. Furthermore, they indicate that astrocyte calcium responses can be modulated through various mechanisms. This study underscores the complex nature of neuron–glial interactions that promote information processing in the brain.
Footnotes
This work was supported by the Canadian Institutes of Health Research, Canada Research Chairs Program, Canadian Foundation for Innovation, and the EJLB Foundation (K.K.M.). Y.B. was supported by Fellowships PBLAB-118155 and PA00A3-121419 from the Swiss National Science Foundation. C.S. was supported by a fellowship through the Canadian Institutes of Health Research, and E.V.J. and W.T.F. were partially supported through postdoctoral fellowships through the Research Institute of the McGill University Health Centre. We thank Dr. Karel Svoboda for the pCAGGS–ChR2–Venus construct, Dr. Roger Tsien for the original mCherry vector, and the laboratory of Dr. Charles Bourque for their technical assistance with acute slice electrophysiology.
References
- Abramoff MD, Magelhaes PJ, Ram SJ. Image processing with ImageJ. Biophoton Int. 2004;11:36–42. [Google Scholar]
- Agulhon C, Fiacco TA, McCarthy KD. Hippocampal short- and long-term plasticity are not modulated by astrocyte Ca2+ signaling. Science. 2010;327:1250–1254. doi: 10.1126/science.1184821. [DOI] [PubMed] [Google Scholar]
- Angulo MC, Kozlov AS, Charpak S, Audinat E. Glutamate released from glial cells synchronizes neuronal activity in the hippocampus. J Neurosci. 2004;24:6920–6927. doi: 10.1523/JNEUROSCI.0473-04.2004. [DOI] [PMC free article] [PubMed] [Google Scholar]
- Aniksztejn L, Demarque M, Morozov Y, Ben-Ari Y, Represa A. Recurrent CA1 collateral axons in developing rat hippocampus. Brain Res. 2001;913:195–200. doi: 10.1016/s0006-8993(01)02817-7. [DOI] [PubMed] [Google Scholar]
- Araque A, Martín ED, Perea G, Arellano JI, Buño W. Synaptically released acetylcholine evokes Ca2+ elevations in astrocytes in hippocampal slices. J Neurosci. 2002;22:2443–2450. doi: 10.1523/JNEUROSCI.22-07-02443.2002. [DOI] [PMC free article] [PubMed] [Google Scholar]
- Bao L, Locovei S, Dahl G. Pannexin membrane channels are mechanosensitive conduits for ATP. FEBS Lett. 2004;572:65–68. doi: 10.1016/j.febslet.2004.07.009. [DOI] [PubMed] [Google Scholar]
- Bekenstein JW, Lothman EW. A comparison of the ontogeny of excitatory and inhibitory neurotransmission in the CA1 region and dentate gyrus of the rat hippocampal formation. Brain Res Dev Brain Res. 1991;63:237–243. doi: 10.1016/0165-3806(91)90083-u. [DOI] [PubMed] [Google Scholar]
- Bernardinelli Y, Magistretti PJ, Chatton JY. Astrocytes generate Na+-mediated metabolic waves. Proc Natl Acad Sci U S A. 2004;101:14937–14942. doi: 10.1073/pnas.0405315101. [DOI] [PMC free article] [PubMed] [Google Scholar]
- Bernardinelli Y, Haeberli C, Chatton JY. Flash photolysis using a light emitting diode: an efficient, compact, and affordable solution. Cell Calcium. 2005;37:565–572. doi: 10.1016/j.ceca.2005.03.001. [DOI] [PubMed] [Google Scholar]
- Bernstein M, Behnisch T, Balschun D, Reymann KG, Reiser G. Pharmacological characterisation of metabotropic glutamatergic and purinergic receptors linked to Ca2+ signalling in hippocampal astrocytes. Neuropharmacology. 1998;37:169–178. doi: 10.1016/s0028-3908(98)00012-4. [DOI] [PubMed] [Google Scholar]
- Boitier E, Rea R, Duchen MR. Mitochondria exert a negative feedback on the propagation of intracellular Ca2+ waves in rat cortical astrocytes. J Cell Biol. 1999;145:795–808. doi: 10.1083/jcb.145.4.795. [DOI] [PMC free article] [PubMed] [Google Scholar]
- Boyden ES, Zhang F, Bamberg E, Nagel G, Deisseroth K. Millisecond-timescale, genetically targeted optical control of neural activity. Nat Neurosci. 2005;8:1263–1268. doi: 10.1038/nn1525. [DOI] [PubMed] [Google Scholar]
- Bozzo L, Chatton JY. Inhibitory effects of (2S, 3S)-3-[3-[4-(trifluoromethyl)benzoylamino]benzyloxy]aspartate (TFB-TBOA) on the astrocytic sodium responses to glutamate. Brain Res. 2010;1316:27–34. doi: 10.1016/j.brainres.2009.12.028. [DOI] [PubMed] [Google Scholar]
- Bushong EA, Martone ME, Jones YZ, Ellisman MH. Protoplasmic astrocytes in CA1 stratum radiatum occupy separate anatomical domains. J Neurosci. 2002;22:183–192. doi: 10.1523/JNEUROSCI.22-01-00183.2002. [DOI] [PMC free article] [PubMed] [Google Scholar]
- Caeser M, Aertsen A. Morphological organization of rat hippocampal slice cultures. J Comp Neurol. 1991;307:87–106. doi: 10.1002/cne.903070109. [DOI] [PubMed] [Google Scholar]
- Callaway JC, Ross WN. Frequency-dependent propagation of sodium action potentials in dendrites of hippocampal CA1 pyramidal neurons. J Neurophysiol. 1995;74:1395–1403. doi: 10.1152/jn.1995.74.4.1395. [DOI] [PubMed] [Google Scholar]
- Capogna M, McKinney RA, O'Connor V, Gähwiler BH, Thompson SM. Ca2+ or Sr2+ partially rescues synaptic transmission in hippocampal cultures treated with botulinum toxin A and C, but not tetanus toxin. J Neurosci. 1997;17:7190–7202. doi: 10.1523/JNEUROSCI.17-19-07190.1997. [DOI] [PMC free article] [PubMed] [Google Scholar]
- Charles AC, Giaume C. Intercellular calcium waves in astrocytes: underlying mechanisms and functional significance. In: Volterra A, Magistretti PJ, Haydon PG, editors. The tripartite synapse. New York: Oxford UP; 2002. pp. 110–126. [Google Scholar]
- Cornell-Bell AH, Finkbeiner SM, Cooper MS, Smith SJ. Glutamate induces calcium waves in cultured astrocytes: long-range glial signaling. Science. 1990;247:470–473. doi: 10.1126/science.1967852. [DOI] [PubMed] [Google Scholar]
- Dani JW, Chernjavsky A, Smith SJ. Neuronal activity triggers calcium waves in hippocampal astrocyte networks. Neuron. 1992;8:429–440. doi: 10.1016/0896-6273(92)90271-e. [DOI] [PubMed] [Google Scholar]
- D'Ascenzo M, Fellin T, Terunuma M, Revilla-Sanchez R, Meaney DF, Auberson YP, Moss SJ, Haydon PG. mGluR5 stimulates gliotransmission in the nucleus accumbens. Proc Natl Acad Sci U S A. 2007;104:1995–2000. doi: 10.1073/pnas.0609408104. [DOI] [PMC free article] [PubMed] [Google Scholar]
- DiCiommo DP, Bremner R. Rapid, high level protein production using DNA-based Semliki Forest virus vectors. J Biol Chem. 1998;273:18060–18066. doi: 10.1074/jbc.273.29.18060. [DOI] [PubMed] [Google Scholar]
- Duffy S, MacVicar BA. Adrenergic calcium signaling in astrocyte networks within the hippocampal slice. J Neurosci. 1995;15:5535–5550. doi: 10.1523/JNEUROSCI.15-08-05535.1995. [DOI] [PMC free article] [PubMed] [Google Scholar]
- Ehrengruber MU, Lundstrom K, Schweitzer C, Heuss C, Schlesinger S, Gähwiler BH. Recombinant Semliki Forest virus and Sindbis virus efficiently infect neurons in hippocampal slice cultures. Proc Natl Acad Sci U S A. 1999;96:7041–7046. doi: 10.1073/pnas.96.12.7041. [DOI] [PMC free article] [PubMed] [Google Scholar]
- Fatatis A, Russell JT. Spontaneous changes in intracellular calcium concentration in type I astrocytes from rat cerebral cortex in primary culture. Glia. 1992;5:95–104. doi: 10.1002/glia.440050203. [DOI] [PubMed] [Google Scholar]
- Fellin T. Communication between neurons and astrocytes: relevance to the modulation of synaptic and network activity. J Neurochem. 2009;108:533–544. doi: 10.1111/j.1471-4159.2008.05830.x. [DOI] [PubMed] [Google Scholar]
- Fellin T, Halassa MM, Terunuma M, Succol F, Takano H, Frank M, Moss SJ, Haydon PG. Endogenous nonneuronal modulators of synaptic transmission control cortical slow oscillations in vivo. Proc Natl Acad Sci U S A. 2009;106:15037–15042. doi: 10.1073/pnas.0906419106. [DOI] [PMC free article] [PubMed] [Google Scholar]
- Fiacco TA, McCarthy KD. Intracellular astrocyte calcium waves in situ increase the frequency of spontaneous AMPA receptor currents in CA1 pyramidal neurons. J Neurosci. 2004;24:722–732. doi: 10.1523/JNEUROSCI.2859-03.2004. [DOI] [PMC free article] [PubMed] [Google Scholar]
- Fiacco TA, Agulhon C, Taves SR, Petravicz J, Casper KB, Dong X, Chen J, McCarthy KD. Selective stimulation of astrocyte calcium in situ does not affect neuronal excitatory synaptic activity. Neuron. 2007;54:611–626. doi: 10.1016/j.neuron.2007.04.032. [DOI] [PubMed] [Google Scholar]
- Frotscher M, Gähwiler BH. Synaptic organization of intracellularly stained CA3 pyramidal neurons in slice cultures of rat hippocampus. Neuroscience. 1988;24:541–551. doi: 10.1016/0306-4522(88)90348-x. [DOI] [PubMed] [Google Scholar]
- Frotscher M, Heimrich B, Schwegler H. Plasticity of identified neurons in slice cultures of hippocampus: a combined Golgi/electron microscopic and immunocytochemical study. Prog Brain Res. 1990;83:323–339. doi: 10.1016/s0079-6123(08)61260-1. [DOI] [PubMed] [Google Scholar]
- Gähwiler BH. Organotypic monolayer cultures of nervous tissue. J Neurosci Methods. 1981;4:329–342. doi: 10.1016/0165-0270(81)90003-0. [DOI] [PubMed] [Google Scholar]
- Giaume C, Venance L. Intercellular calcium signaling and gap junctional communication in astrocytes. Glia. 1998;24:50–64. [PubMed] [Google Scholar]
- Gordon GR, Iremonger KJ, Kantevari S, Ellis-Davies GC, MacVicar BA, Bains JS. Astrocyte-mediated distributed plasticity at hypothalamic glutamate synapses. Neuron. 2009;64:391–403. doi: 10.1016/j.neuron.2009.10.021. [DOI] [PMC free article] [PubMed] [Google Scholar]
- Gourine AV, Kasymov V, Marina N, Tang F, Figueiredo MF, Lane S, Teschemacher AG, Spyer KM, Deisseroth K, Kasparov S. Astrocytes control breathing through pH-dependent release of ATP. Science. 2010;329:571–575. doi: 10.1126/science.1190721. [DOI] [PMC free article] [PubMed] [Google Scholar]
- Haas B, Schipke CG, Peters O, Söhl G, Willecke K, Kettenmann H. Activity-dependent ATP-waves in the mouse neocortex are independent from astrocytic calcium waves. Cereb Cortex. 2006;16:237–246. doi: 10.1093/cercor/bhi101. [DOI] [PubMed] [Google Scholar]
- Haber M, Zhou L, Murai KK. Cooperative astrocyte and dendritic spine dynamics at hippocampal excitatory synapses. J Neurosci. 2006;26:8881–8891. doi: 10.1523/JNEUROSCI.1302-06.2006. [DOI] [PMC free article] [PubMed] [Google Scholar]
- Hajnóczky G, Robb-Gaspers LD, Seitz MB, Thomas AP. Decoding of cytosolic calcium oscillations in the mitochondria. Cell. 1995;82:415–424. doi: 10.1016/0092-8674(95)90430-1. [DOI] [PubMed] [Google Scholar]
- Halassa MM, Fellin T, Takano H, Dong JH, Haydon PG. Synaptic islands defined by the territory of a single astrocyte. J Neurosci. 2007;27:6473–6477. doi: 10.1523/JNEUROSCI.1419-07.2007. [DOI] [PMC free article] [PubMed] [Google Scholar]
- Hanstein R, Trotter J, Behl C, Clement AB. Increased connexin 43 expression as a potential mediator of the neuroprotective activity of the corticotropin-releasing hormone. Mol Endocrinol. 2009;23:1479–1493. doi: 10.1210/me.2009-0022. [DOI] [PMC free article] [PubMed] [Google Scholar]
- Hassinger TD, Guthrie PB, Atkinson PB, Bennett MV, Kater SB. An extracellular signaling component in propagation of astrocytic calcium waves. Proc Natl Acad Sci U S A. 1996;93:13268–13273. doi: 10.1073/pnas.93.23.13268. [DOI] [PMC free article] [PubMed] [Google Scholar]
- Henneberger C, Papouin T, Oliet SH, Rusakov DA. Long-term potentiation depends on release of D-serine from astrocytes. Nature. 2010;463:232–236. doi: 10.1038/nature08673. [DOI] [PMC free article] [PubMed] [Google Scholar]
- Hirase H, Qian L, Barthó P, Buzsáki G. Calcium dynamics of cortical astrocytic networks in vivo. PLoS Biol. 2004;2:E96. doi: 10.1371/journal.pbio.0020096. [DOI] [PMC free article] [PubMed] [Google Scholar]
- Huang YJ, Maruyama Y, Dvoryanchikov G, Pereira E, Chaudhari N, Roper SD. The role of pannexin 1 hemichannels in ATP release and cell-cell communication in mouse taste buds. Proc Natl Acad Sci U S A. 2007;104:6436–6441. doi: 10.1073/pnas.0611280104. [DOI] [PMC free article] [PubMed] [Google Scholar]
- Jaffe DB, Johnston D, Lasser-Ross N, Lisman JE, Miyakawa H, Ross WN. The spread of Na+ spikes determines the pattern of dendritic Ca2+ entry into hippocampal neurons. Nature. 1992;357:244–246. doi: 10.1038/357244a0. [DOI] [PubMed] [Google Scholar]
- Jourdain P, Bergersen LH, Bhaukaurally K, Bezzi P, Santello M, Domercq M, Matute C, Tonello F, Gundersen V, Volterra A. Glutamate exocytosis from astrocytes controls synaptic strength. Nat Neurosci. 2007;10:331–339. doi: 10.1038/nn1849. [DOI] [PubMed] [Google Scholar]
- Kang J, Jiang L, Goldman SA, Nedergaard M. Astrocyte-mediated potentiation of inhibitory synaptic transmission. Nat Neurosci. 1998;1:683–692. doi: 10.1038/3684. [DOI] [PubMed] [Google Scholar]
- Kang M, Othmer HG. Spatiotemporal characteristics of calcium dynamics in astrocytes. Chaos. 2009;19 doi: 10.1063/1.3206698. 037116. [DOI] [PMC free article] [PubMed] [Google Scholar]
- Kreitzer AC, Regehr WG. Retrograde signaling by endocannabinoids. Curr Opin Neurobiol. 2002;12:324–330. doi: 10.1016/s0959-4388(02)00328-8. [DOI] [PubMed] [Google Scholar]
- Levenes C, Daniel H, Crepel F. Retrograde modulation of transmitter release by postsynaptic subtype 1 metabotropic glutamate receptors in the rat cerebellum. J Physiol. 2001;537:125–140. doi: 10.1111/j.1469-7793.2001.0125k.x. [DOI] [PMC free article] [PubMed] [Google Scholar]
- Lin JY, Lin MZ, Steinbach P, Tsien RY. Characterization of engineered channelrhodopsin variants with improved properties and kinetics. Biophys J. 2009;96:1803–1814. doi: 10.1016/j.bpj.2008.11.034. [DOI] [PMC free article] [PubMed] [Google Scholar]
- Locovei S, Bao L, Dahl G. Pannexin 1 in erythrocytes: function without a gap. Proc Natl Acad Sci U S A. 2006;103:7655–7659. doi: 10.1073/pnas.0601037103. [DOI] [PMC free article] [PubMed] [Google Scholar]
- Locovei S, Scemes E, Qiu F, Spray DC, Dahl G. Pannexin1 is part of the pore forming unit of the P2X7 receptor death complex. FEBS Lett. 2007;581:483–488. doi: 10.1016/j.febslet.2006.12.056. [DOI] [PMC free article] [PubMed] [Google Scholar]
- Lundstrom K, Abenavoli A, Malgaroli A, Ehrengruber MU. Novel Semliki Forest virus vectors with reduced cytotoxicity and temperature sensitivity for long-term enhancement of transgene expression. Mol Ther. 2003;7:202–209. doi: 10.1016/s1525-0016(02)00056-4. [DOI] [PubMed] [Google Scholar]
- Nagai T, Ibata K, Park ES, Kubota M, Mikoshiba K, Miyawaki A. A variant of yellow fluorescent protein with fast and efficient maturation for cell-biological applications. Nat Biotechnol. 2002;20:87–90. doi: 10.1038/nbt0102-87. [DOI] [PubMed] [Google Scholar]
- Nagel G, Szellas T, Huhn W, Kateriya S, Adeishvili N, Berthold P, Ollig D, Hegemann P, Bamberg E. Channelrhodopsin-2, a directly light-gated cation-selective membrane channel. Proc Natl Acad Sci U S A. 2003;100:13940–13945. doi: 10.1073/pnas.1936192100. [DOI] [PMC free article] [PubMed] [Google Scholar]
- Navarrete M, Araque A. Endocannabinoids mediate neuron-astrocyte communication. Neuron. 2008;57:883–893. doi: 10.1016/j.neuron.2008.01.029. [DOI] [PubMed] [Google Scholar]
- Navarrete M, Araque A. Endocannabinoids potentiate synaptic transmission through stimulation of astrocytes. Neuron. 2010;68:113–126. doi: 10.1016/j.neuron.2010.08.043. [DOI] [PubMed] [Google Scholar]
- Nett WJ, Oloff SH, McCarthy KD. Hippocampal astrocytes in situ exhibit calcium oscillations that occur independent of neuronal activity. J Neurophysiol. 2002;87:528–537. doi: 10.1152/jn.00268.2001. [DOI] [PubMed] [Google Scholar]
- Newman EA. Propagation of intercellular calcium waves in retinal astrocytes and Muller cells. J Neurosci. 2001;21:2215–2223. doi: 10.1523/JNEUROSCI.21-07-02215.2001. [DOI] [PMC free article] [PubMed] [Google Scholar]
- Nimmerjahn A, Mukamel EA, Schnitzer MJ. Motor behavior activates Bergmann glial networks. Neuron. 2009;62:400–412. doi: 10.1016/j.neuron.2009.03.019. [DOI] [PMC free article] [PubMed] [Google Scholar]
- Nixdorf-Bergweiler BE, Albrecht D, Heinemann U. Developmental changes in the number, size, and orientation of GFAP-positive cells in the CA1 region of rat hippocampus. Glia. 1994;12:180–195. doi: 10.1002/glia.440120304. [DOI] [PubMed] [Google Scholar]
- Panatier A, Theodosis DT, Mothet JP, Touquet B, Pollegioni L, Poulain DA, Oliet SH. Glia-derived D-serine controls NMDA receptor activity and synaptic memory. Cell. 2006;125:775–784. doi: 10.1016/j.cell.2006.02.051. [DOI] [PubMed] [Google Scholar]
- Parpura V, Haydon PG. UV photolysis using a micromanipulated optical fiber to deliver UV energy directly to the sample. J Neurosci Methods. 1999;87:25–34. doi: 10.1016/s0165-0270(98)00155-1. [DOI] [PubMed] [Google Scholar]
- Parri HR, Gould TM, Crunelli V. Spontaneous astrocytic Ca2+ oscillations in situ drive NMDAR-mediated neuronal excitation. Nat Neurosci. 2001;4:803–812. doi: 10.1038/90507. [DOI] [PubMed] [Google Scholar]
- Pascual O, Casper KB, Kubera C, Zhang J, Revilla-Sanchez R, Sul JY, Takano H, Moss SJ, McCarthy K, Haydon PG. Astrocytic purinergic signaling coordinates synaptic networks. Science. 2005;310:113–116. doi: 10.1126/science.1116916. [DOI] [PubMed] [Google Scholar]
- Pasti L, Volterra A, Pozzan T, Carmignoto G. Intracellular calcium oscillations in astrocytes: a highly plastic, bidirectional form of communication between neurons and astrocytes in situ. J Neurosci. 1997;17:7817–7830. doi: 10.1523/JNEUROSCI.17-20-07817.1997. [DOI] [PMC free article] [PubMed] [Google Scholar]
- Perea G, Araque A. Properties of synaptically evoked astrocyte calcium signal reveal synaptic information processing by astrocytes. J Neurosci. 2005a;25:2192–2203. doi: 10.1523/JNEUROSCI.3965-04.2005. [DOI] [PMC free article] [PubMed] [Google Scholar]
- Perea G, Araque A. Glial calcium signaling and neuron-glia communication. Cell Calcium. 2005b;38:375–382. doi: 10.1016/j.ceca.2005.06.015. [DOI] [PubMed] [Google Scholar]
- Perea G, Araque A. Astrocytes potentiate transmitter release at single hippocampal synapses. Science. 2007;317:1083–1086. doi: 10.1126/science.1144640. [DOI] [PubMed] [Google Scholar]
- Petravicz J, Fiacco TA, McCarthy KD. Loss of IP3 receptor-dependent Ca2+ increases in hippocampal astrocytes does not affect baseline CA1 pyramidal neuron synaptic activity. J Neurosci. 2008;28:4967–4973. doi: 10.1523/JNEUROSCI.5572-07.2008. [DOI] [PMC free article] [PubMed] [Google Scholar]
- Petreanu L, Huber D, Sobczyk A, Svoboda K. Channelrhodopsin-2-assisted circuit mapping of long-range callosal projections. Nat Neurosci. 2007;10:663–668. doi: 10.1038/nn1891. [DOI] [PubMed] [Google Scholar]
- Porter JT, McCarthy KD. Hippocampal astrocytes in situ respond to glutamate released from synaptic terminals. J Neurosci. 1996;16:5073–5081. doi: 10.1523/JNEUROSCI.16-16-05073.1996. [DOI] [PMC free article] [PubMed] [Google Scholar]
- Rall W, Shepherd GM. Theoretical reconstruction of field potentials and dendrodendritic synaptic interactions in olfactory bulb. J Neurophysiol. 1968;31:884–915. doi: 10.1152/jn.1968.31.6.884. [DOI] [PubMed] [Google Scholar]
- Ray A, Zoidl G, Weickert S, Wahle P, Dermietzel R. Site-specific and developmental expression of pannexin1 in the mouse nervous system. Eur J Neurosci. 2005;21:3277–3290. doi: 10.1111/j.1460-9568.2005.04139.x. [DOI] [PubMed] [Google Scholar]
- Ritter E, Stehfest K, Berndt A, Hegemann P, Bartl FJ. Monitoring light-induced structural changes of Channelrhodopsin-2 by UV-visible and Fourier transform infrared spectroscopy. J Biol Chem. 2008;283:35033–35041. doi: 10.1074/jbc.M806353200. [DOI] [PMC free article] [PubMed] [Google Scholar]
- Schiavo G, Benfenati F, Poulain B, Rossetto O, Polverino de Laureto P, DasGupta BR, Montecucco C. Tetanus and botulinum-B neurotoxins block neurotransmitter release by proteolytic cleavage of synaptobrevin. Nature. 1992;359:832–835. doi: 10.1038/359832a0. [DOI] [PubMed] [Google Scholar]
- Schipke CG, Boucsein C, Ohlemeyer C, Kirchhoff F, Kettenmann H. Astrocyte Ca2+ waves trigger responses in microglial cells in brain slices. FASEB J. 2002;16:255–257. doi: 10.1096/fj.01-0514fje. [DOI] [PubMed] [Google Scholar]
- Schipke CG, Haas B, Kettenmann H. Astrocytes discriminate and selectively respond to the activity of a subpopulation of neurons within the barrel cortex. Cereb Cortex. 2008;18:2450–2459. doi: 10.1093/cercor/bhn009. [DOI] [PubMed] [Google Scholar]
- Schoenenberger P, Grunditz A, Rose T, Oertner TG. Optimizing the spatial resolution of Channelrhodopsin-2 activation. Brain Cell Biol. 2008;36:119–127. doi: 10.1007/s11068-008-9025-8. [DOI] [PubMed] [Google Scholar]
- Schools GP, Kimelberg HK. mGluR3 and mGluR5 are the predominant metabotropic glutamate receptor mRNAs expressed in hippocampal astrocytes acutely isolated from young rats. J Neurosci Res. 1999;58:533–543. doi: 10.1002/(sici)1097-4547(19991115)58:4<533::aid-jnr6>3.0.co;2-g. [DOI] [PubMed] [Google Scholar]
- Schummers J, Yu H, Sur M. Tuned responses of astrocytes and their influence on hemodynamic signals in the visual cortex. Science. 2008;320:1638–1643. doi: 10.1126/science.1156120. [DOI] [PubMed] [Google Scholar]
- Serrano A, Haddjeri N, Lacaille JC, Robitaille R. GABAergic network activation of glial cells underlies hippocampal heterosynaptic depression. J Neurosci. 2006;26:5370–5382. doi: 10.1523/JNEUROSCI.5255-05.2006. [DOI] [PMC free article] [PubMed] [Google Scholar]
- Silverman WR, de Rivero Vaccari JP, Locovei S, Qiu F, Carlsson SK, Scemes E, Keane RW, Dahl G. The pannexin 1 channel activates the inflammasome in neurons and astrocytes. J Biol Chem. 2009;284:18143–18151. doi: 10.1074/jbc.M109.004804. [DOI] [PMC free article] [PubMed] [Google Scholar]
- Silverman W, Locovei S, Dahl G. Probenecid, a gout remedy, inhibits pannexin 1 channels. Am J Physiol Cell Physiol. 2008;295:C761–C767. doi: 10.1152/ajpcell.00227.2008. [DOI] [PMC free article] [PubMed] [Google Scholar]
- Simard M, Arcuino G, Takano T, Liu QS, Nedergaard M. Signaling at the gliovascular interface. J Neurosci. 2003;23:9254–9262. doi: 10.1523/JNEUROSCI.23-27-09254.2003. [DOI] [PMC free article] [PubMed] [Google Scholar]
- Sjöström PJ, Turrigiano GG, Nelson SB. Neocortical LTD via coincident activation of presynaptic NMDA and cannabinoid receptors. Neuron. 2003;39:641–654. doi: 10.1016/s0896-6273(03)00476-8. [DOI] [PubMed] [Google Scholar]
- Spruston N. Pyramidal neurons: dendritic structure and synaptic integration. Nat Rev Neurosci. 2008;9:206–221. doi: 10.1038/nrn2286. [DOI] [PubMed] [Google Scholar]
- Spruston N, Schiller Y, Stuart G, Sakmann B. Activity-dependent action potential invasion and calcium influx into hippocampal CA1 dendrites. Science. 1995;268:297–300. doi: 10.1126/science.7716524. [DOI] [PubMed] [Google Scholar]
- Stuart GJ, Sakmann B. Active propagation of somatic action potentials into neocortical pyramidal cell dendrites. Nature. 1994;367:69–72. doi: 10.1038/367069a0. [DOI] [PubMed] [Google Scholar]
- Thévenaz P, Unser M. User-friendly semiautomated assembly of accurate image mosaics in microscopy. Microsc Res Tech. 2007;70:135–146. doi: 10.1002/jemt.20393. [DOI] [PubMed] [Google Scholar]
- Thompson RJ, Macvicar BA. Connexin and pannexin hemichannels of neurons and astrocytes. Channels (Austin) 2008;2:81–86. doi: 10.4161/chan.2.2.6003. [DOI] [PubMed] [Google Scholar]
- Tovar KR, Maher BJ, Westbrook GL. Direct actions of carbenoxolone on synaptic transmission and neuronal membrane properties. J Neurophysiol. 2009;102:974–978. doi: 10.1152/jn.00060.2009. [DOI] [PMC free article] [PubMed] [Google Scholar]
- Verderio C, Coco S, Bacci A, Rossetto O, De Camilli P, Montecucco C, Matteoli M. Tetanus toxin blocks the exocytosis of synaptic vesicles clustered at synapses but not of synaptic vesicles in isolated axons. J Neurosci. 1999;19:6723–6732. doi: 10.1523/JNEUROSCI.19-16-06723.1999. [DOI] [PMC free article] [PubMed] [Google Scholar]
- Volterra A, Meldolesi J. Astrocytes, from brain glue to communication elements: the revolution continues. Nat Rev Neurosci. 2005;6:626–640. doi: 10.1038/nrn1722. [DOI] [PubMed] [Google Scholar]
- Wang J, Hasan MT, Seung HS. Laser-evoked synaptic transmission in cultured hippocampal neurons expressing channelrhodopsin-2 delivered by adeno-associated virus. J Neurosci Methods. 2009;183:165–175. doi: 10.1016/j.jneumeth.2009.06.024. [DOI] [PMC free article] [PubMed] [Google Scholar]
- Waters J, Schaefer A, Sakmann B. Backpropagating action potentials in neurones: measurement, mechanisms and potential functions. Prog Biophys Mol Biol. 2005;87:145–170. doi: 10.1016/j.pbiomolbio.2004.06.009. [DOI] [PubMed] [Google Scholar]
- Yang Y, Ge W, Chen Y, Zhang Z, Shen W, Wu C, Poo M, Duan S. Contribution of astrocytes to hippocampal long-term potentiation through release of D-serine. Proc Natl Acad Sci U S A. 2003;100:15194–15199. doi: 10.1073/pnas.2431073100. [DOI] [PMC free article] [PubMed] [Google Scholar]
- Zhang F, Wang LP, Boyden ES, Deisseroth K. Channelrhodopsin-2 and optical control of excitable cells. Nat Methods. 2006;3:785–792. doi: 10.1038/nmeth936. [DOI] [PubMed] [Google Scholar]
- Zhang YP, Oertner TG. Optical induction of synaptic plasticity using a light-sensitive channel. Nat Methods. 2007;4:139–141. doi: 10.1038/nmeth988. [DOI] [PubMed] [Google Scholar]
- Zhou L, Martinez SJ, Haber M, Jones EV, Bouvier D, Doucet G, Corera AT, Fon EA, Zisch AH, Murai KK. EphA4 signaling regulates phospholipase Cgamma1 activation, cofilin membrane association, and dendritic spine morphology. J Neurosci. 2007;27:5127–5138. doi: 10.1523/JNEUROSCI.1170-07.2007. [DOI] [PMC free article] [PubMed] [Google Scholar]
- Zilberter Y. Dendritic release of glutamate suppresses synaptic inhibition of pyramidal neurons in rat neocortex. J Physiol. 2000;528:489–496. doi: 10.1111/j.1469-7793.2000.00489.x. [DOI] [PMC free article] [PubMed] [Google Scholar]
- Zimmer J, Gähwiler BH. Cellular and connective organization of slice cultures of the rat hippocampus and fascia dentata. J Comp Neurol. 1984;228:432–446. doi: 10.1002/cne.902280310. [DOI] [PubMed] [Google Scholar]
- Zoidl G, Petrasch-Parwez E, Ray A, Meier C, Bunse S, Habbes HW, Dahl G, Dermietzel R. Localization of the pannexin1 protein at postsynaptic sites in the cerebral cortex and hippocampus. Neuroscience. 2007;146:9–16. doi: 10.1016/j.neuroscience.2007.01.061. [DOI] [PubMed] [Google Scholar]
- Zsiros V, Maccaferri G. Electrical coupling between interneurons with different excitable properties in the stratum lacunosum-moleculare of the juvenile CA1 rat hippocampus. J Neurosci. 2005;25:8686–8695. doi: 10.1523/JNEUROSCI.2810-05.2005. [DOI] [PMC free article] [PubMed] [Google Scholar]
- Zur Nieden R, Deitmer JW. The role of metabotropic glutamate receptors for the generation of calcium oscillations in rat hippocampal astrocytes in situ. Cereb Cortex. 2006;16:676–687. doi: 10.1093/cercor/bhj013. [DOI] [PubMed] [Google Scholar]