

Abstract
Cell identity switches, where terminally-differentiated cells convert into different cell-types when stressed, represent a widespread regenerative strategy in animals, yet they are poorly documented in mammals. In mice, some glucagon-producing pancreatic α-cells and somatostatin-producing δ-cells become insulin expressers upon ablation of insulin-secreting β-cells, promoting diabetes recovery. Whether human islets also display this plasticity, especially in diabetic conditions, remains unknown. Here we show that islet non-β-cells, namely α-cells and PPY-producing γ–cells, obtained from deceased non-diabetic or diabetic human donors, can be lineage-traced and reprogrammed by the transcription factors Pdx1 and MafA to produce and secrete insulin in response to glucose. When transplanted into diabetic mice, converted human α-cells reverse diabetes and remain producing insulin even after 6 months. Surprisingly, insulin-producing α-cells maintain α-cell markers, as seen by deep transcriptomic and proteomic characterization. These observations provide conceptual evidence and a molecular framework for a mechanistic understanding of in situ cell plasticity as a treatment for diabetes and other degenerative diseases.
Fostering cell regeneration in damaged tissue is one of the cornerstones of regenerative medicine. Attempts at reprogramming human fibroblasts, keratinocytes or pancreatic exocrine cells toward insulin production have been unsatisfactory 1–4. In diabetic mice, insulin-producing cells are naturally reconstituted by consistent but rare islet cell-type interconversion events 5,6,7. In human islets, bihormonal cells have been described under certain conditions in vitro 8,9 and in diabetics 10–12. This is compatible with the existence of adaptive cell identity changes that must be confirmed and understood to harness their regenerative potential in diabetes 8,13–15. Indeed, these claims remain speculative without evidence based on cell-tracing analyses 16,17.
Pdx1 and MafA are required for β-cell development, maturation and function 18. We and others have previously shown that overexpression of these transcription factors (TFs) convert embryonic or adult α-cells of diabetic mice into insulin-producers 13,19. In this work we show that human α- and γ-cells may become glucose-dependent insulin secreters.
Generation of human monotypic pseudoislets
We devised a multistep approach to study islet cell plasticity: i) cell-sorting by flow cytometry using cell-surface antibodies 20, ii) adenoviral GFP-labeling of purified islet cells expressing Pdx1, MafA and/or Nkx6.1, iii) reaggregation of labeled cells into monotypic “pseudoislets”, i.e. islet-like 3D-clusters containing only one islet cell-type, and iv) in vitro and in vivo functional, molecular profiling, and immunogenicity analyses (Fig. 1a).
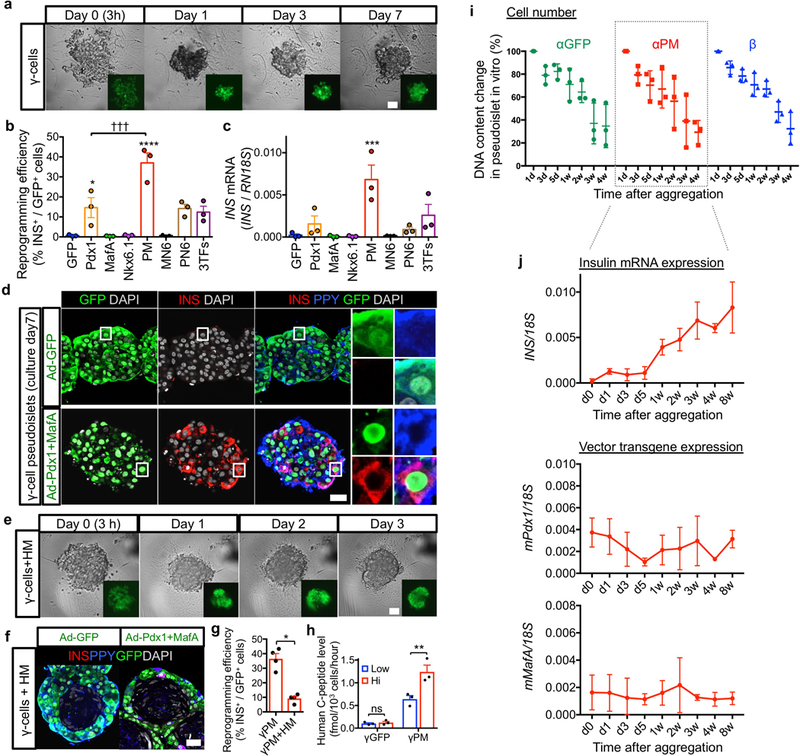
Figure 1. Glucagon-expressing α-cells efficiently engage insulin production.
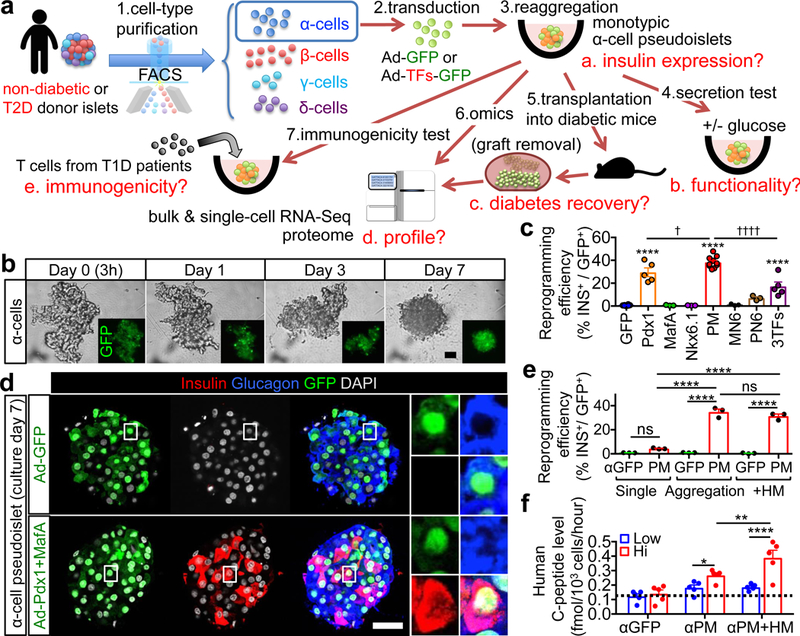
(a) Generation and analysis of pseudoislets composed of labeled human islet endocrine cells. Highly pure cell preparations were labeled with GFP alone or in combination with reprogramming factors (“TFs”) via adenoviral transduction (see Extended Data Fig. 1 and Supplementary Table 2). Labeled islet cells were reaggregated into pseudoislets and analyzed in vitro and in vivo after transplantation into immunodeficient mice to examine their functionality, molecular profiling, and immunogenicity. (b) Live-imaging during reaggregation of GFP-transduced α-cells. (c) Insulin protein expression in α-cells 7 days after transduction and aggregation. PM: Pdx1+MafA, MN6: MafA+Nkx6.1, PN6: Pdx1+Nkx6.1, 3TFs: Pdx1+MafA+Nkx6.1. ****p<0.0001 vs. αGFP control; ††††p<0.0001, †p=0.047 vs. αPM, one-way ANOVA with Tukey’s multiple comparisons test. n=10 (αGFP, αPM), n=5 (αPdx1, α3TFs), n=3 (αMafA, αNkx6.1, αMN6 and αPN6). All samples are replications from different donors. (d) Immunofluorescence of 2 pseudoislets made of α-cells transduced with GFP (αGFP) or GFP and Pdx1+MafA (αPM) (see Extended Data Fig. 3a). Most reprogrammed insulin-producing α-cells express glucagon 1 week after transduction. (e) Reaggregation significantly increases insulin expression in αPM-cells. Only 4% of αPM cells contain insulin if kept as single α-cells. Upon reaggregation, either alone or in combination with HUVECs & MSCs (“HM”), 35% become insulin+. ****p<0.0001, ns (not significant): p=0.38 (αGFP singlets vs αPM singlets), p=0.40 (αPM vs αPM+HM), one-way ANOVA with Tukey’s multiple comparisons test. n=3 donor samples in each condition. (f) GSIS. C-peptide release from αPM cells is enhanced in the presence of HM cells; the dotted line indicates C-peptide background level in medium-only αGFP controls. ****p<0.0001, **p=0.0068, *p=0.028, two-way RM ANOVA with Holm-Sidak’s multiple comparisons test. n=5 donor samples in each condition. Scale bars: 25 μm. Images are representative from 5 (b,f) or 38 (d) independent experiments. All data are mean ± s.e.m.
Cell purity after sorting was 99% for α- and β-cells, and 94% for γ-cells (Extended Data Fig. 1a-c), while δ-cell purification was unreliable with available antibodies (Extended Data Fig.1; Supplementary Tables 1 and 2). Purified islet cells were transduced with different TFs and GFP (>99% efficiency; Extended Data Fig. 1d), allowing a traceability equivalent to genetic cell-lineage analyses in mice.
Since dissociated single β-cells fail to secrete insulin in vitro 21, we validated the experimental approach by assessing the secretory function of monotypic pseudoislets of β-cells. We reaggregated the GFP-labeled β-cells either alone or with human mesenchymal stem cells (MSCs) and umbilical vein endothelial cells (HUVECs), to recreate a beneficial niche for cell function 22,23 (Extended Data Fig. 2a,b). β-cell pseudoislets formed within a day in the presence of HUVECs and MSCs (hereafter “HM”) (Extended Data Fig. 2a,c). β-cell pseudoislets showed rare apoptosis and restored glucose-stimulated insulin secretion (GSIS), comparable to that of native islets (Extended Data Fig. 2d–g). The absence of α-, δ- and γ-cells in monotypic β-cell pseudoislets did not affect GSIS ex vivo. Thus, simple reaggregation invigorates the purified human β-cells, likely by reconstituting an islet-like environment 24.
Insulin secretion by transduced human α-cells
Pdx1, MafA and Nkx6.1 are β-cell-enriched TFs spontaneously upregulated in insulin-producing α-cells after total β-cell ablation in mice 6. We thus explored whether human non-β-cells acquire insulin production upon ectopic expression of these factors. We transduced purified human α-cells with bicistronic adenoviral vectors expressing a murine β-cell TF along with GFP (Pdx1-GFP, MafA-GFP and Nkx6.1-GFP), before pseudoislet reaggregation and analysis (a week later; Fig. 1a,b).
Control GFP-transduced α-cells (αGFP pseudoislets) were insulin-negative (99.4±0.4 %), while the Pdx1 and MafA combination (αPM pseudoislets) triggered the highest reprogramming efficiency (38.3±5.0%; Fig. 1c,d and Extended Data Fig. 3a,b). After a week in culture, nearly all insulin-producing α-cells maintained GCG and ARX expression (Fig. 1d and Extended Data Fig. 3c,d; see below the RNA profiling). αPM cells cultured as single-cells displayed a much lower reprogramming frequency (3.9%) ex vivo or in vivo after transplantation (Figure 1e; Extended Data Fig. 3e, and not shown). Similar to β-cells, α-cells aggregated faster into pseudoislets in the presence of HM cells, though reprogramming frequency remained unchanged (Figure 1e; Extended Data Fig. 3f–h). Apoptosis and proliferation were rare (Extended Data Fig. 3i,j). Both αPM and αPM+HM pseudoislets displayed significant GSIS in culture (Fig. 1f), with HM cells further enhancing secretion. Therefore, Pdx1/MafA coexpression engages human α-cells into glucose-dependent insulin secretion.
Insulin secretion by transduced human γ-cells
We observed that PPY-producing γ-cells transduced with PM engage in insulin production as efficiently as α-cells, while maintaining PPY expression (Extended Data Fig. 4a–d). HM cells accelerated reaggregation, yet decreasing reprogramming frequency (Extended Data Fig. 4e–g). γPM pseudoislets secreted insulin upon glucose stimulation, even better than α-cells (Figs. 1f; Extended Data Fig. 4h). This is the first observation of γ-cell plasticity. Combined, these observations represent the first direct evidence for the plasticity of mature human islet non-β-cells.
Diabetes remission by insulin-secreting α-cells
Pseudoislets maintained in culture lose cells steadily, yet insulin mRNA levels increase (Extended Data Fig. 4i,j). This suggests that culture conditions are not optimal but reprogramming nevertheless progresses with time. To evaluate pseudoislet function in vivo, we transferred pseudoislets made of αPM+HM cells (“αPM pseudoislets” hereafter) to immunodeficient NSG mice, in five different experiments (Fig. 2a; Supplementary Table 3). α-cells from non-diabetic donors were transplanted into healthy (Experiment #1: Extended Data Fig. 5) or diabetic host mice (Exps. #2 to #4: Fig. 2, Extended Data Fig. 6), and from type 2 diabetic (T2D) donors to diabetic mice (Exp. #5: Fig. 2, Extended Data Fig. 7).
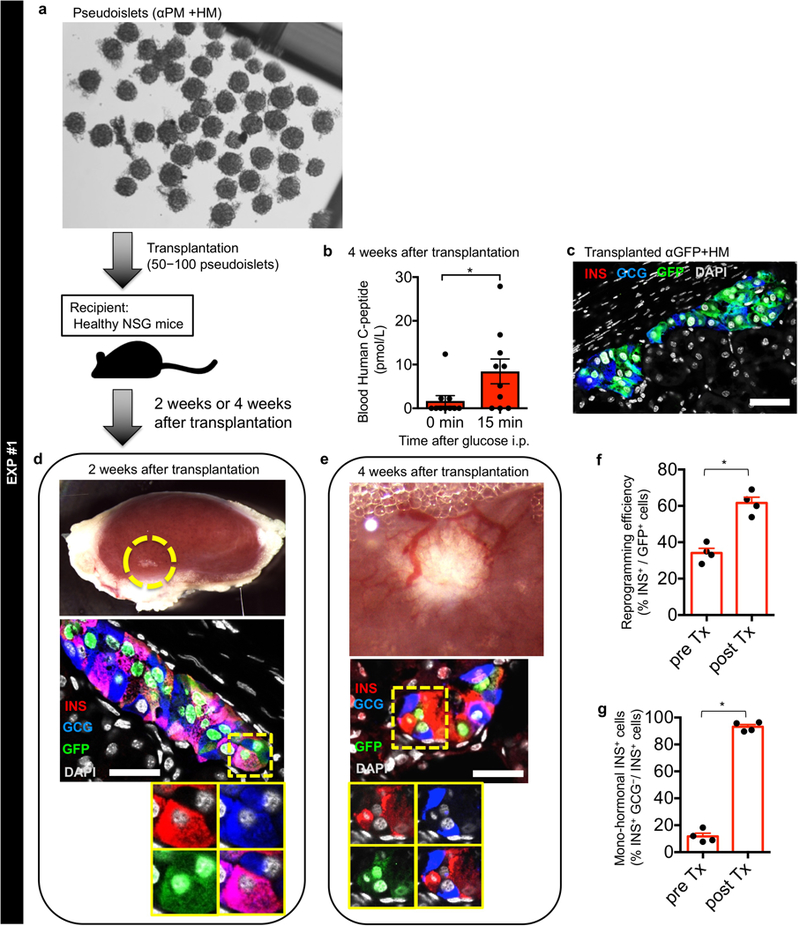
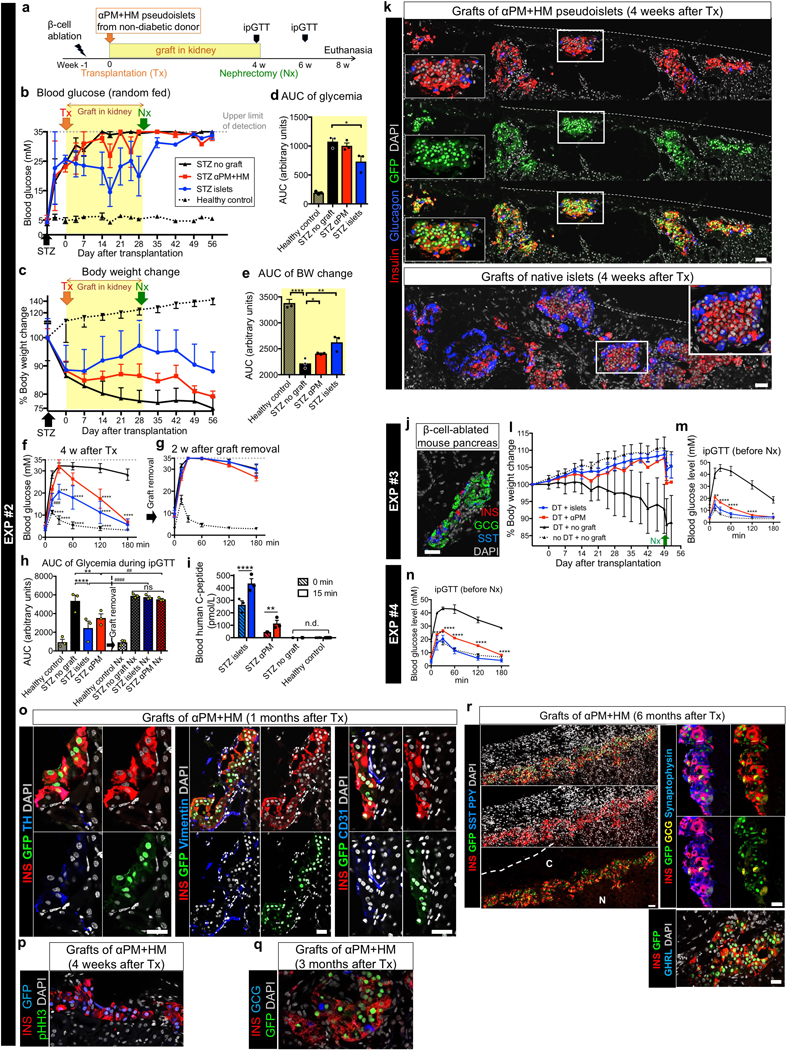
Figure 2. Insulin-producing human α-cells reverse murine diabetes.
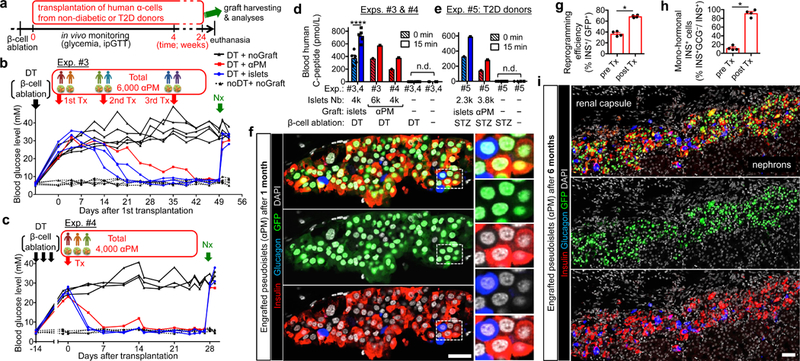
(a) Experimental design. NSG or NSG-RIP-DTR mice were made diabetic with streptozotocin (STZ) or diphtheria toxin (DT); αPM pseudoislets were transplanted under the renal capsule, either from single (Exp.#2; Extended Data Fig. 6) or multiple donors (Exps.#3 & #4; b,c). Grafts were removed after 4 weeks or up to 24 weeks in the longest experiment (“Nx” in b,c). (b) Random-fed glycemia in Exp.#3. Glycemia was decreased to normal (dotted lines) after engraftment of 6,000 pseudoislets generated from 6 donors (red line), in 3 transplantations (“Tx”: 2,150+3,100+750), like controls receiving human islets (4,000 IEQ, blue lines). Untransplanted diabetics remained hyperglycemic (black lines). n=5 (DT+noGraft), n=3 from 3 donors (DT+islets), n=1 from 6 donors (DT+αPM), n=5 mice (noDT+noGraft). (c) Random-fed glycemia in Exp.#4. 4,000 pseudoislets made from 3 donors were transplanted, leading to complete rescue. n=3 (DT+noGraft), n=2 from 2 donors (DT+islets), n=1 from 3 donors (DT+αPM), n=4 mice (noDT+noGraft). (d,e) Human C-peptide blood levels before and after glucose injection. Data from non-diabetic (d; Exps.#3,#4) and T2D donors (e; Exp.#5) are shown. n.d., undetectable. ****p<0.0001, two-way RM ANOVA with Holm-Sidak’s multiple-comparison tests. In d, n=8 (DT+noGraft), n=5 from 5 donors (DT+islets), n=1 from 6 donors (DT+αPM, Exp.#3), n=1 from 3 donors (DT+αPM, Exp.#4), n=9 mice (noDT+noGraft). In e, n=4 (STZ+noGraft), n=1 from 1 donor (STZ+islets), n=1 from 2 donors (STZ+αPM, Exp.#5), n=2 mice (noDT+noGraft). (f) Immunofluorescence on transplanted pseudoislets. Monohormonal insulin-expressing (red) α-cells (GFP+, green) are abundant. (g,h) Reprogramming efficiency (g) and percentage of monohormonal insulin-producing cells (h) in αPM pseudoislets before and after transplantation. *p=0.029, two-tailed Mann-Whitney test. n=4 donors. (i) Immunofluorescence on pseudoislets engrafted for 6-months. n=1 (6 months; i, Extended Data Fig. 6r) and n=1 (3 months; Extended Data Fig. 6q). Scale bars: 25 (f), 50 μm (i). Data are mean ± s.e.m. (d,e,g,h).
We detected circulating human insulin upon glucose stimulation in healthy mice given αPM pseudoislets from non-diabetic donors (Exp. #1: Extended Data Fig. 5a,b; Supplementary Table 4), and then tested whether the insulin-producing human α-cells ameliorate the clinical signs of mice made diabetic. Glucose tolerance and GSIS were improved in mice receiving the maximum amount of αPM pseudoislets that we could generate from one single donor (between 200 and 1,000) (Exp. #2: Extended Data Fig. 6a–k; Supplementary Table 5). Yet hyperglycemia was not normalized, probably because of the suboptimal quantity of engrafted pseudoislets. We therefore transplanted αPM pseudoislets from multiple non-diabetic-donors (Exp. #3: 6,000 αPM pseudoislets from 6 donors and Exp. #4: 4,000 αPM pseudoislets from 3 donors; Fig. 2a-c; Supplementary Table 6). Diabetic mice became normoglycemic (Fig. 2b,c) and body weight loss was curbed, like controls receiving intact islets (4,000 IEQ; Extended Data Fig. 6l). Glucose tolerance and GSIS were similar in mice transplanted with either reprogrammed α-cells or intact islets (Fig. 2d; Extended Data Fig. 6m,n). Hyperglycemia reappeared upon graft removal, proving that recovery was induced by the engrafted insulin-secreting human αPM.
While αGFP pseudoislet grafts displayed no insulin production (<1%; Extended Data Fig. 5c: Exp. #1), most α-cells in αPM grafts contained insulin (67.9±1.9%; Fig. 2f,g) and became monohormonal (91.7±9.7%; Fig. 2f,h), indicating that the in vivo environment fosters cell conversion and maturation (Exp. #1: Extended Data Fig. 5d–g). Transplanted αPM pseudoislets were vascularized and innervated (Extended Data Figs. 5e, 6o), which correlates with their functionality, without cell proliferation (Extended Data Fig. 6p). They contained abundant GFP/insulin-coexpressing cells up to 6 months, the longest period analyzed (68.4%: reprogramming efficiency; Fig. 2i; Exp. #2, Extended Data Fig. 6q,r). In summary, insulin-producing human α-cells retain their phenotype in vivo, restoring normoglycemia in diabetic mice.
α-cells from T2D patients display distinctive transcriptomic signatures 25. We then explored whether T2D α-cells can engage in regulated insulin secretion in culture and in vivo (Exp. #5; Extended Data Fig. 7, Supplementary Table 7). In transplanted mice, random-fed glycemic levels became lower, with complete recovery when the mouse was given anti-glucagon therapy 26,27 to compensate for the insufficient number of transplanted cells (Extended Data Fig. 7f,g). We also observed improved glucose tolerance and GSIS (Fig. 2e; Extended Data Fig. 7h–j). Interestingly, the engrafted T2D αPM pseudoislets retained ARX expression while endogenous PDX1, MAFA and NKX6.1 were upregulated (Extended Data Fig. 7o). At the ultrastructural level, T2D αPM cells contained β-like dense-core granules (Extended Data Fig. 7p). Apoptotic cells were rare (Extended Data Fig. 7q). In conclusion, human α-cells in T2D conditions preserve the plasticity potential.
Hybrid signature of reprogrammed α-cells
To characterize the insulin-producing α-cells (Fig. 1f), we performed bulk mRNA sequencing (RNA-Seq) on sorted α- and β-cells, on αGFP, αPM, and βGFP pseudoislets after 7 days of culture, and on grafted αPM pseudoislets 1 month post-transplantation (Supplementary Table 8). Principal component and correlation analyses revealed that αPM cells display a signature intermediate between α- and β-cells, further shifted toward that of β-cells after transplantation into mice (Fig. 3a,b).
Figure 3. Transcriptomic and proteomic analyses of insulin-producing human α-cells.
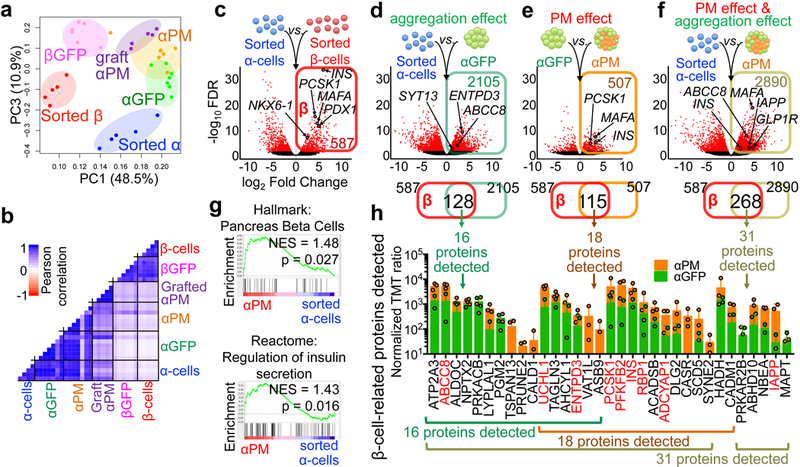
Principal component (a) and Pearson correlation (b) analyses of RNA-Seq samples, showing a gene signature shift from α- to β-cells. Each dot in (a) represents one donor. (c) Volcano plot representing DEGs between sorted α-cells and β-cells (FDR < 0.05, FC > 2). 887 α-cell-enriched genes and 587 β-cell-enriched genes were identified (Supplementary Table 10). (d-f) Volcano plots showing DEGs in: (d) αGFP pseudoislets relative to sorted α-cells, characterizing the cell aggregation effect, (e) αPM relative to αGFP pseudoislets, reflecting the effect of PM overexpression, and (f) αPM pseudoislets relative to sorted α-cells, reflecting the combined effect of reaggregation and PM overexpression. Upregulated DEGs in each condition (colored squares in d-f) were overlapped with β-cell-enriched genes from c, as a measure of β-cell trait acquisition. The Venn diagrams show that 128 “β-like genes” were upregulated in α-cells upon aggregation (d), 115 genes upon PM activation (e), and 268 “β-like genes” by the combined effect of aggregation and PM activation (f). Subsequent proteomic analyses validated many of the identified genes, which were also expressed at the protein level: 16 out of the 128 proteins in d, 18 of 115 in e, and 31 of 268 in f. (g) Gene-set enrichment analysis (GSEA) of αPM pseudoislets compared to sorted α-cells revealed an enhanced expression of β-like gene-sets and genes involved in regulating insulin secretion. (h) Quantitative proteomic analysis of “acquired β-cell signature proteins” in d-f. These proteins were more abundant in αPM than in αGFP pseudoislets. Proteins known to be important for β-cell function are highlighted in red. n=5 (sorted α), n=5 (sorted β), n=7 (αGFP), n=7 (αPM), n=6 (βGFP), n=5 (grafted αPM) in a-g. n=3 from 4 donors (αPM), n=2 from 4 donors (αGFP) in h. Data are mean ± SD.
To identify α-cell identity changes linked to β-cell phenotype acquisition, we focused on differentially-expressed genes (DEGs) between sorted α- and β-cells. 587 DEGs were more abundant in sorted β-cells compared to α-cells; we termed them “β-cell-related” genes (Fig. 3c, Supplementary Table 10) and measured how they were modulated in α-cells upon aggregation or Pdx1/MafA coexpression (“aggregation effect” and “PM effect”, respectively). Cell aggregation led to the upregulation in α-cells of 128 β-related genes (out of 587) (Fig. 3d; Supplementary Table 11), indicating that mere aggregation is sufficient to impose functional aspects of the β-cell signature. Some of the upregulated genes are crucial to β-cell function, such as: ABCC8 (SUR1), ENTPD3 28, SYT13 29 and UCHL1 30. Likewise, other gene-sets involved in β-cell function, such as mitochondrial metabolism genes, were upregulated, while stress/inflammatory signaling pathways were downregulated upon α-cell aggregation (Extended Data Fig. 8a–c).
To elucidate the Pdx1/MafA coexpression effect on α-cell reprogramming, we compared αGFP and αPM pseudoislets. 115 β-related genes were upregulated in αPM, comprising important functional β-cell markers like INS, MAFA (endogenous), PSCK1, ADCYAP131, PFKFB232, RBP133 and SIX334 (Fig. 3e, Supplementary Table 12). Lastly, we evaluated the overall effect of combined aggregation and PM effect by comparing αPM pseudoislets with sorted α-cells: in this comparison, 268 β-related genes were upregulated in αPM pseudoislets, including IAPP and GLP1R (Fig. 3f, Supplementary Table 13). Gene-sets such as “hallmark β-cells” and “regulation of insulin secretion” were also enriched (Fig. 3g, Extended Data Fig. 8d). Moreover, some α-cell-enriched genes were downregulated (Extended Data Fig. 8e–h, Supplementary Table 14–17), while others were enhanced. These contrasting changes in α-identity genes suggest the existence of a simultaneous ongoing refractory response to fate conversion 35 (Supplementary Table 18). Consistent with this, ARX expression remained invariable in reprogrammed α-cells, incidentally confirming that GSIS is compatible with ARX activity (Extended data Fig. 3d).
Global proteomic analyses confirmed that many of the upregulated “β-genes” were also upregulated as proteins. 33 β-cell-related proteins were detected in α-cells after aggregation, Pdx1/MafA coexpression, or both (Fig. 3d-f,h). Most (30/33) were more abundant in αPM pseudoislets than in αGFP pseudoislets. Several functional β-cell proteins were upregulated, such as INS, PCSK1, PFKFB2, RBP1, ADCYAP1, UCHL1, ABCC8, ENTPD3 and IAPP (Fig. 3h, Supplementary Table 19). Interestingly, the protein hierarchical clustering grouped αPM pseudoislets with βGFP pseudoislets, underscoring the phenotypic shift (Extended Data Fig. 8i).
We also performed RNA-Seq on 5 different αPM grafts harvested 1 month after transplantation (Supplementary Table 8). Compared to αPM pseudoislets before transplantation, β-cell markers such as IGF2, MEG3 and GLRA1 and pathways like “hormone synthesis”, “secretion” and “innervation” were further upregulated (Extended Data Fig. 8j; Supplementary Table 20). These observations are compatible with the immunofluorescence results, the highly functional phenotype following transplantation (Fig. 2b-h), and the sympathetic innervation of αPM pseudoislets (Extended Data Fig. 6o).
Combined, transcriptomic and proteomic analyses indicate that aggregation drives the upregulation of functional β-cell markers. Subsequent Pdx1/MafA expression further induces additional β-cell genes, leading to GSIS acquisition (Extended Data Fig. 8k).
From glucagon to insulin secretion
To dissect the reprogramming process at single-cell resolution, we performed single-cell RNA sequencing (scRNA-Seq; Extended Data Fig. 9a). We analysed αGFP, βGFP and αPM pseudoislets cultured for 1 week. T-distributed stochastic neighbor embedding (t-SNE) visualization showed the 3 distinct αGFP, αPM and βGFP cell populations (Fig. 4a). Most cells in the αPM cluster were INS/GCG bihormonal, with little heterogeneity (Extended Data Fig. 9b).
Figure 4. scRNA-Seq analysis of insulin-producing human α-cells.
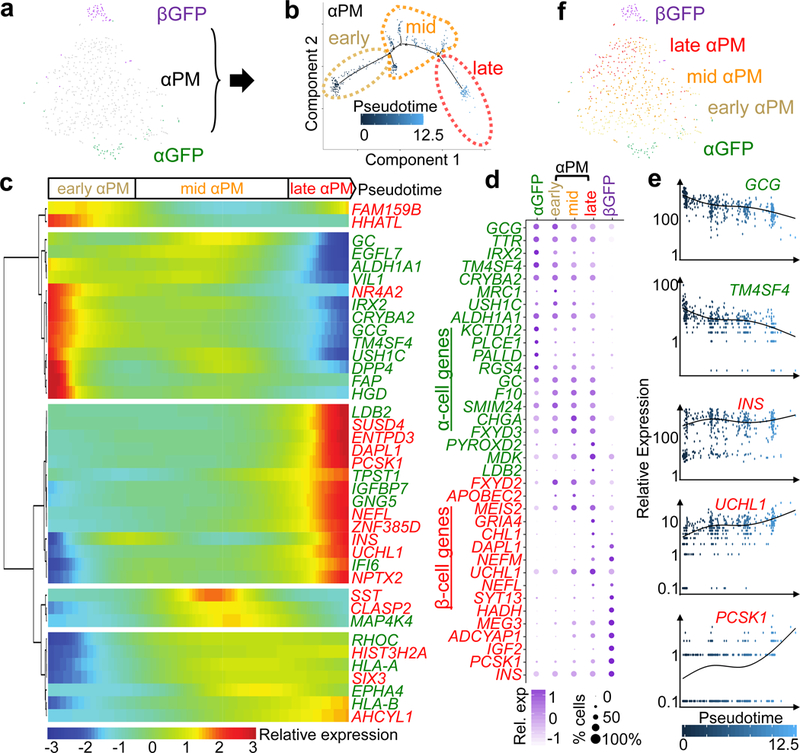
(a) t-SNE visualization of single-cell transcriptomes of pseudoislets; 47 αGFP, 434 αPM and 51 βGFP cells form 3 distinct clusters. (b) In silico pseudotime ordering of αPM cells (n=434) shows 3 different states along a main pseudotemporal trajectory: “early” (135 cells), “mid” (213 cells) and “late” (86 cells). Each dot represents one cell. Most αPM cells allocate along the main path from “early” to “late” based on reprogramming progression. (c) Clustering of differentially modulated genes by pseudotime progression of αPM cells shows distinct kinetics of gene responses to cell conversion: increase in expression of β-cell genes (‘pro-conversion’ genes) and increase in expression of α-cell genes (‘resistant’ genes). Only α-/β-related genes are shown. (d) Dot plot showing gene signature shifts among different pseudotime stages. (e) Gene expression kinetics along pseudotime progression of representative genes. Green: α-cell-related genes, red: β-cell-related genes (c-e). (f) Superimposition of pseudotime categories on t-SNE map reveals an early-to-late transition of αPM cells.
Using the pseudotemporal ordering 36 algorithm, we reconstructed the sequence of gene expression profiles and the evolution of each cell without prior knowledge of the genes defining progression (Extended Data Fig. 9a). We found one main path, with few minor branches, enabling the allocation of 3 pseudotime-dependent progression states for αPM cells: “early”, “mid” and “late” (Fig. 4b and Extended Data Fig. 9c,d).
β-cell-related genes were upregulated in “late” cells (INS, UCHL1 and PCSK1; Fig.4c-e), while many α-cell-related genes were downregulated (GCG and TM4SF4). Several of these genes were not previously detected by bulk RNA-Seq (e.g. β-cell genes like HIST3H2A, NEFL, NPTX2 and SUSD4, and the α-cell genes FAP, EGFL7 and USH1C). Some α-/β-cell-related genes were not modulated upon pseudotime progression (ARX; Extended Data Fig. 9g) while others changed in the opposite direction (NR4A2; Fig. 4c). This confirms the persistence of some resistance to reprogramming, which was also observed by bulk RNA-Seq and in mouse studies 35.
When superimposing pseudotime categories on cells in t-SNE mapping, we found a pseudotemporal transition along the α-to-β-cell progression (Fig. 4f). Collectively, this suggests that most α-cells in αPM pseudoislets engage as INS-expressers, without alternative cell-fate allocations. Therefore, human α-cells are suited to direct reprogramming.
Eventually, signaling pathway analyses also revealed changes in the different reprogramming stages: oxidative phosphorylation was more active in “late” than in “early” cells, and RICTOR was downregulated as an upstream regulator (Supplementary Table 21). Interestingly, opposite changes (i.e. impaired oxidative phosphorylation and activated RICTOR) have recently been linked to β-cell “dedifferentiation” during β-cell failure 37. This suggests that human reprogrammed α-cells are healthy and different from T2D-diseased β-cells.
Insulin-secreting α-cells are hypoimmunogenic
The hybrid character of human insulin-producing α-cells, with their curative properties when transplanted to diabetic mice yet maintaining a robust α-cell identity, led us to inquire whether they would be autoimmune targets in type 1 Diabetes (T1D). We performed cytotoxic T lymphocyte (CTL) killing assays using HLA-A2-restricted β-cell-specific CD8+ T-cell clones derived from patients with recent T1D onset 38,39 (Extended Data Fig. 10a). As target cells, βGFP, αGFP and αPM pseudoislets devoid of HM cells were generated from 7 different HLA-A2 haplotype donors (Supplementary Table 22). We validated the specificities and cytotoxic properties of effector cells (CTL clones) in each independent experiment (Extended Data Fig. 10b,c) and on β-cells obtained from βGFP pseudoislets. Preproinsulin (PPI)-directed CTLs killed βGFP cells 39, yet the stressed β-cell-specific anti-DRiP (defective ribosomal product) CTLs did not, implying that β-cells in pseudoislets are not ER-stressed and have no erroneous INS mRNA translation 38 (Fig. 5a). This contrasts with studies reporting that up to 40% β-cells from dispersed human islets are lysed by DRiP CTLs 38, and suggests that pseudoislets confer protection against ER-stress.
Figure 5: Immunogenicity tests on insulin-producing human α-cells.
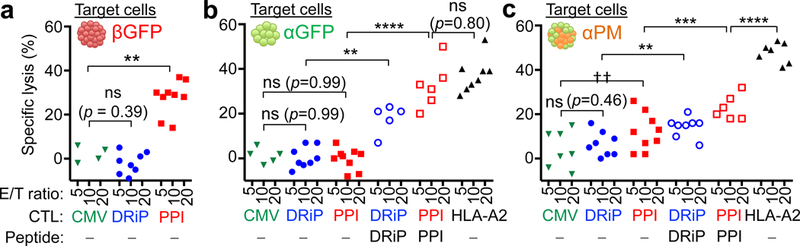
(a) Cytotoxic T lymphocyte (CTL) killing assay against β-cells from βGFP pseudoislets. Anti-PPI (preproinsulin) CTLs lyse β-cells, but not anti-DRiP CTLs. (c) Assay against α-cells (αGFP pseudoislets). αGFP cells are lysed by the alloreactive HLA-A2 CTLs, but not by β-cell-specific anti-PPI or anti-DRiP CTLs. When loaded with PPI or DRiP peptide epitopes, αGFP cells are lysed by the corresponding CTLs. (d) Assay against α-cells from αPM pseudoislets. A fraction of αPM cells are lysed by PPI-directed CTLs (due to their insulin production), but not by anti-DRiP CTLs recognizing stressed β-cells. αPM cells are lysed by anti-DRiP CTLs if pulsed with exogenous DRiP peptide. CMV: CMV-directed CTLs as negative controls, HLA-A2: alloreactive CTLs as positive controls. E/T: effector/target. Each dot represents an independent measurement from 3 independent experiments using in total 7 different donor samples. **p=0.0022 (a); **p=0.0078 (b); ***p=0.0007, **p=0.0076, †† p=0.0069(c); ****p<0.0001 (b,c); one-way ANOVA with Holm-Sidak’s multiple comparisons test. All data are mean ± s.e.m. Sample information in Supplementary Table 22.
Glucagon-producing α-cells were killed by the β-cell-specific CTLs anti-PPI and anti-DRiP only if loaded with their cognate PPI or DRiP peptide epitopes (Fig. 5b), which confirms CTLs’ specificity. Insulin-producing α-cells were sensitive to PPI-directed CTLs, similar to β-cells, but not to DRiP-specific T-cells (Fig. 5c), suggesting that αPM-cells are less stressed than dispersed β-cells38. When loaded with PPI or DRiP peptide epitopes, αPM-cells were more sensitive to the respective CTLs, but with lower death rates as compared to PPI-loaded αGFPs.
In conclusion, glucose-responsive insulin-secreting human reprogrammed α-cells display reduced immunogenicity for T1D autoreactive T-cells. Modified α-cells produce and process insulin, and present its leader/signal peptide on their surface, like native β-cells. The intrinsic β-cell processing steps are operative, but appear to be less prone to ER stress and translational errors than in native β-cells.
Discussion
Breakthroughs in islet cell biology have recently revealed that cell identity and maturity are flexible states. Here we provide conceptual evidence for human islet plasticity, given applicability concerns of mouse data to the clinic 40. It remains to be seen if diabetes therapies modulating islet cell-type interconversion without side-effects are possible through targeted delivery of TFs into islets, or pharmacologically. The streamlined culture system described here should allow the identification of a gene-set required to confer GSIS to islet non-β-cells, perhaps involving small-molecule screening like that adapted for β-like cells differentiated from human pluripotent-cells.
The human fetal β-cell line EndoC-βH1, hES-derived surrogate β-cells 41,42, and reprogrammed murine α-cells 13 are also hypoimmunogenic. Future studies should involve testing the immunogenicity of modified α-cells in humanized mice modeling responses toward islet grafts in vivo.
Here we did not analyze human δ-cells, but in addition to human α- and γ-cells, Pdx1/MafA also reprogram mouse δ-cells (not shown). Interestingly, Nkx6.1 seems dispensable for reprogramming, but might be required for deeper β-cell-like maturation 43. Combined, this islet non-β-cell plasticity leads to a strategic paradigm shift from an “α-cell-specific” to a broader “islet-specific” targeting approach in vivo. Notably, islet non-β-cells (i) are developmentally and epigenetically close to β-cells 8,44, (ii) occupy the same environmental niche, (iii) spontaneously engage in insulin production 6,7 more rapidly and efficiently than other cell-types 1–4,45, even under disease conditions (α-cells from T2D donors), (iv) are abundant in T1 and T2 diabetic patients, and also (v) a massive α-cell loss has no major physiological effect 26,46. For these reasons, islet non-β-cells are optimal targets for β-cell regeneration. The development of islet cell-type interconversion therapies will imply that insulin-producing cells are replenished without the need of remaining β-cells, ex vivo ES/iPS cell differentiation, or other invasive procedures.
Beyond diabetes, the adaptive cell identity changes are probably a feature of different cell types in many organs. Therefore, reconstitution of missing cell populations by fostering the innate in situ adaptive cell plasticity arises as a promising prospective to treat degenerative diseases.
Methods
Human samples.
All studies involving human samples were approved by ethical committee in University of Geneva. Human pancreatic islets were obtained from ECIT program (University Hospital of Geneva or Diabetes Research Institute in Milan) or the NIDDK-funded Integrated Islets Distribution Program (IIDP) at City of Hope. Subject details are described in Supplementary Table 1. The number of islets was determined by material availability, especially in T2D donor samples. Human umbilical vein endothelial cells (HUVECs) and human bone marrow–derived mesenchymal stem cells (MSCs) were purchased from Lonza (catalog number: C2519A, PT-2501) and cultured according to manufacturer’s instructions.
Isolation of human islet cell-types.
Dissociation of human islets and staining with cell-surface antibodies were described previously 8,20. Stained cells were sorted on a FACSAria2 (BD Biosciences) or Moflo Astrios (Beckman Coulter) system. Single viable islet cells were gated by forward scatter, side scatter and pulse-width parameters and by negative staining for DAPI (D1306, Invitrogen) or DRAQ7 (B25595, BD Biosciences) to remove doublets and dead cells.
Purity of sorted cells.
For evaluation of cell purity, sorted islet cell fractions were immunostained for insulin, glucagon, somatostatin, pancreatic polypeptide and ghrelin (see Supplementary Data 1–3). Stained cells were examined with a confocal microscope (Leica TCS SPE). Only batches with high purity (> 90%) were used to analyze in following experiments (see Extended Data Fig. 1b and Supplementary Table 2). Evaluation of purity was also performed by qPCR and RNA-seq. The purity (Extended Data Fig. 1b,c) was calculated by the method as previously reported 8.
Cell-labeling.
Adenoviral vectors were produced and purified as described 47. Sorted cells were transduced with adenoviral vectors encoding either GFP only, Pdx1-IRES-GFP, MafA-IRES-GFP, Nkx6.1-IRES-GFP or in combination at 37°C in 5% CO2 incubator for 12 hours. After 3-times wash, cells were resuspended in BN-medium: Advanced DMEM/F12 (12634–010) supplemented with penicillin/streptomycin, 10 mM HEPES, 2 mM GlutaMAX (35050–038), 1x B27 (17504044), 1x N2 (17502048, Life Technologies), 10 mM Nicotinamide (N0636), and 1 mM N-acetyl-L-cysteine (A9165, Sigma).
Reconstitution of pseudoislets.
For reaggregation into pseudoislets, labeled islet cells (α-/β-/γ-cells) were seeded on 96-well ultra-low adherent culture plates for 7 days (1,000 cells/well). Every other day culture medium was changed. For reaggregation with HUVECs/MSCs (HM), both 400 HUVECs and 100 MSCs were seeded per well together with 1,000 islet cells in mixed culture-medium: 50% BN-medium + 50% EGM-2 medium (CC-3162, Lonza) at 37°C in 5% CO2 incubator.
Morphometric analyses of pseudoislets.
Seven days after culture, aggregates were handpicked and their diameter was measured using Leica M205FA binocular equipped with a Leica DFC360FX camera.
Single islet cell culture.
Sorted islet cells were seeded at single-cell density on chamber-slide wells (Sigma) coated Matrigel (356231, Corning) and cultured in BN-medium at 37°C in 5% CO2 incubator, and then assayed as described below.
In vitro time-lapse imaging.
For live imaging of cultured cells, images of cultured cells in plate-wells were captured manually at indicated time-points using Nikon Eclipse TE300 microscope (Nikon).
Evaluation for transduction efficiency.
One or two weeks after reaggregation culture, pseudoislets were dissociated again into single cells using Accutase (A1110501, Life Technologies) and FACS-analyzed to count GFP+ cells. Doublets and dead cells were removed as mentioned above.
In vitro glucose-stimulated C-peptide secretion test.
Pseudoislets or size-matched native islets were handpicked for each assay replicate and washed by incubation for 30 min at 37°C in Krebs-Ringer Bicarbonate buffer (KRB) containing no glucose and then equilibrated by incubation for 1 hour at 37°C in basal KRB containing 3 mM glucose (Sigma). Samples were then transferred into fresh KRB containing 3 mM (Low) glucose for 1 hour followed by incubation for another hour in KRB containing 20 mM (Hi) glucose at 37°C. Medium was collected after 1-hour incubation at each glucose concentration and stored at −80°C for subsequent analyses. Human C-peptide concentration was quantified using human Ultrasensitive C-peptide ELISA kit (10–1141-01, Mercodia).
Total RNA extraction and quantitative RT-PCR.
For all samples, the total RNA was extracted using the Qiagen RNeasy Micro kit, and treated with RNase-free DNaseΙ (Qiagen). cDNA was synthesized using the QuantiTect RT kit (Qiagen). qPCR reactions and analyses were performed as described previously 6. Each individual sample was run in triplicate. Expression levels were normalized to RN18S, ACTB or GFP. Primer sequences are shown in Supplementary Table 23.
Streptozotocin-mediated diabetes model.
130 mg/kg Streptozotocin (S0130, Sigma) was administrated by intraperitoneal injection into male NSG mice (2–4-month-old). 7 days after injection, mice exhibiting hyperglycemia (> 20 mM) were used in subsequent experiments.
RIP-DTR mice.
5 ng/20g body weight diphtheria toxin (DT) (D0564, Sigma) was administrated by intraperitoneal single injection into male, and 3-times injections into female NSG RIP-DTR mice (2–4-month-old). 7–14 days after injection, mice exhibiting hyperglycemia (> 20 mM) were used in subsequent experiments.
Transplantations into the kidney.
Islet transplantations under the kidney capsule were performed as described 48. Pseudoislets or native islets were handpicked and mixed with Matrigel, and then transplanted under the capsule of kidney in immunodeficient NSG or NSG RIP-DTR mice, using a Leica M205FA stereomicroscope. The left kidney was selected in the transplantation of Exp. #1, #2, #4 and #5, but both sides of kidneys were used in transplantation of Exp. #3. Control non-grafted animals underwent sham-operations.
Glucose tolerance tests.
Mice were fasted for 16 hours before starting experiments. Intraperitoneal glucose tolerance test (ipGTT) was performed as described 6.
Nephrectomy.
For graft removal, the kidney with graft was ligated at the renal hilum using 3–0 silk (B. Braun), and then resected. Removed grafts were processed for analyses. Nephrectomy was also performed in control animals.
Anti-glucagon receptor antibody (GCGR-Ab) treatment.
As described previously 26, anti-GCGR monoclonal antibody A-9 was generated at Eli-Lilly and Company (Yan H, Hu S-FS, Boone TC, Lindberg RA, inventors; Amgen Inc., assignee. Compositions and methods relating to glucagon receptor antibodies. United States patent US 8158759 B2, 2012 Apr 17). It was delivered using a subcutaneous implanted osmotic pump (model 2002, Alzet) containing 3 mg/ml of anti-GCGR mAb in PBS for 2 weeks.
Immunofluorescence analyses.
Samples processes for immunofluorescence were performed as described previously 6. Frozen sections were cut at 10 μm-thick. Primary antibodies used were: guinea pig anti-porcine insulin (A0564, DAKO, 1:600), chicken anti-insulin (GW10064F, Sigma, 1:1000), mouse anti-glucagon (G2654, Sigma, 1:1000), rabbit anti-glucagon (A0565, DAKO, 1:600), rabbit anti-somatostatin (A0566, DAKO, 1:600), rabbit anti-pancreatic polypeptide (T-4088, PenLabs, 1:750), goat anti-ghrelin (sc-10368, SantaCruz, 1:200), rabbit anti-GFP (Life Technologies, 1:500), chicken anti-GFP (ab-13970, Abcam, 1:500), guinea pig anti-Pdx1 (gift from C. Wright, 1:1000), rabbit anti-MafA (A300–611A, Bethyl, 1:500), rabbit anti-Nkx6.1 (BCBC, 1:400), rabbit anti-pHH3 (06–570, Upstate, 1:500), rabbit anti-CD31 (ab28364, abcam, 1:50), rabbit anti-Vimentin (ab92547, abcam, 1:100), rabbit anti-Tyrosine hydroxylase (ab152, chemicon, 1:1000), guinea pig anti-ARX(AB2834, BCBC, 1:100), rabbit anti-Synaptophysin (A0010, DAKO, 1:50). Secondary antibodies were coupled to Alexa 405, 488, 568, 647 (Life Technologies), FITC, Cy3, Cy5 (Jackson Immunoresearch), or TRITC (Southern Biotech). Sections were counterstained with DAPI. All sections were examined with a confocal microscope (Leica TCS SPE). In Fig. 2i, confocal tile-scan images were merged as a maximum projection.
TUNEL staining.
TUNEL staining was performed to evaluate apoptosis using DeadEnd Fluorometric TUNEL System, according to manufacturer’s instructions (G3250, Promega).
Electron microscopy.
Small portion of engrafted islets were fixed with 2.5% glutaraldehyde and 4% paraformaldehyde in PBS, and processed as described 6. Morphometric analyses were performed using Philips/FEI Tecnai 20 transmission electron microscope.
Global transcriptomics analysis.
Preparation of libraries, RNA sequencing and the quality controls were performed within the Genomics Core Facility of the University of Geneva. In brief, extracted RNA samples were assessed for the quality by Agilent bioanalyzer prior to library generation. Reverse transcription and cDNA amplification were performed using the SMARTer Ultra Low RNA kit (Clontech). cDNA libraries were prepared using Nextera XT DNA Sample Preparation kit (Illumina), multiplexed and sequenced on an Illumina HiSeq4000 platform with single-end 110-bp reads. The sequencing quality control was done with FASTQC v.0.11.2, followed by sequence alignment to the human reference genome (hg38) using the TopHat v2.0.13 (default parameters). Biological quality control and summarization were done with the PicardTools v1.80. Finally, 13 million reads per samples in average were used for differential expression analysis.
Transcriptomic data analyses:
The normalization and differential expression analysis was performed with the R/Bioconductor package TCC v.1.16.0 using DEG elimination strategy 49. DEGs between sorted α- and β-cells were selected (FC>2 FDR<0.05) and their expression levels in the different other comparisons was considered for further analyses. PCA sample correlation analysis was performed with the 1,000 most variable genes. The Pearson correlation coefficients were calculated for log2 transformed ratios. The output data are displayed graphically as either a PCA-plot, heatmap, dendrogram, volcano-plots or Venn diagrams.
Pathway analysis:
The pathway analyses were performed with gene set enrichment analysis (GSEA, http://software.broadinstitute.org/gsea/index.jsp) or Ingenuity Pathway Analysis (IPA®, QIAGEN Redwood City, www.qiagen.com/ingenuity). Gene sets with significant enrichment in GSEA were identified among C1, C2 or C5 of Molecular Signatures Database v6.0; “HALLMARK PANCREAS BETA CELL” (http://software.broadinstitute.org/gsea/msigdb/cards/HALLMARK_PANCREAS_BETA_CELLS.html) and “REACTOME REGULATION OF INSULIN SECRETION” (www.reactome.org/content/detail/422356) in Figure 4, “GO OXIDATIVE PHOSHPRYLATION”(GO:0006119) and “GO RESPIRATORY CHAIN” (GO:0070469) in Extended Data Fig. 8a,b. IPA were performed with the following settings: Expression Value Type (Exp Log Ration), Reference set (Ingenuity Knowledge Base), Relationships to consider (Direct and Indirect Relationships), Interaction networks (70 molecules/network; 25 networks/analysis or 30 molecules/network; 25 or 10 network/analysis), Data Source (all), Confidence (Experimentally Observed), Species (Human, Mouse, Rat), Tissue & Cell Lines (all), Mutations (all).
Global proteomics analysis
Cell lysis and protein digestion:
Cells were washed in DPBS and lysed in buffer containing 4% SDS, and boiled at 95°C for 7 min on a shaker, and sonicated (three rounds a 30 sec, 30% power). The protein concentration was determined using a BCA protein assay kit. Samples were pooled (Supplementary Table 12), and dry aliquots containing an estimated amount of 50 μg of proteins were further processed using Filter-Aided Sample Preparation50, and desalted using C18 Oasis™ Elution plates (Waters, Milford, MA).
Tandem Mass Tag (TMT) 11-plex labelling:
TMT reagents were re-suspended in ACN. Desalted peptides were re-suspended in 50 μL of 200 mM EPPS pH 8.5, 15 μL of ACN, and 5 μL of the TMT reagents were added to the respective peptide samples, gently vortexed, and incubated for 1.5 h at RT. To prevent unwanted labelling, the reaction was quenched by adding 5 μL of 5% hydroxylamine and incubated for 15 min at RT. Equal amounts of the TMT-labelled samples were combined and concentrated to near dryness, followed by desalting via C18 solid phase extraction and passage over a Pierce detergent removal spin column (Thermo Fisher Scientific).
Off-line basic pH reversed phase fractionation:
The combined labelled peptide samples were pre-fractionated by basic pH reversed phase HPLC as described previously51, using an Agilent (P/N 770995–902) 300Extend-C18, 5 μm, 250 mm x 4.6 mm id column, connected to an Agilent Technology off-line LC-system. Solvent A was 5% ACN, 10 mM NH4HCO3 pH8, and solvent B was 90% ACN, NH4HCO3 pH 8. The samples were re-suspended in 500 μL solvent A and loaded onto the column. Column flow was set to 0.8 mL/min and the gradient length was 70 min, as follows: from 0–35 min solvent 50% A/ 50% B, and from 35–50 min 100% B, and from 50–70 min 100% A. The labelled peptides were fractionated into 96 fractions, and further combined into a total of 12 fractions. Each fraction was acidified with 1% formic acid, concentrated by vacuum centrifugation to near dryness, and desalted by StageTip. Each fraction was dissolved in 5% ACN/ 5% formic acid for LC-MS/MS analysis.
LC-MS3 analysis:
From each of the 12 fractions, ∼3 μg was dissolved in 1% aqueous formic acid (FA) prior to LC-MS/MS analysis on an Orbitrap Fusion mass spectrometer (Thermo Fisher Scientific, San Jose, CA) coupled to a Proxeon EASY-nLC 1000 liquid chromatography (LC) pump (Thermo Fisher Scientific). Peptides were fractionated on a 75-μm inner diameter microcapillary column packed with ∼35 cm of Accucore resin (2.6 μm, 150 Å, Thermo Fisher Scientific, San Jose, CA). For each analysis, we loaded ~1 μg onto the column. Peptides were separated using a 2.5 hr gradient of 2 to 25% ACN in 0.125% formic acid at a flow rate of ∼350 nL/min. Each analysis used the multi-notch MS3-based TMT method52 on an Orbitrap Fusion mass spectrometer, which has been shown to reduce ion interference compared to MS2 quantification53. The scan sequence began with an MS1 spectrum (Orbitrap analysis; resolution 120,000; mass range 400−1400 m/z; automatic gain control (AGC) target 5 × 10⁵; maximum injection time 100 ms). Precursors for MS2/MS3 analysis were selected using a Top10 method. MS2 analysis consisted of collision-induced dissociation (quadrupole ion trap analysis; AGC 2 × 10⁴; normalized collision energy (NCE) 35; maximum injection time 200 ms). Following acquisition of each MS2 spectrum, we collected an MS3 spectrum using our recently described method52 in which multiple MS2 fragment ions were captured in the MS3 precursor population using isolation waveforms with multiple frequency notches. MS3 precursors were fragmented by high-energy collision-induced dissociation (HCD) and analysed using the Orbitrap (NCE 65; AGC 2 × 10⁵; maximum injection time 300 ms, resolution was 50,000 at 400 Th).
Protein analysis:
Mass spectra were processed using a Sequest-based in-house software pipeline54, and spectra were converted to mzXML using a modified version of ReAdW.exe. Database searching included all entries from the human uniprot database (March 11, 2014). This database was concatenated with one composed of all protein sequences in the reversed order. Searches were performed using a 50 ppm precursor ion tolerance for total protein level analysis. The product ion tolerance was set to 0.9 Da. These wide mass tolerance windows were chosen to maximize sensitivity in conjunction with Sequest searches and linear discriminant analysis54,55. TMT tags on lysine residues and peptide N termini (+229.163 Da) and carbamidomethylation of cysteine residues (+57.021 Da) were set as static modifications, while oxidation of methionine residues (+15.995 Da) was set as a variable modification.
Peptide-spectrum matches (PSMs) were adjusted to a 1% false discovery rate (FDR)56,57. PSM filtering was performed using a linear discriminant analysis, as described previously54, while considering the following parameters: XCorr, ΔCn, missed cleavages, peptide length, charge state, and precursor mass accuracy. For TMT-based reporter ion quantitation, we extracted the summed signal-to-noise (S/N) ratio for each TMT channel and found the closest matching centroid to the expected mass of the TMT reporter ion.
The search space for each reporter ion was limited to a range of 0.003 Th to prevent overlap between the isobaric reporter ions. For protein-level comparisons, PSMs were identified, quantified, and collapsed to a 1% peptide FDR and then collapsed further to a final protein-level FDR of 1%. Moreover, protein assembly was guided by principles of parsimony to produce the smallest set of proteins necessary to account for all observed peptides.
Proteins were quantified by summing reporter ion counts across all matching PSMs using in-house software, as described previously54. PSMs with poor quality, MS3 spectra with more than eight TMT reporter ion channels missing, MS3 spectra with TMT reporter summed signal-to-noise ratio that is less than 100, or no MS3 spectra were excluded from quantitation58. Protein quantitation values were exported for further analysis in Microsoft Excel. Each reporter ion channel was summed across all quantified proteins and normalized assuming equal protein loading of all 11 samples.
Proteomic data analysis:
Quantitative analyses of protein expression was performed based on normalized TMT ratios.
Single-cell RNA-Seq.
Pseudoislets of αGFP, αPM and βGFP cultured for 1 week were dissociated into single-cells, and single, viable and GFP+ cells were sorted on a Moflo Astrios (Beckman Coulter) system. Sorted single-cells from αGFP, αPM and βGFP were loaded as separated samples for single-cell RNA-seq using the Chromium Controller (10xGenomics) and the Single Cell 3′ Library Kit v2 (PN-120236, PN-120237, PN-120262) according to the manufacturer’s protocol. Amplified cDNA and subsequent libraries were assessed for quantity and quality on an Agilent 2100 Bioanalyzer (Agilent Technologies). Libraries were sequenced as 100-bp paired-end reads on a HiSeq 4000 platform (Ilumina). The Cell Ranger software pipeline (ver.2.1, 10xGenomics) was used to demultiplex cellular barcodes, map reads to the transcriptome using the STAR aligner to produce a sparse cell/gene matrix.
Further analyses were performed using the R package Seurat (ver.2.3.2) 59. As QC steps, cells were used for analysis if they passed a total count threshold of 5,000 (αGFP), 10,000 (βGFP) or 12,000 (αPM) counts, an expressed genes threshold of 2,000 genes and had a lower percentage of mitochondrial counts than 18% (αPM and βGFP) or 20% (αGFP). Finally, cells were removed that expressed more than 100 counts of PPY. Genes were kept if they were expressed with at least 4 counts in at least 2 cells. After applying these QC criteria, 532 single cells and 5,092 genes in total remained and were included in downstream analyses. Differential expression analysis was performed using the MAST test.
To perform pseudotime analysis of αPM cells, we used Monocle2 60. Sparse matrix files were imported directly into Monocle using the R package cellrangerRkit, and QC steps were also performed in Monocle to remove low-quality cells and genes: cells were kept if they had at least 13,500 counts and 3,000 genes. Cells were removed if they expressed more than 250 counts PPY. Genes were kept if they were expressed. To generate pseudotime trajectories, the ‘DDRTree’ reduction method was used in Monocle2 with the default parameters. Cells ordered in the pseudotime created 10 distinct states (Extended Data Fig. 9). Cells belonging to state 1 were designated as “early αPM”, cells belonging to state 9 were designated as “late αPM” and all other cells were designated as “mid αPM”. Cellular identities belonging to each state were recovered from Monocle and “early αPM”, “mid αPM” and “late αPM” states were added to the corresponding cells as metadata in Seurat. Differential expression between states, αGFP and βGFP were calculated in Seurat.
Immunogenicity tests.
Human islets from non-diabetic donors with matching HLA-A2 haplotype were obtained from ECIT or IIDP (see Supplementary Tables 1, 2 and 22). FACS-sorting, transduction and reaggregation were performed as mentioned above. Monotypic pseudoislets were harvested 1–2 weeks after aggregation in Geneva. Then we brought the pseudoislets to LUMC in Netherland to perform the CTL killing assay, as previously described 38,39. Briefly, after dispersion with Accutase, pseudoislet cells were labeled with 51Cr and then cocultured with the following specific CTL clones: CMVpp65 (“CMV”, a T-cell clone recognizing cytomegalovirus-specific antigen as negative control), alloreactive T-cell clone JS132 (“HLA-A2”, as positive control), INS-DRiP1–9 (“DRiP”, a T-cell clone killing stressed β-cells producing INS-DRiP1–9 peptide, a defective ribosomal product derived from aberrant insulin transcript translation38) or PPI15–24 (“PPI”, a T-cell clone that kills β-cells presenting preproinsulin signal peptide15–24 in physiologic conditions. This unconventionally processed β-cell epitope is more prominently presented in hyperglycemic conditions and T1D patients 39). Target cell lysis was determined by measuring 51Cr release with γ-counter. The specificities and cytotoxic properties of CTL clones were evaluated in each independent experiment (Extended Data Fig. 10). In some control conditions, islet cells were loaded with either INS-DRiP1–9 (DRiP) or preproinsulin (PPI) peptide epitopes.
Animal experiments.
NOD.Cg-PrkdcscidII2rgtm1Wj/SzJ (abbreviated as NSG) mice were obtained from Charles River. NSG RIP-DTR mice were generated in the Jackson Laboratory by backcrossing the RIP-DTR allele from B6-background animals (Hprttm1(Ins2-HBEGF)Herr)6. All mice were treated in accordance with the guidelines and regulation of the Direction Générale de la Santé, state of Geneva (license number GE/103/14).
Statistical analyses.
No statistical methods were used to predetermine sample size. The experiments were not randomized and the investigators were not blinded to allocation during experiments and outcome assessment. All statistical analyses were performed using GraphPad Prism 7 software. All error bars in figures represent standard error of mean (s.e.m.) or standard deviation (SD) as indicated in the legends. p-values and statistical methods were described in figure legends. The number of samples in this study was limited by the availability of human donor samples, especially T2D donors. The Healthy NSG mice used in Extended Data Fig. 5 were of both genders, but only male NSG mice were used in STZ-diabetic model in Extended Data Fig. 6–8.
Extended Data
Extended Data Fig. 1. Sorted islet cell-types are highly pure and efficiently labeled.
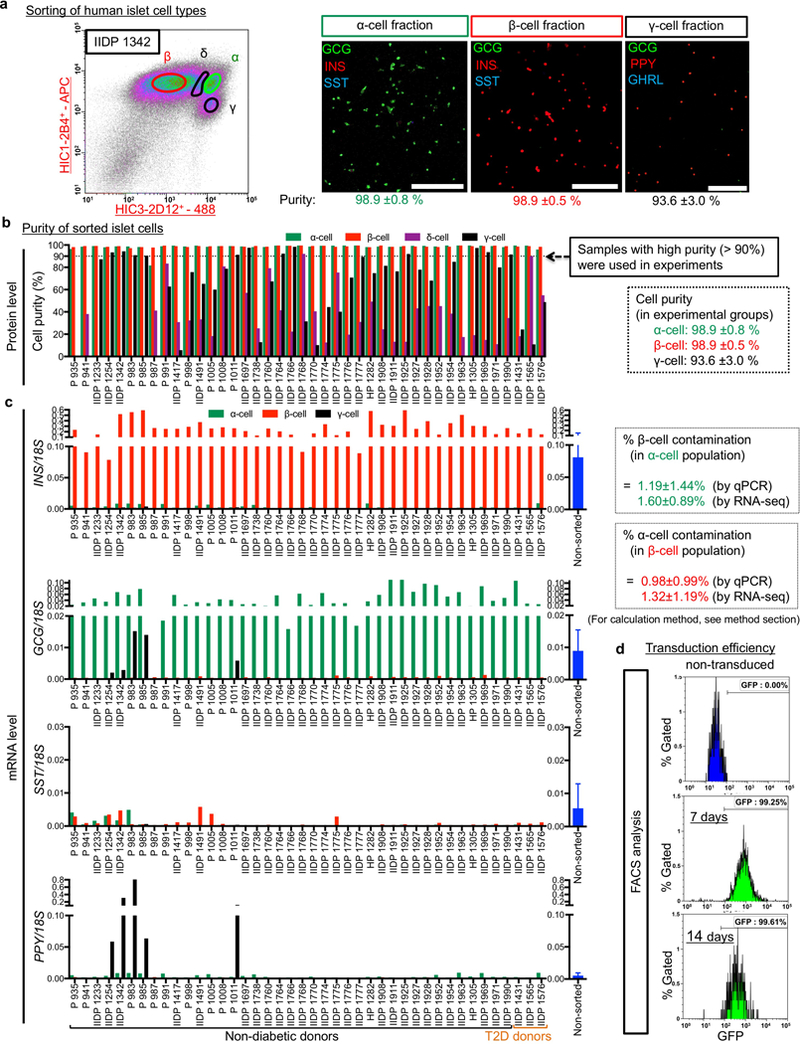
(a) Human islets were dissociated into single cells and antibody-labeled for FACS-sorting. Representative FACS plots illustrating cells labeled with pan-endocrine marker HIC1–2B4 and non-β endocrine marker HIC3–2D12 8,20. Sorted islet cell-fractions were immunostained for insulin (INS), glucagon (GCG), somatostatin (SST), PP (PPY) and ghrelin (GHRL), and counted. All sorted cells were mono-hormonal. Other staining data with higher magnification or tile scanning are shown in Supplementary Data 1–3. Scale bars: 250 μm. All FACS results (n = 42 different donors) are also summarized in Supplementary Table 2. (b) Sorting results showing cell purity of islet cell types. Purity of α-cells and β-cells in most islet preparations displayed a 99% purity (98.9±0.8% and 98.9±0.5%, respectively), but PPY+ γ-cells showed great batch-to-batch variability (up to 98% purity), with α- or ghrelin+ ε-cell contamination, but without β-cells (less than 0.5%). Only sorted cells with high purity (> 99% for α/β cells and > 90% for γ-cells) were used in experiments. (c) qPCR of hormonal expression (INS, GCG, SST, PPY) in all sorted fractions (α-, β-, γ-cells) that were used for experiments. qPCR of INS in sorted α-cells shows very rare contamination of β-cells, which is consistent with estimated purity calculated by previously published method 8. (d) Sorted α-cells were transduced with Ad-GFP, reaggregated into pseudoislets and cultured for 7 or 14 days. To evaluate transduction efficiency, pseudoislets were dissociated again into single cells and FACS-analyzed. More than 99% α-cells expressed GFP, while non-transduced α-cells did not. FACS plots are representative from 3 independent donor samples. All values of % purity or contamination (a-c) are mean ± SD. n = 41 donors for α-cells, n = 42 donors for β-cells and n = 5 donors for γ-cells. For details, see Supplementary Table 2.
Extended Data Fig. 2. Reaggregation of dispersed purified human β-cells.
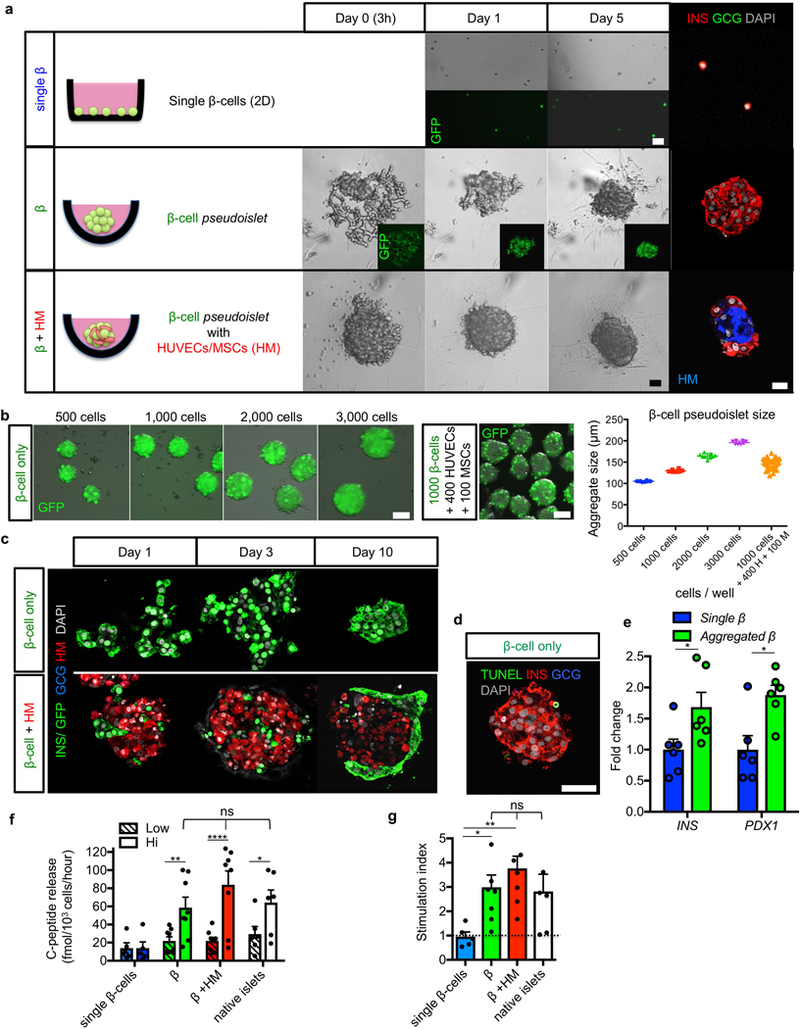
(a) Pure β-cells were labeled with GFP and traced in 3 different culture conditions: in monolayer (“single β”), β-cell-only aggregation (“β”), or β-cell aggregation with stromal cells including HUVECs and MSCs (“β+HM”). Live imaging at indicated days (middle panels) and immunofluorescence at day 7 (right panels) show β-cell-only pseudoislets were self-organized by Day 5, whereas β+HM aggregates were constituted in only 1 day. β-cells in β+HM pseudoislets located at the periphery, while HM cells formed the core of the aggregates (red and blue, respectively). (b) To determine the optimal number of β-cells per pseudoislet, GFP+ transduced β-cells were seeded on aggregation-plate-wells at the indicated densities. 7 days after culture, aggregates were harvested and analyzed. Aggregates were uniform in size. Pseudoislet size correlated with the number of cells seeded per well. It was reported that human islet cell aggregates with a diameter 100—150 μm, consisting of 1000 cells, show a comparable function to native islets 24; we thus decided to perform reaggregation experiments at 1000 β-cells/pseudoislet (1000 β-cells, 129.6±3.1 μm). β-cell aggregates with HM were also analyzed. n = 8 pseudoislets for 500 β-cells, n = 8 pseudoislets for 1000 β-cells, n = 9 pseudoislets for 2000 β-cells, n = 8 pseudoislets for 3000 β-cells, and n = 52 pseudoislets for 1000 β-cells + 400 HUVECs + 100 MSCs. (c) Immunofluorescence at indicated time-points in β-cell pseudoislets and β-cell+HM pseudoislets. (d) TUNEL staining (green) showed rare apoptotic cells (0.8%) in β-cell aggregates after 7 day-culture. (e) qPCR analyses of INSULIN and PDX1 expression in monolayer and aggregated β-cells showing higher expression of β-cell markers in reaggregated β-cells. Data are expressed as fold-change relative to the value in single β-cells. *p = 0.022 in qPCR for INS, * p = 0.026 in qPCR for PDX1, Mann-Whitney test, two-tailed. n = 6 donor samples. (f) ELISA measurements of static glucose-stimulated human insulin release at 3 mM (Low) and 20 mM (Hi) glucose showing glucose-responsive C-peptide secretion in both β and β+HM aggregates, but not in single β-cells. ****p < 0.0001, **p = 0.0037, * p = 0.012, two-way RM ANOVA with Holm-Sidak’s multiple comparisons test, n = 5 for single β-cells, n =8 for β and β+HM, n = 6 for native islets (all are biological replications from different donors). (g) Stimulation index in glucose-stimulated insulin secretion in (f) exhibiting comparable values among pseudoislets of β and β+HM and native islets. **p = 0.0089, *p = 0.045, one-way ANOVA with Benjamini, Krieger and Yekutieli’s multiple comparisons test. All images are representative from 5 (a,c,d) or 3 (b) independent experiments. ns: no statistical significance. All data shown are means ± s.e.m. Scale bars: 25 μm (a), 50 μm (c,d), 100 μm (b).
Extended Data Fig. 3. Assessment of the effect of transcription factor expression on insulin production in human α-cells.
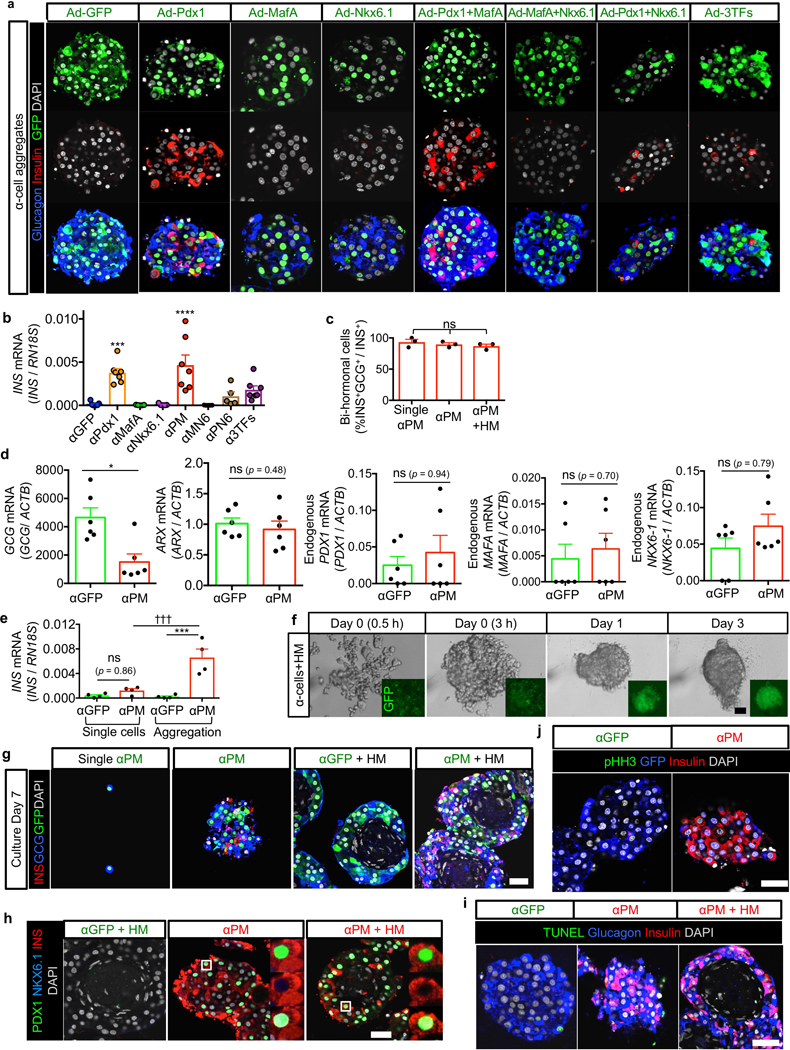
(a) Representative immunofluorescence images at 7 days of reaggregation. To determine the best α-to-β-cell reprogramming factors, human α-cells were transduced with adenoviral vectors, including Pdx1, MafA and Nkx6.1, in all combinations, and then reaggregated. Images are representative from n = 38 donors for αGFP and αPM, n = 5 for αPdx1 and α3TFs, n = 3 for αMafA, αNkx6.1, αMN6 and αPN6. (b) qPCR analysis of human insulin expression in α-cells transduced with indicated reprogramming factors, 7 days after aggregation. PM: Pdx1+MafA, MN6: MafA+Nkx6.1, PN6: Pdx1+Nkx6.1, 3TFs: Pdx1+MafA+Nkx6.1. ****p < 0.0001, ***p = 0.0006 versus αGFP control, one-way ANOVA with Tukey’s multiple comparisons test. n = 7 for αGFP, αPdx1, αPM and α3TFs, n = 5 for αMafA, αNkx6.1, αMN6, αPN6: all are biological replications from different donors. (c) Percentages of bihormonal cells (expressing insulin and glucagon) in αPM single cells, αPM-only pseudoislets and αPM+HM pseudoislets. One-way ANOVA with Tukey’s multiple comparisons, n = 3 from different donors. (d) qPCR analyses in αGFP and αPM pseudoislets cultured for 7 days. αPM cells have less glucagon expression than αGFP pseudoislets, but ARX expression is still maintained. *p = 0.015, Mann-Whitney test, two-tailed, n = 6 from different donors per group. (e) qPCR analysis for insulin expression in αGFP and αPM cells cultured in monolayer or pseudoislets. αPM single cells have less insulin expression than αPM pseudoislets; αGFP controls display only background levels. ***p = 0.0002, †††p = 0.0009, one-way ANOVA with Tukey’s multiple comparisons test, n = 4 from different donors. (f) Live-imaging of in vitro pseudoislet formation using αPM and HM cells. Aggregation is faster with HM cells. (g) Single α-cells transduced with PM show very rare reprogramming events (i.e. insulin production), whilst re-aggregated α-cells display high reprogramming efficiency. α-cells (GFP+, green) locate at the periphery of pseudoislets containing also HM cells (HUVECs/MSCs: only DAPI+, white). (h) Immunofluorescence for PDX1, NKX6–1 and insulin on αGFP, αPM and αPM+HM pseudoislets after 7 days of culture. Reprogrammed α-cells express insulin (red) and PDX1 (green), but not NKX6–1 (blue) in αPM and αPM+HM aggregates. (i) TUNEL staining (green) reveal almost no apoptosis in α-cell pseudoislets in 7-day cultures (1.8% in αGFP, 1.4% in αPM, 1.6% in αPM+HM). (j) Proliferation marker pHH3 staining (green) reveal almost no proliferation (< 1%) both in αGFP and αPM pseudoislets after 7-day cultures. Images are representative from 3 different donors (f-i). ns: no significance. All data shown are means ± s.e.m. Scale bars: 25 μm.
Extended Data Fig. 4. γ-cell reprogramming and in vitro kinetics of cell number and gene expression levels in pseudoislets.
(a) Live imaging during reaggregation into pseudoislets of GFP-transduced γ-cells. Like for α-cell pseudoislets (Fig. 1), sorted γ-cells were transduced with adenoviral vectors, and then seeded on reaggregation plates. (b) Reprogramming efficiency into insulin expression (b, % of insulin+ cells out of GFP+ cells). Seven days after aggregation, γ-cells transduced with the indicated reprogramming factors show the highest reprogramming incidence (PM combination). ****p < 0.0001, *p = 0.046 vs γGFP control; †††p = 0.0008 versus γPM, one-way ANOVA with Tukey’s multiple comparisons test. n = 3 from different donors. (c) qPCR analysis of human insulin gene expression in α-cell pseudoislets. Seven days after aggregation, γ-cells transduced with the indicated reprogramming factors show the highest reprogramming incidence (PM combination). ***p = 0.0009 vs γGFP control, one-way ANOVA with Tukey’s multiple comparisons test. n = 3 from different donors. Data are mean ± s.e.m. (d) Immunofluorescence of γGFP and γPM pseudoislets after 7 days in culture. Most insulin-expressing reprogrammed γ-cells maintain PPY expression (blue in inset). (e) Live imaging of aggregated transduced γ-cells. γPM+HM pseudoislets form faster than γ-cell-only pseudoislets (a). Scale bar: 25 μm. (f, g) Control γ-cells in γGFP+HM pseudoislets do not reprogram (insulin production) (< 1%; left panel in f), yet PM-transduced γ-cells become insulin-producers in γPM+HM pseudoislets (right panel in f). The architecture of γPM+HM pseudoislets is similar that of αPM+HM pseudoislets; however, γ-cell reprogramming efficiency in γPM+HM clusters is lower than in γPM-only pseudoislets (g). *p = 0.029, Mann-Whitney test, two-tailed. n = 4 from different donors. Data are mean ± s.e.m. Scale bars: 25 μm. (h) Glucose-stimulated insulin secretion: γ-cells in γPM-only pseudoislets efficiently secrete insulin in response to glucose stimulation in vitro, but not γGFP pseudoislets. Interestingly, they secrete insulin better than α-cells in αPM+HM pseudoislets (1.24 fmol/103 cells vs 0.27 fmol/103 cells for converted α-cells; h and Fig. 1f). ns (not significant): p = 0.82, **p = 0.0043, two-way RM ANOVA with Holm-Sidak’s multiple comparisons test. n = 3 donor samples. All data shown are means ± s.e.m. Scale bars: 25 μm. All images are representative of 3 (a,e) or 4 (d,f) independent experiments. (i) DNA content was measured by Pico-green tests to assess cell number kinetics in pseudoislets in vitro. Cell numbers dropped mainly between 1 and 2 weeks in α- and β-cell pseudoislets. n = 3 from different donors. Data are mean ± SD. (j) Expression levels of INSULIN and adenoviral vector mouse Pdx1 and MafA were also evaluated by qPCR at indicated time-points. Surprisingly, insulin expression levels were increased with time. Exogenous adenoviral Pdx1 and MafA expression levels were also maintained for 8 weeks in vitro. n = 3 from different donors. Data are mean ± SD.
Extended Data Fig. 5. αPM+HM pseudoislets secrete human insulin upon glucose stimulation in healthy NSG host mice.
(a) αPM+HM pseudoislets generated from non-diabetic donor samples were transplanted under the kidney capsule of non-diabetic NSG mice. (b) Four weeks after transplantation, in vivo glucose-stimulation tests were performed. Circulating human C-peptide levels are higher after glucose injection compared to before the injection. *p = 0.031, Mann-Whitney test, two-tailed. n = 10 from 6 different donors. (c) Immunostaining picture of control αGFP+HM grafts 4 weeks after transplantation under the kidney capsule of host NSG mice; there is almost no reprogramming into insulin production (< 1%). (d—g) αPM+HM grafts show vascular formation around the grafts and retain abundant GFP-labeled insulin-expressing cells two weeks (d) and 4 weeks (e) after transplantation. Interestingly, αPM+HM grafts display increased reprogramming efficiency (% of insulin+ cells out of GFP+ cells; e, f) and fractions of monohormonal INS+ cell (4 weeks after transplantation; e, g). *p = 0.029, Mann-Whitney test, two-tailed. n = 4 from different donors. All data shown are means ± s.e.m. Scale bars: 25 μm. All images are representative from 6 (a), 3 (c), 2 (d) or 4 (e) different donors.
Extended Data Fig. 6. Small number of human α-cell pseudoislets is sufficient to ameliorate diabetes in mice.
(a) Experimental time-line of Exp. #2. NSG mice were made diabetic with STZ and a week later were transplanted with 200–1000 αPM+HM pseudoislets (“STZ αPM+HM”) obtained from 3 donors (n = 3). As controls, STZ-diabetic mice were implanted with either no graft (“STZ no graft”) or the same number of native human islets (“STZ islets”). Non-diabetic NSG control mice were also monitored. Nephrectomy (“Nx”) was performed 4 weeks after transplantation for graft removal. For details, see Supplementary Table 5. (b) Random-fed blood glucose throughout Exp. #2. There is no significant improvement of hyperglycemia in STZ αPM mice (see Extended Data Fig. 6a for the areas under the curves of the engraftment period). n = 3 mice grafted with 3 different donors in all groups. (c) Body weight changes after STZ injection. There is body weight gain after transplantation with intact islets or αPM pseudoislets, and continuous weight loss in untransplanted diabetic controls (see Extended Data Fig. 6b for the areas under the curves of the engraftment period). Graft removal breaks this trend. n = 3 mice grafted with 3 different donors in all groups. (d) The “area under the curve” of random-fed blood glucose measurements during the engraftment period (indicated in yellow in b) show significant hyperglycemia improvement (lowering) only in mice engrafted with native islets. *p = 0.022, one-way RM ANOVA with Holm-Sidak’s multiple comparisons test. n = 3 different donors. (e) The area under the curve of body weight changes during engraftment (indicated in yellow in c) show significant body weight gain after transplantation with intact islets (“STZ islets” group) and αPM+HM pseudoislets (“STZ αPM” group). ****p < 0.0001, **p = 0.003, *p = 0.042, one-way RM ANOVA with Holm-Sidak’s multiple comparisons test. n = 3 different donors. (f, g) Glucose tolerance test at 4 weeks after transplantation (f) and after graft removal (g). Engrafted mice display recovery after 3 hours (f), yet this capacity is lost upon graft removal (g). Analysis of the area under the curve in f and g are shown in Extended Data Fig. 6h. ****p < 0.0001, ***p = 0.0007, ###p = 0.0009, versus STZ no graft, two-way RM ANOVA with Dunnett’s multiple comparisons test. n = 3 mice grafted from different donors (STZ αPM, STZ islets), n = 7 mice (STZ no graft), n = 6 mice (no STZ no graft). (h) Area under the curve of ipGTT at 4 weeks after transplantation (see also f) and 2 weeks after graft removal (see also g). There is partial STZ-diabetes recovery in “STZ αPM” mice, but not in “STZ no graft” group (left in h). After graft removal, both “STZ islets” and “STZ αPM“ groups become hyperglycemic again (right in h), proving that improvement in glucose tolerance and weight gain is graft-dependent. ****p = 0.00007, **p = 0.0025, ####p = 0.00002, ##p = 0.0014, one-way ANOVA with Benjamini, Krieger and Yekutieli’s multiple comparisons test. n = 3 mice grafted from different donors (STZ αPM, STZ islets), n = 7 mice (STZ no graft), n = 6 mice (no STZ no graft). (i) Blood human C-peptide levels in mice measured before (“0 min”) and after (“15 min”) glucose injection. Glucose-responsive C-peptide release is observed in mice bearing human islets or αPM pseudoislets. n.d., undetectable. **p = 0.0015, ****p = 5 × 10⁻⁸, two-way RM ANOVA with Holm-Sidak’s multiple comparisons test. n = 3 mice grafted from different donors (STZ αPM, STZ islets), n = 7 mice (STZ no graft), n = 6 mice (no STZ no graft). (j) Immunofluorescence of pancreas in the NSG RIP-DTR mouse that was transplanted with αPM pseudoislets (Exp.#3: DT+αPM, Figure 3b) shows that endogenous mouse β-cells were well-ablated and did not regenerated, suggesting improvement of diabetic symptoms was dependent on human αPM graft. Images are representative from 9 different diabetic mice after DT injection. (k) Immunofluorescence of pseudoislet kidney grafts in “STZ αPM” (upper panels) and “STZ islets” mice (lower panels), 4 weeks after transplantation. Monohormonal insulin-producing cells with GFP-tracer are abundant in the engrafted αPM+HM pseudoislets. Images are representative from n =4 mice with different donors’ grafts. (l) Body weight changes in experimental animals of Figure 3b (Exp. #3). After DT injection, untransplanted diabetic controls (DT + no Graft) exhibited continuous weight loss, while there is body weight gain after transplantation with intact islets or αPM pseudoislets. Nx: nephrectomy for graft removal. Error bars: SD. (m,n) Intraperitoneal glucose tolerance test (ipGTT) at 7 weeks after transplantation (related to Fig. 3b-d), shows significantly improved glucose tolerance both in DT+αPM and DT+islets groups. ****p < 0.0001, **p = 0.002, *p = 0.0338, versus DT + no graft, two-way RM ANOVA with Dunnett’s multiple comparisons test. Groups are indicated by same colored lines as Fig. 3b,c. n = 3 for DT + islets, n = 1 for DT + αPM, n = 5 for DT + no graft, and n = 5 for no DT + no graft (l,m). n = 2 for DT + islets, n = 1 for DT + αPM, n = 3 for DT + no graft, and n = 4 for no DT + no graft (n) (o) αPM pseudoislets grafted into mouse kidney show innervation (TH+) and vascularization (CD31+) 1 month after transplantation. (p) Proliferation marker pHH3 staining on grafts of αPM+HM 4 weeks after transplantation, showing almost no proliferative cells in grafts (< 1%). (q,r) Immunofluorescence of grafted αPM pseudoislets shows reprogrammed α-cells express insulin as well as GFP tracer at 3 moths after transplantation (q) and 6 months after transplantation (r), confirming a stable phenotype of αPM cells under in vivo environment. Left panels in r are confocal tile-scan images which were merged as a maximum projection. We did not detect any SST, PPY or GHRL positive cells. Black-line: non-grafted diabetic mice; red-line: diabetic mice with αPM+HM graft; blue-line: diabetic mice with native islet graft; black-dotted-line: healthy mice in b-I, l-n. All data shown are means ± s.e.m. (except in l; bars are SD). Scale bars: 50 μm. All images are representative from 9 different diabetic mice after DT injection (j), from n =4 (k), n=3 (o,p), n=1 (q), or n=1 (r) donors.
Extended Data Fig. 7. Reprogrammed α-cells from diabetic donors lead to diabetes remission in mice.
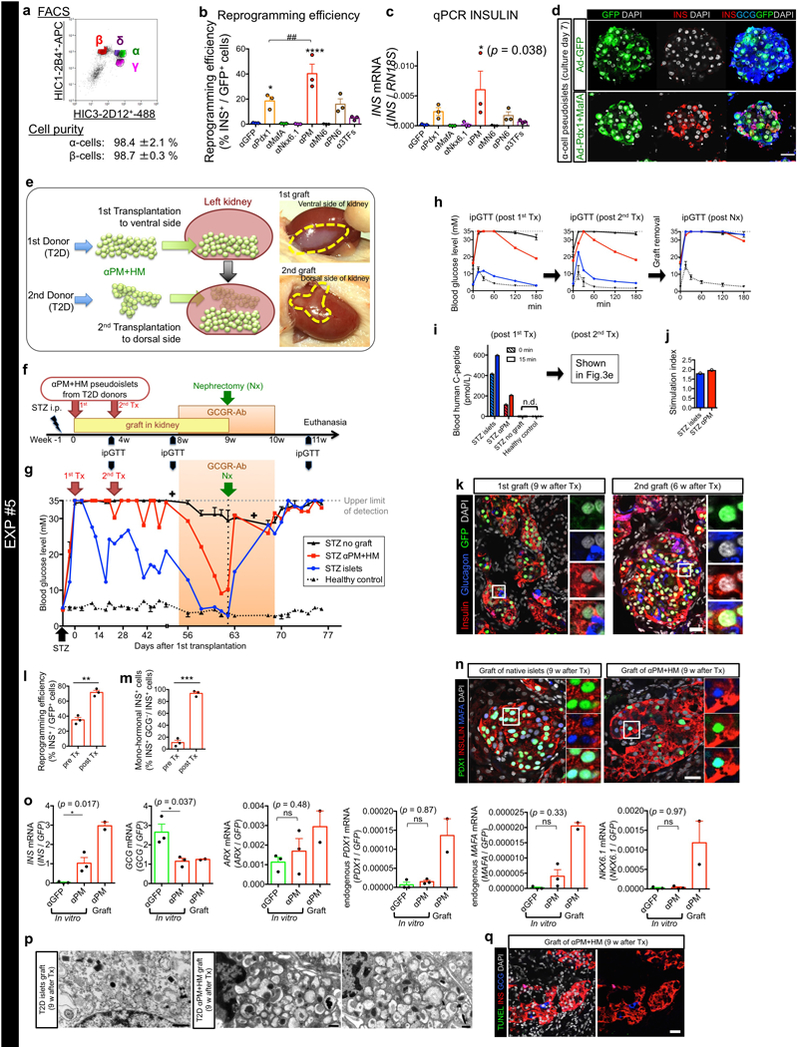
(a) Human islets from T2D donors were dissociated into single cells and antibody-labeled for FACS-sorting. Representative FACS plots showing cells labeled with pan-endocrine marker HIC1–2B4 and non-β-cell endocrine marker HIC3–2D12 20. The purity of sorted islet cells was evaluated. FACS plots are representative from 3 T2D donors. (b, c) Reprogramming efficiency into insulin production (% of Insulin+ GFP+/ GFP+ cells in b) and qPCR analysis of human insulin gene expression (c), 7 days after aggregation of α-cells transduced with the indicated reprogramming factors. Pdx1 and MafA combined (“αPM”) trigger the highest reprogramming efficiency. ****p < 0.0001, *p = 0.031 versus αGFP control; ## p = 0.0055 versus αPM, one-way ANOVA with Tukey’s multiple comparisons test. n = 3 different T2D donors. (d) Representative immunostaining at culture day 7 in αGFP and αPM pseudoislets from 3 T2D donors. (e) Cartoon depicting transplantation experiment using 2 consecutive islet preparations from 2 different T2D deceased patients. First, 2,300 reconstituted αPM+HM pseudoislets were transplanted under the capsule of the left kidney (ventral side) of an STZ-treated diabetic NSG host mouse. Fortuitously, 2 weeks later, T2D islets were again available, and 1,450 new αPM+HM pseudoislets were generated and engrafted into the dorsal side of the same kidney. (f) Experimental time-line of Exp. #5. Sequential transplantation was performed using human α-cells of T2D donors to rescue STZ-diabetes, followed by anti-Glucagon receptor antibody (GCGR-Ab) treatment for 2 weeks. Graft was removed 1 week after GCGR-Ab therapy. The following week, GCGR-Ab treatment was stopped. (g) Random-fed blood glucose throughout Exp. #5. Before glucagon inhibition, there is a mild amelioration of hyperglycemia in the mouse bearing 2 grafts of T2D αPM pseudoislets, yet is less marked than in the mouse that received T2D islets. Under glucagon receptor antibody treatment (“GCGR-Ab”), glycemia drastically and quickly drops in both engrafted mice. Graft removal quickly leads to hyperglycemia, even under glucagon signaling inhibition. (h) Glucose tolerance tests before the 2nd transplantation (3 weeks after 1st transplantation), 4 weeks after the 2nd transplantation, and after graft removal (“post Nx”). There is improved glucose tolerance in diabetic mice transplanted with “αPM+HM” pseudoislets (red line in left and middle panels), relative to untransplanted diabetic controls (black line). (I,j) Circulating human C-peptide after 1st transplantation (i). The data after 2nd transplantation were also shown in Fig. 3e. In vivo stimulation index (of insulin secretion) following a glucose challenge is similar in native T2D islets and T2D αPM pseudoislets (j). (k) Immunofluorescence of engrafted T2D αPM pseudoislets. Insulin-expressing (red) reprogrammed α-cells (GFP+, green) are abundant and do not contain glucagon (blue). (l, m) Reprogramming efficiency (l) and percentage of monohormonal insulin-producing cells (m) in αPM pseudoislets from T2D donors before transplantation (“pre Tx”) and after transplantation (“post Tx”). ***p = 0.0005, ** p = 0.0082, paired t test, two-tailed. n = 3 donors with T2D from 1st, 2nd grafts and independent cohort. (n) Immunofluorescence for PDX1, MAFA and INS of the graft of T2D intact islets (left) or T2D αPM+HM cells (right) 9 weeks after transplantation. Reprogrammed α-cells express insulin (red), PDX1 (green) and MAFA (blue). (o) qPCR analyses in αGFP, αPM aggregates in vitro (before transplantation) and αPM+HM pseudoislets in vivo (after transplantation). Transplanted αPM cells express higher insulin compared to that before transplantation, but still maintained ARX expression. Although endogenous expression levels of human β-cell TFs (PDX1, MafA, NKX6.1) were not changed significantly 7 days after transduction in vitro, their expression in αPM grafts was significantly increased after transplantation. Gene expression levels were normalized to GFP expression. ***p < 0.001, **p < 0.01, *p < 0.05, one-way ANOVA with Holm-Sidak’s multiple comparisons test. n = 3 different T2D donors for αGFP and αPM in vitro. n = 2 different T2D donors for graft of αPM+HM. (p) Transmission electron micrographs of a β-cell in an engrafted T2D islet (left) and of 2 reprogrammed α-cells in engrafted αPM+HM pseudoislets (right). T2D β-cells do not contain abundant insulin granules, as previously reported 61. Reprogrammed α-cells contain abundant β-like granules, with the typical crystalized dense core surrounded by a clear halo. (q) TUNEL staining (green) showed very rare apoptosis events (less than 1%) in the graft of αPM+HM pseudoislets 9 weeks after transplantation. Black line: non-grafted STZ mice (n =4); red line: STZ mice (n = 1) with αPM+HM graft from 2 donors; blue line: STZ mice (n = 1) with native islet graft; black-dotted-line: healthy mice (n = 2) in g and h. n.d.: not detected. All data shown are means ± s.e.m. Scale bars: 25 μm (d, k, n, q); 500 nm (p). Images are representative from 3 different T2D donors’ grafts (k,n,q), and from 2 different T2D donors (p).
Extended Data Fig. 8. Transcriptomic analyses.
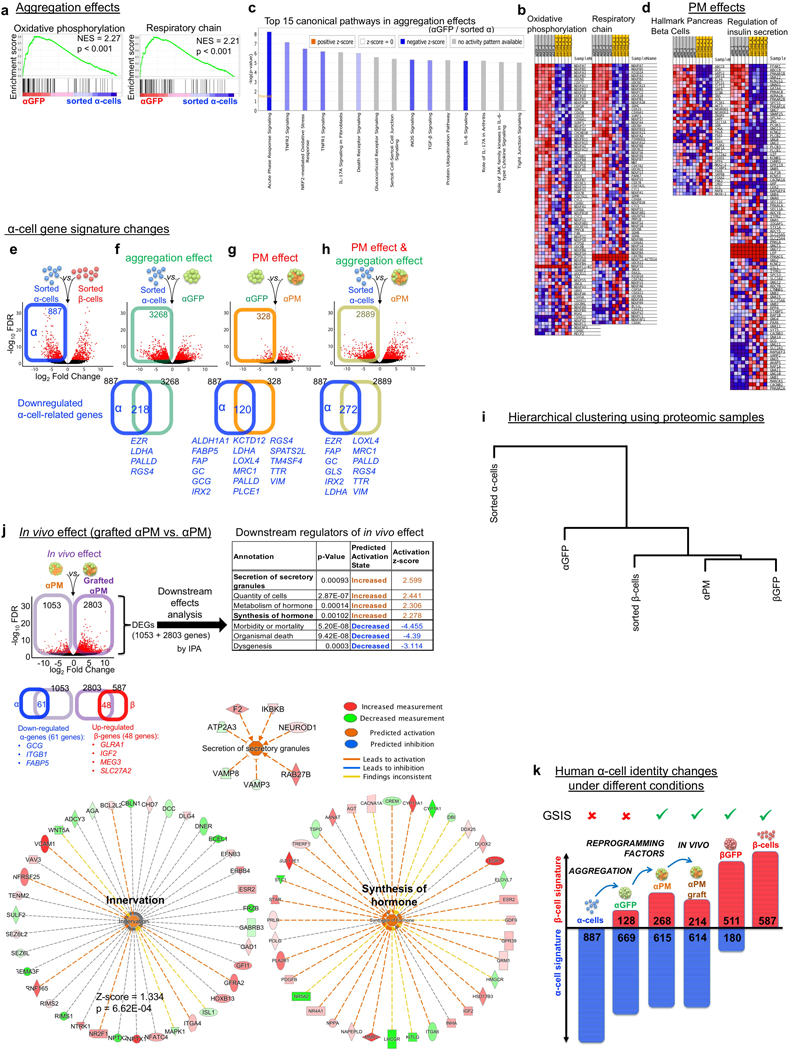
(a,b) Gene-set enrichment analysis (GSEA) using the transcriptomes of sorted α-cells and αGFP pseudoislets. There is a significant enriched expression of genes associated with β-cell function such as mitochondrial “oxidative phosphorylation” and “respiratory chain” in αGFP pseudoislets compared to sorted α-cells (a). Heatmaps of transcriptomic expression levels of listed genes tested in GSEA (b). Gene sets were taken from GO gene sets of Molecular Signatures Database v6.0. (c) Top 15 Canonical pathways that differ between sorted single α-cells and αGFP pseudoislets. Inflammatory/stress-related pathways were downregulated in αGFP pseudoislets compared to sorted α-cell singlets. Pathway analyses were done by IPA. (d) Heatmaps of transcriptomic expression levels of gene sets in αPM pseudoislets and sorted α-cells (related to GSEA in Figure 4g). (e) Volcano plot representing differentially-expressed genes (DEGs) in sorted α-cells and β-cells (FDR < 0.05, FC > 2). 887 α-cell-enriched genes were identified. The blue box delimitates α-cell-enriched genes, i.e. the “α-cell signature” (Supplementary Table 14). (f-h) Changes in expression of ‘α-cell signature’ genes caused by reaggregation and PM effects. Volcano plots showing DEGs in αGFP pseudoislets relative to sorted α-cells (f) that characterize the cell reaggregation effect, in αPM pseudoislets relative to αGFP pseudoislets (g), reflecting the effect of Pdx1 and MafA expression, and in αPM pseudoislets relative to sorted α-cells (h), which reflects the combined effect of cell reaggregation and transcription factor expression. Downregulated DEGs in each condition (colored squares on volcano plots of f-h) were overlapped with the α-cell-enriched gene list of e, as a measure of repressed α-cell signature. The Venn diagrams show that 218 α-enriched genes are downregulated in α-cells upon aggregation (f, Supplementary Table 15), 120 genes upon Pdx1 and MafA activation (g, Supplementary Table 16), and in total 272 “α-like genes” are downregulated in α-cells as a result of the combined effect of cell aggregation and transcription factor expression (h, Supplementary Table 17). DEGs: FDR < 0.05. (i) In vivo effect on αPM cells at 1 month after transplantation. DEGs (FDR < 0.05) between αPM pseudoislets before transplantation (n = 7) and in grafted αPM pseudoislets (n = 5) were analysed with IPA to identify downstream effects. Several pathways were activated, including “synthesis of hormone”, “secretion of secretory granules” and “innervation”. See details in Supplementary Table 20. n = 5 grafts from 9 non-diabetic donors were retrieved from the mouse renal capsules, FACS-sorted with GFP, and analyzed by bulk RNA-Seq. (j) Effect of cell aggregation and reprogramming factor expression on human α-cell identity. Reaggregation of dispersed α-cells and expression of the transcription factors Pdx1 and MafA (PM) promotes the upregulation of a subset of β-cell-enriched genes (“β-cell signature”), which is sufficient to confer a glucose-stimulated insulin secretion activity (GSIS) to α-cells in monotypic αPM pseudoislets. Concomitantly, some but not all the α-cell-enriched genes (“α-cell signature”) are downregulated in αPM pseudoislets, leading to a hybrid “α/β” signature. Figures and histograms represent the number of genes affected. (k) Hierarchical clustering analysis in proteomic in vitro samples showing protein signatures of αPM pseudoislets are closer to β-cells.
Extended Data Fig. 9. Single-cell RNA-Sequencing.
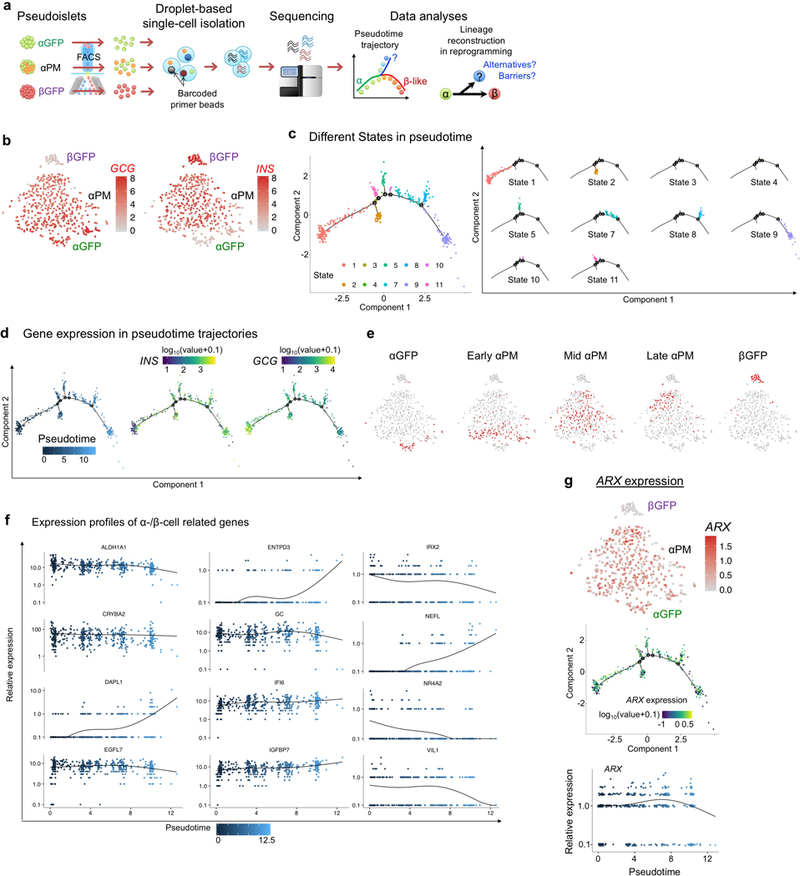
(a) Schematic of scRNA-Seq analyses and pseudotemporal ordering. Monotypic pseudoislets containing labeled human α- (“αGFP” or “αPM”) or β-cells (“βGFP”) were cultured for 1 week and sorted into single cells. Microfluidic device encapsulated each cell individually with a barcoded primer bead in a droplet. cDNA libraries were constructed and sequenced. In silico cell-lineage reconstruction during reprogramming was performed by pseudotime analysis, to dissect the reprogramming path/trajectory. αGFP and βGFP pseudoislets were analyzed as controls. (b) Gene expression of GCG and INS on t-SNE of single-cell transcriptomes from αGFP (n = 47), αPM (n = 434) and βGFP pseudoislets (n = 51) after 1-week-culture (related to Fig. 5a). (c) Cell clustering of αPM cells (n = 434) based on the state along pseudotime trajectory (related to Fig. 5b), showing 10 different states. Although 4 small branches were detected near the main path, most cells were distributed along main stem. (d) Gene expression of INS and GCG on pseudotime trajectory of αPM cells (related to Fig. 5b). (e) Cell distributions of pseudotime-based “early”, “mid” and “late” αPM cells on t-SNE map (related to Fig. 5f). (f) Kinetics of gene expression along pseudotime progression in αPM cells (n = 434) (related to Fig. 5e). (g) ARX expression in cell clusters from t-SNE and pseudotemporal ordering analysis.
Extended Data Fig. 10. Evaluation of the specificity and cytotoxic properties of CTL clones.
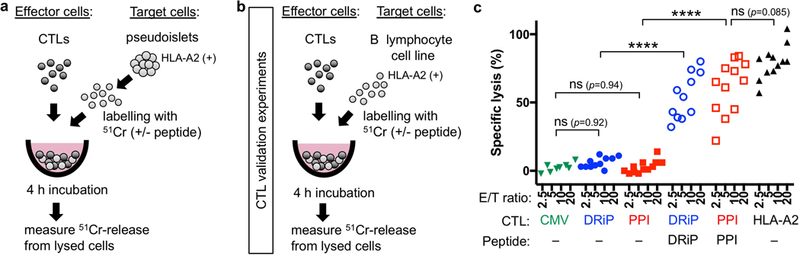
(a) Design of cytotoxic T lymphocyte (CTL) killing assays. As target cells, monotypic pseudoislets (αGFP, αPM, or βGFP) after 1–2 week culture were dissociated and labelled with chromium (51Cr). In some control conditions, islet cells were loaded with either DRiP or PPI peptide epitopes. Then, target cells were co-cultured with effector cells (CTLs), which were either CMV-directed (CMV: negative control clones), DRiP-directed (DRiP: targeting stressed β-cells), PPI-directed (PPI: recognizing preproinsulin), or alloreactive (HLA-A2: positive control) CTL clones at 3 different effector/target (E/T) ratios. DRiP and PPI CTLs are autoreactive T-cell clones derived from T1D patients. After 4h-coculture, the release of 51Cr from islet-cells was measured with γ-counter to calculate the specific cell-lysis. (See Extended Data Fig. 10 to validate the specific killing capability of CTL clones). (b) Schema of validation for CTLs. To evaluate the specificity and function of CTL clones, JY cells, Epstein-Barr virus (EBV)-immortalised B lymphoblastoid cell line (HLA class-I A2+), were used as target cells. As positive control groups, JY cells were loaded with either INS-DRiP1–9 (DRiP) or preproinsulin (PPI) peptide epitope and labelled with chromium (51Cr). Then they were co-cultured with effector cells (CTLs), which is either CMV-directed (CMV), DRiP-directed (DRiP), PPI-directed (PPI), or alloreactive (HLA-A2) CTL clone. (b) CTL killing assay against JY cells. JY cells were killed by the alloreactive HLA-A2 CTLs, but not by CMV-directed CTL, β-cell-specific CTLs anti-PPI or anti-DRiP CTLs. When target cells were loaded with the PPI or DRiP peptide epitope, those JY cells were killed by the respective CTLs, confirming that the specific CTLs function and kill when they recognize their epitope. Each dot represents independent measurement from 3 independent experiments. ****p < 0.0001, one-way ANOVA with Holm-Sidak’s multiple comparisons test.
Supplementary Material
Representative immunostaining images with higher magnification of sorted α- or β-cells for INS/GCG/ SST/DAPI or INS/GCG/PPY /DAPI from 41 donors (related to Extended Data Fig. 1a).
Representative immunostaining of sorted α-cells for INS/GCG/SST from 41 donors (related to Extended Data Fig. 1a). The images were tile-scanned and merged. Scale bar: 250 μm.
Representative immunostaining of sorted β-cells for INS/GCG/SST from 42 donors (related to Extended Data Fig. 1a). The images were tile-scanned and merged. Scale bar: 250 μm.
Acknowledgements
We are grateful to Roland Stein for carefully reading the manuscript, and constructive comments and suggestions. We thank C. Gysler for technical help, J-P. Aubry-Lachainaye for FACS assistance, C. Delucinge-Vivier and M. Docquier for RNA-seq. We thank Q. Zhou for viral vectors, R. Millican and P. Cain for anti-GCGR antibody, and R.Nano and L.Piemonti for human donor samples. Human islets were provided through the JDRF award 31–2008-416 (ECIT Islet for Basic Research program) or the NIDDK-funded Integrated Islet Distribution Program (IIDP) at City of Hope, National Institutes of Health (NIH) Grant no. DK098085. This work was funded with grants from the Research Council of Norway (NFR 247577) and the Novo Nordisk Foundation (NNF15OC0015054) to S.C.; NIH/NIDDK grant DK098285 to J.A.P.; Bergen Forskningsstiftelse (BFS2014REK02) and the Western Norway Regional Health Authority (Bergen Stem Cell Consortium) and the Novo Nordisk Foundation (NNF17OC0027258) to H.R.; NIH/NIDDK (Human Islet Research Network, DK104209 and DK108132), the Juvenile Diabetes Research Foundation (SRA-2015–67-Q-R), the Fondation Privée des HUG – Confirm Award, the Fondation Aclon, and the Swiss National Science Foundation (NRP63 no. 406340–128056, no. 310030_152965 and the Bonus of Excellence grant no. 310030B_173319) to P.L.H.
Footnotes
Data availability
RNA-Seq data that support the findings of this study have been deposited in NCBI’s Gene Expression Omnibus and accessible through GEO series accession code: GSE117454 (bulk RNA-Seq) and GSE123844 (scRNA-Seq). The mass spectrometry proteomics data have been deposited to the ProteomeXchange Consortium via the PRIDE partner repository with the dataset identifier PXD011933.
Competing interests Oregon Health & Science University has commercially licensed one of the antibodies described herein (HIC1–2B4/HPi2); C.D. and M.G. are inventors of this antibody. This potential conflict of interest has been reviewed and managed by OHSU.
References
- 1.Mauda-Havakuk M et al. Ectopic PDX-1 expression directly reprograms human keratinocytes along pancreatic insulin-producing cells fate. PLoS One 6, e26298, doi: 10.1371/journal.pone.0026298 (2011). [DOI] [PMC free article] [PubMed] [Google Scholar]
- 2.Zhu S et al. Human pancreatic beta-like cells converted from fibroblasts. Nat Commun 7, 10080, doi: 10.1038/ncomms10080 (2016). [DOI] [PMC free article] [PubMed] [Google Scholar]
- 3.Lima MJ et al. Suppression of epithelial-to-mesenchymal transitioning enhances ex vivo reprogramming of human exocrine pancreatic tissue toward functional insulin-producing beta-like cells. Diabetes 62, 2821–2833, doi: 10.2337/db12-1256 (2013). [DOI] [PMC free article] [PubMed] [Google Scholar]
- 4.Lee J et al. Expansion and conversion of human pancreatic ductal cells into insulin-secreting endocrine cells. Elife 2, e00940, doi: 10.7554/eLife.00940 (2013). [DOI] [PMC free article] [PubMed] [Google Scholar]
- 5.Chera S & Herrera PL Regeneration of pancreatic insulin-producing cells by in situ adaptive cell conversion. Curr Opin Genet Dev 40, 1–10, doi: 10.1016/j.gde.2016.05.010 (2016). [DOI] [PMC free article] [PubMed] [Google Scholar]
- 6.Thorel F et al. Conversion of adult pancreatic alpha-cells to beta-cells after extreme beta-cell loss. Nature 464, 1149–1154, doi: 10.1038/nature08894 (2010). [DOI] [PMC free article] [PubMed] [Google Scholar]
- 7.Chera S et al. Diabetes recovery by age-dependent conversion of pancreatic delta-cells into insulin producers. Nature 514, 503–507, doi: 10.1038/nature13633 (2014). [DOI] [PMC free article] [PubMed] [Google Scholar]
- 8.Bramswig NC et al. Epigenomic plasticity enables human pancreatic alpha to beta cell reprogramming. J Clin Invest 123, 1275–1284, doi: 10.1172/JCI66514 (2013). [DOI] [PMC free article] [PubMed] [Google Scholar]
- 9.Spijker HS et al. Conversion of mature human beta-cells into glucagon-producing alpha-cells. Diabetes 62, 2471–2480, doi: 10.2337/db12-1001 (2013). [DOI] [PMC free article] [PubMed] [Google Scholar]
- 10.Yoneda S et al. Predominance of beta-cell neogenesis rather than replication in humans with an impaired glucose tolerance and newly diagnosed diabetes. J Clin Endocrinol Metab 98, 2053–2061, doi: 10.1210/jc.2012-3832 (2013). [DOI] [PubMed] [Google Scholar]
- 11.White MG et al. Expression of mesenchymal and alpha-cell phenotypic markers in islet beta-cells in recently diagnosed diabetes. Diabetes Care 36, 3818–3820, doi: 10.2337/dc13-0705 (2013). [DOI] [PMC free article] [PubMed] [Google Scholar]
- 12.Butler AE et al. Marked expansion of exocrine and endocrine pancreas with incretin therapy in humans with increased exocrine pancreas dysplasia and the potential for glucagon-producing neuroendocrine tumors. Diabetes 62, 2595–2604, doi: 10.2337/db12-1686 (2013). [DOI] [PMC free article] [PubMed] [Google Scholar]
- 13.Xiao X et al. Endogenous Reprogramming of Alpha Cells into Beta Cells, Induced by Viral Gene Therapy, Reverses Autoimmune Diabetes. Cell Stem Cell 22, 78–90 e74, doi: 10.1016/j.stem.2017.11.020 (2018). [DOI] [PMC free article] [PubMed] [Google Scholar]
- 14.Ben-Othman N et al. Long-Term GABA Administration Induces Alpha Cell-Mediated Beta-like Cell Neogenesis. Cell 168, 73–85 e11, doi: 10.1016/j.cell.2016.11.002 (2017). [DOI] [PubMed] [Google Scholar]
- 15.Li J et al. Artemisinins Target GABAA Receptor Signaling and Impair alpha Cell Identity. Cell 168, 86–100 e115, doi: 10.1016/j.cell.2016.11.010 (2017). [DOI] [PMC free article] [PubMed] [Google Scholar]
- 16.Zhou Q & Melton DA Pancreas regeneration. Nature 557, 351–358, doi: 10.1038/s41586-018-0088-0 (2018). [DOI] [PMC free article] [PubMed] [Google Scholar]
- 17.van der Meulen T et al. Artemether Does Not Turn alpha Cells into beta Cells. Cell Metab 27, 218–225 e214, doi: 10.1016/j.cmet.2017.10.002 (2018). [DOI] [PMC free article] [PubMed] [Google Scholar]
- 18.Zhu Y, Liu Q, Zhou Z & Ikeda Y PDX1, Neurogenin-3, and MAFA: critical transcription regulators for beta cell development and regeneration. Stem Cell Res Ther 8, 240, doi: 10.1186/s13287-017-0694-z (2017). [DOI] [PMC free article] [PubMed] [Google Scholar]
- 19.Matsuoka TA et al. Mafa Enables Pdx1 to Effectively Convert Pancreatic Islet Progenitors and Committed Islet alpha-Cells Into beta-Cells In Vivo. Diabetes 66, 1293–1300, doi: 10.2337/db16-0887 (2017). [DOI] [PMC free article] [PubMed] [Google Scholar]
- 20.Dorrell C et al. Human islets contain four distinct subtypes of beta cells. Nat Commun 7, 11756, doi: 10.1038/ncomms11756 (2016). [DOI] [PMC free article] [PubMed] [Google Scholar]
- 21.Bosco D, Orci L & Meda P Homologous but Not Heterologous Contact Increases the Insulin-Secretion of Individual Pancreatic B-Cells. Experimental Cell Research 184, 72–80, doi:Doi 10.1016/0014-4827(89)90365-0 (1989). [DOI] [PubMed] [Google Scholar]
- 22.Takebe T et al. Vascularized and functional human liver from an iPSC-derived organ bud transplant. Nature 499, 481–484, doi: 10.1038/nature12271 (2013). [DOI] [PubMed] [Google Scholar]
- 23.Hematti P, Kim J, Stein AP & Kaufman D Potential role of mesenchymal stromal cells in pancreatic islet transplantation. Transplant Rev (Orlando) 27, 21–29, doi: 10.1016/j.trre.2012.11.003 (2013). [DOI] [PubMed] [Google Scholar]
- 24.Hilderink J et al. Controlled aggregation of primary human pancreatic islet cells leads to glucose-responsive pseudoislets comparable to native islets. J Cell Mol Med 19, 1836–1846, doi: 10.1111/jcmm.12555 (2015). [DOI] [PMC free article] [PubMed] [Google Scholar]
- 25.Segerstolpe A et al. Single-Cell Transcriptome Profiling of Human Pancreatic Islets in Health and Type 2 Diabetes. Cell Metab 24, 593–607, doi: 10.1016/j.cmet.2016.08.020 (2016). [DOI] [PMC free article] [PubMed] [Google Scholar]
- 26.Damond N et al. Blockade of glucagon signaling prevents or reverses diabetes onset only if residual beta-cells persist. Elife 5, doi: 10.7554/eLife.13828 (2016). [DOI] [PMC free article] [PubMed] [Google Scholar]
- 27.Neumann UH, Denroche HC, Mojibian M, Covey SD & Kieffer TJ Insulin Knockout Mice Have Extended Survival but Volatile Blood Glucose Levels on Leptin Therapy. Endocrinology 157, 1007–1012, doi: 10.1210/en.2015-1890 (2016). [DOI] [PubMed] [Google Scholar]
- 28.Syed SK et al. Ectonucleotidase NTPDase3 is abundant in pancreatic beta-cells and regulates glucose-induced insulin secretion. Am J Physiol Endocrinol Metab 305, E1319–1326, doi: 10.1152/ajpendo.00328.2013 (2013). [DOI] [PubMed] [Google Scholar]
- 29.Andersson SA et al. Reduced insulin secretion correlates with decreased expression of exocytotic genes in pancreatic islets from patients with type 2 diabetes. Mol Cell Endocrinol 364, 36–45, doi: 10.1016/j.mce.2012.08.009 (2012). [DOI] [PubMed] [Google Scholar]
- 30.Chu KY, Li H, Wada K & Johnson JD Ubiquitin C-terminal hydrolase L1 is required for pancreatic beta cell survival and function in lipotoxic conditions. Diabetologia 55, 128–140, doi: 10.1007/s00125-011-2323-1 (2012). [DOI] [PubMed] [Google Scholar]
- 31.Inagaki N, Kuromi H & Seino S PACAP/VIP receptors in pancreatic beta-cells: their roles in insulin secretion. Ann N Y Acad Sci 805, 44–51; discussion 52–43 (1996). [DOI] [PubMed] [Google Scholar]
- 32.Muller YL et al. A cis-eQTL in PFKFB2 is associated with diabetic nephropathy, adiposity and insulin secretion in American Indians. Hum Mol Genet 24, 2985–2996, doi: 10.1093/hmg/ddv040 (2015). [DOI] [PMC free article] [PubMed] [Google Scholar]
- 33.Kane MA et al. CrbpI modulates glucose homeostasis and pancreas 9-cis-retinoic acid concentrations. Mol Cell Biol 31, 3277–3285, doi: 10.1128/MCB.05516-11 (2011). [DOI] [PMC free article] [PubMed] [Google Scholar]
- 34.Arda HE et al. Age-Dependent Pancreatic Gene Regulation Reveals Mechanisms Governing Human beta Cell Function. Cell Metab 23, 909–920, doi: 10.1016/j.cmet.2016.04.002 (2016). [DOI] [PMC free article] [PubMed] [Google Scholar]
- 35.Cigliola V et al. Pancreatic islet-autonomous insulin and smoothened-mediated signalling modulate identity changes of glucagon(+) alpha-cells. Nat Cell Biol 20, 1267–1277, doi: 10.1038/s41556-018-0216-y (2018). [DOI] [PMC free article] [PubMed] [Google Scholar]
- 36.Qiu X et al. Single-cell mRNA quantification and differential analysis with Census. Nat Methods 14, 309–315, doi: 10.1038/nmeth.4150 (2017). [DOI] [PMC free article] [PubMed] [Google Scholar]
- 37.Kim-Muller JY et al. Aldehyde dehydrogenase 1a3 defines a subset of failing pancreatic beta cells in diabetic mice. Nat Commun 7, 12631, doi: 10.1038/ncomms12631 (2016). [DOI] [PMC free article] [PubMed] [Google Scholar]
- 38.Kracht MJ et al. Autoimmunity against a defective ribosomal insulin gene product in type 1 diabetes. Nat Med 23, 501–507, doi: 10.1038/nm.4289 (2017). [DOI] [PubMed] [Google Scholar]
- 39.Skowera A et al. CTLs are targeted to kill beta cells in patients with type 1 diabetes through recognition of a glucose-regulated preproinsulin epitope. J Clin Invest 118, 3390–3402, doi: 10.1172/JCI35449 (2008). [DOI] [PMC free article] [PubMed] [Google Scholar]
- 40.Kulkarni RN & Stewart AF Summary of the Keystone islet workshop (April 2014): the increasing demand for human islet availability in diabetes research. Diabetes 63, 3979–3981, doi: 10.2337/db14-1303 (2014). [DOI] [PMC free article] [PubMed] [Google Scholar]
- 41.van der Torren CR et al. Immunogenicity of human embryonic stem cell-derived beta cells. Diabetologia 60, 126–133, doi: 10.1007/s00125-016-4125-y (2017). [DOI] [PMC free article] [PubMed] [Google Scholar]
- 42.van der Torren C et al. Innate and adaptive immunity to human beta cell lines: implications for beta cell therapy. Diabetologia 59, 170–175, doi: 10.1007/s00125-015-3779-1 (2016). [DOI] [PMC free article] [PubMed] [Google Scholar]
- 43.Schaffer AE et al. Nkx6.1 controls a gene regulatory network required for establishing and maintaining pancreatic Beta cell identity. PLoS Genet 9, e1003274, doi: 10.1371/journal.pgen.1003274 (2013). [DOI] [PMC free article] [PubMed] [Google Scholar]
- 44.Herrera PL Adult insulin- and glucagon-producing cells differentiate from two independent cell lineages. Development 127, 2317–2322 (2000). [DOI] [PubMed] [Google Scholar]
- 45.Rezania A et al. Reversal of diabetes with insulin-producing cells derived in vitro from human pluripotent stem cells. Nat Biotechnol 32, 1121–1133, doi: 10.1038/nbt.3033 (2014). [DOI] [PubMed] [Google Scholar]
- 46.Thorel F et al. Normal glucagon signaling and beta-cell function after near-total alpha-cell ablation in adult mice. Diabetes 60, 2872–2882, doi: 10.2337/db11-0876 (2011). [DOI] [PMC free article] [PubMed] [Google Scholar]
- 47.Zhou Q, Brown J, Kanarek A, Rajagopal J & Melton DA In vivo reprogramming of adult pancreatic exocrine cells to beta-cells. Nature 455, 627–632, doi: 10.1038/nature07314 (2008). [DOI] [PMC free article] [PubMed] [Google Scholar]
- 48.Mathe Z et al. Tetracycline-regulated expression of VEGF-A in beta cells induces angiogenesis: improvement of engraftment following transplantation. Cell Transplant 15, 621–636 (2006). [DOI] [PubMed] [Google Scholar]
- 49.Sun J, Nishiyama T, Shimizu K & Kadota K TCC: an R package for comparing tag count data with robust normalization strategies. BMC Bioinformatics 14, 219, doi: 10.1186/1471-2105-14-219 (2013). [DOI] [PMC free article] [PubMed] [Google Scholar]
- 50.Wisniewski JR, Zougman A, Nagaraj N & Mann M Universal sample preparation method for proteome analysis. Nature methods 6, 359–362, doi: 10.1038/nmeth.1322 (2009). [DOI] [PubMed] [Google Scholar]
- 51.Paulo JA, O’Connell JD & Gygi SP A Triple Knockout (TKO) Proteomics Standard for Diagnosing Ion Interference in Isobaric Labeling Experiments. J Am Soc Mass Spectrom 27, 1620–1625, doi: 10.1007/s13361-016-1434-9 (2016). [DOI] [PMC free article] [PubMed] [Google Scholar]
- 52.McAlister GC et al. MultiNotch MS3 Enables Accurate, Sensitive, and Multiplexed Detection of Differential Expression across Cancer Cell Line Proteomes. Analytical chemistry 86, 7150–7158, doi: 10.1021/ac502040v (2014). [DOI] [PMC free article] [PubMed] [Google Scholar]
- 53.Paulo JA & Gygi SP A comprehensive proteomic and phosphoproteomic analysis of yeast deletion mutants of 14–3-3 orthologs and associated effects of rapamycin. Proteomics 15, 474–486, doi: 10.1002/pmic.201400155 (2015). [DOI] [PMC free article] [PubMed] [Google Scholar]
- 54.Huttlin EL et al. A tissue-specific atlas of mouse protein phosphorylation and expression. Cell 143, 1174–1189, doi: 10.1016/j.cell.2010.12.001 (2010). [DOI] [PMC free article] [PubMed] [Google Scholar]
- 55.Beausoleil SA, Villen J, Gerber SA, Rush J & Gygi SP A probability-based approach for high-throughput protein phosphorylation analysis and site localization. Nature biotechnology 24, 1285–1292, doi: 10.1038/nbt1240 (2006). [DOI] [PubMed] [Google Scholar]
- 56.Elias JE & Gygi SP Target-decoy search strategy for mass spectrometry-based proteomics. Methods Mol Biol 604, 55–71, doi: 10.1007/978-1-60761-444-9_5 (2010). [DOI] [PMC free article] [PubMed] [Google Scholar]
- 57.Elias JE & Gygi SP Target-decoy search strategy for increased confidence in large-scale protein identifications by mass spectrometry. Nat Methods 4, 207–214, doi: 10.1038/nmeth1019 (2007). [DOI] [PubMed] [Google Scholar]
- 58.McAlister GC et al. Increasing the multiplexing capacity of TMTs using reporter ion isotopologues with isobaric masses. Analytical chemistry 84, 7469–7478, doi: 10.1021/ac301572t (2012). [DOI] [PMC free article] [PubMed] [Google Scholar]
- 59.Butler A, Hoffman P, Smibert P, Papalexi E & Satija R Integrating single-cell transcriptomic data across different conditions, technologies, and species. Nat Biotechnol 36, 411–420, doi: 10.1038/nbt.4096 (2018). [DOI] [PMC free article] [PubMed] [Google Scholar]
- 60.Qiu X et al. Reversed graph embedding resolves complex single-cell trajectories. Nat Methods 14, 979–982, doi: 10.1038/nmeth.4402 (2017). [DOI] [PMC free article] [PubMed] [Google Scholar]
- 61.Masini M et al. Ultrastructural morphometric analysis of insulin secretory granules in human type 2 diabetes. Acta Diabetol 49 Suppl 1, S247–252, doi: 10.1007/s00592-012-0446-6 (2012). [DOI] [PubMed] [Google Scholar]
Associated Data
This section collects any data citations, data availability statements, or supplementary materials included in this article.
Supplementary Materials
Representative immunostaining images with higher magnification of sorted α- or β-cells for INS/GCG/ SST/DAPI or INS/GCG/PPY /DAPI from 41 donors (related to Extended Data Fig. 1a).
Representative immunostaining of sorted α-cells for INS/GCG/SST from 41 donors (related to Extended Data Fig. 1a). The images were tile-scanned and merged. Scale bar: 250 μm.
Representative immunostaining of sorted β-cells for INS/GCG/SST from 42 donors (related to Extended Data Fig. 1a). The images were tile-scanned and merged. Scale bar: 250 μm.