Abstract
Due to the increasing occurrence of and high costs associated with prostate cancer (PC), there is an urgent need to develop novel PC treatment and chemoprevention strategies. Although androgen receptor (AR) signaling is significant in the development and progression of PC, other molecular pathways contribute as well. Peroxisome Proliferator-Activated Receptor Gamma (PPARγ) has recently been implicated as an oncogene in PC, which may influence both the development and metastatic progression of the cancer. There are two isoforms of PPARγ, with PPARγ2 having an additional 30 amino acids at the amino terminus. Here, we investigated the differential expression and function of these two isoforms in benign and cancerous prostate epithelial cells. The findings from our immunohistochemistry (IHC) and RNA in situ hybridization experiments suggest that although both isoforms are expressed in benign human prostate tissue, PPARγ1 predominates in PC tissue. Our results from PC cell line experiments suggest that PPARγ1 contributes to the proliferation of some PC cells and that PPARγ2 represses PC cell growth. Our findings also suggest that PPARγ1 increases the growth and possibly the transformation of otherwise benign prostate epithelial cells. These results help to establish different roles for PPARγ isoforms in prostate cells, and support the hypothesis that PPARγ1 acts as an oncogene and that PPARγ2 acts as a tumor suppressor in prostate cells.
Keywords: Prostate cancer, PPAR gamma, isoforms
Introduction
Prostate cancer (PC) is the most commonly diagnosed cancer in males and is the second leading cause of cancer death in men living in the developed world [1]. Due to the increasing occurrence of and large expenses associated with PC, there is an urgent need to develop novel PC treatment and chemoprevention strategies. Androgens and androgen receptor (AR) signaling are significant in the development and progression of PC, but other molecular pathways contribute as well [2]. We and others have identified the peroxisome proliferator activator receptor γ (PPARγ) as a potential target to inhibit both the development of PC and its growth once established.
PPARγ is a ligand-dependent transcription factor which belongs to a family of nuclear hormone receptors [3]. PPARγ is known to play a role in regulating glucose and fatty acid metabolism. It is a main regulatory factor in adipocyte differentiation, and has significant roles in the inflammatory response, lipid metabolism, and peripheral glucose utilization. To this end, synthetic PPARγ agonists are used as insulin sensitizers in patients with type II diabetes [3]. PPARγ was originally thought to act as a tumor suppressor in prostate cells because agonists were found to inhibit AR activity and the growth of PC cells [4-7]. However, additional studies found that PPARγ agonists inhibit cell growth and AR activity independently of PPARγ [8-10]. Furthermore, PPARy expression increases with PC grade/stage [11-13], suggesting instead that it is an oncogene. Two recent studies provide additional support to the role of PPARγ as an oncogene. First, previous work in our lab sought a molecular mechanism to explain the large retrospective studies that have shown that use of anticoagulant warfarin reduces PC risk [14-17]. We found that warfarin treatment strongly and directly inhibited PPARγ signaling in benign mouse and human prostate cells, which contributed to the inhibition of PC cell growth [2]. Independently, Ahmad et al identified PPARγ as an oncogene using a Sleeping Beauty screen in prostate-specific Pten-/- mice [11]. Mice with insertions upstream of the PPARγ gene that caused increased expression of the PPARγ protein had more rapid development of PC and increased metastases to the lungs and lymph nodes compared to littermate controls. Overexpression of PPARγ in three PC cell lines increased cell proliferation and migration whereas siRNA knockdown of PPARγ had the opposite effect. Treatment with a PPARγ antagonist decreased the growth of xenografts in an orthotopic mouse model [11]. These data strongly implicate PPARγ activity in the development and progression of PC and demonstrates PPARγ as an oncogene in many PC models.
While these studies provide strong rationale for targeting PPARγ in PC, it is important to note that there are two isoforms of PPARγ. PPARγ2 is identical to PPARγ1, but it has an additional 30 amino acids at the amino terminus. Many tissues express PPARγ1, while PPARγ2 is expressed primarily in adipocytes and controls their differentiation [18,19]. None of the studies mentioned above investigated potential differences between the two isoforms in PC. Instead, they focused on PPARγ1 and used reagents that could not distinguish between the two isoforms. A recent study by Strand et al, however, suggests that there are important differences between the two PPARγ isoforms [20]. In this study, the Pparg gene was knocked out of mouse prostate epithelial cells and then the individual PPARγ1 and γ2 transcripts were re-introduced. When these engineered cells were used in a prostate reconstitution assay, it was found that restoration of PPARγ1 resulted in adenocarcinoma formation while PPARγ2 resulted in benign gland formation. In order to potentially target PPARγ in PC, it is essential to understand the roles and functions of each isoform. In this study, we extend our knowledge of PPARγ1 and PPARγ2 in human prostate and PC cells and show that they are expressed in different cells in human prostate tissue and play different roles in cultured cells.
Materials and methods
Cell lines and culture conditions
LNCaP cells (ATCC) and BPH1 cells (gift from Ann Donjacour) were maintained in phenol red-free RPMI 1640 supplemented with 10% FBS and antibiotics. LNCaP cells stably expressing AR and PPARγ were generated through the transfection of fluorescent and HA-tagged AR and PPARγ (clone HsCD00455985). PC3 cells (ATCC) were maintained in Dulbecco’s modified Eagle’s medium supplemented with 10% FBS and antibiotics. Mouse prostatic epithelial (mPrE) cell lines restored with either PPARγ1 or PPARγ2 isoform were previously generated from Strand et al [20]. mPrE cells were maintained in RPMI 1640 supplemented with 5% FBS and antibiotics.
Transfection and luciferase assays
Cells were transfected using Lipofectamine Plus (Thermofisher) with PPRE-luciferase and pRL-SV40 (Promega) as a control. In some experiments, cells were transfected with siRNA targeting PPARG (Qiagen). Cells were transferred to a 96-well plate 24 hours after transfection and treated with the appropriate drugs dissolved in media supplemented with charcoal-stripped serum for another 24 hours. Luciferase activity was assayed 24 hours after treatment using the dual-luciferase reporter assay system (Promega). Student’s t-test (two-sided and equal variance) was performed and association was considered significant when P<0.05 and indicated by an asterisk.
Cell proliferation assays
For growth curves, cells were transferred to charcoal stripped (C/S) media 3 days before they were split and plated at a density of approximately 10,000 cells/well in 48-well plates, in quadruplicate. The following day, medium with or without PPARγ-selective antagonist T0070907 (T007) was added to the cells. Proliferation was determined by measuring the DNA content of the cells in each well. Cells were fixed in 2% PFA, followed by staining for 5 min at room temperature with 0.2 ng/mL DAPI in PBS solution. The cells were washed with PBS solution, then read on a fluorescence plate reader using 365/439 excitation/emission wavelengths.
Student’s t-test (two-sided and equal variance) was performed and association was considered significant when P<0.05 and indicated by an asterisk.
The CytoSelectTM 96-well cell transformation assay kit (Cell biolabs, Inc., San Diego, CA, USA) was used for the soft agar colony formation assays. Experiments were performed according to the specifications in the product manual. Briefly, equal volumes of 1.2% agar solution and 2 × DMEM/20% FBS medium were mixed and 50 μL of the mixture was transferred to each well of a 96-well microplate immediately to evenly cover the wells. To solidify the base agar layer, the plate was transferred to 4°C for 30 min. Cells were collected and suspended with or without PPARγ-selective antagonist T0070907 (T007) in culture medium at 2 × 10⁵ cells/mL, and mixed with equal volumes of 1.2% agar solution and 2 × DMEM/20% FBS medium (1:1:1). Then 75 μL of the mixture was transferred to the corresponding well of the 96-well microplate containing the solidified base agar layer (five replicates were used) and 100 μL of culture medium was added to each well and the cells were incubated for 7 days at 37°C at 5% CO2. At the end of this incubation, 50 μL of agar solubilization solution was added to each well to dissolve the agar completely followed by addition of 25 μL of 8 × lysis buffer to each well. Then 10 μL of the mixture was used to react with 90 μL of the CyQuant working solution. Fluorescence was measured on a plate reader (Tecan).
Western blot analysis
Whole cell and tissue extracts were fractionated and transferred to a polyvinylidene difluoride (PVDF) membrane using a transfer apparatus according to the manufacturer’s protocols (Bio-Rad). After incubation with 5% nonfat milk in TBST (10 mM Tris, pH 8.0, 150 mM NaCl, 0.5% Tween 20) for 1 h, the membrane was washed once with TBST and incubated with antibodies against PPARγ1/2 (Cell Signaling Technology #2435, 1:500 dilution), PPARγ2 (Rockland #600-401-418, 1:1000 dilution), P-84 (GeneTex #70220, 1:1000 dilution) at 4°C for 12 h. Membranes were washed three times for 10 min and incubated with a 1:10000 dilution of horseradish peroxidase-conjugated anti-mouse or anti-rabbit antibodies for 1 h. Blots were washed with TBST three times and developed with the ECL system (Amersham Biosciences) according to the manufacturer’s protocols.
Immunohistochemistry
Radical prostatectomy or metastatic biopsy tissue was obtained from 51 patients with approval from the City of Hope Institutional Review Board under protocol 11058. Immunohistochemistry was performed using standard protocols. Antigen retrieval was performed on paraffin-embedded sections using citrate-based antigen unmasking solution (Vector Labs, Burlingame, CA). Slides were blocked with 10% normal goal serum, and then stained with anti-PPARγ1/2 antibody (Cell Signaling Technology #2435) diluted 1:200 in TBST, anti-PPARγ2 antibody (Rockland #600-401-418) diluted 1:100 in TBST, anti-CK19 antibody (Cell Signaling Technology #13092) diluted 1:150 in TBST, or normal rabbit IgG (Santa Cruz) overnight at 4°C. Slides were then incubated in biotinylated anti-rabbit secondary antibody (Vector Labs) followed by Vectastain Elite ABC reagent (Vector Labs) and developed using DAB substrate (Vector Labs). Sections were counterstained with Harris hematoxylin (Poly Scientific, Bay Shore, NY).
Quantitative PCR (qPCR)
Total RNA was extracted from cells using GeneJet RNA purification kit (ThermoFisher). Reverse transcription was performed using M-MLV reverse transcriptase (ThermoFisher). Transcript levels were quantified relative to the RPL19 housekeeping gene using SYBR green (ThermoFisher) with Rox reference dye (ThermoFisher) on a StepOne Real Time PCR System (ThermoFisher). Relative gene expression was calculated by ΔΔCt. Student’s t-test was performed and association was considered significant when P<0.05 and indicated by an asterisk.
RNAScope
Prostate cancer FFPE sections were sent to Advanced Cell Diagnostics, Inc. (ACD) where an RNAScope Assay Kit was used, specifically the BaseScope Duplex Reagent Kit (Cat. No. 323800), to identify discrete PPARγ1 (NM_138712.3, Cat. No. 719221) and PPARγ2 (Cat. No. 719231) transcripts with targeted probes [21]. The ACD BaseScope Duplex positive control probe (Cat. No. 700101) and negative control probe (NM_015869.4, Cat. No. 700141) were also used. The RNAScope Assay conditions are as follows: target retrieval was 15 minutes at 95-100°C and protease III was 15 minutes at 40°C.
Results
PPARγ1 and PPARγ2 are expressed in human prostate and PC tissue
Several studies have examined the expression of PPARγ in human prostate and PC tissue, but the differential expression of the two unique isoforms hasn’t been thoroughly investigated. Most studies have utilized an antibody that detects both PPARγ1 and γ2, as the γ1 isoform is entirely encompassed within γ2, with γ2 having an additional 30 amino acids at the N-terminus (Figure 1A). Using such an antibody, we confirmed that PPARγ is expressed in many human PCs (Figure 1B). Interestingly, we found that this antibody also strongly stained isolated benign glands, far removed from any cancer loci. While these were not frequent, there was at least one positive benign gland on each slide we examined. We next probed adjacent slides with an antibody that recognizes only PPARγ2. Although the background was somewhat high with this antibody, we saw very little staining in PCs (Figure 1B). However, we did see some strong staining in isolated benign glands (Figures 1B and S1). Our IHC results suggest that PPARγ1 is expressed in PC tissue and that PPARγ2, and possibly PPARγ1, are expressed in isolated benign glands. In order to determine if one or both isoforms were expressed in benign tissue, we carried out in situ RNA detection using the RNAScope platform [21]. Ten FFPE sections (7 local, 3 metastatic PCs) were assayed with probes designed to identify discrete PPARγ1 (green) and PPARγ2 (red) transcripts (Figure 2). Although the staining in general was not as extensive as the IHC, we found that PPARγ1 was expressed in cancer and benign glands in all ten samples (Figures 2A-C, S2). Positive control probes for PPIB and POLR2A demonstrated appropriate staining in each section, as did negative control probes (Figure 2A). PPARγ1 transcript was found throughout localized PCs (example in Figure 2A), metastatic PCs (example in Figure 2B), and in many benign glands (example in Figure 2C) with additional examples in Figure S2. Interestingly, PPARγ2 staining was only observed in two samples, never in cancer areas, only in benign epithelial and stromal cells (Figure 2D). Taken together, our IHC and RNAScope results indicate that PPARγ1 predominates in PC tissue and that both PPARγ1 and PPARγ2 transcripts are present in isolated benign glands.
Figure 1.
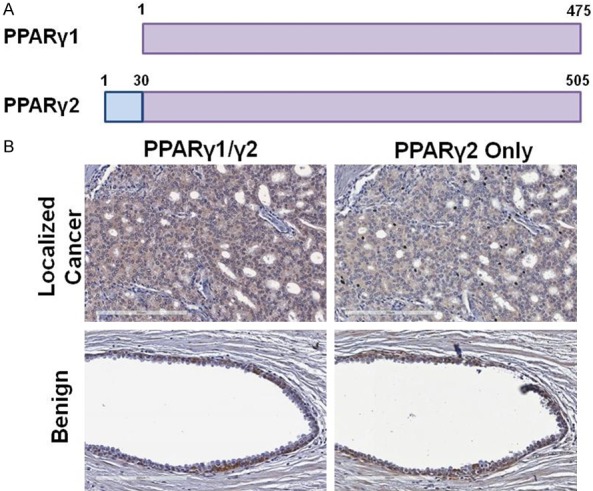
PPARγ isoform expression in benign and cancerous human prostate tissue. A. There are two isoforms of PPARγ, with PPARγ2 having an additional 30 amino acids at the amino terminus. B. Examples of immunohistochemistry (IHC) using an antibody that detects both PPARγ1/2 as well as an antibody specific for PPARγ2 in normal and cancerous human prostate tissue.
Figure 2.
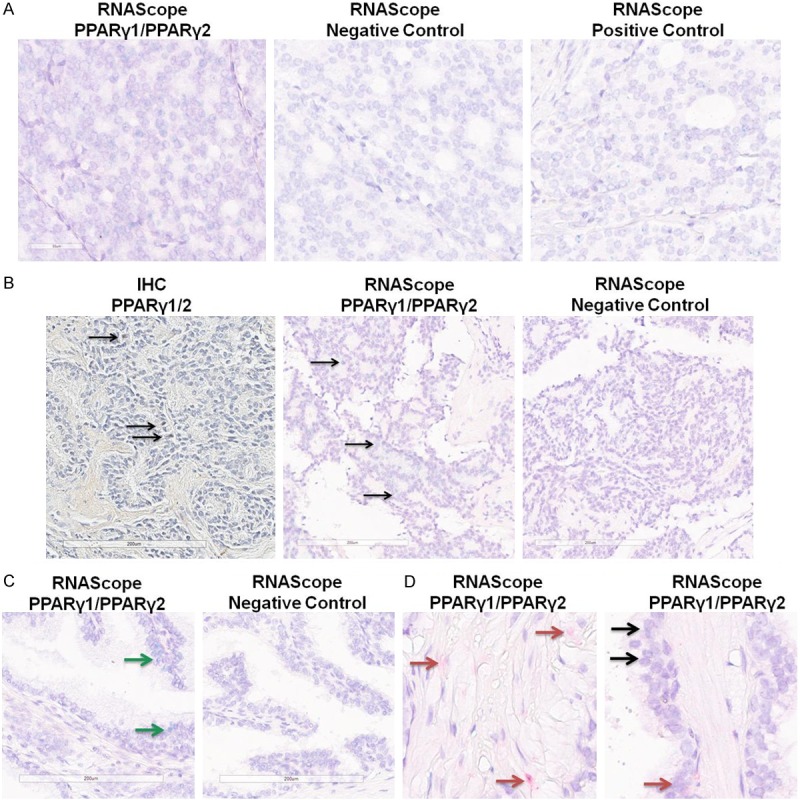
Detection of PPARγ1 and γ2 RNAs in human prostate tissue. RNAs specific to PPARγ1 (green) or PPARγ2 (red) were detected using the RNAScope duplex staining platform. A. Example of staining in a PC section, demonstrating PPARγ1 staining (green) expression but no PPARγ2 staining (left), along with negative and positive control staining on adjacent sections. B. Example of staining in a metastatic PC sample. (Left) IHC staining with the antibody that detects both PPARγ1/2 isoforms. (Center) RNAScope staining for PPARγ1 and PPARγ showing only PPARγ1 staining. (Right) RNAScope negative control staining. Arrows show positive nuclei. C. Example of RNAScope staining for PPARγ1 and PPARγ2 showing only PPARγ1 staining in a benign gland (left) with negative control (right). Green arrows show PPARγ1 staining. D. Examples of RNAScope staining for PPARγ1 and PPARγ2 showing PPARγ2 staining in stroma (left) and PPARγ1 and PPARγ2 in benign epithelial cells (right). Red arrows show PPARγ2, black arrows show areas of both PPARγ1 staining (green) and PPARγ2 staining (red).
Differential effects of PPARγ1 and γ2 in PC cells
Our work and that from other groups has shown that PPARγ is important in the development and progression of PC. Although PPARγ1 appears to be the only isoform expressed in human PCs, we investigated the effects of both PPARγ1 and γ2 in PC cells. We first introduced PPARγ1 or γ2 via plasmid transfection into LNCaP cells (Figure 3A), a PC cell line that lacks endogenous PPARγ expression, and quantified the growth of the cells (Figure 3C). We found that exogenous expression of PPARγ1 did not affect the growth of the cells, but that PPARγ2 expression decreased their growth (Figure 3C). Both PPARγ1 and γ2 are transcriptionally active in the transfected cells, as determined by a luciferase reporter assay using a reporter plasmid driven by a consensus PPAR response element (Figure 3B). Transfected cells were treated with the PPARγ-selective agonist pioglitazone (pio), which increased expression of the luciferase reporter in transfected cells, and the PPARγ-selective antagonist T0070907 (T007), which inhibited the pio-induced luciferase activity. T007 treatment had no effect on the growth of the transiently-transfected LNCaP cells (Figure 3C), despite inhibiting the transcriptional activity of both isoforms (Figure 3B). We next quantified the effect of exogenous expression of PPARγ1 and γ2 in a soft agar colony formation assay (Figure 3D). Similar to the effects on 2D growth, we found that expression of PPARγ1 did not affect the growth in soft agar of the cells, but that PPARγ2 inhibited it, and that growth was unaffected by treatment with T007.
Figure 3.
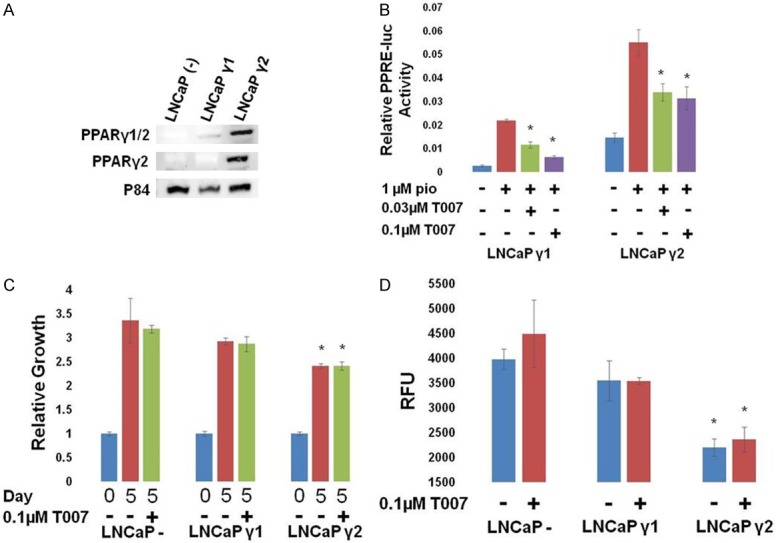
Different effects of PPARγ isoforms in LNCaP cells. LNCaP cells were transfected with vector control, PPARγ1, or PPARγ2 expression vectors along with PPRE-luc and pRL SV40 (for B). A. Western blot for expression of PPARγ1 or γ2 in transfected LNCaP cells. B. 24 hours following the treatment of transfected cells with the indicated drugs, relative luciferase activity was measured. PPARγ activity was stimulated by PPARγ agonist pioglitazone (pio), and inhibited by the PPARγ antagonist T0070907 (T007) in LNCaPs expressing either γ1 or γ2 (*P<0.05 difference from pio treated cells). C. The growth of transfected LNCaP cells relative to day 0 was measured. Exogenous expression of γ1 did not affect growth of LNCaP cells; however γ2 overexpression decreased growth of LNCaP cells. Neither was inhibited by T007 (*P<0.05 difference from control cells). D. The growth of transfected LNCaP cells in a soft agar colony forming assay was measured. Exogenous expression of γ1 did not affect growth of LNCaP colonies; however γ2 overexpression decreased growth of LNCaP cells. Neither was inhibited by T007 (*P<0.05 difference from control cells).
We next created a LNCaP cell line with constitutive expression of PPARγ1 (LCP, Figure 4A). However, we were not able to derive the complementary PPARγ2 expressing cell line. PPARγ1 was transcriptionally active in the cells and could be inhibited by T007 (Figure 4B). Interestingly, constitutive expression of PPARγ1 rendered the growth of these cells sensitive to T007 treatment in both 2D and soft agar growth assays (Figure 4C, 4D), demonstrating that these cells became dependent on PPARγ1 for growth.
Figure 4.
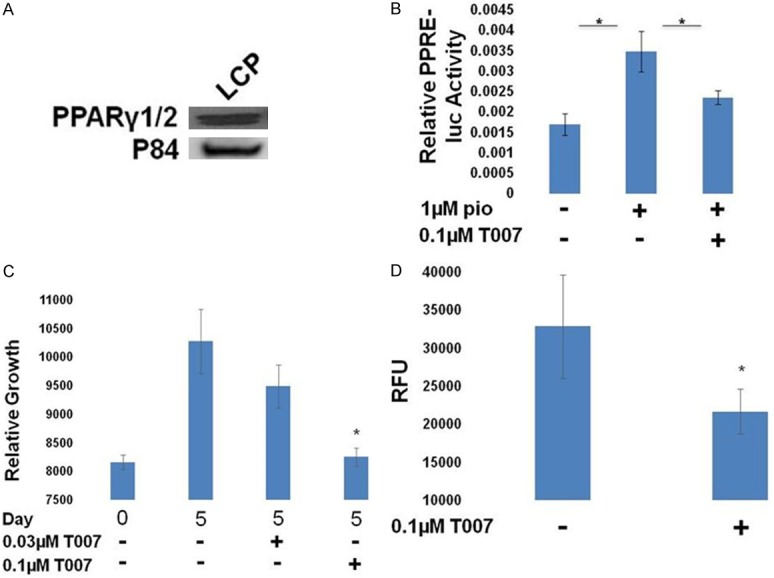
Effects of PPARγ inhibition in LCP cells. A. Western blot for expression of PPARγ in LCP cells, which are LNCaP cells with androgen receptor (AR) and PPARγ1 constitutive expression. B. Cells were transfected with PPRE-luc + pRL SV40 and treated as indicated. The following day, relative luciferase activity was measured. PPARγ activity was stimulated by pio, and inhibited by T007 in LCP cells (*P<0.05 difference from pio treated cells). C. The growth of LCP cells relative to day 0 was measured and was found to be sensitive to T007 (*P<0.05 difference from control cells). D. The growth of LCP cells in a soft agar colony forming assay was measured and was found to be inhibited by T007 (*P<0.05 difference from control cells).
Finally, we investigated the role of PPARγ1 in PC3 cells, a PC cell line that endogenously expresses PPARγ1 (Figure 5A). PPARγ1 was found to be transcriptionally active (Figure 5B) and as was observed in LCP cells, PC3 cells were sensitive to the PPARγ antagonist T007 in both 2D and soft agar growth assays (Figure 5C, 5E). Knock down of endogenous PPARγ1 by siRNA also demonstrated decreased growth in the 2D assay (Figure 5D). Our experiments in these PC cell lines suggest that PPARγ1 contributes to the proliferation of some PC cells and that PPARγ2 represses PC cell growth.
Figure 5.
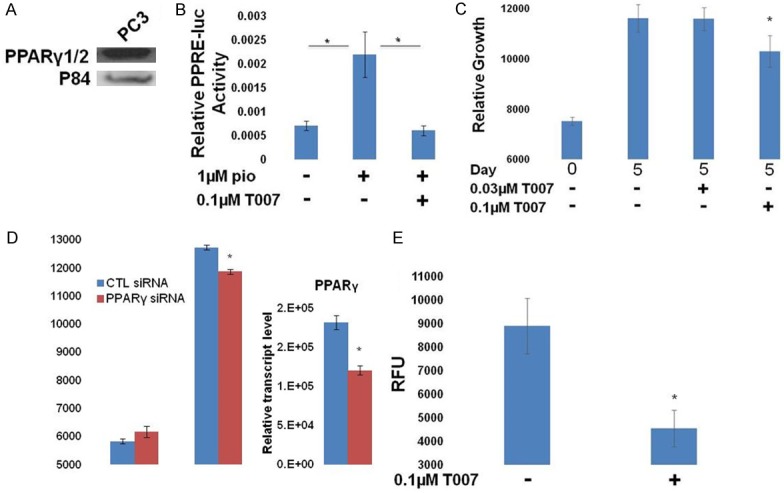
Effects of PPARγ inhibition in PC3 cells. A. Western blot demonstrating the endogenous expression of PPARγ1 in PC3 cells. B. Cells were transfected with PPRE-luc + pRL SV40 and treated as indicated. The following day, relative luciferase activity was measured. PPARγ activity was stimulated by pio, and inhibited by T007 in PC3 cells (*P<0.05 difference from pio treated cells). C. The growth of PC3 cells relative to day 0 was measured and was found to be sensitive to T007 (*P<0.05 difference from control cells). D. PC3 cells were transfected with control or PPARγ-targeted siRNAs. Growth was measured by DAPI content on day 0 and day 5 and demonstrated that PPARγ knock down inhibited the growth of these cells (left). RT-qPCR analysis demonstrates knockdown of the PPARγ1 transcript (right) (*P<0.05 difference from control cells). E. Colony growth is shown for each condition. Growth of PC3 colonies was inhibited by T007 (*P<0.05 difference from control cells).
Differential effects of PPARγ1 and γ2 in benign prostate cells
Because we observed expression of both PPARγ1 and γ2 in benign human prostate tissue, we sought to understand how they affect the growth of benign prostate cells. We first introduced PPARγ1 or γ2 into BPH1 cells, which are a benign human prostate cell line (Figure 6A) [22].
Figure 6.
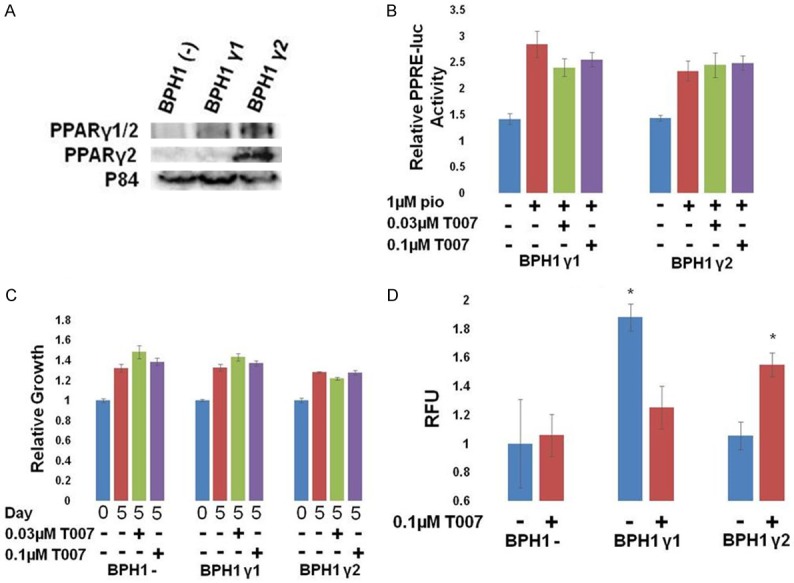
Different effects of PPARγ isoforms in BPH1 cells. BPH1 cells were transfected with vector control, PPARγ1, or PPARγ2 expressing vectors along with PPRE-luc and pRL SV40 (for B). A. Western blot for expression of PPARγ1 or γ2 in transfected BPH1 cells. B. Cells were transfected with PPRE-luc + pRL SV40 and treated as indicated. The following day, relative luciferase activity was measured. PPARγ activity was stimulated by pio but only slightly inhibited by T007. C. The growth of transfected BPH1 cells relative to day 0 was measured. Exogenous expression of either PPARγ1 or γ2 did not affect their growth and did not make them sensitive to T007. D. The growth of transfected BPH1 cells in a soft agar colony forming assay was measured. Exogenous expression of γ1 increased growth of BPH1 colonies, and was inhibited by T007. However, T007 treatment of γ2 expressing cells caused increased growth (*P<0.05 difference from control cells).
Both isoforms were active in the PPRE-luciferase assay, although the inhibition by T007 was not significant (Figure 6B). Exogenous expression of either PPARγ1 or γ2 did not affect the 2D growth of BPH1 cells, nor was their growth sensitive to the PPARγ antagonist T007 (Figure 6C). However, the ability to grow in soft agar in the colony formation assay was affected. Exogenous expression of PPARγ1 significantly increased the growth of BPH1 cells, which typically have very little ability to form colonies in this assay, and this growth was inhibited by T007 (Figure 6D). PPARγ2 did not affect growth in this assay.
Strand et al previously reported the creation of mouse prostate epithelial (mPrE) cells that express only PPARγ1 or γ2 [20]. Their experiments suggest that PPARγ1, in the absence of γ2, can cause increased cancer-like growth of mouse prostate epithelial cells when implanted in vivo, while PPARγ2 in the absence of γ1, causes a more differentiated phenotype when implanted in vivo. Using the mPrE cell lines, we demonstrated that both PPARγ1 and PPARγ2 were transcriptionally active and sensitive to T007 (Figure 7A, 7B). We found that the PPARγ1 expressing cell line grew faster than the PPARγ2 cell line in the 2D growth assay and in the soft agar growth assay (Figure 7B, 7C). 2D growth of mPrE cells expressing PPARγ1, but not those expressing PPARγ2, was inhibited by T007. Our results from the soft agar colony formation assay in both benign prostate cells tested, BPH1 and mPrE, are consistent with the findings of Strand et al [20] and suggest that PPARγ1 increases the growth and possibly the transformation of otherwise benign prostate epithelial cells.
Figure 7.
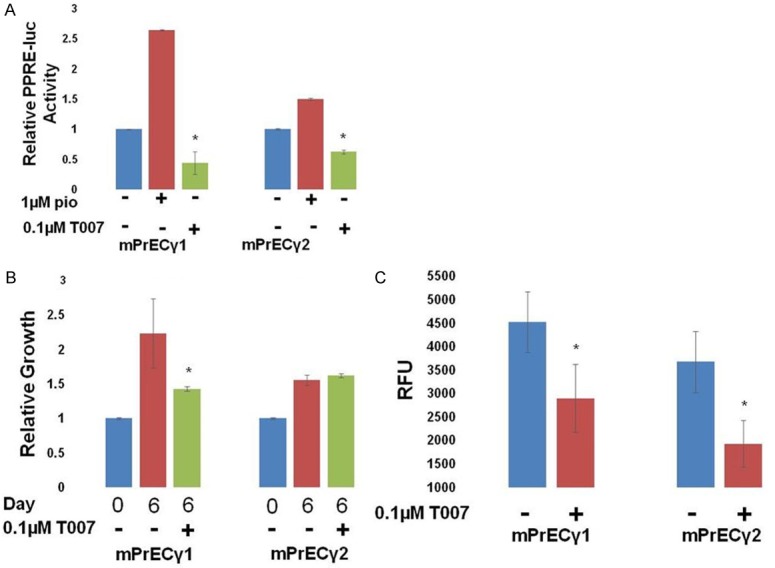
Different effects of PPARγ isoforms in mPrE cells. Benign mouse prostate epithelial (mPrE) cells were derived from PPARγ-/- mouse prostates and had γ1 or γ2 stably reintroduced [20]. They express either PPARγ1 or γ2, respectively. A. Cells were transfected with PPRE-luc + pRL SV40 and treated as indicated. The following day, relative luciferase activity was measured. PPARγ1 and γ2 activity was stimulated by pio and inhibited by T007 (*P<0.05 difference from pio treated cells). B. The growth of mPrEC cells relative to day 0 was measured. Cells expressing γ1, but not γ2, were sensitive to T007 (*P<0.05 difference from control cells). C. The growth of mPrE cells in a soft agar colony forming assay was measured and it was found that the γ1-expressing cells grew better than the γ2-expressing cells in this assay. mPrEγ growth was inhibited by T007 (*P<0.05 difference from control cells).
Discussion
PPARγ is increasingly being recognized as a major factor in PC development and progression [2,11]. However, very few studies have examined the contribution of the specific PPARγ1 and γ2 isoforms to PC. Here, we show that both are expressed in human tissue, with PPARγ1 predominating in PC cells, in many but not all local and metastatic cancers. We also demonstrate through IHC and RNA in situ hybridization that both PPARγ1 and PPARγ2 are expressed in epithelial cells of isolated benign prostate glands. These findings suggest that PPARγ1 plays a greater role in PC progression than PPARγ2. Indeed, our functional assays and the data of Strand et al support this idea and further suggest that PPARγ1 has oncogenic properties while PPARγ2 has tumor suppressive properties in prostate cells. Strand et al clearly demonstrated that expression of PPARγ1 alone in benign mouse prostate epithelial cells led to the formation of adenocarcinoma-like tissue in a mouse prostate reconstitution assay, while expression of PPARγ2 alone led to a highly differentiated phenotype [20]. We were able to model this difference in transformation potential in a soft agar colony formation assay where we found that mPRE cells expressing only PPARγ1 grew much better than their PPARγ2 counterparts, and this growth was inhibited by a PPARγ antagonist. We then showed that this phenomenon occurred in benign human cells as well, as introduction of PPARγ1, but not PPARγ2, increased the growth of BPH1 cells in the soft agar colony formation assay. Further supporting the idea of PPARγ1 as an oncogene, we found that PPARγ inhibition decreased the growth of PC cell lines with endogenous or constitutive expression of PPARγ1. Further supporting the idea of PPARγ2 as a tumor suppressor, introduction of PPARγ2 slowed the growth of LNCaP cells. We were also unable to establish a LNCaP cell line that constitutively expressed PPARγ2, perhaps because PPARγ2 decreased the growth of these cells. Although addition of PPARγ1 did not increase the growth of LNCaPs, it is possible that their growth is already so robust in our assays that it could not be much improved upon. Finally, the lack of PPARγ2 expression in human PC tissues also supports the idea that it acts as a tumor suppressor, and perhaps its expression must be lost for PC to develop and progress.
PPARγ expression has been previously reported in PC tissue; however, its expression in epithelial cells of benign human prostate glands has not, to our knowledge, been previously reported. Every prostatectomy sample examined had at least one positive benign gland, suggesting that this is a widespread phenomenon. Our IHC and RNAScope results suggest that both PPARγ1 and γ2 are expressed in benign cells. The location of the PPARγ-positive cells appears to be between the basal and fully differentiated luminal epithelial cells (Figures 1B and S1), suggesting that these may be transit amplifying or “intermediate” epithelial cells [23]. Indeed, the PPARγ-positive cells always co-stained with CK19 (Figure S1), a marker of intermediate cells [24]. Mutation of such cells has been postulated to produce PC initiating cells [23]. Although much work remains to characterize the PPARγ-positive cells and demonstrate the role of PPARγ1 or PPARγ2 in their stemness and transformation, it is interesting to speculate that these proteins are involved in the earliest stages of PC development, as it might provide an actionable target for PC prevention.
Our results help to establish different roles for PPARγ1 and PPARγ2 in prostate epithelial cells, but additional studies are warranted. Both our IHC and our RNAScope assays have room for optimization. We were unable to identify a PPARγ2-specific antibody with strong, specific staining with low background, despite testing several antibodies and many different staining conditions. Should a better antibody be developed, more human tissues should be analyzed. Likewise, the control staining for our RNAScope assay demonstrated specific, but less than optimal strength of staining, with the green probe being stronger than the red. This was likely due to the age of the FFPE slides we had available. Therefore, it is likely that the expression PPARγ1 and especially PPARγ2 (red probe) was underestimated. These probes are available for use and could be used to analyze additional slides of higher quality.
While our cell culture studies clearly demonstrate different roles for PPARγ1 and PPARγ2 in benign human prostate epithelial and PC cells, the 2D and soft agar growth assays have limitations. In the future, it will be important to extend these studies to additional cell lines, patient derived xenografts, and other in vivo models to further test the hypothesis that PPARγ1 acts as an oncogene and that PPARγ2 acts as a tumor suppressor. Should this hypothesis hold true, it would argue for the development and use of PPARγ antagonists to treat PCs that are dependent on PPARγ1 for growth. As the majority of our treatments for metastatic PC rely on inhibiting the AR, and all eventually fail, PPARγ antagonists could provide an effective alternative, as we and others have shown that they can control the growth of both AR-negative and AR-positive cells.
Acknowledgements
Research reported in this publication included work performed in Core Facilities supported by the National Cancer Institute of the National Institutes of Health under award number P30CA033572. The content is solely the responsibility of the authors and does not necessarily represent the official views of the National Institutes of Health. Thank you to Dr. Ming Jiang for sharing the mPrE cells with our lab.
Disclosure of conflict of interest
None.
Supporting Information
References
- 1.Siegel RL, Miller KD, Jemal A. Cancer statistics, 2015. CA Cancer J Clin. 2015;65:5–29. doi: 10.3322/caac.21254. [DOI] [PubMed] [Google Scholar]
- 2.Tew BY, Hong TB, Otto-Duessel M, Elix C, Castro E, He M, Wu X, Pal SK, Kalkum M, Jones JO. Vitamin K epoxide reductase regulation of androgen receptor activity. Oncotarget. 2017;8:13818–13831. doi: 10.18632/oncotarget.14639. [DOI] [PMC free article] [PubMed] [Google Scholar]
- 3.Rosen ED, Spiegelman BM. PPARgamma: a nuclear regulator of metabolism, differentiation, and cell growth. J Biol Chem. 2001;276:37731–37734. doi: 10.1074/jbc.R100034200. [DOI] [PubMed] [Google Scholar]
- 4.Butler R, Mitchell SH, Tindall DJ, Young CY. Nonapoptotic cell death associated with S-phase arrest of prostate cancer cells via the peroxisome proliferator-activated receptor gamma ligand, 15-deoxy-delta12,14-prostaglandin J2. Cell Growth Differ. 2000;11:49–61. [PubMed] [Google Scholar]
- 5.Hisatake JI, Ikezoe T, Carey M, Holden S, Tomoyasu S, Koeffler HP. Down-regulation of prostate-specific antigen expression by ligands for peroxisome proliferator-activated receptor gamma in human prostate cancer. Cancer Res. 2000;60:5494–5498. [PubMed] [Google Scholar]
- 6.Kubota T, Koshizuka K, Williamson EA, Asou H, Said JW, Holden S, Miyoshi I, Koeffler HP. Ligand for peroxisome proliferator-activated receptor gamma (troglitazone) has potent antitumor effect against human prostate cancer both in vitro and in vivo. Cancer Res. 1998;58:3344–3352. [PubMed] [Google Scholar]
- 7.Mueller E, Smith M, Sarraf P, Kroll T, Aiyer A, Kaufman DS, Oh W, Demetri G, Figg WD, Zhou XP, Eng C, Spiegelman BM, Kantoff PW. Effects of ligand activation of peroxisome proliferator-activated receptor gamma in human prostate cancer. Proc Natl Acad Sci U S A. 2000;97:10990–10995. doi: 10.1073/pnas.180329197. [DOI] [PMC free article] [PubMed] [Google Scholar]
- 8.Qin L, Gong C, Chen AM, Guo FJ, Xu F, Ren Y, Liao H. Peroxisome proliferator-activated receptor gamma agonist rosiglitazone inhibits migration and invasion of prostate cancer cells through inhibition of the CXCR4/CXCL12 axis. Mol Med Rep. 2014;10:695–700. doi: 10.3892/mmr.2014.2232. [DOI] [PubMed] [Google Scholar]
- 9.Shiau CW, Yang CC, Kulp SK, Chen KF, Chen CS, Huang JW, Chen CS. Thiazolidenediones mediate apoptosis in prostate cancer cells in part through inhibition of Bcl-xL/Bcl-2 functions independently of PPAR-gamma. Cancer Res. 2005;65:1561–9. doi: 10.1158/0008-5472.CAN-04-1677. [DOI] [PubMed] [Google Scholar]
- 10.Yang CC, Wang YC, Wei S, Lin LF, Chen CS, Lee CC, Lin CC, Chen CS. Peroxisome proliferator-activated receptor gamma-independent suppression of androgen receptor expression by troglitazone mechanism and pharmacologic exploitation. Cancer Res. 2007;67:3229–3238. doi: 10.1158/0008-5472.CAN-06-2759. [DOI] [PubMed] [Google Scholar]
- 11.Ahmad I, Mui E, Galbraith L, Patel R, Tan EH, Salji M, Rust AG, Repiscak P, Hedley A, Markert E, Loveridge C, van der Weyden L, Edwards J, Sansom OJ, Adams DJ, Leung HY. Sleeping Beauty screen reveals Pparg activation in metastatic prostate cancer. Proc Natl Acad Sci U S A. 2016;113:8290–5. doi: 10.1073/pnas.1601571113. [DOI] [PMC free article] [PubMed] [Google Scholar]
- 12.Rogenhofer S, Ellinger J, Kahl P, Stoehr C, Hartmann A, Engehausen D, Wieland WF, Muller SC, Hofstadter F, Walter B. Enhanced expression of peroxisome proliferate-activated receptor gamma (PPAR-gamma) in advanced prostate cancer. Anticancer Res. 2012;32:3479–3483. [PubMed] [Google Scholar]
- 13.Segawa Y, Yoshimura R, Hase T, Nakatani T, Wada S, Kawahito Y, Kishimoto T, Sano H. Expression of peroxisome proliferator-activated receptor (PPAR) in human prostate cancer. Prostate. 2002;51:108–16. doi: 10.1002/pros.10058. [DOI] [PubMed] [Google Scholar]
- 14.Tagalakis V, Tamim H, Blostein M, Collet JP, Hanley JA, Kahn SR. Use of warfarin and risk of urogenital cancer: a population-based, nested case-control study. Lancet Oncol. 2007;8:395–402. doi: 10.1016/S1470-2045(07)70046-3. [DOI] [PubMed] [Google Scholar]
- 15.Tagalakis V, Tamim H. The effect of warfarin use on clinical stage and histological grade of prostate cancer. Pharmacoepidemiol Drug Saf. 2010;19:436–439. doi: 10.1002/pds.1943. [DOI] [PubMed] [Google Scholar]
- 16.Pengo V, Noventa F, Denas G, Pengo MF, Gallo U, Grion AM, Iliceto S, Prandoni P. Long-term use of vitamin K antagonists and incidence of cancer: a population-based study. Blood. 2011;117:1707–1709. doi: 10.1182/blood-2010-08-304758. [DOI] [PubMed] [Google Scholar]
- 17.Pottegard A, Friis S, Hallas J. Cancer risk in long-term users of vitamin K antagonists: a population-based case-control study. Int J Cancer. 2013;132:2606–2612. doi: 10.1002/ijc.27905. [DOI] [PubMed] [Google Scholar]
- 18.Tontonoz P, Hu E, Graves RA, Budavari AI, Spiegelman BM. mPPAR gamma 2: tissue-specific regulator of an adipocyte enhancer. Genes Dev. 1994;8:1224–1234. doi: 10.1101/gad.8.10.1224. [DOI] [PubMed] [Google Scholar]
- 19.Tontonoz P, Hu E, Spiegelman BM. Stimulation of adipogenesis in fibroblasts by PPAR gamma 2, a lipid-activated transcription factor. Cell. 1994;79:1147–1156. doi: 10.1016/0092-8674(94)90006-x. [DOI] [PubMed] [Google Scholar]
- 20.Strand DW, Jiang M, Murphy TA, Yi Y, Konvinse KC, Franco OE, Wang Y, Young JD, Hayward SW. PPARgamma isoforms differentially regulate metabolic networks to mediate mouse prostatic epithelial differentiation. Cell Death Dis. 2012;3:e361. doi: 10.1038/cddis.2012.99. [DOI] [PMC free article] [PubMed] [Google Scholar]
- 21.Wang F, Flanagan J, Su N, Wang LC, Bui S, Nielson A, Wu X, Vo HT, Ma XJ, Luo Y. RNAscope: a novel in situ RNA analysis platform for formalin-fixed, paraffin-embedded tissues. J Mol Diagn. 2012;14:22–29. doi: 10.1016/j.jmoldx.2011.08.002. [DOI] [PMC free article] [PubMed] [Google Scholar]
- 22.Hayward SW, Dahiya R, Cunha GR, Bartek J, Deshpande N, Narayan P. Establishment and characterization of an immortalized but non-transformed human prostate epithelial cell line: BPH-1. In Vitro Cell Dev Biol Anim. 1995;31:14–24. doi: 10.1007/BF02631333. [DOI] [PubMed] [Google Scholar]
- 23.van Leenders GJ, Schalken JA. Epithelial cell differentiation in the human prostate epithelium: implications for the pathogenesis and therapy of prostate cancer. Crit Rev Oncol Hematol. 2003;46(Suppl):S3–10. doi: 10.1016/s1040-8428(03)00059-3. [DOI] [PubMed] [Google Scholar]
- 24.Walker MM, Ellis SM, Auza MJ, Patel A, Clark P. The intercellular adhesion molecule, cadherin-10, is a marker for human prostate luminal epithelial cells that is not expressed in prostate cancer. Mod Pathol. 2008;21:85–95. doi: 10.1038/modpathol.3800988. [DOI] [PubMed] [Google Scholar]
Associated Data
This section collects any data citations, data availability statements, or supplementary materials included in this article.


