Abstract
How the genomic features of a patient’s cancer relate to individual disease kinetics remains poorly understood. We leveraged the indolent growth dynamics of chronic lymphocytic leukaemia (CLL) to analyse growth rates and genomic patterns of leukaemia cells from 107 CLL patients, spanning decades-long disease courses. We found that CLL commonly demonstrates not only exponential expansion but also logistic growth, which is sigmoidal and reaches a certain steady state level. Each growth pattern was associated with marked differences in genetic composition, pace of disease progression and extent of clonal evolution. In a subset of patients, whose serial samples underwent next-generation sequencing, we found that dynamic changes in the CLL disease course were shaped by the genetic events that were already present in earliest indolent stages. Finally, by analysing growth rates of subclones compared to their parental clones, we quantified the growth advantage conferred by putative CLL drivers in vivo.
Keywords: Chronic lymphocytic leukaemia, CLL, clonal evolution, cancer growth dynamics, cancer genetics, carrying capacity, cancer growth rate, logistic growth
Introduction
Although we have gained a wealth of knowledge from recent genomic characterization of cancer, the linking of genetic features of individual cancers with their phenotype has been largely lacking. The rate and pattern of growth can vary amongst cancer patients, and various growth patterns have been used to describe cancer expansion1–10. The two most commonly used models are exponential unbounded growth and sigmoidal growth, which stabilizes at a specific carrying capacity (e.g. logistic growth). However, to date, validations of cancer growth patterns have either relied on samples with few data points per tumour or have come from in vitro or murine studies.
Chronic lymphocytic leukaemia (CLL) is an informative model system for studying natural cancer growth, as it has a highly variable but often relatively indolent course, with treatment commonly withheld for months to decades until clinically necessary11. Temporally dense tumour measurements are feasible through serial venipuncture, enabling the analysis of growth dynamics. The availability of highly pure tumour samples has already yielded rich unbiased genetic characterization, leading to our current detailed understanding of genomic attributes in CLL12–16. Herein, we undertake an integrative analysis of genetic data, clinical information, and growth dynamics, including quantification of the effect of cancer mutations on growth rates measured in serial samples collected from 21 patients prior to therapy. We then corroborated the results in 86 independent CLL patients, improving our understanding of the relationship between genotypes and phenotypes in cancer. Thus, we established a methodology and quantitative framework to model cancer growth observed directly from human patients, helping explain the variation in the clinical behaviour of CLL.
Results
Distinguishable patterns of growth and genetic evolution in CLL
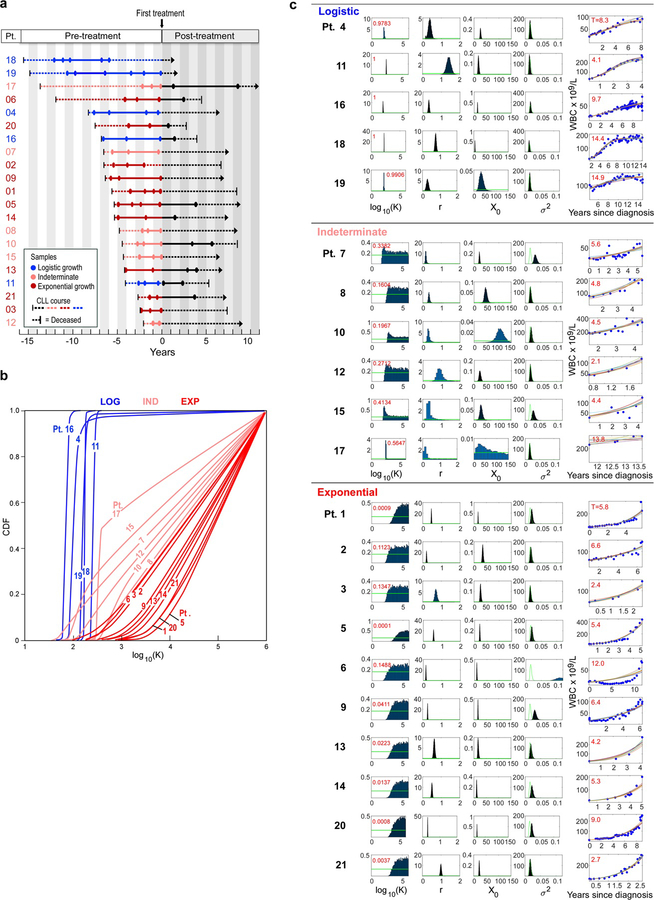
We identified 21 CLL patients with serial samples collected between diagnosis and first treatment (Supplementary Table 1a). Time to initiation of treatment ranged from 2.1 to 15.6 (median 5.7) years. The cohort was balanced for the strong prognostic marker of IGHV mutational status (Methods)17. To assess the overall growth of the leukaemia in each patient, we evaluated 4 to 83 (median 22) pre-treatment measurements of peripheral white blood cell (WBC) counts per patient. A subset of patients exhibited bounded growth, with WBC counts plateauing over time, suggesting the leukaemia displays logistic-like behaviour, while another distinct subset clearly demonstrated an exponential-like growth pattern (Extended Data Figure 1b, Figures 1a-b). We therefore devised a unified Bayesian model based on a logistic pattern, as it can model both predominant growth behaviours. In this context, growth rate r and carrying capacity (K) were estimated using a Markov Chain Monte Carlo (MCMC) Gibbs sampler (Methods). Patient WBC dynamics that resulted in carrying capacity posteriors confidently below 1000 × 109 cells/L were classified as exhibiting logistic (LOG) growth, while those confidently above 1000 × 109 cells/L were categorized as displaying exponential-like (EXP) growth. Those cases that could not be confidently attributed to either of the categories were classified as having indeterminate (IND) growth patterns.
Figure 1. Growth dynamics and genetic changes in naturally progressing CLL.
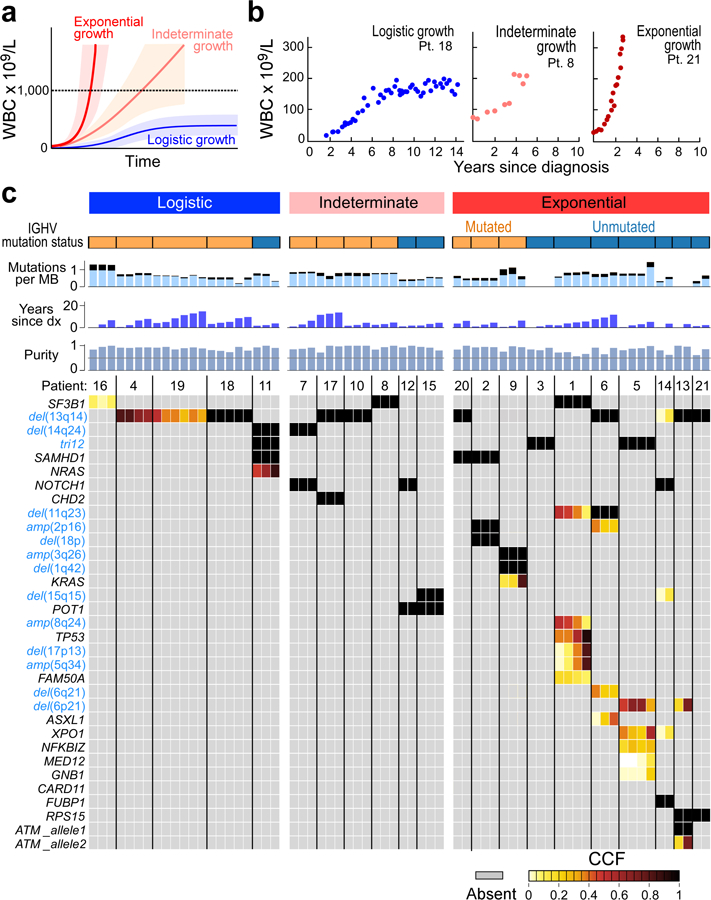
a, Schema of diverse growth patterns observable in CLL samples. b, Illustrative patient white blood count (WBC) dynamics over the period between diagnosis and start of treatment. c, Putative CLL drivers detected by analysis of whole-exome sequencing (WES) analysis of pre-treatment serial samples from 21 patients, with assigned growth patterns, IGHV status. Cancer cell fractions (CCF) of mutations are indicated.
Using this classification scheme, five patients exhibited LOG growth behaviour, with stabilization at estimated carrying capacities (CC) of 71 to 264 × 109 cells/L (Methods). In 10 patients, the CLL cells exhibited EXP growth, with growth rates of 14% to 99% relative population increase per year (median: 48%/year). Finally, in 6 patients, CLL growth could not be categorized with certainty as either LOG or EXP, either because of the short period of observation (Pts 12, 17) or complex patterns of growth (Pts 7, 8, 10 15) (Extended Data Figure 1c, Supplementary Table 1). CLLs with LOG growth tended to have a longer time to treatment, with a median of 8.3 years [range 4.1–15.6] vs. 5.6 years [2.4–11.9] for EXP patients and 4.6 years [2.1–13.7] for the IND category, however this difference was not significant across the three groups (P=0.19, Kruskal-Wallis; Supplementary Table 1a). Patients with LOG growth (4 of 5) tended to have mutated IGHV, a favourable prognostic marker, compared to patients with EXP growth (3 of 10) (P=0.12; Figure 1c).
To examine whether genetic differences underlie the distinct patterns of growth, we performed whole-exome sequencing (WES; median coverage of 107X), on a median of 3 (range 2–6) CLL samples per patient collected prior to receiving therapy, spanning 0.77 to 10.62 (median 3.28) years between first and last available pre-treatment timepoints (Supplementary Table 1b; Supplementary Table 2). Consistent with prior studies12,13, we detected a median overall somatic mutation frequency of 0.79/Mb across patients, with frequencies of 0.19/Mb of silent events and 0.60/Mb for non-silent sSNVs and 0.031/Mb for insertions and deletions (sINDELs) (Supplementary Table 3). In addition, we identified somatic copy number alterations (sCNAs) directly from the WES data (Supplementary Table 4).
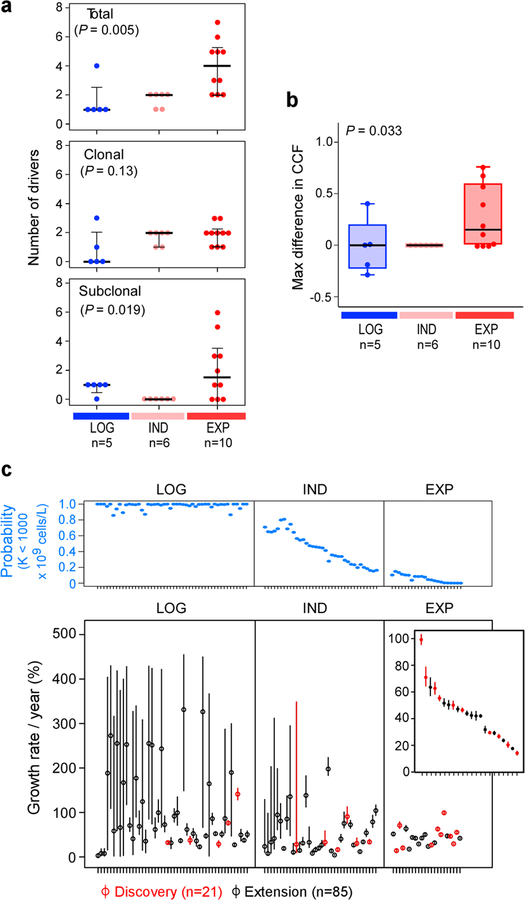
By comparing against previously identified putative CLL drivers12,13 (Supplementary Tables 5 and 6), we identified at least one driver in all 21 patients. We further examined whether the detected CLL drivers were clonal or subclonal by inferring their cancer cell fraction (CCF) (Methods15). The total number of driver mutations was lowest in patients whose CLLs demonstrated LOG growth (median 1, range 1–4) compared to those with IND (median 2, range 1–2), or EXP growth (median 4, range 2–7) (P = 0.005). We identified a trend towards a higher number of clonal drivers and an increased number of subclonal drivers in samples with EXP growth compared to those with LOG or IND growth (P = 0.13 and 0.019, respectively). Finally, we saw that, even without therapy, clones with CLL drivers, occurring in samples with EXP growth, exhibited larger shifts in their clonal fractions compared to ones with IND and LOG growth (P = 0.033; Extended Data Figure 2a–b). Most subclones with drivers present at the time of treatment were already detectable in the earliest samples.
Validation of global growth patterns
To confirm these findings, we studied an independent cohort of samples collected from 85 patients with prior characterization by WES, having at least 4 consecutive pre-treatment WBC measurements no more than 2 years apart (Methods)14,15. Unlike the discovery cohort, patients in the extension cohort were not specifically selected to have undergone subsequent treatment. WES was performed on samples collected at a median of 2.2 years (range 0, 18.9) after diagnosis. Of the 38 patients who subsequently underwent treatment, the median time from diagnosis to treatment was 2.6 years (range 0, 18.9) (Supplementary Table 7). A median of 18 (range 4–73) pre-treatment measurements of circulating WBCs were available per patient.
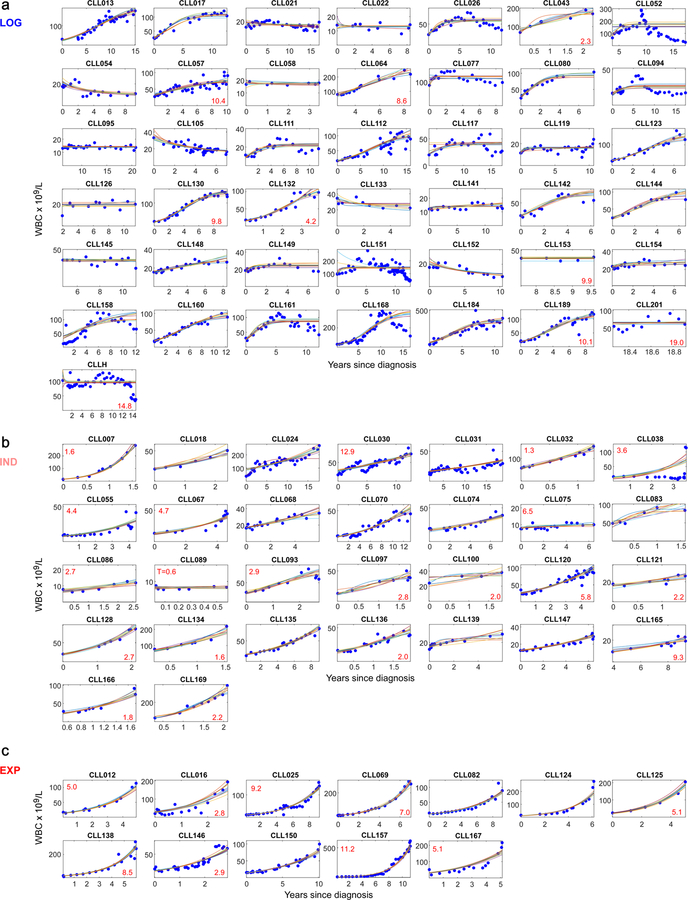
As for the discovery cohort, we classified these 85 patients into LOG, EXP and IND growth categories (Methods, Supplementary Table 8). Of 85 CLLs, 43 (51%) showed LOG growth (median estimated CC of 70 × 109 cells/L, range 4–360), 12 showed EXP growth (14%; median growth rate 44, range 17–64%), and 30 had IND growth (35%; median growth rate 33%, range 4–197%) (Figure 2a–c, Extended Data Figure 2c–3). Within CLLs categorized as having IND growth, 13 of 30 (43%) had a short period of observation, 15 (50%) had a pattern of growth that appeared intermediate between LOG and EXP or was complex; and 2 (7%) had unevenly distributed data.
Figure 2. Integrative analysis of global CLL growth patterns and genetic attributes in an extension cohort.
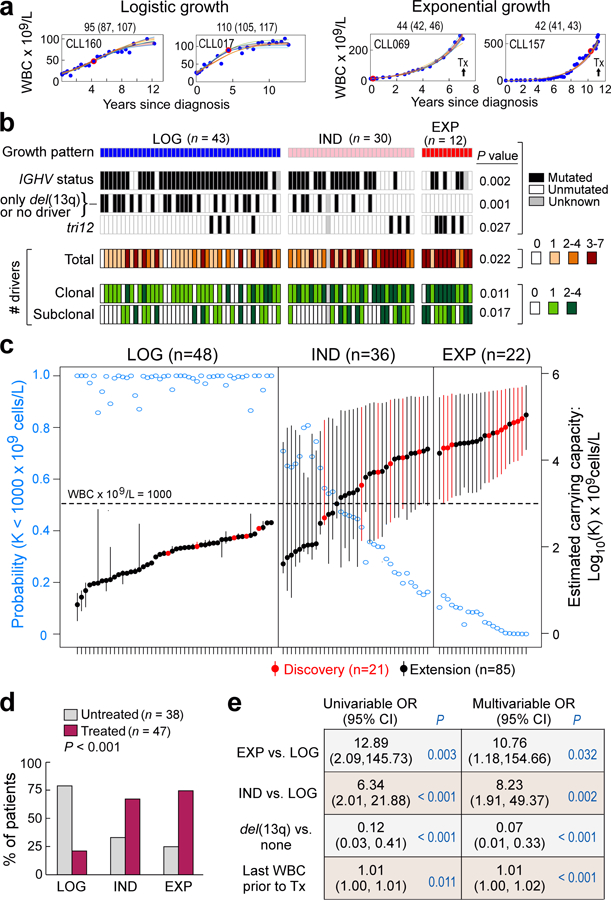
a, Examples of logistic (LOG; level of carrying capacity CC) and exponential (EXP; growth rate [% per year)] growth patterns (70% credible intervals provided above each graph). Arrow indicates that patient received treatment. Red dot – time of WES sampling, b, Associations between growth patterns with IGHV status, del(13q) or no driver, trisomy 12 and numbers of total, clonal and subclonal drivers (two-sided Fisher’s exact test). c, Estimated CC (with 70% credible intervals, right axis) for patients with LOG, indeterminate (IND) and EXP growth, defined based on probability of CC posteriors (left axis), from discovery (red) and extension (black) cohorts, n indicates number of independent patients. d, Patients with EXP growth were more likely to require treatment (two-sided Fisher’s exact test). e, Exact logistic regression modelling of need for treatment related to growth pattern for 79 patients having WES of a pre-treatment sample and FISH data, odds ratio (OR) provided with 95% confidence intervals (Extended Data Table 1).
Consistent with the results in the discovery cohort, we again found that IGHV mutated status was most enriched in patients with LOG growth (P = 0.002). Similarly, we found a difference in the number of total, clonal and subclonal drivers among the groups, with larger values in patients with EXP growth (P= 0.022, P= 0.011 and P= 0.017, respectively; Figure 2b, Supplementary Table 7a, Supplementary Table 7b). Even among the 42 patients with known IGHV status in the LOG group, the 4 patients with unmutated IGHV had higher CC compared to the 38 patients with mutated IGHV (median of 189.2 × 10⁹ vs. 64.4 × 10⁹ cells/L; P = 0.017). We observed that samples with LOG growth had a higher proportion of patients that had either no known driver event or only del(13q) (51% LOG, 24% IND and 0% EXP; P= 0.001). Also, the EXP group had a higher proportion with trisomy 12 compared to the IND and LOG cases (42% vs. 10% vs. 9%, P=0.027).
More patients with EXP and IND growth progressed to treatment than those with LOG growth (75%, 67%, 21%, P<0.001) (Figure 2d). We modelled the probability of treatment using univariable exact logistic regression and stepwise multivariable logistic regression. We considered age, sex, growth pattern (EXP vs. LOG, IND vs LOG), IGHV status, FISH cytogenetics, number of drivers, and maximum and last available WBC count prior to treatment as potential covariates to assess their relative contribution to clinical outcome (Methods). In univariable analysis, growth pattern, IGHV status, del(13q), last available WBC count and number of total and clonal drivers were significant. The final multivariable model included growth rate pattern, del(13q) and last WBC (Extended Data Table 1). Growth pattern contributed significantly (for EXP vs LOG: P=0.032; and for IND vs LOG: P=0.002) to a model which already included del(13q) and last available WBC count (Figure 2e).
Growth patterns and evolution of relapse
Since clonal shifts were common in CLLs with more aggressive growth pattern, we asked if growth pattern also impacted clonal evolution following therapy. Of the 21 patients in the discovery cohort, 12 relapsed (median time from first until next treatment 1.88 years [range 0.52–5.56]). Ten of these 12 patients had available post-treatment samples, which we also characterized by WES.
Six of these 10 patients had clear evidence of clonal evolution, characterized by a significant shift in CCF (by 11–100%; Methods) in at least one subclone (Figure 3a, Extended Data Figure 4a, Supplementary Table 9). In the other 4 patients, subclones retained interclonal balance even after cytoreductive treatment (Figure 3a, Extended Data Figure 4b). In two of 6 evolving leukaemias, we observed evidence of convergent evolution, with multiple branches impacting the same pathway. In Patient 5, clone 5 with GNB1-I80T disappeared, but a distinct clone with GNB1-I80N emerged together with a CDKN2A mutation. In Patient 13, one allele of ATM was clonally mutated and the second allele had a distinct subclonal mutation of ATM. Following chemotherapy, the mutated ATM subclone was replaced by an expanding clone with del(11q) encompassing ATM and BIRC3 on one allele, and two mutations in BIRC3 on the other. The 4 other patients with clonal evolution upon relapse also revealed emergence of clones with driver events (Extended Data Figure 4). All six patients with therapy-related CLL clonal evolution exhibited EXP growth pre-treatment (14–99%/year). By contrast, those with preserved clonal architecture despite therapy were CLLs having either LOG or IND growth (with growth rates <31%/year) (Figure 3a–b, Extended Data Figure 4). In patients from our previously reported study,15 we found a similar association (Methods, Supplementary Table 1c). Three of the 4 patients with data available to evaluate growth patterns had evolving clonal structure upon relapse and an IND or EXP growth pattern prior to treatment (growth rates of 32, 64 and 138%/year), while the fourth patient with preserved clonal architecture despite therapy exhibited IND growth (Figure 3, asterisked bars). Overall, these results support the close association between leukaemia growth prior to treatment and clonal evolution following chemotherapy (P=0.003).
Figure 3. Treatment-associated evolution in relation to leukaemia growth patterns.
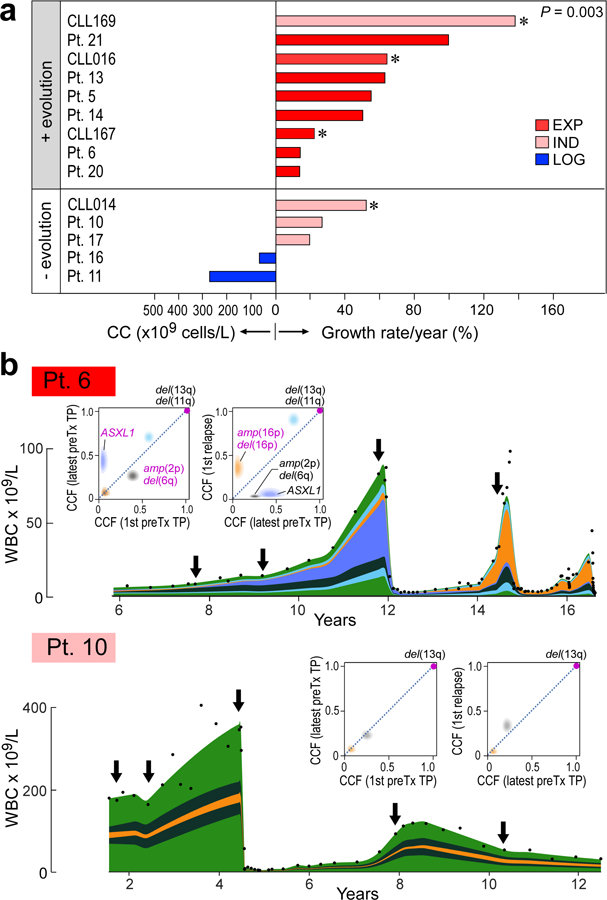
a, Pre-treatment growth pattern for 10 patients of the discovery cohort and 4 previously reported patients15 (asterisked) are related to presence (upper group) or absence (bottom group) of clonal evolution upon relapse (two-sided Fisher’s exact test). b, Examples of integrated WBC dynamics (black dots indicate measurements) and genetic evolution between diagnosis and relapse for exponential growth and evolving subclones (Patient 6), or indeterminate growth and inter-clonal balance (Patient 10). Colours indicate subclones. Arrows indicate timing of samples. Insets—2D visualizations of changes in CCF across timepoints (TP).
Growth patterns of subclones
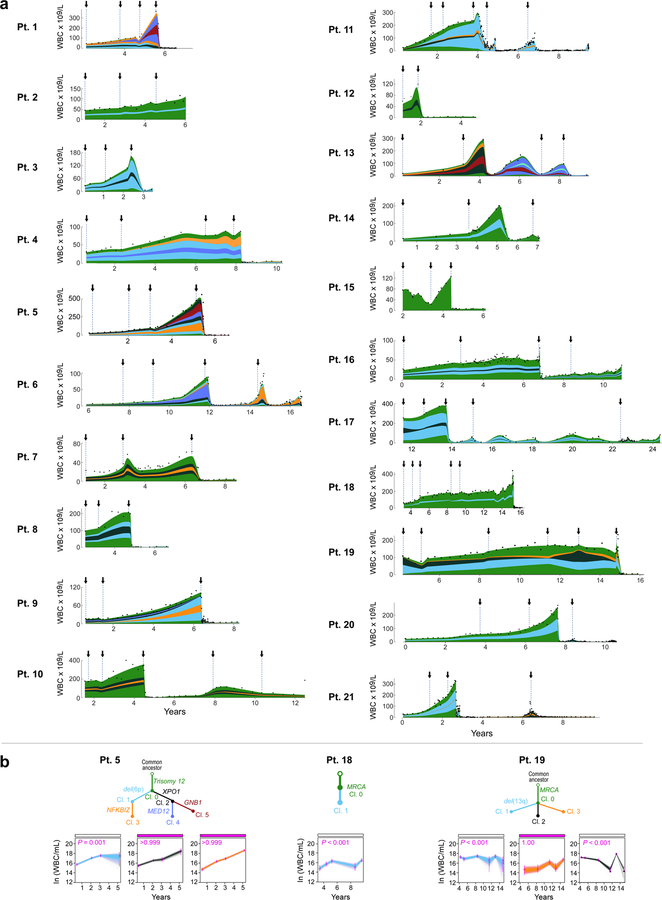
To identify if distinct growth dynamics could be discerned amongst subclones underlying the overall growth patterns, we used information from macroscopic subclones (i.e. having CCFs of ≥ 10% at one or more timepoints) to derive likely phylogenies for each patient (Methods, Supplementary Table 10, Extended Data Figures 5–7). Using PhylogicNDT18, we identified subclones by n-dimensional clustering of CCFs of individual events across samples, estimated their phylogenetic relationships and modelled the growth dynamics of each subclone (Methods). We focused on the 5 patients with WES from 4 or more pre-treatment time points (Patients 1, 4, 5, 18, and 19).
Of interest, even with overall LOG growth in the leukaemias of Patients 4, 18 and 19, a number of subclones displayed behaviour consistent with EXP growth. Two of 4 subclones (clones 1 and 3) of Patient 4 had plateauing growth rates and even decline at the latest time point (Figure 4a). By contrast, growth of clone 2 was consistent with EXP growth, providing in vivo evidence of competition amongst subclones within an overall picture of LOG growth of the bulk tumour. Possibly, the growth pattern of this CLL would become EXP upon takeover of the cancer cell population by clone 2. In the other two patients, most clones exhibited complex dynamics that did not follow simple exponential or logistic patterns (Extended Data Figure 6b). Clone 3 of Patient 19 exhibited mild exponential growth over time. The other clones were mostly stable with fluctuations in their abundance. Thus, for cases with overall LOG growth, we observed that complex underlying intraclonal dynamics can result in net carrying capacity.
Figure 4. Subclonal growth patterns in untreated CLLs.
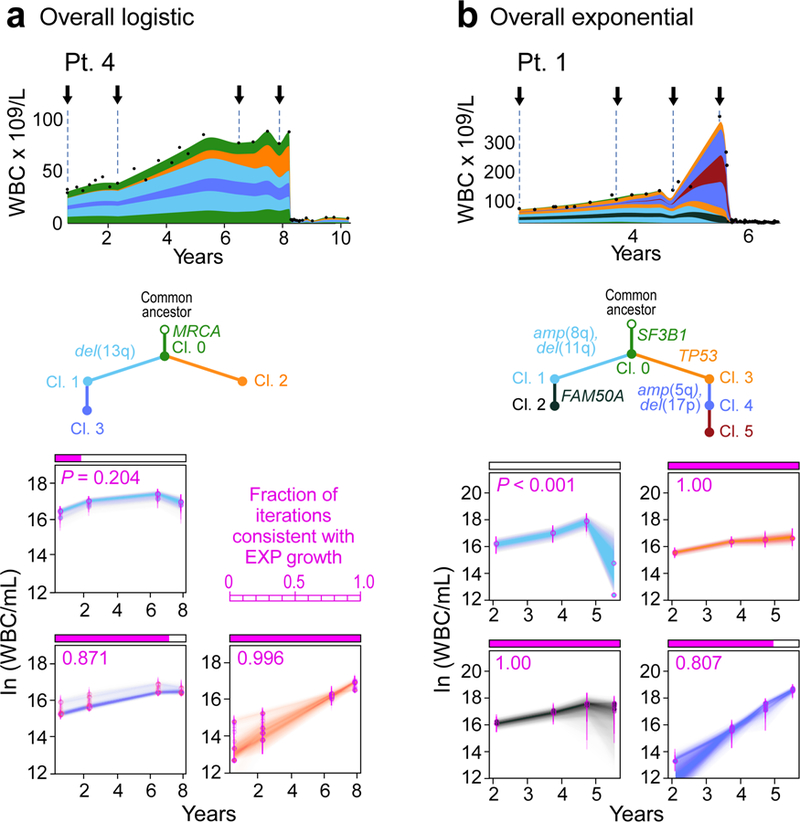
Subclonal CLL growth patterns, estimated using PhylogicNDT, in overall logistic growth (a) and overall exponential growth (b). P-values represent significance of rejecting the null hypothesis of exponential growth, based on the proportion of Markov Chain Monte Carlo (MCMC) iterations (magenta). The natural logarithms of numbers of cells in each clone (WBC/mL) are plotted against years from diagnosis. Error bars and trajectories represent uncertainties estimated by the MCMC. Analysis of Patients 5, 18 and 19 in Extended Data Figure 6b, and associated WGS analysis in Extended Data Figures 8–9.
Patients 1 and 5, who had CLL with EXP growth, likewise revealed diverse interclonal dynamics (Figure 4b, Extended Data Figures 6, 7). The majority of clones in Patient 1 exhibited EXP growth patterns, with the later subclone (clone 4) showing faster exponential growth. In Patient 5, the strongly growing subclones (clones 4 and 5) were only present in the last two timepoints, and thus we only tested clones 1–3 for behaviour consistent with EXP growth. While the growth pattern of clone 1 did not fit an exponential pattern, both branches (clones 2 and 3) appeared to contribute to the overall EXP growth pattern of this case.
For added confidence and validation of WES results, we additionally performed whole-genome sequencing (WGS) analysis of serial samples from a subset of cases with EXP (Patients 1 and 6) and LOG (Patient 4) growth patterns. The WGS results were concordant with the WES, while providing narrower credible intervals on the subclonal composition due to a ~10-fold higher number of mutations per clone (Methods, Extended Data Figures 8, 9a–e).
Growth advantage of subclonal drivers
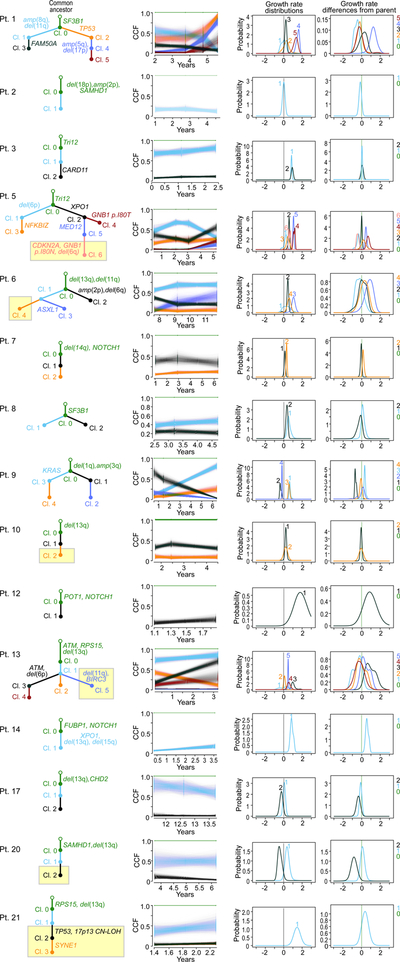
To quantify the growth advantage of individual subclones, we calculated growth rate differences (ΔGR) between child and parent clones (Methods). We evaluated whether subclonal growth rates differed based on presence or absence of known CLL drivers and if they had significant selective advantage compared to the parent clone (Prob[ΔGR>0] > 0.95, which corresponds to P<0.05) (Supplementary Table 11). We focused this analysis on the 35 subclones detected in 16 patients whose leukaemias displayed overall non-logistic WBC expansion (since those with overall LOG growth lacked abundant drivers). We inferred the distribution of growth rates of individual subclones and the differences to their parents using an MCMC algorithm that samples an ensemble of likely phylogenetic trees for each patient (PhylogicNDT GrowthKinetics18; Methods). The model also takes into account the reads supporting each somatic mutation, tumour purity, absolute copy-number, and the WBC measurements (Extended Data Figure 5d).
Indeed, 7 subclones from 6 patients (Patients 1, 5, 6, 9, 13 and 14) contained a known CLL driver and their growth was significantly higher compared to their parent subclone (Figure 5a, Extended Data Figure 9f). The strongest acceleration was associated with a second hit in the tumour suppressor genes TP53 or ATM (ΔGR of 127% and 90%/year for clone 4 of Patient 1 and clone 2 of Patient 13, respectively). For Patient 14, a subclone with multiple driver mutations (XPO1, del(13q) del(15q)) also expanded more rapidly than its parent (ΔGR of 57%/year). The CLL of Patient 5 showed high overall growth driven by the two independent subclones containing mutations in MED12 and GNB1 (ΔGRs of 41%, and 78%/year, respectively). We further saw strong growth acceleration in Patient 6 (ASXL1; ΔGR of 82%/year) and in Patient 9 (KRAS, ΔGR of 34%/year). These analyses provide an in vivo measurement and functional evidence of the cancer driving capacity of these mutations. One subclone (from Patient 7) had a growth rate indicative of a fitness advantage compared to its parent but without a known CLL driver (Extended Data Figure 9g). Its estimated ΔGR was lower than that of subclones with known drivers (ΔGR of 16% (+/− 10%)/year). Another set of 8 subclones from 4 patients were identified to have mutations in known CLL drivers, but lacked significant growth advantage compared to their parent subclone (e.g. clone 2 in Patient 3 with mutated CARD11; ΔGR 10%, P=0.20; Extended Data Figure 9h). Finally, more than half of the subclones (19 of 35) from 12 patients appeared as ‘passenger’ subclones with no relative advantage compared to the parental clones and without any known CLL driver. These subclones possibly represent genetic drift19,20 or may have had an advantage for a short period of time (e.g. clone 1 in Patient 10, Figure 5b). In 7 of 16 patients, we observed more than one class of subclonal growth simultaneously (Extended Data Figure 7). Subclones with known CLL drivers were more likely to have accelerated growth relative to their parent (15 clones, median ΔGR of 0.23 [IQR 0.02 to 0.71]) compared to subclones without additional known drivers (20 clones, with median ΔGR of −0.07 [IQR −0.23 to 0.13]; P = 0.013, in a linear mixed model) (Figure 5c).
Figure 5. Selective growth advantage of subclones in CLL.
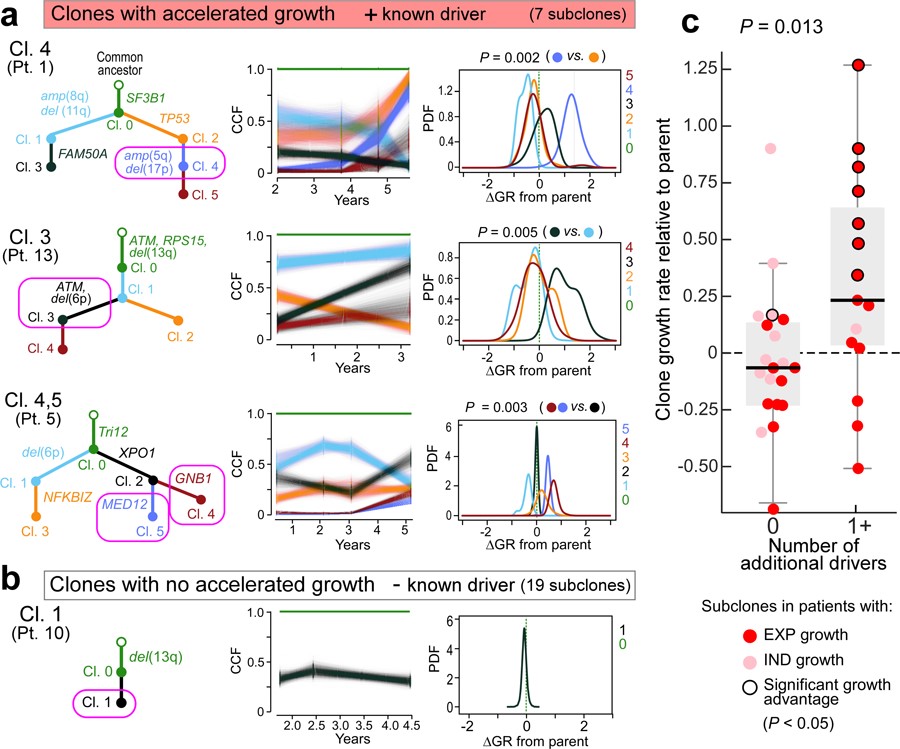
Examples for subclones (magenta circles) with a, significant growth advantage relative to their parent and known drivers and b, a subclone without driver and no growth acceleration. Results from PhylogicNDT analysis include: most likely phylogenetic tree (left); permutations of sSNVs during tree construction yielding posterior CCFs of the clusters (with 95% credible intervals) (middle); and growth rates relative to parental clones (right). Significance of differential growth rate (ΔGR>0) was estimated based on the MCMC. c, Linear mixed model for difference between clones without (n=20) and with (n=15) putative CLL drivers. Black outline - significant growth advantage. Horizontal black line indicates median values, with whiskers extending to minimum and maximum values on the boxplots.
Finally, Patients 1, 5, 6, 9, and 13 CLL had subclones with accelerated growth and branched phylogenies, providing opportunities for examining relative fitness of drivers within specific genetic contexts. For example, acquisition of amp(5q34) and del(17p) in clone 4 (Patient 1) appears to confer faster growth than clones with TP53 mutation alone (clone 2), del(11q) alone (clone 1) or with FAM50A mutation (clone 3) in the context of clonal SF3B1 mutation. Likewise, in Patient 6, clone 3 had mutation in ASXL1 in the context of clonal del(13q) and del(11p) and expanded faster than a sibling clone having amp(2p) and del(6q). With sufficiently large multi-timepoint sequencing datasets and overall tumour burden information (i.e. WBC counts), comparing the growth of sibling clones will enable constructing a map of fitness of driver events in specific genetic contexts.
Discussion
Many mathematical models have been proposed to describe cancer growth in patients, but with no consensus7–9. Previous works reported exponential growth in leukaemia, lung, liver and breast cancer7,8, and sigmoidal growth (such as logistic or Gompertz) in earlier studies of breast cancer4,5 and in xenografts derived from human colorectal cancer6. Our study shows that individual cancers of the same type can exhibit diverse growth patterns: while many CLL patients exhibited exponential-like growth with high or unbounded carrying capacity, in others, the disease achieved a (potentially temporary) stable state, and exhibited a logistic-like pattern with finite carrying capacity. For these distinct growth classes, we further identified clear differences in genetic attributes and clinical outcomes: exponential growth was associated with a larger number of CLL drivers, greater subclonal dynamics and an earlier need for treatment. Conversely, logistic growth was associated with a narrower spectrum of genetic alterations, fewer subclonal drivers, and interclonal stability even in relapse after treatment. We and others previously noted that del(13q) and trisomy 12 are likely early events in CLL phylogeny13,21, and indeed, we found that the presence of del(13q) is associated with logistic growth, while trisomy 12 was associated with exponential growth. Our multivariable analysis demonstrated that the incorporation of growth pattern behaviour provides additional explanatory power above that provided by the strong prognostic cytogenetic marker of del(13q) presence17,22, and was stronger than IGHV mutational status. Furthermore, the genetic diversity of CLL appears to be established early in the disease, consistent with previously reported smaller series23–25. In the absence of therapeutic perturbations, the observed rate and pattern of outgrowth of CLL over time thus seems to ‘play out’ the pre-determined genetic composition. Of note, the growth rates of these clones from untreated patients are several-fold lower than that of relapse clones we previously reported in patients receiving ibrutinib2. Recent studies to genetically characterize the premalignant states of solid tumours26, and of monoclonal B cell lymphocytosis27,28 (considered a precursor condition of CLL), have further supported the idea that the extent of genetic diversity of malignancies like CLL long predates its full-blown clinical picture.
Our approach of integrating patient tumour burden measurements and sequencing data from multiple disease timepoints provides a conceptual framework for understanding the growth trajectories of individual populations of CLL cells. We detected evidence of in vivo competition amongst subclones in early CLL and more atypical behaviours that could not be categorized using simple models, extending previously reported insights on CLL evolution during later periods of the disease course29–31. For example, in a subset of patients, we observed a shift from overall logistic growth, with many years spent at carrying capacity, to exponential growth.
Finally, our computational framework enabled us to quantify the degree of growth acceleration and fitness of genetically defined subclones over their parental clones. Accelerated growth was strongly enriched in subclones with well-established CLL drivers. Thus, we provide clear evidence for the growth-accelerating role and potential synergies of driver mutations. We also find frequent existence of growth-neutral subclones without drivers, likely representing genetic drift19,20. These fundamental findings are especially relevant to the ongoing efforts of precision oncology, where estimation of the clonal growth dynamics in individual patients may inform therapy and predict the course of their disease.
Extended Data
Extended Data Figure 1. Growth kinetics of naturally progressing CLLs from the discovery cohort.
a, Time courses of the discovery CLL cohort (Supplementary Table 1). Circles indicate timepoints of samples analysed by whole-exome sequencing (WES). Dotted lines represent course of CLL from diagnosis (left vertical line) until last follow up (arrows) or death (right vertical line) and solid lines indicate timeframe covered by the analysis of serial samples by WES, coloured by growth pattern. b, Cumulative distribution function (CDF) of posterior probabilities for carrying capacity K obtained from the Bayesian model based on a logistic growth pattern for patients. The growth pattern categorizations of the individual patients are marked. c, Classification of patients based on probability that their carrying capacity K is below 1000 (x 109 white blood cells/L) (red numbers in upper left corner). Also shown are the posterior probabilities for all model parameters (carrying capacity K, growth rate r, white blood cell counts (WBC) at diagnosis X0 and variance of the noise σ2). Far right panels per patient - Leukaemia burden information provided by WBC measurements (blue dots), with ten random fits from the Bayesian model. Red numbers in left upper corners indicate time (years) from diagnosis to first treatment.
Extended Data Figure 2. Growth kinetics of CLLs from the extension cohort.
Shown are samples displaying: a, logistic growth (n = 43), b, indeterminate growth (n= 30) or c, exponential growth (n = 12), (information on growth pattern fitting in Supplementary Table 8). Blue dots - WBC measurements, coloured lines – ten random growth model fits (see Methods). Red numbers in lower left corners indicate years from diagnosis to first treatment for patients who progressed to treatment.
Extended Data Figure 3. Clonal shifts and growth rates in untreated CLL patients.
a, The increase in numbers of total (upper panel), clonal and subclonal drivers (middle and bottom panels) is associated with overall leukaemia growth patterns (Kruskal-Wallis test). b, A trend towards increased maximal change in the CCF of a driver event is observed between the first and last pre-treatment samples of a given patient based on growth pattern (Kruskal-Wallis). c, Upper panel: Probability for having a carrying capacity K of WBC < 109 cells/L (blue dots) for patients with logistic (LOG), indeterminate (IND) or exponential (EXP) growth patterns. Bottom panel: Growth rates (small circles) together with 70% credible intervals (lines) across the discovery and extension samples, ordered based on probability of logistic growth with samples classified as displaying logistic (LOG) growth, indeterminate growth (IND) or exponential growth.
Extended Data Figure 4. Assessment of evolutionary dynamics using sample pairs.
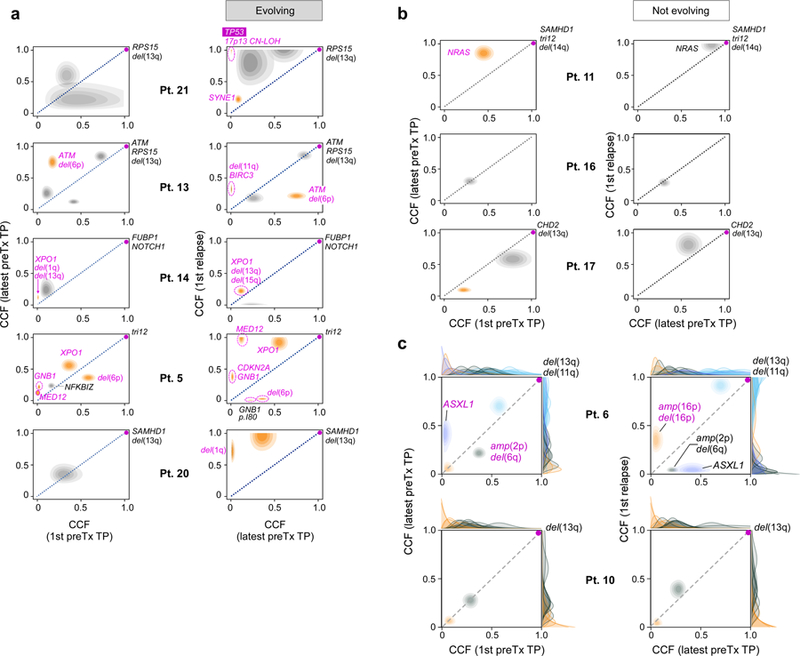
Changes of cancer cell fraction (CCF) of subclones represented as two-dimensional pair-wise plots of multi-sample clustering results. Samples at a timepoint (TP) closest to diagnosis (1st) vs the last sample before treatment (preTx) are shown in the left column, samples at last timepoint before and first timepoint after treatment are shown in the right column. Patients are grouped based on those having: a, subclones with significant evolution b, subclones that maintain interclonal balance. Significantly evolving subclones are indicated in orange (Methods), expanding CLL driver mutations are labelled (magenta). c, Examples of genetic evolution from first to last pre-treatment timepoints, and from pre-treatment to relapse samples for Patient 6 (with significant evolution) and Patient 10 (not evolving). Shown are 2D-distributions that reflect the average of the positional distributions of the cluster centres along the MCMC iterations, rather than the final posterior for the cluster centre, which is determined by the normalized product of the pre-clustered distributions of the mutations that were finally assigned to each cluster. Marginal distributions (on the x and y axes) depict the CCF distributions before clustering for each individual mutation. Final cluster assignment is indicated by the colour.
Extended Data Figure 5. Detecting subclones and construction of evolutionary phylogenies using simulated data.
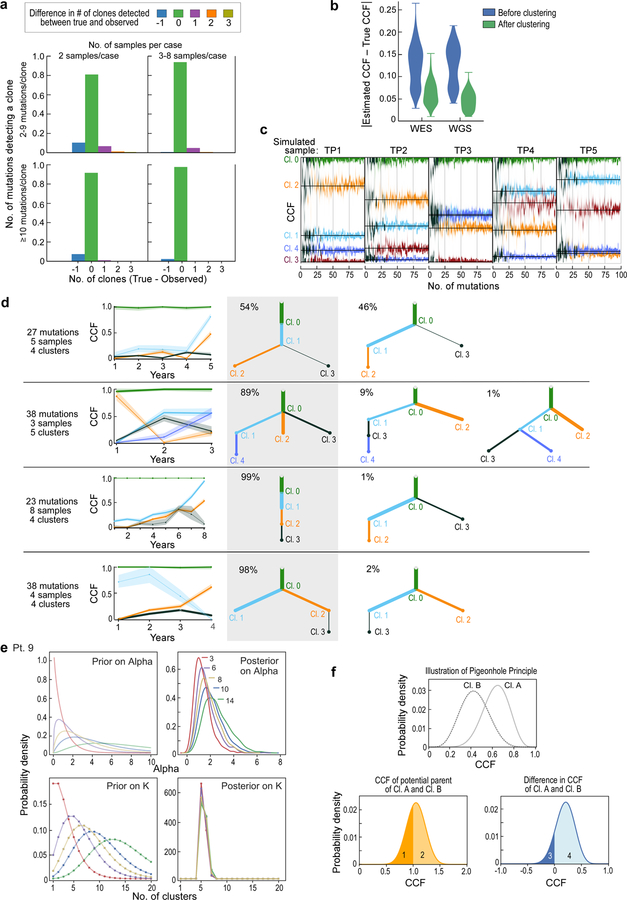
a, Bar plots showing the fraction of clustering results on simulated samples that are concordant with the ground truth (or differ by ∆n clusters). Simulations are grouped by low (2) and high (3–8) number of samples per case as well as low (2–9) and high (≥10) number of mutation per subclone. b, Similar CCF accuracy after clustering between simulated WES and WGS data. c, Simulation of a case with 5 samples and 5 subclones present at different CCF levels per sample (black lines- ground truth). The predicted CCF distributions for each cluster are plotted as a function of the number of mutations in the subclone (from 2 to 100). When the number of mutations exceeds ~15–20, the CCF predictions become stable and accurate (low bias and variance). d, Examples of PhylogicNDT BuildTree algorithm results applied to simulated data. Grey shading highlights the correct tree, with percentage of MCMC iterations supporting the trees indicated. e, Analysis of prior selection for clustering and pigeon-hole principle - For a range of priors with varying mean number of clusters, K, the prior for ⍺ is computed, and the Dirichlet Process posteriors for ⍺ and K illustrate how the choice of prior impacts the estimation of K. f, Pigeon-hole principle: for two clusters, A and B (top), the convolution (middle) and difference (bottom) is illustrated. The area above 1.0 CCF of the convolution is consistent with the probability that they are parent-child rather than siblings. The area below 0.0 CCF of the difference represents the probability that cluster B is more prevalent than cluster A.
Extended Data Figure 6. Subclonal genetic evolutionary dynamics in the discovery cohort.
a, Subclonal dynamics for each patient in the discovery cohort in relation to tumour load over time in the observed disease course (represented by white blood count [WBC], with dots indicating an available WBC measurement). Arrows—time of sampling with WES. Distinguishable subclones meeting the criteria for confident detection (>10% CCF, in at least one sequenced sample) are coloured. CCFs in time periods between sequenced timepoints were inferred from the closest sequenced sample. b, Subclonal growth patterns of additional patients analogous to Figure 4.
Extended Data Figure 7. Subclonal growth rate estimates of patients with non-bounded growth.
For 15 patients with non-bounded growth (EXP and IND) and at least one macroscopic subclone, we show: (i) first column: selected complete phylogenetic trees of subclones; yellow boxes indicate branches that were detectable only in relapse samples. (ii) second column: cluster CCF dynamics over time with 95% credible intervals based on uncertainty of mutation assignment; (iii) third column: pre-treatment growth rates for each generated clone within the most likely phylogeny; (iv) fourth column: relative pre-treatment growth rates of subclones compared to their respective parent subclone.
Extended Data Figure 8. Somatic copy number alteration (sCNA) calling from WES, WGS and SNP array data showing highly concordant results.
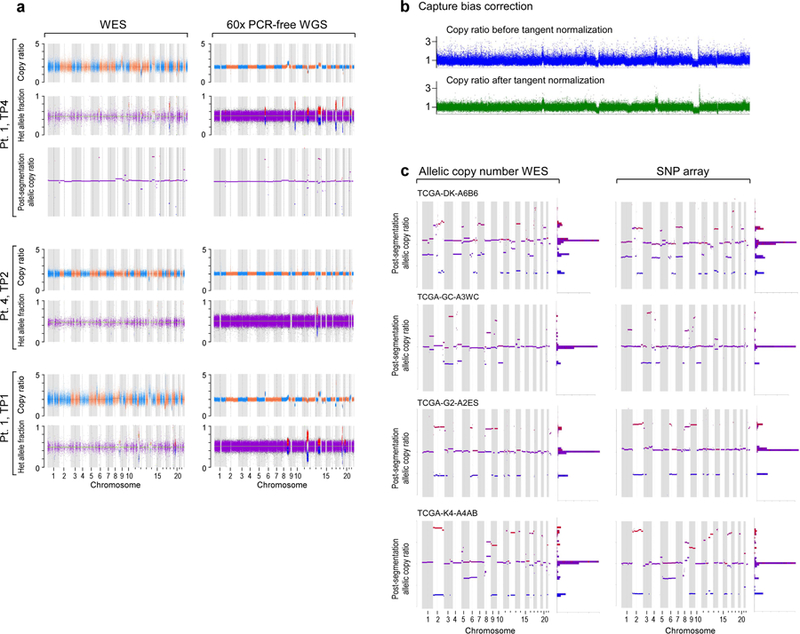
a, results from WES and WGS of CLLs from Patients 1 and 4 and b, in Patient 1 data before and after capture bias correction via tangent normalization and c, in TCGA samples with available paired WES and SNP array data.
Extended Data Figure 9. Comparison of PhylogicNDT Clustering results between WES and WGS data.
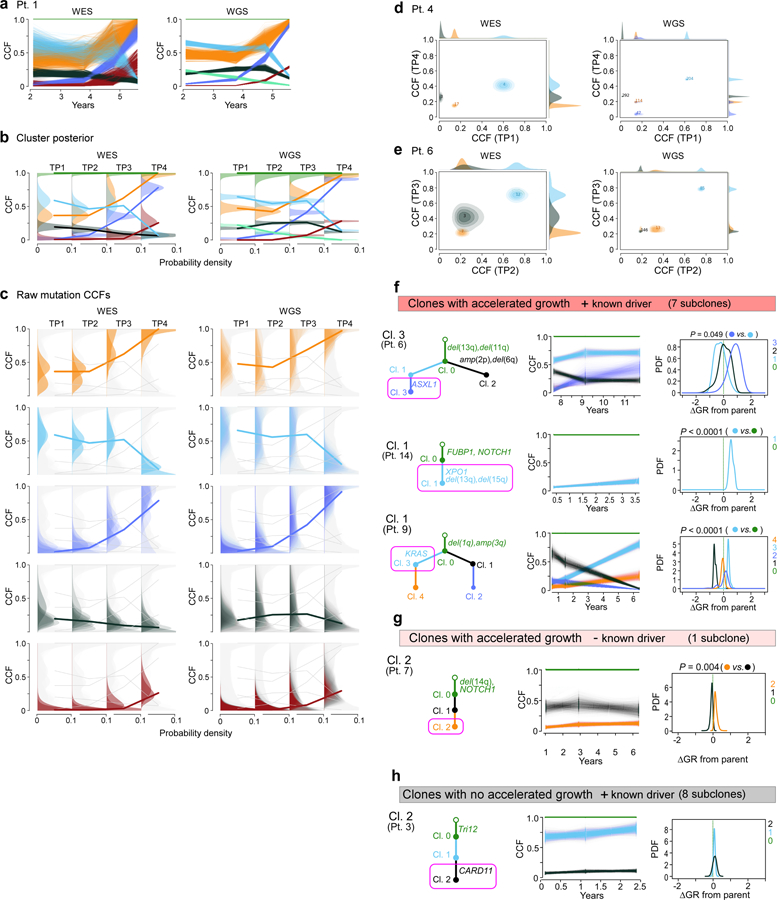
a, In Patient 1, paired results of WES and WGS data were available for all four timepoints and demonstrate matching cancer cell fractions (CCFs) throughout. CCF posterior distributions for the cluster centres (b) and individual mutations (c) for the corresponding subclones found in WES and WGS data of Patient 1. For Patients 4 and 6, two-dimensional comparisons are illustrated (d, e). Examples for subclones (magenta boxes) with f, significant growth advantage relative to their parent and known driver g, one subclone with significantly accelerated growth but no driver and h, subclones with driver and no growth acceleration.
Extended Data Table 1|. Exact logistic regression modelling of the probability of treatment.
Models include the 79 of 85 patients having complete data for FISH cytogenetics, IGHV mutational status, mutations, and WBC information. From the 85, 6 patients were excluded from modeling (n=1 for no sequencing, 1 for missing both IGHV status and FISH cytogenetics, 1 for missing IGHV status, and 3 for missing FISH cytogenetics). Final multivariable model selected using Stepwise Selection procedure using all variables listed in the following table as candidate, resulting P-values are marked by *.
| Univariate OR [95% Cl] | P-value | Final multivariable OR [95% CI] | P-value* | |
|---|---|---|---|---|
| N | 79 | 79 | ||
| Sex, male versus female | 0.94 [0.35, 2.49] | 1.00 | ||
| Age ≥ 60 years vs. <60 | 0.34 [0.10, 1.09] | 0.073 | ||
| EXP vs. LOG | 12.89 [2.09, 145.73] | 0.003 | 10.76 [1.18, 154.66] | 0.032 |
| IND vs. LOG | 6.34 [2.01,21.88] | <0.001 | 8.23 [1.91, 49.37] | 0.002 |
| IGHV unmutated vs. mutated | 4.74 [1.38.19.17] | 0.010 | ||
| Del(13q) vs. no driver | 0.12[0.03, 0.41] | <0.001 | 0.07 [0.01, 0.33] | <0.001 |
| Del(17p) vs. no driver | 1.21 [0.15, 9.64] | 0.99 | ||
| Trisomy 12 vs. no driver | 3.75 [0.81,23.84] | 0.10 | ||
| Number of total drivers | ||||
| 1 vs. 0 | 0.50 [0.009, 5.45] | 0.95 | ||
| 2 vs. 0 | 2.06 [0.44. 9.67] | 0.45 | ||
| ≥ 3 vs. 0 | 5 26[1.59,19.05] | 0.004 | ||
| Number of clonal drivers | ||||
| 1 vs. 0 | 0 86 [0.16, 3.81] | 0.99 | ||
| ≥ 2 vs. 0 | 4.83[1.49,17.26] | 0.006 | ||
| Subclonal driver present vs. absent | 2.31 [0.86, 6.39] | 0.11 | ||
| Maximum WBC | 1.00 [0.99,1.01] | 0.10 | ||
| Last WBC | 1.01 [1.00,1.01]] | 0.011 | 1.01 [1.00, 1.02] | <0.001 |
Supplementary Material
Acknowledgements
We are grateful to Paola dal Cin, Dan-Avi Landau, Sachet Shukla, and Ulrich Jäger for helpful discussions. We also appreciate the efforts of all study nurses and clinical staff who made this study feasible and the patients who generously provided their samples for this research.
This work was supported in part by the NCI (5P01CA081534–14, 1R01CA155010–01A1, P01CA206978, U10CA180861), the CLL Global Research Foundation, and by NHLBI (1RO1HL103532–01). M.G. was supported by a Marie-Curie International Outgoing Fellowship from the European Union (PIOF-2013–624924). C.J.W. is a Scholar of the Leukemia and Lymphoma Society
Footnotes
Code Availability
PhylogicNDT package22 is available at https://github.com/broadinstitute/PhylogicNDT.
PhylogicNDT uses Python 2.7.13 and the following Python modules available from pypi.org: bottle 0.12.13, dill 0.2.7.1, et-xmlfile 1.0.1, intervaltree 2.1.0, jsonschema 2.6.0, lxml 3.7.3, more-itertools 2.5.0, mpmath 0.19, networkx 1.11, openpyxl 2.4.1, pdfkit 0.6.1, pydotplus 2.0.2, pymc 2.3.6, pymc3 3.0, python-dateutil 2.6.1, rpy2 2.8.5, seaborn 0.7.1, simplejson 3.10.0, svgwrite 1.1.9, scikit-learn 0.18.1, biopython 1.68. Additionally, pyemd (github.com/garydoranjr/pyemd) and sselogsumexp (github.com/rmcgibbo/logsumexp) modules were utilized.
Code for the Bayesian modelling of growth patterns is available at: https://github.com/ivbozic/Bayesian-Growth-Pattern-Modeling.
Data availability
All relevant data are available from the authors and/or are included with the manuscript. Clinical data about patients and samples analyzed in the discovery cohort are listed in Supplementary Data Table 1a–b, sequencing metrics and somatic mutations are provided in Supplementary Tables 2–4. WES data is in dbGaP under accession code phs001431.v1.p.
For the extension cohort, patient and sample characteristics as well as sequencing data are available from a previous publication (doi: 10.1038/nature15395)1, and clinical data are summarized in Extended Data Table 1. Additional data to assess WBC dynamics were collected from these patients for this study and are illustrated in Extended Data Figure 2, with clinical characteristics of patients with additional relapse samples provided separately in Supplementary Table 1c.
Reporting summary
Further information on research design is available in the Nature Research Reporting Summary linked to this paper.
Competing interests
C.J.W. is founder of Neon Therapeutics and a member of its scientific advisory board. G.G. receives research funds from IBM and Pharmacyclics. G.G is an inventor of several bioinformatics-related patents, including related to MuTect and ABSOLUTE. C.J.W., D.N. and T.J.K. receive research funding from Pharmacyclics. J.S. is a current employee of Moderna Therapeutics. J.G.G. receives grant funding from funding Janssen, Acerta, Celgene; Honoraria Abbvie, AZ, Celgene, Kite, Janssen, Pharmacyclics, Roche and Novartis. K.R.R. is on Medical Advisory Boards of Pharmacyclics, Roche/Genentech, and Cellectis. J.R.B. is a consultant for Abbvie, Acerta, Beigene, Genentech/Roche, Gilead, Juno/Celgene, Kite, Loxo, Novartis, Pfizer, Pharmacyclics, Sunesis, TG Therapeutics, Verastem; received honoraria from Janssen and Teva; received research funding from Gilead, Loxo, Sun and Verastem; and served on data safety monitoring committees for Morphosys and Invectys. The other authors declare no potential conflicts of interest.
References
- 1.Wodarz D & Komarova NL Dynamics of cancer : mathematical foundations of oncology (World Scientific, 2014). [Google Scholar]
- 2.Burger JA et al. Clonal evolution in patients with chronic lymphocytic leukaemia developing resistance to BTK inhibition. Nat Commun 7, 11589, doi: 10.1038/ncomms11589 (2016). [DOI] [PMC free article] [PubMed] [Google Scholar]
- 3.Diaz LA Jr. et al. The molecular evolution of acquired resistance to targeted EGFR blockade in colorectal cancers. Nature 486, 537–540, doi: 10.1038/nature11219 (2012). [DOI] [PMC free article] [PubMed] [Google Scholar]
- 4.Norton L A Gompertzian model of human breast cancer growth. Cancer Res 48, 7067–7071 (1988). [PubMed] [Google Scholar]
- 5.Spratt JA, von Fournier D, Spratt JS & Weber EE Decelerating growth and human breast cancer. Cancer 71, 2013–2019 (1993). [DOI] [PubMed] [Google Scholar]
- 6.Misale S et al. Vertical suppression of the EGFR pathway prevents onset of resistance in colorectal cancers. Nat Commun 6, 8305, doi: 10.1038/ncomms9305 (2015). [DOI] [PMC free article] [PubMed] [Google Scholar]
- 7.Talkington A & Durrett R Estimating Tumor Growth Rates In Vivo. Bull Math Biol 77, 1934–1954, doi: 10.1007/s11538-015-0110-8 (2015). [DOI] [PMC free article] [PubMed] [Google Scholar]
- 8.Rodriguez-Brenes IA, Komarova NL & Wodarz D Tumor growth dynamics: insights into evolutionary processes. Trends Ecol Evol 28, 597–604, doi: 10.1016/j.tree.2013.05.020 (2013). [DOI] [PubMed] [Google Scholar]
- 9.Gerlee P The model muddle: in search of tumor growth laws. Cancer Res 73, 2407–2411, doi: 10.1158/0008-5472.CAN-12-4355 (2013). [DOI] [PubMed] [Google Scholar]
- 10.Hart D, Shochat E & Agur Z The growth law of primary breast cancer as inferred from mammography screening trials data. Br J Cancer 78, 382–387 (1998). [DOI] [PMC free article] [PubMed] [Google Scholar]
- 11.Hallek M et al. iwCLL guidelines for diagnosis, indications for treatment, response assessment, and supportive management of CLL. Blood 131, 2745–2760, doi: 10.1182/blood-2017-09-806398 (2018). [DOI] [PubMed] [Google Scholar]
- 12.Puente XS et al. Non-coding recurrent mutations in chronic lymphocytic leukaemia. Nature 526, 519–524, doi: 10.1038/nature14666 (2015). [DOI] [PubMed] [Google Scholar]
- 13.Landau DA et al. Mutations driving CLL and their evolution in progression and relapse. Nature 526, 525–530, doi: 10.1038/nature15395 (2015). [DOI] [PMC free article] [PubMed] [Google Scholar]
- 14.Wang L et al. SF3B1 and other novel cancer genes in chronic lymphocytic leukemia. N Engl J Med 365, 2497–2506, doi: 10.1056/NEJMoa1109016 (2011). [DOI] [PMC free article] [PubMed] [Google Scholar]
- 15.Landau DA et al. Evolution and impact of subclonal mutations in chronic lymphocytic leukemia. Cell 152, 714–726, doi: 10.1016/j.cell.2013.01.019 (2013). [DOI] [PMC free article] [PubMed] [Google Scholar]
- 16.Dohner H et al. Genomic aberrations and survival in chronic lymphocytic leukemia. N Engl J Med 343, 1910–1916, doi: 10.1056/NEJM200012283432602 (2000). [DOI] [PubMed] [Google Scholar]
- 17.Hamblin TJ, Davis Z, Gardiner A, Oscier DG & Stevenson FK Unmutated Ig V(H) genes are associated with a more aggressive form of chronic lymphocytic leukemia. Blood 94, 1848–1854 (1999). [PubMed] [Google Scholar]
- 18.Leshchiner I et al. Comprehensive analysis of tumour initiation, spatial and temporal progression under multiple lines of treatment. bioRxiv, 508127, doi: 10.1101/508127 (2018). [DOI] [Google Scholar]
- 19.Bozic I, Gerold JM & Nowak MA Quantifying Clonal and Subclonal Passenger Mutations in Cancer Evolution. PLoS Comput Biol 12, e1004731, doi: 10.1371/journal.pcbi.1004731 (2016). [DOI] [PMC free article] [PubMed] [Google Scholar]
- 20.Williams MJ, Werner B, Barnes CP, Graham TA & Sottoriva A Identification of neutral tumor evolution across cancer types. Nat Genet 48, 238–244, doi: 10.1038/ng.3489 (2016). [DOI] [PMC free article] [PubMed] [Google Scholar]
- 21.Wang J et al. Tumor evolutionary directed graphs and the history of chronic lymphocytic leukemia. Elife 3, doi: 10.7554/eLife.02869 (2014). [DOI] [PMC free article] [PubMed] [Google Scholar]
- 22.International, C. L. L. I. P. I. w. g. An international prognostic index for patients with chronic lymphocytic leukaemia (CLL-IPI): a meta-analysis of individual patient data. Lancet Oncol 17, 779–790, doi: 10.1016/S1470-2045(16)30029-8 (2016). [DOI] [PubMed] [Google Scholar]
- 23.Ojha J et al. Deep sequencing identifies genetic heterogeneity and recurrent convergent evolution in chronic lymphocytic leukemia. Blood 125, 492–498, doi: 10.1182/blood-2014-06-580563 (2015). [DOI] [PMC free article] [PubMed] [Google Scholar]
- 24.Rose-Zerilli MJJ et al. Longitudinal copy number, whole exome and targeted deep sequencing of ‘good risk’ IGHV-mutated CLL patients with progressive disease. Leukemia 30, 1301–1310, doi: 10.1038/leu.2016.10 (2016). [DOI] [PMC free article] [PubMed] [Google Scholar]
- 25.Smith EN et al. Genetic and epigenetic profiling of CLL disease progression reveals limited somatic evolution and suggests a relationship to memory-cell development. Blood Cancer J 5, e303, doi: 10.1038/bcj.2015.14 (2015). [DOI] [PMC free article] [PubMed] [Google Scholar]
- 26.Martinez P et al. Dynamic clonal equilibrium and predetermined cancer risk in Barrett’s oesophagus. Nat Commun 7, 12158, doi: 10.1038/ncomms12158 (2016). [DOI] [PMC free article] [PubMed] [Google Scholar]
- 27.Ojha J et al. Monoclonal B-cell lymphocytosis is characterized by mutations in CLL putative driver genes and clonal heterogeneity many years before disease progression. Leukemia 28, 2395–2398, doi: 10.1038/leu.2014.226 (2014). [DOI] [PMC free article] [PubMed] [Google Scholar]
- 28.Barrio S et al. Genomic characterization of high-count MBL cases indicates that early detection of driver mutations and subclonal expansion are predictors of adverse clinical outcome. Leukemia 31, 170–176, doi: 10.1038/leu.2016.172 (2017). [DOI] [PMC free article] [PubMed] [Google Scholar]
- 29.Schuh A et al. Monitoring chronic lymphocytic leukemia progression by whole genome sequencing reveals heterogeneous clonal evolution patterns. Blood 120, 4191–4196, doi: 10.1182/blood-2012-05-433540 (2012). [DOI] [PubMed] [Google Scholar]
- 30.Braggio E et al. Longitudinal genome-wide analysis of patients with chronic lymphocytic leukemia reveals complex evolution of clonal architecture at disease progression and at the time of relapse. Leukemia 26, 1698–1701, doi: 10.1038/leu.2012.14 (2012). [DOI] [PMC free article] [PubMed] [Google Scholar]
- 31.Amin NA et al. A Quantitative Analysis of Subclonal and Clonal Gene Mutations before and after Therapy in Chronic Lymphocytic Leukemia. Clin Cancer Res 22, 4525–4535, doi: 10.1158/1078-0432.CCR-15-3103 (2016). [DOI] [PMC free article] [PubMed] [Google Scholar]
Associated Data
This section collects any data citations, data availability statements, or supplementary materials included in this article.


