

Abstract
There is increasing evidence of the importance of synchronous activity within the corticospinal system for motor control. We compared oscillatory activity in the primary sensorimotor cortex [EEG of sensorimotor cortex (SMC-EEG)] and a motor neuronal pool [surface electromyogram of opponens pollicis (OP-EMG)], and their coherence in children (4–12 years of age), young adults (20–35 years of age), and elderly adults (>55 years of age). The ratio between lower (2–13 Hz) and higher (14–32 Hz) frequencies in both SMC-EEG and OP-EMG decreased with age, correlating inversely with motor performance. There was evidence for larger, more distributed cortical networks in the children and elderly compared with young adults. Corticomuscular coherence (CMC) was present in all age groups and shifted between frontal and parietal cortical areas. In children, CMC was smaller and less stationary in amplitude and frequency than in adults. Young adults had single peaks of CMC clustered near the modal frequency (23 Hz); multiple peaks with a broad spread of frequencies occurred in children and the elderly; the further the frequency of the maximum peak CMC was from 23 Hz, the poorer the performance. CMC amplitude was inversely related to performance in young adults but was not modulated in relation to performance in children and the elderly. We propose that progressive fine-tuning of the frequency coding and stabilization of the dynamic properties within and between corticospinal networks occurs during adolescence, refining the capacity for efficient dynamic communication in adulthood. In old age, blurring of the tuning between networks and breakdown in their integration occurs and is likely to contribute to a decrement in motor control.
Introduction
Detailed studies of task-related changes in the firing of corticospinal neurons provide clear evidence of their individual participation in movement control and reveal the central role of the corticomotoneuronal projection in fractionated movements of intrinsic hand muscles (Matsunami and Hamada, 1983; Lemon et al., 1986; Lemon and Mantel, 1989; Crutcher and Alexander, 1990; Porter and Lemon, 1993; Bennett and Lemon, 1996; Lemon, 1997). The sensorimotor cortex (SMC) and spinal motor neuronal pools have oscillating networks that display task-dependent phase locking in beta frequencies (Rossignol and Dubuc, 1994; Baker et al., 1997; Brown et al., 1998; Hari and Salenius, 1999; Kilner et al., 1999; Mima and Hallett, 1999b; Nistri et al., 2006; Szurhaj and Derambure, 2006). Corticomuscular coherence (CMC) is mediated via fast-conducting corticomotoneuronal projections (Baker et al., 2003) and is related to performance, the degree of attention, and the precision required in manual tasks (Kristeva-Feige et al., 2002; Kristeva et al., 2007). Increased coherence is observed after learning a new task (Perez et al., 2006) and following muscle fatigue (Tecchio et al., 2006). These studies provide evidence that synchronization of the oscillations in the beta frequency band between corticospinal neurons and spinal alpha motor neurons provides a mechanism for efficient corticomuscular coupling.
Control of fine finger movements matures in adolescence (Garvey et al., 2003) and deteriorates during healthy aging (Incel et al., 2009). At these ages, major changes occur in the cortex, spinal motoneuronal pools, and corticospinal tract. Sensorimotor cortex synaptic density decreases markedly in adolescence and plateaus in young adulthood before a further progressive reduction in synaptic density begins in the fourth decade (Huttenlocher, 1979, 1990; Huttenlocher and Dabholkar, 1997; Dickstein et al., 2007). Intracortical inhibition is not mature until adulthood and is reduced in the elderly (Peinemann et al., 2001; Mall et al., 2004; Walther et al., 2009). The morphological properties of alpha-motoneurons and their excitatory and inhibitory control mature during development and are altered in the elderly (O'Sullivan et al., 1991; Erim et al., 1999; Mc Donough et al., 2001; Mentis et al., 2002; Furlan et al., 2007; Carlin et al., 2008; Sibilla and Ballerini, 2009). Finally, both the diameter and excitability of corticospinal axons increase during adolescence (Eyre et al., 1991; Müller and Hömberg, 1992) while white matter hyperintensities within the corticospinal tract become prevalent in old age (Moscufo et al., 2009). All these changes are likely to influence oscillatory activity and the integrity of corticospinal linkage.
Our aims were to explore changes with age in oscillatory activity in the sensorimotor cortex and spinal cord and the integrity of corticospinal linkage. Our hypotheses are: (1) changes in the power and frequency of oscillations will occur from childhood to adulthood, reflecting maturation and increased specification of corticospinal neural networks, and will be associated with the stabilization of corticospinal linkage; (2) senescent changes in power and frequency reflect dedifferentiation of the neural assemblies and will be associated with destabilization of corticospinal linkage; (3) age-related changes in oscillatory activity and CMC will be related to motor performance.
Materials and Methods
Our aim was to study children who were >3 years of age but preadolescent (4–12 years of age, when synapse number plateaus) and elderly adults (≥55 years of age), comparing their data to those of young adults (20–35 years of age), who we assume reflect a mature corticospinal system that is not yet altered by senescent changes. We studied the oscillatory behavior of the sensorimotor cortex and spinal alpha motoneurons and CMC during a simple motor task: steady isometric contraction of opponens pollicis during a pinch grasp. This task was chosen because: (1) it is known to involve the corticomotoneuronal system (Kuypers, 1962; Lawrence and Kuypers, 1968; Lawrence and Hopkins, 1976); (2) even very young subjects perform pinch grasps regularly in everyday activities, reducing the potential confounding effect of differential learning of a new task among age groups; and (3) sensorimotor cortex oscillatory synchrony in the 15–30 Hz range and CMC have been shown to be maximal during the steady-hold period of a pinch grip (Baker et al., 1997; Kilner et al., 1999; Kilner et al., 2002).
The approval of the local ethics committees and informed consent from the subjects and the parents of the children were obtained.
Subjects
Recordings were made from 12 children (6 female; mean age, 8.4 years; age range, 4–12 years), 10 young adults (5 female; mean age, 25 years; age range, 21–35 years), and 10 elderly adults (7 female; mean age, 64 years; age range, 55–80 years); the data from 2 children, 2 young adults, and 1 elderly adult were subsequently excluded from the analysis because of excessive artifacts. All were right-handed [Edinburgh Manuality Test (Oldfield, 1971); mean, 83; range, 70–100]. None of the subjects had a history of a neurological disorders, and all were healthy at the time of the assessments.
Experimental procedure
All subjects sat comfortably in a chair with their arms supported, flexed at the elbow, and with the forearm semipronated. They were instructed to maintain a steady, low level of isometric contraction of right opponens pollicis (ROP) by opposition of the right thumb and index finger against resistance of a compliant object. The task was first demonstrated to subjects, and they were instructed to give a gentle but steady squeeze. Particular care was taken to ensure that all the subjects, including the youngest subjects, understood the task. Since attention to a task modulates CMC (Kristeva et al., 2007), an experimenter sat near the subjects for the duration of the data collection, taking particular care that the subject was paying attention to the task. This simple and short motor task was also chosen because it does not require a high level of attention for long time periods. Visual feedback of the power of contraction was not provided because our aim was to assess changes with age in the corticospinal system. Deficits in visuomotor integration in the elderly are a critical factor in the age-related deterioration in the steadiness of isometric force production (Vaillancourt et al., 2003; Labyt et al., 2004); therefore, adding visual feedback would have introduced a confounding factor for comparisons across age groups. Periods of continuous contraction were kept brief to avoid fatigue (Tecchio et al., 2006). Periods of rest were also recorded from each subject. We collected at least 120 s of contraction and 120 s of rest, and included in the analysis only subjects with a minimum of 90 s of artifact-free data in each condition (Fig. 1).
Figure 1.

SMC-EEG and EMG activity at rest and during right hand contraction. Paradigmatic examples in: a child 8 years of age, a young adult 22 years of age, and an elderly adult 75 years of age. The top section was recorded while the subject was at rest, and the lower section while contracting ROP. The upper two traces for each section are bipolar derivation SMC signals on the left (LSMC-EEG, black line) and on the right (RSMC-EEG, red line). The third and fourth traces are EMG signals recorded from ROP and LOP. The scale bar represents 50 μV for EEG and 200 μV for EMG. While only the LSMC-EEG is suppressed during contraction in the young adult, there is bilateral suppression of the LSMC-EEG and RSMC-EEG in the child and in the elderly adult, and no overt activity in LOP-EMG.
Neurophysiological recordings
Electroencephalography (EEG) and electromyography (EMG) were recorded simultaneously using Ag/AgCl electrodes, bandpass filtered between 0.48 and 256 Hz, sampled at 1024 Hz, and stored on computer for off-line processing.
Electroencephalography
EEG was recorded using either a Micromed System Plus SAM32 (Micromed) for the recordings of the elderly, or a Neuroscan Synamps System (Compumedics Neuroscan) for the recording of children and young adults. The montage comprised 29 channels (FP2, FP1, F8, F4, Fz, F3, F7, FC6, FC2, FC1, FC5, T4, C4, Cz, C3, T3, CP6, CP2, CP1, CP5, T6, P4, Pz, P3, T5, PO4, PO3, O2, and O1) positioned accordingly to the 10–20 International EEG system (Jasper, 1958). For children <8 years of age, a 12-channel montage was used (F4, Fz, F3, C4, Cz, C3, P4, Pz, P3, O2, Oz, and O1). A linked mastoid reference and a ground positioned mediofrontally were used.
Electromyography
EMG indirectly assesses the oscillatory activity of the spinal motor neuronal groups, since a spinal motoneuron and the corresponding muscle fibers form a motor unit with 1:1 correspondence of their action potentials (McAuley et al., 1997). EMG was recorded using surface-mounted electrodes from ROP (ROP-EMG) and left OP (LOP-EMG) to control for possible mirroring of the contraction.
Data analysis
Sensorimotor cortex activity identification
The main cortical component of activity, which is synchronous with rhythmic motor-unit firing, is generated in the primary sensorimotor cortex (Brown, 2000; Gerloff et al., 2006). We exploited this property to identify the bipolar derivation most representative of sensorimotor cortical activity by searching for the derivation showing maximal coherence with muscular activity (CMC). A previous study found that current source density was preferable for the estimation of CMC (Mima and Hallett, 1999a); however, it is well recognized that the Laplacian estimation is dependent on the number of recording electrodes (Nunez and Srinivasan, 2006), and its use is recommended for montages with >64 electrodes. When using a more limited number of electrodes, such as we did, bipolar recordings have been shown to be the best option to improve the spatial resolution of the EEG (Andrew and Pfurtscheller, 1996; Nunez and Srinivasan, 2006). In agreement with this finding, a preliminary analysis of our data confirmed that bipolar derivations were more sensitive to CMC than Laplacian derivations, or using average or linked mastoid referencing (Fig. 2A). Using bipolar derivations, the peak value of the CMC was found to be dependent on the orientation of the electrode pair (Fig. 2B). Thus, the four topographic maps were built, each constructed using bipolar pairs separated by ∼20% of the inion–nasion distance and oriented on one of the four axes: the medial to lateral; anterior to posterior; and both diagonals (anteromedial to posterolateral and anterolateral to posteromedial). Maximum CMC was found most commonly in electrode pairs, typically including C3, oriented along the anterior–posterior axis and/or along the anteromedial-to-posterolateral orientation. This was the case in 19 subjects, who concurrently showed negligible CMC along the other two axes (Fig. 2B). In the remaining eight subjects, CMC was maximal in the mediolateral axis and negligible in the other three directions. No subject showed significant CMC along the anterolateral to posteromedial axis.
Figure 2.
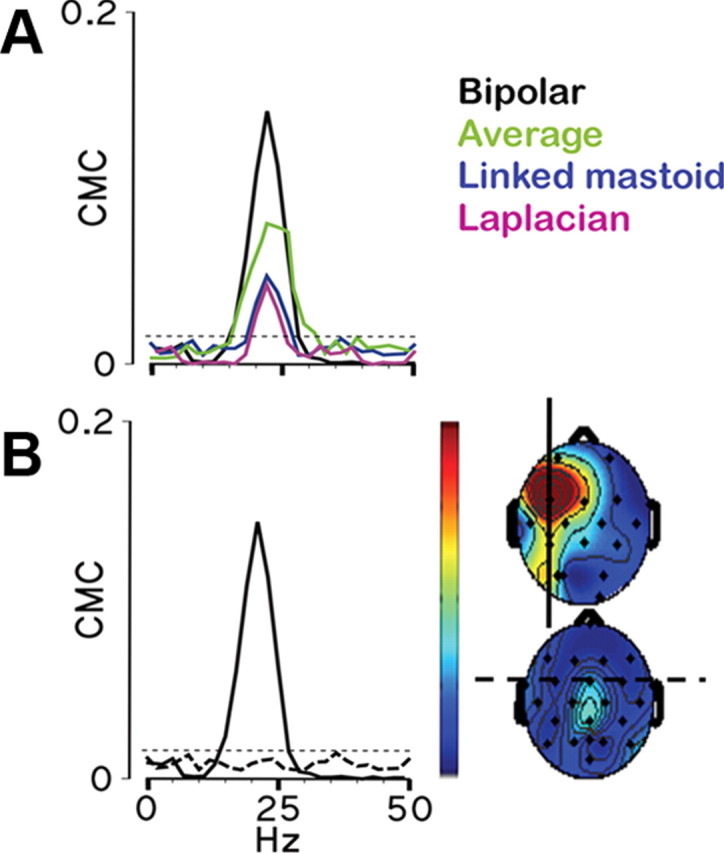
CMC and its properties. A, Comparison of the CMC spectra obtained using Laplacian transformation or different referencing methods, demonstrating higher CMC derived from a bipolar derivation. B, Comparison of the effect on CMC of different orientations of the bipolar derivations centered on FC3. On the left, CMC spectra (C3–F3, continuous line; FC1–FC5, dashed line). On the right, the topographic distribution of CMC in the beta band in the anterior–posterior (continuous line) and medial–lateral (dashed line) directions. For the topographic distribution, the color scale gives CMC values 0–0.2. The dotted horizontal line in all the CMC spectra indicates the 95% confidence level for a CMC significantly different from zero. Topographic distributions were realized with EEGLAB software (Delorme and Makeig, 2004), considering the coordinates of the electrode in the 5–10 system (Oostenvelda and Praamstrac, 2001) corresponding to the midpoint between the two bipolar derivations and using the CMC values in the frequency band in which maximum values were observed.
The bipolar derivation over the left (contralateral) hemisphere showing maximum CMC with ROP-EMG was identified, and this electrode pair was used for further analysis [left sensorimotor cortex EEG (LSMC-EEG)]. To investigate possible bilateral sensorimotor cortex involvement in the unimanual task and interhemispheric asymmetries, EEG was also analyzed from the right (ipsilateral) sensorimotor cortex (RSMC-EEG). When significant CMC was observed between ROP-EMG and electrodes over the right SMC, the bipolar derivation showing maximal CMC was used; otherwise, the electrode pair homologous to that considered over the left SMC was used.
Estimation of power spectral density and CMC
We set a fixed time period to calculate the rest and contraction power spectral densities (PSDs) and CMCs as these estimates depend on the number of averages. Thus, a 90 s period was analyzed in each subject, which we will call the “whole-period analysis” (Fig. 3).
Figure 3.

Spectral properties and reactivity of SMC-EEG, relative ROP-EMG, and CMC: representative data. Data are plotted from a child, a young adult, and an elderly adult. SMC-EEG: PSDs of the SMC-EEG of the primary sensorimotor cortex activity, as defined in the Materials and Methods section; note that in SMC-EEG the scales on the y-axis are different for the child compared with the young and elderly adults, and unilateral mu suppression in LSMC-EEG occurs in the young adults during contraction of ROP while bilateral mu suppression is observed in the child and in the elderly adult. Relative ROP-EMG: As absolute EMG power decreases during life, which may reflect contributions of non-neuronal factors, the relative powers of EMG recorded over ROP were reported; the black arrowheads indicate the projections on the x-axis of the maximal peak of the ROP-EMG PSD: the shift with age is evident. CMC, CMC spectra. Black lines, Left/contralateral SMC; red lines, right/ipsilateral SMC; solid lines, during contraction of ROP; dashed lines, while ROP is relaxed.
The transition periods between rest and contraction were disregarded (0.5 s). Periods containing saturated channels were rejected. An independent component analysis was used, when required, to remove artifacts without trial exclusion. Right and left SMC-EEG and rectified EMG signals from ROP and LOP were segmented into epochs of 512 ms and Hanning-windowed to control spectral leakage (Terry and Griffin, 2008), and the Welch procedure (Welch, 1967) with 50% overlap was used. The PSD depends on the number of synchronously oscillating neurons and their degree of synchrony at a defined frequency. Power was estimated in the frequency bands (Niedermeyer, 1998) delta/theta (2–7 Hz), alpha (8–13 Hz), beta (14–32 Hz), low gamma (33–46 Hz), and high gamma (54–100 Hz), and were normalized by the number of frequency points in each band. In the statistical analysis of SMC-EEG, the data for the gamma frequency band were not considered because gamma activity most often appears as bursts of short duration (usually <200 ms), especially during the stationary conditions of rest and sustained isometric contraction that we were studying (Crone et al., 1998; Donoghue et al., 1998); the PSD analysis, which averages multiple windows of 512 ms, is not suitable to study transient gamma activity. Furthermore, at rest cortical gamma activity is poorly represented (Donoghue et al., 1998), and during a steady contraction it is not observed in all subjects even using event-related synchronization analysis on data recorded with subdural electrodes (Crone et al., 1998). The gamma frequency bands were included in the EMG analysis as surface EMG is sensitive to activity in these bands.
To investigate the relative power of low versus high frequencies in the SMC-EEG and ROP-EMG, we calculated the ratio of lower to higher frequency power (2–13 Hz/14–32 Hz).
The power of the surface EMG depends on muscle bulk and the degree of subcutaneous fat, both of which vary systematically with age (Kuiken et al., 2003; Wehrli et al., 2007). Therefore, in addition to the absolute rectified ROP-EMG PSD, we also analyzed the relative power of the rectified ROP-EMG in each of the frequency bands, calculated by dividing the power in each frequency band by the total power in the whole range (2–100 Hz).
CMC was estimated using the methods of Terry and Griffin (2008). The upper 95% confidence limit for a CMC of zero was used to determine significant results (Terry and Griffin, 2008). The frequency and amplitude of the significant CMC peaks were determined. For topographical purposes, in each subject CMC spectra were also estimated between the ROP-EMG and all EEG bipolar derivations in the direction selected by the maximal CMC procedure described above.
Stationarity of CMC: “sliding window analysis”
To investigate the stationarity of CMC in each age group, we used sequential overlapping time periods, which we will call the “sliding window analysis.” Each window comprised 30,720 data points (∼30 s), which was then advanced by 10,240 points, thereby providing between 7 and 13 values for each subject (Fig. 4A). A 30 s window was used since this has been shown to be the minimum time to provide reliable coherence values (Terry and Griffin, 2008). For stationarity estimate, we used the bipolar derivation with maximal CMC selected for the whole-period analysis, as above (Fig. 4C).We recorded the amplitude and frequency of the maximum peak of CMC for each window, as illustrated in Figure 4; with this method, we were able to estimate three indicators for lack of stationarity: the coefficient of variation of the amplitude and the frequency of the CMC peak, and the proportion of the total windows without significant CMC. Finally, since the sliding window analysis commonly revealed a shift of maximum CMC between a more frontal and a more parietal bipolar derivation, as for example in Figure 4A, we evaluated a further index of nonstationarity, the “index of spatial shifting.” Although the amplitude of the peak of the CMC averaged over all the sliding windows was always highest in the bipolar derivation used to identify the sensorimotor cortex, for some subjects the peak amplitude of the CMC was maximal in the second, more parietal derivation in a proportion of windows. The index of spatial shifting was then estimated as the proportion of the total windows in which CMC was maximal in a second bipolar derivation. To exclude potential contamination of volume conduction, CMC in the second derivation was considered significant only if the peak amplitude was higher than in the derivation indicated by the whole-period analysis in at least one sliding window (Fig. 4). For example, for the subject illustrated in Figure 4, we selected the bipolar derivation indicated in Fig. 4C with the white circle to identify the sensorimotor cortex, which is the derivation with maximal average CMC (0.09); the derivation indicated with the red circle was the second bipolar derivation since it had the next highest CMC from whole-period analysis (0.06). Since the CMC was higher in this second derivation (red circle) for five windows (first three and last two windows) and the total number of windows was 10, the index of spatial shifting for this subject was 0.5.
Figure 4.

CMC time variability studied by the sliding window analysis. A, Topographic distribution of CMC in the beta band using bipolar derivations in the anterior–posterior axis (see Materials and Methods). B–D, The arrow on the bottom gives the color coding for the spectra obtained in consecutive time windows (graphed in B and D) from bipolar derivation indicated in C, where the topographic distribution of CMC is estimated using the whole-period analysis. The shift in the site of maximum CMC over time is evident. Note that during some time windows (black arrowheads), maximally during the “brown” window, CMC is higher parietally than frontally, implying that the CMC from the sensory cortex is not simply attributable to volume conduction.
Thus, for all indices high values are associated with more variable CMC (in amplitude, frequency, and position) and lower stationarity.
Motor performance index
Since we required isometric contractions, we used the coefficient of variation of the amplitude of the rectified EMG as our performance indicator. The performance index (PI) was estimated as follows:
 |
For small muscles, such as OP with narrow motor unit recruitment and force ranges, the relation between force and the average rectified value of surface EMG is linear (Lawrence and De Luca, 1983; Basmajian and De Luca, 1985; Solomonow et al., 1990). To confirm this also holds true for the coefficient of variation of the EMG and that of the force generated, we compared the PI estimated from the rectified ROP-EMG to the PIPressure estimated as the coefficient of variation of the pressure generated in a subgroup of our subjects (13 subjects; age range, 6–80 years) performing the same task (Fig. 5A). Pressure was estimated using a pressure sensor (40PC100G1A, Honeywell Sensing and Control) connected with the compliant object used during the task. The performance index (PIPressure) was estimated as follows:
 |
Figure 5.

Comparison of PI and PIPressure. A, ROP-EMG (in black) and pressure traces (in red) in one representative subject. The green line shows the periods of isometric contraction selected for the analyses. B, C, Intersubject comparison (B) and intrasubject comparison (C). The same color represents the same subject in B and C.
Statistical analysis
All analyses were performed using SPSS version 15 (SPSS). The SMC-EEG PSD, ROP-EMG PSD, and CMC peak frequency and amplitude were normally distributed (Kolmogorov–Smirnov test, p > 0.20); thus, a general linear model ANOVA was used. The models for the analysis were hypothesis driven and therefore, when relevant, a one-tailed test of significance was applied. Significance level was set at p < 0.05, with full Bonferroni correction for multiple comparisons. A Greenhouse–Geisser correction was applied if the sphericity assumption for ANOVA was violated. Since the aim of the study was to investigate age-related effects, all models included age (child, young adult, elderly adult) as the between-subject factor.
Changes with age in power and frequency of oscillations (from whole-period analysis)
Sensorimotor cortex EEG activity.
A repeated-measures ANOVA was applied to SMC-EEG power values and to the ratio of lower to higher frequencies (2–13 Hz/14–32 Hz), including in the model for both analyses Hemisphere (contralateral, ipsilateral), and condition (rest, contraction), and, for SMC-EEG power values only, frequency (delta/theta, alpha, beta) as within-subject factors.
EMG activity.
Repeated-measures ANOVAs were applied to the absolute power and to the relative power for ROP-EMG, including frequency (delta/theta, alpha, beta, low gamma, and high gamma) as a within-subject factor for both and Side (right, left) as a within-subject factor for the absolute EMG power analysis. The ratio of lower to higher frequencies of the ROP-EMG power (2–13 Hz/14–32 Hz) was analyzed using a univariate ANOVA.
Changes with age in CMC and its stationarity
CMC (from whole-period analysis).
A multivariate ANOVA was applied to the amplitude and frequency of the maximum contralateral CMC peak.
Stationarity of CMC (from sliding window analysis).
Since the data were not normally distributed, the Kruskal–Wallis test (three independent samples) was applied to the coefficient of variation of the amplitude and frequency of the contralateral CMC peak in each window, to the proportion of time windows without significant CMC and to the index of spatial shifting.
Performance
Comparison between PI and PIPressure.
Intersubject and intrasubject comparisons were performed: a one-tailed Pearson correlation between the mean PI and mean PIpressure for each subject was applied for the intersubject analysis; for the intrasubject analysis a univariate ANOVA of the individual values for each brief period of contraction was used with subject as a random factor.
Relationship between PI and other neurophysiological variables (from whole-period analysis).
For those variables in which a significant age effect was demonstrated, we evaluated their correlation with PI pooling all the groups together. We used a Pearson correlation controlling for age. When overall relationship with PI was found, we evaluated the relationship with PI separately within each group to investigate whether a specific age group was driving the relationship.
Relationship between PI and other neurophysiological variables (from sliding window analysis).
When no overall relationship with PI was found in the intersubject analysis, an intrasubject analysis on the data derived from the sliding window analysis was performed to determine whether different relationships occurred within each age group. For this latter analysis, a univariate ANOVA including subject as random factor and age as fixed factor was undertaken.
Results
The mean and SEs of the relevant data are shown in the figures or are reported in the text. The main effects (or trends) and significant interactions revealed by the full model ANOVAs are reported in Table 1.
Table 1.
SMC-EEG PSD, ROP-EMG PSD, and CMC statistics
| Full model ANOVA factor | F | p | df | Error df |
|---|---|---|---|---|
| SMC-EEG | ||||
| Hemisphere*frequency*condition*age | 2.645 | 0.045 | 4 | 48 |
| Hemisphere*frequency*age | 4.489 | 0.004 | 4 | 48 |
| Hemisphere*frequency | 4.598 | 0.032 | 1.28 | 48 |
| Hemisphere*age | 6.947 | 0.004 | 2 | 24 |
| Frequency*age | 10.857 | <0.001 | 4 | 48 |
| Frequency*condition | 3.026 | 0.058 | 2 | 48 |
| Frequency | 15.555 | <0.001 | 1.27 | 30.696 |
| Hemisphere | 9.319 | 0.005 | 1 | 24 |
| Condition | 3.114 | 0.09 | 1 | 24 |
| Age | 23.694 | <0.001 | 2 | 24 |
| SMC-EEG | ||||
| Age | 7.878 | 0.002 | 2 | 24 |
| Mu reactivity | ||||
| Hemisphere*age | 6.291 | 0.006 | 2 | 24 |
| Hemisphere | 3.917 | 0.059 | 1 | 24 |
| Absolute OP-EMG | ||||
| Side*frequency | 10.246 | 0.001 | 1.54 | 33.919 |
| Side*age | 2.983 | 0.071 | 2 | 22 |
| Frequency | 10.246 | 0.001 | 1.54 | 33.922 |
| Side | 13.318 | 0.001 | 1 | 22 |
| Relative ROP-EMG | ||||
| Frequency*age | 16.869 | <0.001 | 5.13 | 61.575 |
| Frequency | 242.67 | <0.001 | 2.56 | 61.575 |
| Age | 8.034 | 0.002 | 2 | 24 |
| ROP-EMG | ||||
| Age | 11.868 | <0.001 | 2 | 24 |
| CMC amplitude | ||||
| Age | 4.251 | 0.026 | 2 | 24 |
The F value, p value, df, and error df are reported for each main and interaction effect significant in the full model ANOVAs. SMG-EEG, Ratio between SMC-EEG PSD in the 2–13 Hz and in the 14–32 Hz range; ROP-EMG, ratio between ROP-EMG PSD in the 2–13 Hz and in the 14–32 Hz range; Mu reactivity, difference between the 8–23 Hz SMC-EEG PSD during isometric contraction and rest, normalized by rest; Relative ROP-EMG, ratio between power in each frequency band and the total power in the whole 2–100 Hz range; CMC amplitude, corticomuscular coherence (i.e., coherence between the contralateral SMC-EEG and ROP-EMG in the beta band).
Changes in SMC-EEG PSD with age
The full ANOVA model of the SMC-EEG activity indicated the main factor age as the strongest effect, “surviving” all interaction factors (Table 1, Fig. 6A). Children had higher power than both young and elderly adults (p < 0.001 for both). The significant interaction factor frequency*age (Table 1), indicated that activity in different bands contributed differently to the age effect, and we therefore performed reduced ANOVA models in each frequency band (with conditions and hemispheres still included as within-subject factors). There was an age effect for both delta/theta (p < 0.001) and alpha (p < 0.001) frequency bands, where power was always higher in children than in young and elderly adults (young adults: delta/theta, p < 0.001; alpha, p = 0.004; elderly adults: delta/theta, p < 0.001; alpha, p = 0.001). In the beta band, there was a trend toward an age effect (p = 0.053) corresponding to higher values in children than young adults (p = 0.059). The decrease in power between children and young adults was greater in lower than in higher frequencies (Fig. 6A). To have an estimate of this, we calculated the ratio of power in lower to higher frequencies (2–13 Hz/14–32 Hz) and confirmed an age effect (repeated-measures ANOVA, Table 1) with children having higher ratios than both young adults (p = 0.05; children, 19.9 ± 2.5; young adults, 10.2 ± 2.8) and elderly adults (p = 0.002; elderly adults, 5.6 ± 2.7), and no difference between condition and hemisphere was found.
Figure 6.

Spectral properties of SMC-EEG, ROP-EMG, and CMC: group data. A, PSD of SMC-EEG. Filled circles, During contraction; open circles, during rest; black circles, contralateral SMC; red circles, ipsilateral SMC; children, C; young adults, YA; elderly adults, EA. B, Relative PSD of EMG recorded from ROP. C, The amplitude of the significant CMC peaks. The data are grouped into delta/theta, alpha, and beta frequency bands. The circles and error bars represent means and SEMs, except for CMC in the alpha frequency band, where individual values are plotted, and in the beta frequency band, where data for the ipsilateral SMC are individual values. D, The frequency of the significant CMC peaks in the three age groups. The frequencies are grouped in 4 Hz blocks, and the frequencies on the x-axis represent the first frequency of the block; thus, for example, the first block includes all the subjects with CMC peak frequency in the range 11–14 Hz. Black bars represent the maximum peak within the frequency block; hashed bars, the secondary peak within the frequency block; crossed bars, the tertiary peak within the frequency block. The dashed line indicates the modal value for the frequency of CMC in young adults.
The full ANOVA model of the SMC-EEG activity also revealed a clear hemisphere effect (Table 1, Fig. 6A) that we investigated further. A reduced model considering rest data revealed the interaction age*hemisphere (p = 0.012), corresponding to right SMC-EEG power being higher than left in children (paired sample t test, p = 0.015), a trend in young adults (p = 0.10) and no significant difference in elderly adults (p = 0.44).
Changes with age in SMC-EEG suppression during ROP contraction
Suppression of alpha and beta frequency oscillations (mu rhythm) is an indicator of sensorimotor cortex activation during movement (Pfurtscheller and Berghold, 1989) and, consistent with this, there was a condition effect for the alpha and beta bands only (p = 0.05) in SMC-EEG power (Fig. 3, SMC-EEG, shows an example). We therefore estimated mu (alpha and beta) reactivity using the equation, reactivity = (rest − contraction)/rest; normalization for rest power values was applied to control for the age-dependent interhemispheric asymmetry of SMC-EEG power at rest. Repeated-measures ANOVA revealed an age*hemisphere interaction for mu reactivity (Table 1). As expected in young adults during contraction of ROP, suppression of both alpha and beta oscillations was greater in the contralateral/LSMC-EEG than in the ipsilateral/RSMC-EEG (p = 0.050 for both alpha and beta). This was not the case in children and elderly adults where the contralateral/LSMC-EEG and the ipsilateral/RSMC-EEG were suppressed to an equal degree during contraction of ROP (p > 0.20) for both age groups (Figs. 1, 3, 6A).
Changes in OP-EMG PSD with age
As expected for an attempted unilateral contraction of ROP there was a main effect for side (Table 1), with more activity in ROP-EMG than in LOP-EMG in each frequency. We performed a reduced model considering LOP-EMG PSD only to look for a possible age effect in the incidence of mirrored EMG activity. There was no age effect (p = 0.25) or age*frequency interactions (p = 0.2), indicating that, even if mirrored EMG activity did occur occasionally, its incidence was similar across all age groups.
There were clear age effects in absolute ROP-EMG power, which decreased with age. The reduction was significant in the lower frequencies (delta/theta, p = 0.030; alpha p = 0.049) and there was a trend in the higher frequencies (beta, p = 0.104; low gamma, p = 0.105; high gamma, p = 0.129). The reduction in power observed across all frequencies is likely to reflect, at least in part, systematic changes with age in muscle bulk and the thickness of subcutaneous fat and there may also be a contribution to the absolute power from cross talk from other adjacent muscles, which may be greater in children (Kuiken et al., 2003; Wehrli et al., 2007). The relative power of ROP-EMG in each frequency band was therefore investigated.
A shift toward the higher frequencies from childhood to old age, which was observed in the SMC-EEG, was also found in the relative ROP-EMG power (Fig. 3, ROP EMG, and Fig. 6B), as evidenced by the interaction factor age*frequency (Table 1). Post hoc comparisons in each frequency band showed higher relative power in the delta/theta frequency band in children compared with both young (p = 0.013) and elderly adults (p < 0.001) (Fig. 6B, delta/theta). In the alpha band, higher relative power was observed in young adults compared with elderly adults (p = 0.008) (Fig. 6B, alpha). Elderly adults had higher relative EMG power activity in the beta (14–32 Hz) (Fig. 6B, beta) and the low gamma (33–46 Hz) frequency bands compared with young adults (p < 0.001 for both) and children (p < 0.001 for both). No significant differences between groups were found in the high gamma frequency band. Reflecting the shift toward higher frequencies with increasing age, the frequency at which the highest peak in the PSD was observed increased significantly with age (children, 4.6 ± 0.42 Hz; young adults, 9.5 ± 0.82 Hz; elderly adults, 18.6 ± 0.92 Hz; p < 0.001) (Fig. 3, ROP-EMG). All post hoc comparisons between age groups were significant (children vs young adults, p < 0.001; children vs elderly adults, p < 0.001; young adults vs elderly adults, p < 0.001).
Finally, we calculated the ratio of relative power in lower to higher frequencies (2–13 Hz)/ (14–32 Hz) of the ROP-EMG (children, 1.22 ± 0.15; young adults, 1.07 ± 0.11; elderly adults, 0.49 ± 0.03), and a repeated-measures ANOVA revealed an age effect (Table 1), with no difference between children and young adults (p = 1) but a significantly lower ratio in the elderly than in young adults (p = 0.006) and children (p < 0.001).
Changes in CMC with age
Contralateral CMC amplitude
In the whole-period analysis all subjects showed significant CMC between left SMC-EEG and ROP-EMG. ANOVA revealed a main effect of age on the amplitude of the peak of CMC (Table 1); post hoc comparisons showed that the peak amplitude of CMC in children was smaller than for the young adults (p = 0.035) (Fig. 6C). To investigate whether the reduced amplitude of CMC observed in children reflected a lack of stationarity, we evaluated the variability of CMC with the sliding window analysis. The mean CMC amplitude for all the sliding windows was considerably above the significance level of 0.024 in all age groups (0.039 ± 0.02 in children, 0.078 ± 0.04 in the young and 0.066 ± 0.05 in the elderly adults; the mean value included all windows, not just windows with significant CMC). Although significant contralateral CMC was present in the majority of windows for all subjects (mean proportion of significant windows; 0.80 ± 0.14), the amplitude showed large fluctuations over time within subjects, dropping below significance level in some windows (Figs. 4, 7 show examples). The proportion of windows without significant CMC was different between the 3 age groups (p = 0.005) (Fig. 8A), with children having more windows without significant CMC than young adults (p = 0.001) and with the elderly showing a trend in the same direction (p = 0.059). The coefficient of variation of the amplitude of CMC peak was not significantly different between age groups, since the fluctuation in amplitude of the CMC peak was large even in the young adults (p = 0.650) (Fig. 8B).
Figure 7.

CMC time behavior in the three age groups. Representative illustrations of the topographic distributions of CMC estimated using the sliding window analysis (first 4 rows, vertical arrow indicates successive 30 s time windows) compared with the whole-period analysis (last row). CMC in the beta frequency band is plotted from two children (8 and 12 years of age), two young adults (21 and 22 years of age), and two elderly adults (80 and 73 years of age). The color scale indicates CMC values 0–0.1 for children and 0–0.2 for young and elderly adults. Presence of spatial shifting is illustrated in one of the subjects in each age group and the figures also illustrate larger networks in the children and the elderly than in young adults.
Figure 8.

Stationarity of CMC in the three age groups derived from the sliding window analysis. A, Proportion of time windows without significant CMC. B, The coefficient of variation (CV) of the amplitude of the CMC peak. C, D, The index reflecting the spatial shifting of the CMC peak (C) and the coefficient of variation (CV) of the frequency of the CMC peak (D). Lack of CMC stationarity is evident in all age groups, but most marked in children.
As already mentioned in the methods, we observed that the peak of CMC moved dynamically between the bipolar derivation identified in the whole-period analysis to a second more parietal derivation (Figs. 4, 7). This was observed in all three age groups and the index of spatial shifting did not show any difference with age (p = 0.315) (Fig. 8C).
Contralateral CMC peak frequency
The peak of maximum CMC occurred within the beta frequency band for all young adults, for 8 of 10 children and for 8 of 9 elderly adults. Two of the children and one of the elderly adults showed maximum CMC in the alpha frequency band. All young adults had a relatively narrow, single peak of significant CMC; six elderly adults and six children had secondary, smaller peaks of significant CMC (Fig. 3, CMC). One elderly subject had a third CMC peak. The modal frequency for the peak of CMC for the young adult subjects was 23 Hz (Fig. 6D). There was a significant difference between the age groups in the distributions of the frequency of the maximum CMC peak. The frequency of the CMC peak for young adults clustered close to the overall modal frequency while for children and elderly adults there was a broad spread of frequencies (Fig. 6D) (χ2 test applied to the proportion of subjects below and above 23 Hz; 3 × 2 contingency table; p = 0.001). From the sliding window analysis, we derived the coefficient of variation of the frequency of the maximum CMC peak, which was dependent on age (p = 0.032) with the children showing a significantly higher coefficient than the young adults (p = 0.004) (Fig. 8D).
Performance index
Comparison of PI with PIPressure
ROP-EMG and pressure in a representative subject are shown in Figure 5A. Between 7 and 11 values were estimated in each subject for the intrasubject correlation. A significant linear relationship was found between PI and PIPressure both for the intersubject (p = 0.012, r = 0.621) (Fig. 5B) and the intrasubject (p < 0.001, B = 0.438) (Fig. 5C) analyses; the intrasubject analysis revealed that 8 of 13 subjects had individually significant correlations.
Relationship between PI and central and peripheral neurophysiological variables
SMC-EEG
The ratios of the power in low to high frequencies (2–13 Hz/13–32 Hz) in SMC-EEG, during both rest and contraction, were inversely correlated to PI (rest: p = 0.017, r = −0.416; contraction: p = 0.017, r = −0.415). This relationship was mainly driven by the children, since the correlations were significant only within the group of the children (rest: p = 0.031, r = −0.641; contraction: p = 0.006, r = −0.789) whereas in the adult groups the correlation was not significant (rest: p = 0.114, r = −0.319; contraction: p = 0.189, r = −0.237).
Mu activity power (power in the alpha and beta band summed) in the left SMC at rest was inversely correlated with PI (p = 0.036, r = −0.358). This relationship was driven mainly by the elderly adults with a significant correlation observed only within this age group (p = 0.013, r = −0.731).
ROP-EMG
Low and high gamma power in the relative EMG were both correlated with PI (low gamma: p = 0.046, r = 0.338; high gamma: p < 0.001, r = 0.651). The ratio of lower to higher frequencies (2–13 Hz/13–32 Hz) in the ROP-EMG was inversely correlated with PI (p < 0.001, r = −0.651), and there was no difference between age groups.
CMC
From the whole-period analysis, a negative relationship was found between PI and the difference between the frequency of the maximum CMC peak in each subject and the modal value for young adults, i.e., 23 Hz (p = 0.036, r = −0.351).
Although no intersubject relationship was found between the amplitude of CMC and PI, the coefficient of variation of the CMC peak amplitude was positively correlated with PI (p = 0.020, r = 0.404). To investigate the latter finding further, we studied the intrasubject relationship between the amplitude of CMC and PI using the sliding window analysis; a significant interaction age*PI was revealed (p = 0.008). In the reduced model by age, there was an inverse relationship between the peak amplitude of CMC and PI in the young adults (B = −0.963, p = 0.003) with five of eight subjects showing individually significant negative relationships between CMC and PI (Fig. 9B). There was no significant relationship in the elderly (p = 0.403), but three subjects did show individually significant negative relationships (Fig. 9C). Similarly, although there was not significant relationship for the children (p = 0.788) (Fig. 9A), the two oldest children had individually significant negative relationships between CMC and PI.
Figure 9.

Intrasubject relationship between CMC and performance. A–C, The residuals from the mean value of PI and CMC for each subject: children (A); young adults (B); and elderly adults (C). Within each graph, the same color represents the same subject. The colored lines indicate individually significant relationships between PI and CMC. The filled symbols indicate significant CMC, and the open symbols CMC values, which are not significant at the 95% level. Although in children (A) residuals are spread in the four quadrants, in the young adults (B) they are tightly clustered in the first and third quadrants, and in the elderly adults (C), when the relationship between performance and CMC begins to break down, residuals begin again to appear in the second and fourth quadrant.
Other findings
Ipsilateral corticomuscular coherence
CMC ipsilateral to ROP was observed in four children, three young adults, and five elderly adults with the whole-period analysis (Figs. 3, CMC, and 7 show examples). Ipsilateral CMC occurred typically at similar frequencies to contralateral CMC, in particular within the beta frequency band for two children, three young adults, and four elderly adults, and in the alpha frequency for two children and one elderly adult.
The subjects with ipsilateral CMC did not show a significantly different performance from the subjects without ipsilateral CMC [p = 0.704, ANOVA with between-subject factor: ipsilateral CMC (present/not present)].
The relationship between SMC-EEG and ROP-EMG
Whereas no correlation between the ROP-EMG and SMC-EEG activity in the delta/theta, alpha or beta band was found, there was a significant correlation between the ratio of the power of lower to higher frequencies (2–13 Hz/13–32 Hz) in the SMC-EEG and in ratio for the relative power of the ROP-EMG (after correcting for age and PI, p = 0.039; r = 0.358).
Discussion
Changes in power and frequencyof oscillations from childhood to adulthood
A striking decrease in SMC-EEG power occurred between childhood and adulthood, more evident at low frequencies (delta to alpha bands). It is a limitation of our study, however, that because of the technical limitations of EEG recording and our analysis, frequencies higher than beta could not be investigated. During adolescence, the number of cortical synapses decreases substantially (Huttenlocher and Dabholkar, 1997); with no large-scale neuronal loss, reduced connectivity between neurons must occur. Resting state functional connectivity MRI confirms reduction in strongly correlated, cortical connections between childhood and adulthood (Fair et al., 2007). The higher power of the SMC-EEG in childhood is likely therefore to reflect greater, nonspecific neuronal connectivity, leading to a high degree of synchrony in neural oscillations. Our observation of bilateral mu suppression in children performing a simple unilateral task is indicative also of a more distributed neural network and is consistent with functional MRI studies showing more diffuse cortical activation in children (Müller et al., 1998).
The decrease in oscillatory power between childhood and adulthood was not distributed equally across frequencies but was most marked in the lower frequencies (delta/theta and alpha). Thus the ratio of power in lower versus higher frequencies (2–13 Hz/14–32 Hz) decreased significantly from childhood to adulthood. We propose that the relative preservation of power in the higher frequencies reflects maturation of intracortical inhibition during adolescence since the capacity for synchronous beta and gamma oscillations is largely determined by the temporal and spatial dynamics of inhibitory input to the network (Pauluis et al., 1999; Mall et al., 2004). A shift toward higher frequencies was also observed in the relative power of ROP-EMG, which may reflect changes in oscillatory activity in the SMC-EEG, mediated by corticospinal input to spinal motoneuronal pools. Indeed, while there was no correlation between the absolute power in each frequency between EEG and EMG, we found a significant correlation between the ratio of the power in lower and higher frequencies in the SMC-EEG and the same ratio in the relative power of the ROP-EMG. However, the capacity for spinal motoneuronal pools to oscillate at higher frequencies is also dependent upon fast synaptic inhibition and developmental changes in the pattern of spinal inhibition will also influence their intrinsic oscillatory activity and may account, at least in part, for the frequency shift (O'Sullivan et al., 1991; Mc Donough et al., 2001; Furlan et al., 2007; Sibilla and Ballerini, 2009).
The combination of focused connectivity and the capacity to oscillate at higher frequencies are markers for maturation of neuronal networks. The higher the power of the mu rhythm in the LSMC-EEG and the greater the ratio of low to high frequencies in both EEG and EMG, the poorer was the performance within the group of children, supporting the relevance of these processes to the development of fine motor control of the hand.
Changes in power and frequency of oscillations in the elderly
Although there is no overt loss of neurons during normal aging (Haug and Eggers, 1991), the complexity of dendrite arborization becomes reduced (Anderson and Rutledge, 1996) and there is a significant reduction in synaptic density (Huttenlocher, 1979). Given these changes, we anticipated further loss of EEG power in old age but, this was not observed and, if anything, there was a trend toward increased power in the beta frequency. This finding implies that loss of synapses is counterbalanced by increased numbers of neurons synchronously oscillating, increasing the power observed at the scalp. In support of a larger network, bilateral mu suppression occurred also in the elderly adults. There are a myriad of studies documenting more distributed networks in old age (Ward, 2006), and there is continuing debate about whether it represents functional reorganization recruiting a larger area to compensate for loss of synaptic connections or loss of specificity of neural networks in old age and thereby contributing to decline in performance (Ward, 2006). In our study, higher power in the mu rhythm of LSMC-EEG was associated with a poorer performance in the group of elderly adults, supporting the latter argument.
Substantial changes occur in CMC during development and aging
This is the first time CMC has been demonstrated in children and in elderly adults. Beta frequency EMG-to-EMG coherence between synergistic hand muscles in children has been observed (Farmer et al., 2007), but subsequently CMC was not found (James et al., 2008). However, pooled data were analyzed, which would obscure individually significant CMC, since the peaks in children are distributed over a broad range of frequencies. Furthermore, EMG from forearm extensor muscles during wrist extension was used; the strength of EMG-to-EMG and EEG-to-EMG coherence follows a distal–proximal gradient, with the greatest values being observed in intrinsic hand muscles (Farmer et al., 1993). Finally, synchronous beta frequency oscillations in the sensorimotor cortex occur less frequently and are of lower amplitude during wrist extension compared with tasks involving manipulation (Murthy and Fetz, 1992).
While we observed CMC in children and the elderly, its characteristics were different from young adults. A single peak of CMC within the beta frequency was observed in young adults, clustered close to 23 Hz; children and elderly adults often had multiple peaks of CMC and the frequency of maximum CMC was more widely dispersed and included CMC at alpha frequencies. Williams and Baker (2009) modeled the possible contribution of recurrent inhibition on reducing CMC at physiological tremor frequencies. It is possible that immaturity of recurrent inhibition or its breakdown in old age contribute to the emergence of alpha frequency CMC in childhood and old age.
The fine-tuning of the frequency of CMC within the beta frequency is likely to be functionally relevant since the degree to which the peak of CMC deviated from 23 Hz was negatively related to performance. Beta frequency oscillation has recently attracted attention as the coordinating frequency for large-scale or widely separated networks because its periodicity is sufficiently long to coordinate neuronal activity separated in time by appreciable axonal conduction delays (Kopell et al., 2000). Studies in monkeys highlight the importance of beta frequency activity to the corticospinal system; during the steady-hold phase of a precision grip, increased synchrony in the beta frequency occurs across the motor cortex (Murthy and Fetz, 1992; Baker et al., 1997; Davies et al., 2006), the modal interspike intervals of corticospinal axons lie in the beta frequency (Lemon and Mantel, 1989), and there is preferential facilitation of spinal motoneurons by corticospinal input within the beta frequency band (Lemon and Mantel, 1989).
CMC was considerably smaller in children compared with both the young and elderly adults, despite higher power of alpha and beta oscillations in their EEG. The increase in the amplitude of CMC occurring between childhood and adulthood, despite a coincidental reduction in the power of these frequencies in SMC-EEG, implies that active processes are involved in the preferential transfer of beta frequency oscillations to spinal motor units, which mature in adolescence (Riddle et al., 2004).
While a lack of stationarity was observed in all age groups, with significant fluctuations occurring in the site, amplitude and frequency of the peak of CMC, this was most evident in children who had high variability in the frequency of peak CMC and lowest probability of CMC in the sliding window analysis.
CMC probably reflects bidirectional sensorimotor processing
The sliding window analysis revealed that CMC shifts transiently between a frontal and a more parietal site, consistent with bidirectional sensory and motor cortical components to CMC. Oscillations synchronized with those in EMG appear in peripheral afferents (Baker et al., 2006), spinal cord interneurons (Takei and Seki, 2008), and sensory and motor cortices (Porcaro et al., 2008), and coherence between oscillations in the primary motor and sensory cortices has been confirmed in man using magnetoencephalography (Porcaro et al., 2008) and epicortical recordings using subdural grid electrodes (Ohara et al., 2000). Furthermore, evidence for bidirectional information flow in CMC (Meng et al., 2008) supports the proposal that coherent oscillatory networks form connected loops from cortex to the periphery and back and would be suited to proprioceptive processing during movement (Baker, 2007). We observed in young adults increased CMC when performance was poor, consistent with increased, probably bidirectional, central–peripheral coupling to correct for variability in the level of contraction. [This finding may appear contradictory to the positive relationship between CMC and performance reported previously (Kristeva et al., 2007). However, unlike our subjects, the subjects of Kristeva et al. (2007) performed a complex visuomotor task, where transient reductions in sensorimotor processing would lead to a reduced performance.] Modulation of CMC in relation to performance was not observed in the majority of elderly adults nor was it present in the children, except for the two oldest. The failure to modulate CMC is likely to reflect immaturity or breakdown of processes at both the sensorimotor cortex and spinal cord destabilizing corticospinal bidirectional loops.
Conclusions
We have previously proposed that representation of the hand in the human primary sensorimotor cortex is reflected in a “frequency coding” as well as in areal-based, somatotopic representation (Tecchio et al., 2004). Furthermore, that dynamic properties of networks such as the degree of frequency specificity and the precision of interregional phase locking, code for the relative importance of the network in movement control (Tecchio et al., 2007). This study reveals that it may also reflect its maturity since progressive fine-tuning of the frequency coding occurs during adolescence and stabilization of the dynamic properties of networks involved in hand control are likely to contribute to maturation of fine motor control. In old age, blurring of the tuning between networks and breakdown in their integration occur and are likely to contribute to a decrement in motor control.
Footnotes
This work was supported by the Wellcome Trust and by the European Community's Seventh Framework Programme under Grant Agreement No. 200859. We thank Dr. Giovanni Assenza and P. Matilde Ercolani for their excellent clinical and technical support.
References
- Anderson B, Rutledge V. Age and hemisphere effects on dendritic structure. Brain. 1996;119:1983–1990. doi: 10.1093/brain/119.6.1983. [DOI] [PubMed] [Google Scholar]
- Andrew C, Pfurtscheller G. Dependence of coherence measurements on EEG derivation type. Med Biol Eng Comput. 1996;34:232–238. doi: 10.1007/BF02520079. [DOI] [PubMed] [Google Scholar]
- Baker SN. Oscillatory interactions between sensorimotor cortex and the periphery. Curr Opin Neurobiol. 2007;17:649–655. doi: 10.1016/j.conb.2008.01.007. [DOI] [PMC free article] [PubMed] [Google Scholar]
- Baker SN, Olivier E, Lemon RN. Coherent oscillations in monkey motor cortex and hand muscle EMG show task dependent modulation. J Physiol. 1997;501:225–241. doi: 10.1111/j.1469-7793.1997.225bo.x. [DOI] [PMC free article] [PubMed] [Google Scholar]
- Baker SN, Pinches EM, Lemon RN. Synchronization in monkey motor cortex during a precision grip task. II. Effect of oscillatory activity on corticospinal output. J Neurophysiol. 2003;89:1941–1953. doi: 10.1152/jn.00832.2002. [DOI] [PubMed] [Google Scholar]
- Baker SN, Chiu M, Fetz EE. Afferent encoding of central oscillations in the monkey arm. J Neurophysiol. 2006;95:3904–3910. doi: 10.1152/jn.01106.2005. [DOI] [PubMed] [Google Scholar]
- Basmajian J, De Luca J. Ed 5. Baltimore: Williams and Wilkins; 1985. Muscles alive: their functions revealed by electromyography. [Google Scholar]
- Bennett KM, Lemon RN. Corticomotoneuronal contribution to the fractionation of muscle activity during precision grip in the monkey. J Neurophysiol. 1996;75:1826–1842. doi: 10.1152/jn.1996.75.5.1826. [DOI] [PubMed] [Google Scholar]
- Brown P. Cortical drives to human muscle: the piper and related rhythms. Prog Neurobiol. 2000;60:97–108. doi: 10.1016/s0301-0082(99)00029-5. [DOI] [PubMed] [Google Scholar]
- Brown P, Salenius S, Rothwell JC, Hari R. Cortical correlate of the Piper rhythm in humans. J Neurophysiol. 1998;80:2911–2917. doi: 10.1152/jn.1998.80.6.2911. [DOI] [PubMed] [Google Scholar]
- Carlin KP, Liu J, Jordan LM. Postnatal changes in the inactivation properties of voltage-gated sodium channels contribute to the mature firing pattern of spinal motoneurons. J Neurophysiol. 2008;99:2864–2876. doi: 10.1152/jn.00059.2008. [DOI] [PubMed] [Google Scholar]
- Crone NE, Miglioretti DL, Gordon B, Lesser RP. Functional mapping of human sensorimotor cortex with electrocorticographic spectral analysis II: event-related desynchronization in the gamma band. Brain. 1998;121:2301–2315. doi: 10.1093/brain/121.12.2301. [DOI] [PubMed] [Google Scholar]
- Crutcher MD, Alexander GE. Movement-related neuronal activity selectively coding either direction or muscle pattern in three motor areas of the monkey. J Neurophysiol. 1990;64:151–163. doi: 10.1152/jn.1990.64.1.151. [DOI] [PubMed] [Google Scholar]
- Davies RM, Gerstein GL, Baker SN. Measurement of time-dependent changes in the irregularity of neural spiking. J Neurophysiol. 2006;96:906–918. doi: 10.1152/jn.01030.2005. [DOI] [PubMed] [Google Scholar]
- Delorme A, Makeig S. EEGLAB: an open source toolbox for analysis of single-trial EEG dynamics. J Neurosci Methods. 2004;134:9–21. doi: 10.1016/j.jneumeth.2003.10.009. [DOI] [PubMed] [Google Scholar]
- Dickstein DL, Kabaso D, Rocher AB, Luebke JI, Wearne SL, Hof PR. Changes in the structural complexity of the aged brain. Aging Cell. 2007;6:275–284. doi: 10.1111/j.1474-9726.2007.00289.x. [DOI] [PMC free article] [PubMed] [Google Scholar]
- Donoghue JP, Sanes JN, Hatsospoulos NG, Gaál G. Neural discharge and local field potential oscillations in primate motor cortex during voluntary movements. J Neurophysiol. 1998;79:159–173. doi: 10.1152/jn.1998.79.1.159. [DOI] [PubMed] [Google Scholar]
- Erim Z, Beg MF, Burke DT, de Luca CJ. Effects of aging on motor-unit control properties. J Neurophysiol. 1999;82:2081–2091. doi: 10.1152/jn.1999.82.5.2081. [DOI] [PubMed] [Google Scholar]
- Eyre JA, Miller S, Ramesh V. Constancy of central conduction delays during development in man: investigation of motor and somatosensory pathways. J Physiol. 1991;434:441–452. doi: 10.1113/jphysiol.1991.sp018479. [DOI] [PMC free article] [PubMed] [Google Scholar]
- Fair DA, Dosenbach NU, Church JA, Cohen AL, Brahmbhatt S, Miezin FM, Barch DM, Raichle ME, Petersen SE, Schlaggar BL. Development of distinct control networks through segregation and integration. Proc Natl Acad Sci U S A. 2007;104:13507–13512. [Google Scholar]
- Farmer SF, Bremner FD, Halliday DM, Rosenberg JR, Stephens JA. The frequency content of common synaptic inputs to motoneurones during voluntary isometric contraction in man. J Physiol. 1993;470:127–155. doi: 10.1113/jphysiol.1993.sp019851. [DOI] [PMC free article] [PubMed] [Google Scholar]
- Farmer SF, Gibbs J, Halliday DM, Harrison LM, James LM, Mayston MJ, Stephens JA. Changes in EMG coherence between long and short thumb abductor muscles during human development. J Physiol. 2007;579:389–402. doi: 10.1113/jphysiol.2006.123174. [DOI] [PMC free article] [PubMed] [Google Scholar]
- Furlan F, Taccola G, Grandolfo M, Guasti L, Arcangeli A, Nistri A, Ballerini L. ERG conductance expression modulates the excitability of ventral horn GABAergic interneurons that control rhythmic oscillations in the developing mouse spinal cord. J Neurosci. 2007;27:919–928. doi: 10.1523/JNEUROSCI.4035-06.2007. [DOI] [PMC free article] [PubMed] [Google Scholar]
- Garvey MA, Ziemann U, Bartko JJ, Denckla MB, Barker CA, Wassermann EM. Cortical correlates of neuromotor development in healthy children. Clin Neurophysiol. 2003;114:1662–1670. doi: 10.1016/s1388-2457(03)00130-5. [DOI] [PubMed] [Google Scholar]
- Gerloff C, Braun C, Staudt M, Hegner YL, Dichgans J, Krägeloh-Mann I. Coherent corticomuscular oscillations originate from primary motor cortex: evidence from patients with early brain lesions. Hum Brain Mapp. 2006;27:789–798. doi: 10.1002/hbm.20220. [DOI] [PMC free article] [PubMed] [Google Scholar]
- Hari R, Salenius S. Rhythmical corticomotor communication. Neuroreport. 1999;10:R1–R10. [PubMed] [Google Scholar]
- Haug H, Eggers R. Morphometry of the human cortex cerebri and corpus striatum during aging. Neurobiol Aging. 1991;12:336–338. doi: 10.1016/0197-4580(91)90013-a. [DOI] [PubMed] [Google Scholar]
- Huttenlocher PR. Synaptic density in the human frontal cortex—developmental changes and effects of aging. Brain Res. 1979;163:195–205. doi: 10.1016/0006-8993(79)90349-4. [DOI] [PubMed] [Google Scholar]
- Huttenlocher PR. Morphometric study of human cerebral cortex development. Neuropsychologia. 1990;28:517–527. doi: 10.1016/0028-3932(90)90031-i. [DOI] [PubMed] [Google Scholar]
- Huttenlocher PR, Dabholkar AS. Regional differences in synaptogenesis in human cerebral cortex. J Comp Neurol. 1997;387:167–178. doi: 10.1002/(sici)1096-9861(19971020)387:2<167::aid-cne1>3.0.co;2-z. [DOI] [PubMed] [Google Scholar]
- Incel NA, Sezgin M, As I, Cimen OB, Sahin G. The geriatric hand: correlation of hand-muscle function and activity restriction in elderly. Int J Rehabil Res. 2009;32:213–218. doi: 10.1097/MRR.0b013e3283298226. [DOI] [PubMed] [Google Scholar]
- James LM, Halliday DM, Stephens JA, Farmer SF. On the development of human corticospinal oscillations: age-related changes in EEG-EMG coherence and cumulant. Eur J Neurosci. 2008;27:3369–3379. doi: 10.1111/j.1460-9568.2008.06277.x. [DOI] [PubMed] [Google Scholar]
- Jasper R. Report of committee on methods of clinical exam in EEG. Electroencephalogr Clin Neurophysiol. 1958;10:370–375. [Google Scholar]
- Kilner JM, Baker SN, Salenius S, Jousmäki V, Hari R, Lemon RN. Task-dependent modulation of 15–30 Hz coherence between rectified EMGs from human hand and forearm muscles. J Physiol. 1999;516:559–570. doi: 10.1111/j.1469-7793.1999.0559v.x. [DOI] [PMC free article] [PubMed] [Google Scholar]
- Kilner JM, Alonso-Alonso M, Fisher R, Lemon RN. Modulation of synchrony between single motor units during precision grip tasks in humans. J Physiol. 2002;541:937–948. doi: 10.1113/jphysiol.2001.013305. [DOI] [PMC free article] [PubMed] [Google Scholar]
- Kopell N, Ermentrout GB, Whittington MA, Traub RD. Gamma rhythms and beta rhythms have different synchronization properties. Proc Natl Acad Sci U S A. 2000;97:1867–1872. doi: 10.1073/pnas.97.4.1867. [DOI] [PMC free article] [PubMed] [Google Scholar]
- Kristeva R, Patino L, Omlor W. Beta-range cortical motor spectral power and corticomuscular coherence as a mechanism for effective corticospinal interaction during steady-state motor output. Neuroimage. 2007;36:785–792. doi: 10.1016/j.neuroimage.2007.03.025. [DOI] [PubMed] [Google Scholar]
- Kristeva-Feige R, Fritsch C, Timmer J, Lücking CH. Effects of attention and precision of exerted force on beta range EEG-EMG synchronization during a maintained motor contraction task. Clin Neurophysiol. 2002;113:124–131. doi: 10.1016/s1388-2457(01)00722-2. [DOI] [PubMed] [Google Scholar]
- Kuiken TA, Lowery MM, Stoykov NS. The effect of subcutaneous fat on myoelectric signal amplitude and cross-talk. Prosthet Orthot Int. 2003;27:48–54. doi: 10.3109/03093640309167976. [DOI] [PubMed] [Google Scholar]
- Kuypers HG. Corticospinal connections: postnatal development in the rhesus monkey. Science. 1962;138:678–680. doi: 10.1126/science.138.3541.678. [DOI] [PubMed] [Google Scholar]
- Labyt E, Szurhaj W, Bourriez JL, Cassim F, Defebvre L, Destée A, Derambure P. Influence of aging on cortical activity associated with a visuo-motor task. Neurobiol Aging. 2004;25:817–827. doi: 10.1016/j.neurobiolaging.2003.08.010. [DOI] [PubMed] [Google Scholar]
- Lawrence DG, Hopkins DA. The development of motor control in the rhesus monkey: evidence concerning the role of corticomotoneuronal connections. Brain. 1976;99:235–254. doi: 10.1093/brain/99.2.235. [DOI] [PubMed] [Google Scholar]
- Lawrence DG, Kuypers HG. The functional organization of the motor system in the monkey. I. The effects of bilateral pyramidal lesions. Brain. 1968;91:1–14. doi: 10.1093/brain/91.1.1. [DOI] [PubMed] [Google Scholar]
- Lawrence JH, De Luca CJ. Myoelectric signal versus force relationship in different human muscles. J Appl Physiol. 1983;54:1653–1659. doi: 10.1152/jappl.1983.54.6.1653. [DOI] [PubMed] [Google Scholar]
- Lemon RN. Mechanisms of cortical control of hand function. Neuroscientist. 1997;3:389–398. [Google Scholar]
- Lemon RN, Mantel GW. The influence of changes in the discharge frequency of corticospinal neurones on hand muscles in the monkey. J Physiol. 1989;413:351–378. doi: 10.1113/jphysiol.1989.sp017658. [DOI] [PMC free article] [PubMed] [Google Scholar]
- Lemon RN, Mantel GW, Muir RB. Corticospinal facilitation of hand muscles during voluntary movement in the conscious monkey. J Physiol. 1986;381:497–527. doi: 10.1113/jphysiol.1986.sp016341. [DOI] [PMC free article] [PubMed] [Google Scholar]
- Mall V, Berweck S, Fietzek UM, Glocker FX, Oberhuber U, Walther M, Schessl J, Schulte-Mönting J, Korinthenberg R, Heinen F. Low level of intracortical inhibition in children shown by transcranial magnetic stimulation. Neuropediatrics. 2004;35:120–125. doi: 10.1055/s-2004-815834. [DOI] [PubMed] [Google Scholar]
- Matsunami K, Hamada I. Activities of single precentral neurons of the monkey during different tasks of forelimb movements. Jpn J Physiol. 1983;33:309–322. doi: 10.2170/jjphysiol.33.309. [DOI] [PubMed] [Google Scholar]
- McAuley JH, Rothwell JC, Marsden CD. Frequency peaks of tremor, muscle vibration and electromyographic activity at 10 Hz, 20 Hz and 40 Hz during human finger muscle contraction may reflect rhythmicities of central neural firing. Exp Brain Res. 1997;114:525–541. doi: 10.1007/pl00005662. [DOI] [PubMed] [Google Scholar]
- Mc Donough SM, Clowry GJ, Miller S, Eyre JA. Group 1a inhibition and renshaw (recurrent) inhibition are functional in man at birth. Brain Res. 2001;899:66–81. doi: 10.1016/s0006-8993(01)02151-5. [DOI] [PubMed] [Google Scholar]
- Meng F, Tong KY, Chan ST, Wong WW, Lui KH, Tang KW, Gao X, Gao S. Study on connectivity between coherent central rhythm and electromyographic activities. J Neural Eng. 2008;5:324–332. doi: 10.1088/1741-2560/5/3/005. [DOI] [PubMed] [Google Scholar]
- Mentis GZ, Díaz E, Moran LB, Navarrete R. Increased incidence of gap junctional coupling between spinal motoneurons following transient blockade of NMDA receptors in neonatal rats. J Physiol. 2002;544:757–764. doi: 10.1113/jphysiol.2002.028159. [DOI] [PMC free article] [PubMed] [Google Scholar]
- Mima T, Hallett M. Electroencephalographic analysis of cortico-muscular coherence: reference effect, volume conduction and generator mechanism. Clin Neurophysiol. 1999a;110:1892–1899. doi: 10.1016/s1388-2457(99)00238-2. [DOI] [PubMed] [Google Scholar]
- Mima T, Hallett M. Corticomuscular coherence: a review. J Clin Neurophysiol. 1999b;16:501–511. doi: 10.1097/00004691-199911000-00002. [DOI] [PubMed] [Google Scholar]
- Moscufo N, Guttmann C, Meier D, Csapo I, Hildenbrand P, Healy B, Schmidt J, Wolfson L. Brain regional lesion burden and impaired mobility in the elderly. Neurobiol Aging. 2009 doi: 10.1016/j.neurobiolaging.2009.04.010. [DOI] [PMC free article] [PubMed] [Google Scholar]
- Müller K, Hömberg V. Development of speed repetitive movements in children is determined by structural changes in corticospinal afferents. Neurosci Lett. 1992;144:57–60. doi: 10.1016/0304-3940(92)90715-j. [DOI] [PubMed] [Google Scholar]
- Müller RA, Rothermel RD, Behen ME, Muzik O, Mangner TJ, Chugani HT. Developmental changes of cortical and cerebellar motor control: a clinical positron emission tomography study with children and adults. J Child Neurol. 1998;13:550–556. doi: 10.1177/088307389801301105. [DOI] [PubMed] [Google Scholar]
- Murthy VN, Fetz EE. Coherent 25- to 35-Hz oscillations in the sensorimotor cortex of awake behaving monkeys. Proc Natl Acad Sci U S A. 1992;89:5670–5674. doi: 10.1073/pnas.89.12.5670. [DOI] [PMC free article] [PubMed] [Google Scholar]
- Niedermeyer E. The normal EEG of the waking adult. In: Niedermeyer E, Lopes da Silva F, editors. Electroencephalography: basic principles, clinical applications and related fields. Ed 4. Baltimore: Lippincott Williams and Wilkins; 1998. pp. 149–173. [Google Scholar]
- Nistri A, Ostroumov K, Sharifullina E, Taccola G. Tuning and playing a motor rhythm: how metabotropic glutamate receptors orchestrate generation of motor patterns in the mammalian central nervous system. J Physiol. 2006;572:323–334. doi: 10.1113/jphysiol.2005.100610. [DOI] [PMC free article] [PubMed] [Google Scholar]
- Nunez P, Srinivasan R. New York: Oxford UP; 2006. Electric fields of the brain. [Google Scholar]
- Ohara S, Nagamine T, Ikeda A, Kunieda T, Matsumoto R, Taki W, Hashimoto N, Baba K, Mihara T, Salenius S, Shibasaki H. Electrocorticogram-electromyogram coherence during isometric contraction of hand muscle in human. Clin Neurophysiol. 2000;111:2014–2024. doi: 10.1016/s1388-2457(00)00448-x. [DOI] [PubMed] [Google Scholar]
- Oldfield RC. The assessment and analysis of handedness: the Edinburgh inventory. Neuropsychologia. 1971;9:97–113. doi: 10.1016/0028-3932(71)90067-4. [DOI] [PubMed] [Google Scholar]
- Oostenveld R, Praamstra P. The five percent electrode system for high-resolution EEG and ERP measurements. Clin Neurophysiol. 2001;112:713–719. doi: 10.1016/s1388-2457(00)00527-7. [DOI] [PubMed] [Google Scholar]
- O'Sullivan MC, Eyre JA, Miller S. Radiation of the phasic stretch reflex in biceps brachii to muscles of the arm in man and its restriction during development. J Physiol. 1991;439:529–543. doi: 10.1113/jphysiol.1991.sp018680. [DOI] [PMC free article] [PubMed] [Google Scholar]
- Pauluis Q, Baker SN, Olivier E. Emergent oscillations in a realistic network: the role of inhibition and the effect of the spatiotemporal distribution of the input. J Comput Neurosci. 1999;6:27–48. doi: 10.1023/a:1008804916112. [DOI] [PubMed] [Google Scholar]
- Peinemann A, Lehner C, Conrad B, Siebner HR. Age-related decrease in paired-pulse intracortical inhibition in the human primary motor cortex. Neurosci Lett. 2001;313:33–36. doi: 10.1016/s0304-3940(01)02239-x. [DOI] [PubMed] [Google Scholar]
- Perez MA, Lundbye-Jensen J, Nielsen JB. Changes in corticospinal drive to spinal motoneurones following visuo-motor skill learning in humans. J Physiol. 2006;573:843–855. doi: 10.1113/jphysiol.2006.105361. [DOI] [PMC free article] [PubMed] [Google Scholar]
- Pfurtscheller G, Berghold A. Patterns of cortical activation during planning of voluntary movement. Electroencephalogr Clin Neurophysiol. 1989;72:250–258. doi: 10.1016/0013-4694(89)90250-2. [DOI] [PubMed] [Google Scholar]
- Porcaro C, Barbi G, Zappasodi F, Rossini PM, Tecchio F. Hand sensory-motor cortical network assessed by functional source separation. Hum Brain Mapp. 2008;29:70–81. doi: 10.1002/hbm.20367. [DOI] [PMC free article] [PubMed] [Google Scholar]
- Porter R, Lemon R. Oxford: Oxford UP; 1993. Corticospinal function and voluntary movement. [Google Scholar]
- Riddle CN, Baker MR, Baker SN. The effect of carbamazepine on human corticomuscular coherence. Neuroimage. 2004;22:333–340. doi: 10.1016/j.neuroimage.2003.12.040. [DOI] [PubMed] [Google Scholar]
- Rossignol S, Dubuc R. Spinal pattern generation. Curr Opin Neurobiol. 1994;4:894–902. doi: 10.1016/0959-4388(94)90139-2. [DOI] [PubMed] [Google Scholar]
- Sibilla S, Ballerini L. GABAergic and glycinergic interneuron expression during spinal cord development: dynamic interplay between inhibition and excitation in the control of ventral network outputs. Prog Neurobiol. 2009;89:46–60. doi: 10.1016/j.pneurobio.2009.06.001. [DOI] [PubMed] [Google Scholar]
- Solomonow M, Baratta R, Shoji H, D'Ambrosia R. The EMG-force relationships of skeletal muscle; dependence on contraction rate, and motor units control strategy. Electromyogr Clin Neurophysiol. 1990;30:141–152. [PubMed] [Google Scholar]
- Szurhaj W, Derambure P. Intracerebral study of gamma oscillations in the human sensorimotor cortex. Prog Brain Res. 2006;159:297–310. doi: 10.1016/S0079-6123(06)59020-X. [DOI] [PubMed] [Google Scholar]
- Takei T, Seki K. Spinomuscular coherence in monkeys performing a precision grip. J Neurophysiol. 2008;99:2012–2020. doi: 10.1152/jn.01181.2007. [DOI] [PubMed] [Google Scholar]
- Tecchio F, De Lucia M, Salustri C, Montuori M, Bottaccio M, Babiloni C, Pietronero L, Zappasodi F, Rossini PM. District-related frequency specificity in hand cortical representation: dynamics of regional activation and intra-regional synchronization. Brain Res. 2004;1014:80–86. doi: 10.1016/j.brainres.2004.04.028. [DOI] [PubMed] [Google Scholar]
- Tecchio F, Porcaro C, Zappasodi F, Pesenti A, Ercolani M, Rossini PM. Cortical short-term fatigue effects assessed via rhythmic brain-muscle coherence. Exp Brain Res. 2006;174:144–151. doi: 10.1007/s00221-006-0432-8. [DOI] [PubMed] [Google Scholar]
- Tecchio F, Graziadio S, Barbati G, Sigismondi R, Zappasodi F, Porcaro C, Valente G, Balsi M, Rossini PM. Somatosensory dynamic gamma-band synchrony: a neural code of sensorimotor dexterity. Neuroimage. 2007;35:185–193. doi: 10.1016/j.neuroimage.2006.12.002. [DOI] [PubMed] [Google Scholar]
- Terry K, Griffin L. How computational technique and spike train properties affect coherence detection. J Neurosci Methods. 2008;168:212–223. doi: 10.1016/j.jneumeth.2007.09.014. [DOI] [PMC free article] [PubMed] [Google Scholar]
- Vaillancourt DE, Larsson L, Newell KM. Effects of aging on force variability, single motor unit discharge patterns, and the structure of 10, 20, and 40 Hz EMG activity. Neurobiol Aging. 2003;24:25–35. doi: 10.1016/s0197-4580(02)00014-3. [DOI] [PubMed] [Google Scholar]
- Walther M, Berweck S, Schessl J, Linder-Lucht M, Fietzek UM, Glocker FX, Heinen F, Mall V. Maturation of inhibitory and excitatory motor cortex pathways in children. Brain Dev. 2009;31:562–567. doi: 10.1016/j.braindev.2009.02.007. [DOI] [PubMed] [Google Scholar]
- Ward NS. Compensatory mechanisms in the aging motor system. Ageing Res Rev. 2006;5:239–254. doi: 10.1016/j.arr.2006.04.003. [DOI] [PubMed] [Google Scholar]
- Wehrli NE, Bural G, Houseni M, Alkhawaldeh K, Alavi A, Torigian DA. Determination of age-related changes in structure and function of skin, adipose tissue, and skeletal muscle with computed tomography, magnetic resonance imaging, and positron emission tomography. Semin Nucl Med. 2007;37:195–205. doi: 10.1053/j.semnuclmed.2007.02.002. [DOI] [PubMed] [Google Scholar]
- Welch P. The use of the fast Fourier transform for the estimation of power spectra: a method based on time averaging over short modified periodograms. IEEE Trans Audio Electroacoustic. 1967;15:70–73. [Google Scholar]
- Williams ER, Baker SN. Renshaw cell recurrent inhibition improves physiological tremor by reducing corticomuscular coupling at 10 Hz. J Neurosci. 2009;29:6616–6624. doi: 10.1523/JNEUROSCI.0272-09.2009. [DOI] [PMC free article] [PubMed] [Google Scholar]