

Abstract
Hypoxia-inducible factor-1 (HIF-1) is an important transcriptional factor in mammalian cells for coordination of adaptive responses to hypoxia. It consists of a regulatory subunit HIF-1α, which accumulates under hypoxic conditions, and a constitutively expressed subunit HIF-1β. In addition to the well characterized oxygen-dependent mode of action of HIF-1, recent work has shown that various growth factors and cytokines stimulate HIF-1α expression, thereby triggering transcription of numerous hypoxia-inducible genes by oxygen-independent mechanisms. In this study, we examined whether accumulation of HIF-1α induced by insulin-like growth factor-1 (IGF-1) has a regulatory role in excitatory synaptic transmission in hippocampal neuron cultures. Our results show that IGF-1 induced a time- and dose-dependent increase in HIF-1α expression that was blocked by pretreatment with selective IGF-1 receptor antagonist, transcriptional inhibitor, and translational inhibitors. In addition, pharmacological blockade of the phosphatidylinositol 3-kinase/Akt/mammalian target of the rapamycin signaling pathway, but not extracellular signal-regulated kinase, inhibited IGF-1-induced HIF-1α expression. More importantly, the increase in HIF-1α expression induced by IGF-1 was accompanied by increasing levels of vascular endothelial growth factor (VEGF) mRNA and protein, which enhanced excitatory synaptic transmission. In parallel, blockade of HIF-1α activity by echinomycin or lentiviral infection with dominant-negative mutant HIF-1α or short hairpin RNA targeting HIF-1α inhibited the increase in expression of VEGF and the enhancement of synaptic transmission induced by IGF-1. Conversely, transfection of constitutively active HIF-1α into neurons mimicked the effects of IGF-1 treatment. Together, these results suggest that HIF-1α accumulation can enhance excitatory synaptic transmission in hippocampal neurons by regulating production of VEGF.
Introduction
Hypoxia-inducible factor-1 (HIF-1) is a transcriptional factor in mammalian cells that is selectively stabilized and activated under hypoxic conditions; it coordinates adaptive responses to hypoxia (Semenza, 1998; Sharp and Bernaudin, 2004; Ke and Costa, 2006). HIF-1 consists of two subunits, HIF-1α and HIF-1β, both belonging to the bHLH/PAS (basic helix-loop-helix/Per-ARNT-Sim) protein family and both required for DNA binding and transactivation of target genes (Wang et al., 1997). HIF-1β, also known as the aryl-hydrocarbon nuclear translocator, is expressed constitutively and its mRNA and protein levels are constant regardless of oxygen availability (Kallio et al., 1997). In contrast, the level of HIF-1α is regulated by a variety of systems. HIF-1α is primarily regulated at the level of protein stability. Under normoxic conditions, HIF-1α is rapidly degraded by the ubiquitin–proteasome system (Salceda and Caro, 1997; Sharp and Bernaudin, 2004). HIF-1α degradation is inhibited under hypoxic conditions, leading to accumulation and translocation from cytoplasm to nucleus, where it dimerizes with HIF-1β to form the transcriptionally active HIF-1 complex (Kallio et al., 1997). The activated HIF-1 complex binds to specific hypoxia response elements (HREs) of target genes and associates with transcriptional coactivators to induce gene expression (Lando et al., 2002; Ke and Costa, 2006). Although expression of HIF-1α is mainly controlled by oxygen tension, it is also regulated by oxygen-independent mechanisms. For example, HIF-1α has been shown to be activated in response to insulin-like growth factor-1 (IGF-1) in cancer cells and epithelial cell lines, leading to expression of vascular endothelial growth factor (VEGF) (Punglia et al., 1997; Fukuda et al., 2002; Slomiany and Rosenzweig, 2006). Researchers have reported that activation of HIF-1α in the CNS is involved in the mechanism by which IGF-1 promotes cell survival after cerebral ischemia (Chavez and LaManna, 2002). However, the role of IGF-1-induced HIF-1α expression in regulating excitatory synaptic transmission has not been investigated.
VEGF was originally thought to be a potent and selective endothelial cell mitogen implicated in vascularization and angiogenesis (Ferrara and Davis-Smyth, 1997). Studies involving the CNS have demonstrated localization of VEGF and its receptors on neurons and astrocytes (Kovács et al., 1996; Marti and Risau, 1998). It has also been reported that VEGF induces neuronal outgrowth (Rosenstein et al., 2003) and provides neuroprotection, particularly after ischemia or spinal injury (Krum and Khaibullina, 2003; Widenfalk et al., 2003). Recent work has clarified that VEGF can act as a neurotrophic factor that regulates neurogenesis and mediates the effects of enriched environment on hippocampal plasticity (Jin et al., 2002; Cao et al., 2004). In addition, acute application of VEGF can regulate synaptic transmission in the hippocampal CA1 region (McCloskey et al., 2005; Kim et al., 2008). Whether HIF-1-induced expression of VEGF regulates synaptic transmission in hippocampal neurons was unknown before our research. In this study, we showed that IGF-1 increases expression of HIF-1α through activation of the phosphatidylinositol 3-kinase (PI3K)/Akt/mammalian target of the rapamycin (mTOR) signaling pathway and leads to increased VEGF secretion, which, in turn, enhances excitatory synaptic transmission.
Materials and Methods
Establishment and maintenance of hippocampal neuron cultures.
All experimental procedures were approved by the Institutional Animal Care and Use Committee of National Cheng Kung University. Primary cultures of hippocampal neurons were prepared from the brains of newborn Sprague Dawley rat pups on postnatal day 0 as described previously (Balkowiec and Katz, 2002; Huang et al., 2005). Briefly, rat pups were decapitated and hippocampi were dissected out in ice-cold HBSS (Invitrogen). Tissues were enzymatically digested with 0.25% trypsin (Sigma-Aldrich) for 15 min at 37°C. Cells were disaggregated by trituration and plated on poly-l-lysine-coated Petri dishes or glass coverslips in Neurobasal A medium containing B27 serum-free supplement (Invitrogen), 0.5 mm l-glutamine, and antibiotics (50 U/ml penicillin and 50 μg/ml streptomycin). Thereafter, one-half of the growth medium was replaced every 3 d.
Human embryonic kidney 293 cell culture, transfection, and imaging.
Human embryonic kidney 293 (HEK293) cells were cultured in DMEM (Invitrogen) supplemented with 10% fetal bovine serum (Invitrogen) and l-glutamine and incubated in 5% CO2-air humidified atmosphere at 37°C.
For imaging experiments, HEK293 cells were grown on coverslips and transiently transfected with constructs encoding enhanced green fluorescent protein (EGFP), or constitutively active form of HIF-1α (HIF-1α-CA) fused to EGFP using Lipofectamine 2000 (Invitrogen) as described by the manufacturer. On the following day, transfected cells were treated with echinomycin (0.5 μm) for 3 h. After treatment, the cells were immediately fixed in 4% paraformaldehyde (0.1 m phosphate buffer, pH 7.4) for 15 min and washed in PBS three times. Fluorescent images of cells were acquired with a high-resolution laser-scanning confocal microscope (Olympus Fluoview 1000), using an Olympus Plan Apochromat 60× oil-immersion objective (1.42 numerical aperture and 0.15 working distance).
Drug treatment of hippocampal neurons.
Hippocampal neurons were maintained for 14–15 d in vitro (DIV) before treatment with IGF-1 or deferoxamine (DFO). Cultured hippocampal neurons were starved from B27 for 6 h before performing any treatment. Either 3-bromo-5-t-butyl-4-hydroxy-benzylidenemalonitrile (AG1024), 2-(4-morpholinyl)-8-phenyl-4H-1-benzopyran-4-one (LY294002), 2-(4-piperazinyl)-8-phenyl-4H-1-benzopyran-4-one (LY303511), wortmannin, 1,4-diamino-2,3-dicyano-1,4-bis(2-aminophenylthio)butadiene (U0126), 1,4-diamino-2,3-dicyano-1,4-bis(methylthio)butadiene (U0124), 2-(2-amino-3-methoxyphenyl)-4H-1-benzopyran-4-one (PD98059), rapamycin, ascomycin, cycloheximide, anisomycin, or actinomycin D was applied 30 min before addition of IGF-1. Echinomycin was applied 1 h before IGF-1 application. All drugs were prepared as concentrated stock solutions in distilled water or dimethylsulfoxide (DMSO) and diluted to final concentration in culture medium just before application. The final concentration of DMSO in medium did not exceed 0.1%. AG1024, LY294002, LY303511, wortmannin, U0126, U0124, PD98059, anisomycin, actinomycin D, rapamycin, ascomycin, 5-((7-benzyloxyquinazolin-4-yl)amino)-4-fluoro-2-methyl phenol hydrochloride (ZM 323881), and (E)-3-(3, 5-diisopropyl-4-hydroxyphenyl)-2-[(3-phenyl-n-propyl)amino-carbonyl] acrylonitrile (SU 1498) were dissolved in DMSO and stored at −20°C until the day of experiment. IGF-1 and DFO were dissolved in distilled water and diluted into culture medium to achieve final concentrations of 1–1000 ng/ml (Fukuda et al., 2002) and 100 μm (Sandau et al., 2001), respectively. VEGF was dissolved in distilled water. The stock solutions of IGF-1 and VEGF were aliquots stored at −20°C. An IGF-1 receptor tyrosine kinase inhibitor, AG1024 (0.5 μm) (Párrizas et al., 1997), was used to explore the role of IGF-1 receptors. LY294002 (20 μm) (Lee et al., 2005), its inactive analog, LY303511 (20 μm) (Lee et al., 2005), and wortmannin (5 μm) (Lee et al., 2005) were used to examine whether PI3K played a role. U0126 (5 μm) (Favata et al., 1998), its inactive analog, U0124 (5 μm), and PD98059 (10 μm) (Lee et al., 2005) were used to evaluate the contribution of the extracellular signal-regulated kinase/mitogen-activated protein kinase (ERK MAPK). Rapamycin (50 nm) (Canabal et al., 2007) and its inactive analog, ascomycin (50 nm) were used to explore the role of mTOR. Because ZM 323881 (10 nm) has been shown to effectively block VEGF receptor 2-mediated Rac1 activation in human umbilical vein endothelial cells (Garrett et al., 2007) and SU 1498 (5 μm) has been shown to specifically abolish the ability of VEGF (100 ng/ml) to induce cell proliferation through VEGF receptor 2 in cortical cultures (Zhu et al., 2003), they were used to examine whether VEGF receptor 2 played a role in regulating synaptic transmission. The transcription inhibitor actinomycin D (1 μm) (Suzuki et al., 2001) and the protein synthesis inhibitors, cycloheximide (10 μm) (Wang et al., 2004) and anisomycin (2 μm) (Suzuki et al., 2001), were used to explore the role of transcription- and translation-dependent mechanisms. Echinomycin was dissolved in distilled water and diluted to a final concentration of 0.5 μm (Kong et al., 2005). IGF-1, DFO, ascomycin, echinomycin, VEGF, SU 1498, and DMSO were purchased from Sigma-Aldrich, whereas LY294002, wortmannin, U0126, U0124, PD98059, cycloheximide, anisomycin, actinomycin D, and ZM 323881 were obtained from Tocris Bioscience and AG1024 and LY303511 were purchased from Calbiochem.
Construction and production of engineered lentiviruses.
Engineered self-inactivating recombinant lentiviruses were used for stably overexpressing or silencing the HIF-1α gene in the primary cultures of hippocampal neurons. All viruses were produced by cotransfection of lentiviral DNA with two helper plasmids in HEK293T cells: VSV-G (vesicular stomatitis virus envelope glycoprotein) and Δ8.9 (Kutner et al., 2009). Medium containing recombinant lentiviruses was harvested 36–48 h after transfection and ultracentrifuged to obtain concentrated lentiviral particles. Pellets were resuspended by phosphate buffer solution with titers of 108∼109 U/ml. For experiments requiring overexpression of dominant-negative (DN) or constitutively active (CA) HIF-1α, a lentiviral vector (UXIE) with bistronic expression of transgenes and EGFP was constructed under the control of ubiquitin promoter and separated by an internal ribosomal entry site (supplemental Fig. S1, available at www.jneurosci.org as supplemental material). Construction of HIF-1α-DN, a deletion mutant of HIF-1α (deletion of amino acids 30–389) constructed by removing the DNA-binding domain, transactivation domains, and an oxygen-dependent degradation domain from full-length rat HIF-1α (Chen et al., 2003), was cloned into the UXIE lentiviral vector. HIF-1α-CA was cloned by internal deletion of the oxygen regulation degradation domain (amino acids 392–520) (supplemental Fig. S1, available at www.jneurosci.org as supplemental material), which resulted in a sustained increase in expression levels of HIF-1α under normoxic conditions (Sutter et al., 2000). For HIF-1α knockdown experiments, short hairpin RNAs (shRNAs) were expressed under a human H1 promoter and EGFP (as a marker for infection efficacy) under the CAG promoter (Addgene plasmid 12247). Two sets of shRNAs targeted at different regions of rat HIF-1α (shRNA-I and shRNA-II) and one control shRNA directed against DsRed (shRNA-DsRed) were designed. The following sets of short hairpin sequences were cloned into lentiviral vector using a PCR-based strategy: GTGATGAAAGGATTACTGAGT (shRNA-I), TGCTCTTTGTAGTTGGGTCTA (shRNA-II), and AGTTCCAGTACGGCTCCAA (shRNA-DsRed). To confirm specificity and efficiency of the shRNAs, different sets of lentiviral particles were added into the hippocampal neuron cultures at 5 DIV and cell lysates were collected at 14–15 DIV for Western blotting (supplemental Fig. S2, available at www.jneurosci.org as supplemental material).
For VEGF receptor 2 knockdown experiments, three sets of shRNAs targeting different regions of rat VEGF receptor 2 (shRNA-VEGFR2) were designed. The following sets of short hairpin sequences were cloned into lentiviral vector using a PCR-based strategy: CGTGACTCTGAGGAAAGGGTG (shRNA-I), CCCTGTGAAGTATCTCAGTTA (shRNA-II), and GACATCTTGATTGTGGCATTC (shRNA-III). To confirm specificity and efficiency of these shRNAs, plasmids of different shRNAs were cotransfected with GFP-tagged VEGF receptor 2 into HEK293 cells; cell lysates were harvested 48 h later to check for knockdown of GFP-VEGF receptor 2. Different sets of lentiviral particles were added into the primary culture neurons at 5 DIV with cell lysates collected at 14–15 DIV for Western blotting. Because shRNA-II displayed very efficient knockdown of VEGR receptor 2, we used this shRNA to perform electrophysiological studies (supplemental Fig. S3, available at www.jneurosci.org as supplemental material).
Performance of dual-luciferase reporter assay.
To confirm the efficiency of HIF-1α-DN and HIF-1α-CA on HRE-mediated transcriptional ability, HEK293 cells grown on six-well plates were transiently transfected with 1 μg of HIF-1α-DN-expression or HIF-1α-CA-expression plasmids combined with 1 μg of 5×HRE-firefly luciferase plasmid by Lipofetamine 2000 (Invitrogen) (supplemental Fig. S1, available at www.jneurosci.org as supplemental material). Luciferase activity was assayed by the Dual-Luciferase Reporter Assay system with 0.2 μg of pRL-SV40 Renilla luciferase reporter (Promega) as the internal control. Firefly luciferase relative light units (RLUs) were normalized against Renilla luciferase RLUs. To examine regulation of HRE-mediated transcriptional activity by IGF-1 in the experimental neuron system, mature neuron cultures at 12 DIV were transfected with 1 μg of 5×HRE-firefly luciferase plasmid and 0.2 μg of Renilla luciferase plasmid by Lipofetamine 2000. Twenty-four hours after transfection, neurons were cultured in medium containing IGF-1 (300 ng/ml). After treatment, neurons were harvested and processed for luciferase activity assay using the luciferase assay system (Promega). Luminescence was measured using a 96-well luminometer (Microlumat; Berthold).
Western blotting analysis.
Cultured neurons were dissolved in ice-cold Tris-HCl buffer solution (TBS), pH 7.4, containing a mixture of protein phosphatase and proteinase inhibitors (50 mm Tris-HCl, 100 mm NaCl, 15 mm sodium pyrophosphate, 50 mm sodium fluoride, 1 mm sodium orthovanadate, 5 mm EGTA, 5 mm EDTA, 1 mm phenylmethylsulfonyl fluoride, 1 μm microcystin-LR, 1 μm okadaic acid, 0.5% Triton X-100, 2 mm benzamidine, 60 μg/ml aprotinin, and 60 μg/ml leupeptin) to avoid dephosphorylation and degradation of proteins and collected by cell scraper. All samples were sonicated and spun down at 15,000 × g at 4°C for 15 min. Supernatant was assayed for total protein concentration using the Bio-Rad Bradford Protein Assay kit. Each sample was separated in 7.5% SDS-PAGE gel. After transfer onto nitrocellulose membranes, blots were blocked in TBS containing 3% bovine serum albumin (BSA) and 0.01% Tween 20 for 1 h and then blotted for 2 h at room temperature with antibodies for HIF-1α (1:1000; Millipore Bioscience Research Reagents), HIF-1β (1:1000; Santa Cruz Biotechnology), or β-actin (1:2000; Sigma-Aldrich). Each blot was probed with horseradish peroxidase (HRP)-conjugated secondary antibody for 1 h and developed using the ECL immunoblotting detection system (GE Healthcare). Immunoblots were analyzed by densitometry using Bio-profil BioLight PC software. Only film exposures in the linear range of the ECL reaction were used for quantification analysis. Expression of HIF-1α or HIF-1β was evaluated relative to that of β-actin. Background correction values were subtracted from each lane to minimize variability across membranes.
Quantitative real-time reverse transcription–PCR analysis.
Total RNA was isolated from hippocampal neuron cultures using the TriReagent kit (Molecular Research Center) and treated with RNase-free DNase (RQ1; Promega) to remove potential contamination by genomic DNA. Total RNA (2 μg) from hippocampal neurons was reverse transcribed with the SuperScript cDNA synthesis kit (Invitrogen). Real-time reverse transcription (RT)-PCR was performed on the Roche LightCycler instrument (Roche Diagnostics) using the FastStart DNA Master SYBR Green I kit (Roche Applied Science) according to the manufacturer's instructions. The primers used in this experiment were as follows: HIF-1α, 5′-GACAATAGCTTCGCAGAATGC-3′ (forward) and 5′-TCGTAACTGGTCAGCTGTGG-3′ (reverse); VEGF, 5′-AATGATGAAGCCCTGGAGTG-3′ (forward) and 5′-AATGCTTTCTCCGCTCTGAA-3′ (reverse); and 18S rRNA, 5′-CAACTTTCGATGGTAGTCGC-3′ (forward) and 5′-CGCTATTGGAGCTGGAATTAC-3′ (reverse). Crude total RNA samples were amplified for 40 cycles. Each cycle consisted of denaturation at 95°C for 10 s, annealing at 62°C for 10 s, and extension at 72°C for 15 s. After amplification, equal volumes of crude cultured-neuron PCR products were subjected to electrophoresis on 1% (w/v) agarose gels and visualized with ethidium bromide. PCR amplifications were repeated in duplicate. A melting curve was created at the end of the PCR cycle to confirm that a single product had been amplified. Data were analyzed by LightCycler quantification software to determine the threshold cycle above background for each reaction. The relative transcript amount of the gene of interest, which was calculated using standard curves of serial RNA dilutions, was normalized to that of 18S rRNA.
Electrophysiological recordings.
Cells grown for 14–15 DIV on glass coverslips were transferred to a submersion-type recording chamber continually perfused with 30–32°C extracellular solution containing the following (in mm): 115 NaCl, 5 KCl, 2 CaCl2, 1 MgCl2, 5 HEPES, 20 glucose, pH 7.4. The recording pipettes were pulled from borosilicate capillary tubing and heat-polished. Electrode resistance was typically 3–6 MΩ. The composition of internal solution was as follows (in mm): 116 K-gluconate, 6 KCl, 2 NaCl, 20 HEPES, 0.5 EGTA, 2 Na2ATP, 0.3 Na3GTP, 5 QX-314 (lidocaine N-ethyl bromide), which had an osmolarity of 290–295 mOsm and pH of 7.3. After a high-resistance seal (>2 GΩ before breaking into whole-cell mode) was obtained, suction was applied lightly through the pipette to break through the membrane. Recordings were made using a patch clamp amplifier (Axopatch 200B; Molecular Devices). Electrical signals were low-pass filtered at 1 kHz and digitized at 10 kHz using a 12 bit analog-to-digital converter (Digidata 1320; Molecular Devices). An Intel Pentium-based computer with pCLAMP software (version 8.0; Molecular Devices) was used for on-line data acquisition. For recording miniature EPSCs (mEPSCs), cells were held at −60 mV in extracellular solution containing bicuculline methiodide (20 μm) and tetrodotoxin (1 μm) and analyzed off-line using commercially available software (Mini Analysis 4.3; Synaptosoft). This software detects events based on amplitudes exceeding a threshold set just above the baseline noise of the recording (−3 pA) and 20–80% rise times <0.5 ms. The decay time of averaged mEPSCs was fitted to double exponential functions. Its weighted mean (τm) was calculated from individual time constants (τ1, τ2) and their relative amplitudes (a1, a2) as follows: τm = a1τ1 + a2τ2 (Yamashita et al., 2003). All detected events were reexamined and accepted or rejected based on subjective visual examination. The program measured amplitudes and intervals between successive detected events. Background current noise was estimated from the baseline with no clear event and was subtracted from signals before analysis. The mEPSC frequency was calculated by dividing the total number of detected events by the total time sampled. Data from the last 5 min of each 20 min recording epochs were used to assess the mEPSC frequency. Events were ranked by amplitude and interevent interval for preparation of cumulative probability distribution. To minimize potential sampling bias attributable to the difference in the mEPSC frequency among neurons, a fixed number of mEPSCs from each neuron (i.e., 250 mEPSCs during last 5 min of each 20 min recording) were pooled for calculating cumulative probability of the mEPSC amplitude and interevent interval. Series and input resistances were monitored throughout experiments. Data were discarded if series resistance changed >15% during the experiment.
Chromatin immunoprecipitation assay.
A chromatin immunoprecipitation assay kit (Millipore Bioscience Research Reagents) was used for chromatin immunoprecipitation (ChIP) assays as described previously (Kazi et al., 2005). Hippocampal neuron cultures were washed twice with PBS and cross-linked with 1% formaldehyde at room temperature for 10 min. Neurons were rinsed twice with ice-cold PBS containing 1× protease inhibitor mixture. Cross-linked chromatin was prepared and sonicated on ice to an average size of 500–1000 bp, and then centrifuged at 15,000 × g at 4°C for 10 min to remove insoluble material. Equal amounts (200 μg) of cross-linked protein/DNA lysates were incubated with HIF-1α antibody (Millipore Bioscience Research Reagents) or control rabbit IgG for each immunoprecipitation at 4°C overnight, followed by incubation with protein G-agarose for 2 h at 4°C with rotation. Beads were washed sequentially with 1 ml of low-salt wash buffer, high-salt wash buffer, LiCl immune complex wash buffer, and finally TE buffer (10 mm Tris-HCl and 1 mm EDTA, pH 8.0), all at 4°C. Protein/DNA complexes were eluted twice with elution buffer, and then incubated with 5 m NaCl at 65°C for 4–5 h to reverse DNA–protein cross-links. DNA was purified using the QIAquick PCR purification kit (QIAGEN) to a final volume of 40 μl. The post-ChIP yield of target region DNA in each sample was analyzed by PCR. The primers used for rat VEGF −944 to −611 were (forward) 5′-TCTGCCAGACTCCACAGTG-3′and (reverse) 5′-TGCGTGTTTCTAACACCCAC-3′ (GenBank accession number U22373). PCRs were conducted as follows: 5 min at 95°C followed by 30 cycles of 30 s at 95°C, 10 s at 58°C, and 30 s at 72°C, with a final step of 5 min at 72°C. Amplified DNA was analyzed by 2% agarose gel electrophoresis with a 100 bp DNA marker. The expected sizes of PCR products were confirmed by sequencing.
Quantification of VEGF secretion by ELISA.
Release of VEGF-A from cultured hippocampal neuron cultures was measured by collecting released VEGF-A from culture medium. IGF-1 was added to neurons (4 × 10⁵) at 14–15 DIV, after which medium was collected at different time points. The amounts of secreted VEGF-A were detected by ELISA using a commercially available kit specific for rat VEGF-A (R&D Systems) according to the manufacturer's instructions.
Lactate dehydrogenase release analysis.
After exposure to various treatments, hippocampal neuronal culture media were collected and centrifuged, and lactate dehydrogenase (LDH) activity was quantified using a colorimetric cytotoxicity assay kit (BioVision) according to the manufacturer's instructions. Absorbance data were obtained using a 96-well Molecular Devices Spectramax Microplate Reader (Molecular Devices) with a 450 nm filter, and 650 nm as reference wavelength. All assays were run in duplicate. Maximum LDH release was determined by cell lysis of untreated cells with cell culture media containing 1% Triton X-100.
DNA fragmentation analysis.
DNA fragmentation assay was performed using a Cell Death Detection ELISA kit (Roche) that is specific for nucleosome-associated cytosolic DNA. After exposure to various treatments, cells were harvested and homogenated by lysis buffer and centrifuged at 10,000 × g for 15 min at 4°C to obtain the cytoplasmic fraction of the cell lysates. Twenty microliter aliquots of the supernatant were then dispensed into a streptavidin-coated 96-well microtiter plate and incubated with 80 μl of antibody mixture for 2 h at room temperature with mild shaking. The antibody mixture consisted of a mixture of anti-histone biotin and anti-DNA-HRP directed against various histones and antibodies to both single-stranded DNA and double-stranded DNA, which are major constituents of the nucleosomes. After incubation, plates were washed with incubation buffer and the amount of nucleosomes retained by anti-DNA-HRP was determined spectrophotometrically with 2,2′-azino-di-(3-ethylbenzthiazoline sulfonate)diammonium salt as an HRP substrate. The absorbances of all samples were measured at 405 nm using a Molecular Devices Spectramax Microplate Reader. Nonspecific signal was determined by subtraction of a reagent blank. All assays were run in duplicate.
Superoxide dismutase activity analysis.
Total superoxide dismutase (SOD) activity was determined by a using the Cayman Chemical Superoxide Dismutase Assay kit (Cayman Chemical) according to the manufacturer's instructions. This kit allows highly sensitive SOD measurement by using a tetrazolium salt for detection of dismutation of superoxide radicals generated by xanthine oxidase and hypoxanthine. After exposure to various treatments, cells were harvested and homogenated by lysis buffer and centrifuged at 10,000 × g for 15 min at 4°C to obtain the cytoplasmic fraction of the cell lysates. Equal protein amounts of supernatant fractions were incubated with reaction mixture containing the tetrazolium salt for 20 min. The absorbance of each standard and sample was read at 450 nm using a 96-well Molecular Devices Spectramax Microplate Reader (Molecular Devices). SOD activity was calculated using an equation obtained from the linear regression fit of the standard curve data. All assays were run in duplicate. One unit was defined as the amount of enzyme needed to exhibit 50% dismutation of the superoxide radical.
Glutathione assay.
The concentration of glutathione was performed by using a by a using the Cayman Chemical GSH Assay kit (Cayman Chemical) according to the manufacturer's instructions. The quantification of glutathione by using glutathione reductase based on the reaction of the sulfhydryl group from glutathione with 5,5′-dithiobis(2-nitrobenzoic acid) (DTNB), which produces a yellow colored 5-thio-2-nitrobenzoic acid (TNB). The rate of TNB production is directly proportional to the concentration of glutathione in the sample. After exposure to various treatments, cells were harvested and homogenated by lysis buffer and centrifuged at 10,000 × g for 15 min at 4°C to obtain the cytoplasmic fraction of the cell lysates. Fifty microliter aliquots of each sample were dispensed into 96-well microtiter plate and incubated with the assay mixture for 25 min at room temperature with mild shaking. The absorbances of all samples were measured at 412 nm using a Molecular Devices Spectramax Microplate Reader. Nonspecific signal was determined by subtraction of a reagent blank. All assays were run in duplicate.
Immunofluorescence staining.
Cultured neurons were fixed with 4% paraformaldehyde in PBS containing 10% sucrose for 20 min at room temperature. After washing, neurons were permeabilized and blocked simultaneously in a solution containing 2% goat serum, 3% BSA, and 0.2% Triton X-100 in PBS for 1 h at room temperature. The primary antibodies, anti-VGLUT1 (anti-vesicular glutamate transporter 1) (1:500 dilution; Millipore) and anti-PSD-95 (1:300 dilution; Abcam) were added in PBS containing 3% BSA and incubated overnight at 4°C. After rinses with PBS, coverslips were incubated with appropriate Alexa Fluor 488- or 568-conjugated secondary antibodies for 1 h at room temperature and counterstained with nucleic marker DAPI (4′,6-diamidino-2-phenylindole) (1:2000; Santa Cruz Biotechnology).
Image acquisition and quantification.
Images of neurons were obtained using a standard fluorescent microscope (BX51; Olympus) or a FluoView 1000 confocal microscope (Olympus) with sequential acquisition setting at a resolution of 1024 × 1024 pixels, z-stack with four to six optical sections. For higher magnification pictures, an Olympus Plan Apochromat 60× oil-immersion objective (1.42 numerical aperture and 0.15 working distance) was used. MetaMorph software (Molecular Devices) was used to quantify the fraction of colocalization of synapsin 1 and PSD-95, and the synapse density of colocalized punta. Synapsin 1 and PSD-95 were colocalized if the markers directly overlapped or were closely apposed to each other. The number of synapses was measured at 50 μm distant from the soma and a 50 μm length of dendritic segment. Typically, 5–10 neurons were studied per coverslip. Blind conditions were used for the morphometric quantification of acquired images.
Statistical analysis.
Data for each experiment were normalized relative to controls and presented as mean ± SEM. The significance of any difference between means was calculated using the unpaired Student's t test. Values of p < 0.05 were considered significant. The number of experiments performed with separate cultures was indicated by n. Statistical comparison of mEPSCs was done using the Kolmogorov–Smirnov test. Cumulative probability distributions of the mEPSC amplitude and interevent interval were considered different using a conservative critical probability level of p < 0.01 (Hoffman and Lupica, 2001).
Results
IGF-1 stimulates HIF-1α expression in hippocampal neuron cultures
Initial experiments were designed to investigate whether activation of IGF-1 receptors regulated HIF-1α protein expression in our neuron cultures. We used iron chelator DFO (100 μm) as a positive control because it stabilizes HIF-1α expression through inhibition of asparaginyl hydroxylase, causing increased expression of HIF-1 target genes (Sandau et al., 2001; Hirsilä et al., 2005). As expected, DFO stimulated expression of HIF-1α. Exposure of B27-starved neuron cultures to IGF-1 for 6 h resulted in a dose-dependent increase in levels of HIF-1α protein, with maximal effect observed with 300 ng/ml IGF-1 based on Western blotting analysis of whole-cell lysates (158.3 ± 11.2% of control levels; p < 0.05 compared with control; n = 7) (Fig. 1A). In time course experiments, HIF-1α protein levels peaked at 6 h (176.8 ± 15.4% of control levels; p < 0.05 compared with control; n = 5) and remained elevated until 24 h (151.3 ± 13.7% of control levels; p < 0.05 compared with control; n = 5) after IGF-1 (300 ng/ml) treatment (Fig. 1B). In contrast, HIF-1β protein expression was not significantly affected by either IGF-1 or DFO treatment. These data clearly demonstrate that IGF-1 stimulates HIF-1α expression in our model in a time- and dose-dependent manner. Because application of IGF-1 (300 ng/ml) for 6 h consistently stimulated HIF-1α expression, we chose this treatment protocol for all subsequent experiments designed to identify mechanisms underlying this event. Notably, a 24 h treatment of neuron cultures with IGF-1 (300 ng/ml) did not cause any detectable change in cell survival using LDH and DNA fragmentation assays (supplemental Fig. S4, available at www.jneurosci.org as supplemental material). To exclude the possibility that the stimulatory effect of IGF-1 on HIF-1α expression could be derived from induction of oxidative stress in the absence of neuronal death, we assayed antioxidant enzyme SOD activity and total glutathione levels. No significant difference was found in either total SOD activity or glutathione levels in IGF-1-treated neuron cultures compared with control (untreated) cultures (supplemental Fig. S5, available at www.jneurosci.org as supplemental material). These data globally indicate that the stimulatory effect of IGF-1 on HIF-1α expression is not mediated by oxidative stress or a change in cell viability.
Figure 1.

IGF-1 stimulates HIF-1α protein expression in hippocampal neuron cultures. A, Representative immunoblots and corresponding densitometric analysis showing HIF-1α and HIF-1β protein levels in hippocampal neuron cultures from vehicle control (C), IGF-1 (1–1000 ng/ml), or DFO (100 μm) treatment for 6 h. B, Representative immunoblots and corresponding densitometric analysis showing HIF-1α and HIF-1β protein levels in hippocampal neuron cultures from vehicle control or IGF-1 (300 ng/ml) treatment for 1–24 h. Data are presented as mean ± SEM. *p < 0.05 compared with the vehicle control (distilled water) group by unpaired Student's t test.
IGF-1-induced HIF-1α expression is dependent on activation of the PI3K/Akt/mTOR signaling pathway
IGF-1 receptors are structurally very similar to insulin receptors; IGF-1 binds to both IGF-1 and insulin receptors, although the former bind with ∼2000-fold greater affinity (Kjeldsen et al., 1991). Additional experiments were performed to verify whether the IGF-1-induced increase in HIF-1α protein expression was specifically mediated by activation of IGF-1 receptors. To directly test this possibility, neuron cultures were pretreated with a selective inhibitor of IGF-1 receptor, AG1024, which blocks IGF-1 receptor tyrosine kinase activity (Párrizas et al., 1997). As shown in Figure 2A, AG1024 (0.5 μm) completely blocked IGF-1-induced increase in HIF-1α protein expression (87.9 ± 8.3% of control levels; p < 0.05 compared with IGF-1 alone; n = 4). AG1024 treatment alone had no effect on the basal expression level of HIF-1α protein. These results indicate that activation of IGF-1 receptor signaling by IGF-1 serves to regulate expression of HIF-1α protein in our neuron model.
Figure 2.

IGF-1 stimulates HIF-1α protein expression through the activation of PI3K/Akt/mTOR signaling pathway. A, Representative immunoblots and corresponding densitometric analysis showing HIF-1α protein levels in hippocampal neuron cultures from IGF-1 (300 ng/ml) treatment for 6 h with or without AG1024 (0.5 μm). B, Representative immunoblots and corresponding densitometric analysis showing HIF-1α protein levels in hippocampal neuron cultures from IGF-1 (300 ng/ml) treatment for 6 h with or without LY294002 (20 μm) or LY303511 (20 μm). C, Representative immunoblots and corresponding densitometric analysis showing HIF-1α protein levels in hippocampal neuron cultures from IGF-1 (300 ng/ml) treatment for 6 h with or without U0126 (5 μm) or U0124 (5 μm). D, Representative immunoblots and corresponding densitometric analysis showing HIF-1α protein levels in hippocampal neuron cultures from IGF-1 (300 ng/ml) treatment for 6 h with or without rapamycin (50 nm) or ascomycin (50 nm). Data are presented as mean ± SEM. *p < 0.05 compared with the vehicle (0.1% DMSO)-treated control group by unpaired Student's t test.
A broad set of distinct signal transduction pathways can be activated by IGF-1. To define the specific signaling pathway that contributes to IGF-1-induced increases in HIF-1α protein expression, the requirement of PI3K activation was first examined. Neuron pretreatment with the specific PI3K inhibitor LY294002 (20 μm) (Vlahos et al., 1994) completely blocked the IGF-1-induced increase in HIF-1α protein expression (93.3 ± 7.1% of control levels; p < 0.05 compared with IGF-1 alone; n = 5) (Fig. 2B). Similar results were observed with use of a structurally unrelated PI3K inhibitor, wortmannin (5 μm) (data not shown). In contrast, the inactive analog of LY294002, LY303511 (20 μm), did not significantly affect the action of IGF-1 (152.6 ± 9.8% of control levels; p > 0.05 compared with IGF-1 alone; n = 5). Neither LY294002 nor LY303511 treatment alone altered basal levels of HIF-1α protein. These results support the hypothesis that activation of PI3K is required for IGF-1-induced increases in HIF-1α protein expression in our hippocampal neuron cultures.
To evaluate the contribution of the ERK MAPK signaling pathway in regulation of HIF-1α protein expression induced by IGF-1, neuron cultures were pretreated with a selective MAPK kinase (MEK)1/2 inhibitor, U0126 (5 μm, a dose corresponding to the EC100 of this compound) (Favata et al., 1998). This treatment had no significant effect on IGF-1-induced increases in HIF-1α protein expression (138.6 ± 11.9% of control levels; p > 0.05 compared with IGF-1 alone; n = 5) (Fig. 2C). The inactive analog of U0126, U0124 (5 μm), also did not significantly affect IGF-1 activity (146.3 ± 11.3% of control levels; p > 0.05 compared with IGF-1 alone; n = 5). Similar results were observed with use of another MEK1/2 inhibitor, PD98059 (10 μm) (142.9 ± 12.5% of control levels; p > 0.05 compared with IGF-1 alone; n = 4). None of U0126, PD98059, or U0124 treatment alone altered the basal levels of HIF-1α protein. These results exclude an involvement of the MAPK signaling cascade in IGF-1-induced increases in HIF-1α protein expression in our hippocampal neuron cultures.
mTOR, a serine/threonine protein kinase that regulates translation initiation, is a crucial downstream node in PI3K/Akt signaling (Gingras et al., 1998). To test whether PI3K and Akt act through an mTOR-coupled mechanism to regulate HIF-1α protein expression, we evaluated a specific inhibitor of mTOR, rapamycin (Sabers et al., 1995). As shown in Figure 2D, pretreatment of neuron cultures with rapamycin (50 nm) partially, but significantly, inhibited IGF-1-induced increases in HIF-1α protein expression (126.8 ± 9.3% of control levels; p < 0.05 compared with IGF-1 alone; n = 4). In contrast, the inactive structural analog ascomycin (50 nm) did not significantly affect IGF-1 activity (154.6 ± 7.8% of control levels; p > 0.05 compared with IGF-1 alone; n = 4). Neither rapamycin nor ascomycin alone altered basal levels of HIF-1α protein. We concluded that IGF-1 stimulates HIF-1α protein expression in our experimental system through a rapamycin-sensitive and PI3K-dependent mechanism.
IGF-1 stimulates HIF-1α expression by upregulation of transcription- and translation-dependent processes
To determine whether IGF-1-induced increases in HIF-1α protein expression resulted from an increase in new mRNA and protein synthesis, we pretreated hippocampal neuron cultures with the transcription inhibitor actinomycin D (1 μm) or the protein translation inhibitors, cycloheximide (10 μm) and anisomycin (2 μm). As shown in Figure 3A, all pretreatments completely blocked IGF-1-induced increases in HIF-1α protein expression (actinomycin D, 104.5 ± 7.6% of control levels; cycloheximide, 89.8 ± 12.5% of control levels; anisomycin, 97.8 ± 12.9% of control levels; p < 0.05 compared with IGF-1 alone; n = 7). None of the actinomycin D, cycloheximide, or anisomycin treatments alone altered basal levels of HIF-1α protein. In parallel, we observed that IGF-1 induced a significant increase in HIF-1α mRNA levels based on quantitative real-time RT-PCR analysis. Levels of HIF-1α mRNA were elevated at 1 h, reached maximal levels at 6 h, and remained elevated until ∼24 h after IGF-1 treatment (Fig. 4A).
Figure 3.

IGF-1 stimulates HIF-1α accumulation through a transcriptional and translational mechanism. A, Representative immunoblots and corresponding densitometric analysis showing HIF-1α protein levels in hippocampal neuron cultures from IGF-1 (300 ng/ml) treatment for 6 h with or without actinomycin D (Act D) (1 μm), cycloheximide (CHX) (10 μm), or anisomycin (Ani) (2 μm). B, Representative immunoblots and corresponding densitometric analysis showing HIF-1α protein stability in hippocampal neuron cultures treated with IGF-1 or DFO. Hippocampal neuronal cultures were treated with IGF-1 (300 ng/ml) or DFO (100 μm) treatment for 6 h, after which cycloheximide was added for 30–90 min. Total protein was isolated and expression of HIF-1α was analyzed by Western blotting. Data are presented as mean ± SEM. *p < 0.05 compared with the vehicle (0.1% DMSO)-treated control group by unpaired Student's t test.
Figure 4.
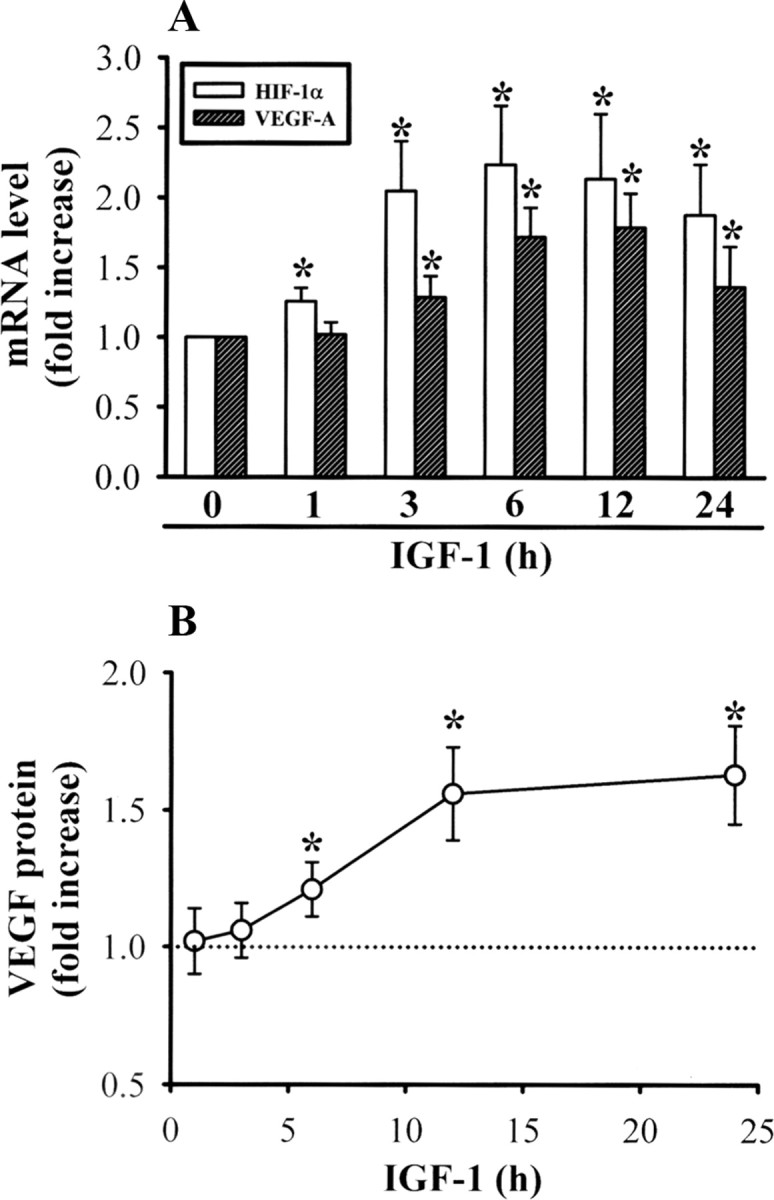
IGF-1 stimulates VEGF-A mRNA expression and protein secretion. A, Hippocampal neuron cultures were stimulated IGF-1 (300 ng/ml) for 6 h. Levels of HIF-1α and VEGF-A mRNA expression were analyzed by quantitative real-time PCR. B, Summary of experiments showing the time course of VEGF protein secretion in hippocampal neuron cultures treated with IGF-1. Data are presented as mean ± SEM. *p < 0.05 compared with the IGF-1 0 h (untreated) group by unpaired Student's t test.
To analyze the possible effect of IGF-1 on HIF-1α protein stability, we performed a time course of HIF-1α turnover in the presence of the protein translation inhibitor cycloheximide. Neurons were treated with IGF-1 (300 ng/ml) or DFO (100 μm) for 6 h to induce HIF-1α accumulation, after which cycloheximide (10 μm) was added for an additional 30–90 min to block ongoing protein synthesis. Western blot analyses showed that DFO stimulated HIF-1α accumulation and DFO-induced HIF-1α protein levels remained unchanged in the presence of cycloheximide (n = 6). In contrast, after 6 h of IGF-1 stimulation, addition of cycloheximide led to diminished HIF-1α protein expression (n = 6). Within 90 min of protein synthesis inhibition, ∼60% of the amount of IGF-1-induced HIF-1α protein disappeared (Fig. 3B). These results are in agreement with the idea that IGF-1 increases HIF-1α protein accumulation through a mechanism that increases HIF-1α mRNA transcription and translation without an additional increase in HIF-1α protein stability.
IGF-1 stimulates HIF-1α-mediated VEGF mRNA expression and protein secretion
Next, we examined the effect of IGF-1 on mRNA and protein expression of VEGF. Consistent with reports using cancer cells and epithelial cell lines (Miele et al., 2000; Fukuda et al., 2002; Slomiany and Rosenzweig, 2006), we found that IGF-1 (300 ng/ml) treatment increased VEGF mRNA expression (Fig. 4A). IGF-1 induced an increase in VEGF mRNA levels by 3 h that peaked at 6 h and persisted at 12 h, declining thereafter (n = 8). A consistent, significant increase in VEGF-A protein secretion was also observed in hippocampal neuron cultures exposed to IGF-1 (300 ng/ml) (n = 8). Levels of VEGF-A secretion were elevated at 6 h, reached maximal levels at 12 h, and remained elevated until ∼24 h after IGF-1 treatment (Fig. 4B).
To assess whether enhanced levels of VEGF mRNA and protein were associated with an increase in HIF-1 binding to the HRE of the VEGF promoter, we performed ChIP assay. HIF-1 DNA binding activity to the HRE present at positions −923 to −916 (5′-TACGTGGG-3′) of the VEGF promoter was detected in neurons treated with IGF-1 (300 ng/ml). As shown in Figure 5A, IGF-1 significantly increased HIF-1 DNA binding activity to the VEGF promoter, with a peak at 3 h that remained stable until at least 6 h (n = 5).
Figure 5.

IGF-1 induces the binding of HIF-1 to the hypoxia response element. A, Hippocampal neuron cultures were treated with or without IGF-1 (300 ng/ml) for 1–3 h, and then lysed and subjected to ChIP assay as described in Materials and Methods using anti-HIF-1α antibody. The immunoprecipitated material was subjected to PCR using primer pair that flanked HIF-1α binding site (−944∼−611). Agarose gel electrophoresis was performed on products of PCR. Templates were DNA derived from cells before ChIP (input), and DNA in immunoprecipitates were derived by ChIP with anti-HIF-1α. Shown is a quantitative analysis of the HIF-1α bands, expressed as percentage change from basal values. B, Hippocampal neuron cultures were transfected with plasmid encoding HRE upstream of firefly luciferase. Twenty-four hours after transfection, neurons were treated with or without IGF-1 (300 ng/ml) for 1–48 h, and then lysed and subjected to luciferase activity assay. HRE-luciferase activity was normalized against Renilla luciferase activity. Data are presented as mean ± SEM. *p < 0.05 compared with the IGF-1 0 h (untreated) group by unpaired Student's t test.
To further evaluate the direct impact of IGF-1-induced HIF-1α accumulation on VEGF transcriptional upregulation, we measured HIF-1 transcriptional activity using a luciferase reporter assay. For this aim, hippocampal neuron cultures were transfected with plasmid encoding HRE upstream of firefly luciferase. After IGF-1 treatment, firefly luciferase activity in cell extracts was determined and normalized against Renilla luciferase activity. IGF-1 induced a significantly time-dependent increase in luciferase activity, which reached maximal levels at 6 h and remained elevated until ∼48 h after IGF-1 treatment (n = 5) (Fig. 5B). These results strongly indicate IGF-1 treatment can stimulate HIF-1 transcriptional activity.
To definitively demonstrate the role of HIF-1α in IGF-1-induced increases in VEGF mRNA expression and protein secretion, we used both a pharmacological as well as molecular approaches to inhibit HIF-1α activity. Because echinomycin specifically inhibits HIF-1 DNA-binding activity to the VEGF promoter (Kong et al., 2005), we examined the effects of echinomycin on IGF-1-induced increases in VEGF mRNA expression and protein secretion. We confirmed echinomycin treatment inhibited DNA binding affinity of HIF-1 in HEK293 cells (supplemental Fig. S6, available at www.jneurosci.org as supplemental material). In addition, pretreatment of hippocampal neurons with echinomycin (0.5 μm) almost completely blocked IGF-1-induced increases in VEGF mRNA expression and protein secretion (n = 6) (Fig. 6A,C). A significant decrease in VEGF mRNA expression and protein secretion was also observed in neuron cultures exposed to echinomycin alone, indicating that HIF-1 DNA-binding activity is required to maintain basal transcription of the VEGF gene.
Figure 6.

HIF-1 is required for IGF-1-induced VEGF mRNA expression and protein secretion. A, Control, HIF-1α-DN- or HIF-1α-CA-expressing hippocampal neuron cultures were stimulated IGF-1 (300 ng/ml) for 6 h with or without echinomycin (0.5 μm). Levels of VEGF-A mRNA expression were analyzed by quantitative real-time PCR. B, VEGF-A mRNA levels were determined in control shRNA-DsRed, HIF-1α-shRNA-I-, or HIF-1α-shRNA-II-expressing hippocampal neuron cultures with or without IGF-1 (300 ng/ml) treatment for 6 h. C, Control, HIF-1α-DN-, or HIF-1α-CA-expressing hippocampal neuron cultures were stimulated IGF-1 (300 ng/ml) for 6 h with or without echinomycin (0.5 μm). Levels of VEGF-A protein secretion were determined by ELISA of the culture media. D, Secreted VEGF-A protein levels were determined in the culture media from control shRNA-DsRed, HIF-1α-shRNA-I-, or HIF-1α-shRNA-II-expressing hippocampal neuron cultures with or without IGF-1 (300 ng/ml) treatment for 6 h. Data are presented as mean ± SEM. *p < 0.05 compared with the vehicle (0.1% DMSO)-treated control group by unpaired Student's t test.
We next examined the effect of HIF-1α-DN on IGF-1-induced increases in levels of VEGF mRNA and protein. Overexpression of HIF-1α-DN prevented enhancement by IGF-1 on VEGF mRNA expression and protein secretion (n = 6) (Fig. 6A,C). A significant decrease in VEGF mRNA expression and protein secretion was also observed in neurons with HIF-1α-DN overexpression. In contrast, overexpression of HIF-1α-CA significantly increased VEGF mRNA expression and protein secretion and occluded the stimulatory effect of IGF-1 (n = 6) (Fig. 6A,C). The importance of HIF-1α for the IGF-1-induced increase in VEGF mRNA expression and protein secretion was further determined by transfecting hippocampal neuron cultures with lentiviral construct encoding shRNA against HIF-1α. Measurement of HIF-1α levels by Western blotting analysis revealed significant reduction in expression of HIF-1α protein in neurons transfected with HIF-1α shRNA-I or shRNA-II compared with control shRNA-DsRed-transfected neurons (supplemental Fig. S2, available at www.jneurosci.org as supplemental material), confirming the ability of shRNAs to knockdown HIF-1α. As shown in Figure 6, B and D, levels of VEGF mRNA and protein were increased by IGF-1 treatment in hippocampal neurons transfected with a control shRNA-DsRed (n = 6), but this increase was not observed in either HIF-1α shRNA-I-transfected (n = 6) or shRNA-II-transfected neurons (n = 6). A significant decrease in VEGF mRNA expression and protein secretion was also observed in hippocampal neurons transfected with either HIF-1α shRNA-I or shRNA-II alone. Based on these data, we suggest that IGF-1 stimulates VEGF expression through an HIF-1α-dependent transcriptional mechanism.
IGF-1 enhances excitatory synaptic transmission through HIF-1α-mediated VEGF secretion
Having documented evidence that IGF-1 induces HIF-1α-mediated VEGF secretion in pure hippocampal neuron cultures, we reasoned its impact on neuronal functions. A potential regulation in excitatory synaptic transmission was investigated using whole-cell patch-clamp recordings of mEPSCs. Because VEGF receptor 2 inhibitors, ZM 323881 and SU 1498, were dissolved in DMSO and the final concentration of DMSO in medium was 0.1%, vehicle control hippocampal neuron cultures were incubated for 24 h with 0.1% DMSO. There was no significant influence of 0.1% DMSO treatment on both the mean frequency (1.3 ± 0.2 Hz; n = 8) and amplitude of mEPSCs (10.8 ± 1.6 pA; n = 8) compared with untreated group (frequency, 1.4 ± 0.3 Hz; amplitude, 11.2 ± 1.4 pA; n = 6) (data not shown). Treatment of neurons with IGF-1 (300 ng/ml) for 24 h produced a significant increase in the frequency of mEPSCs (6.4 ± 0.4 Hz; n = 10; p < 0.05 compared with control), although mEPSC amplitude was not significantly affected (13.2 ± 2.3 pA; n = 10; p > 0.05 compared with control) (Fig. 7A–E). No significant difference was found in rise time (from 20 to 80% of the peak) or weighted decay time of mEPSCs in IGF-1-treated hippocampal neurons (rise time, 0.41 ± 0.08 ms; decay time, 8.9 ± 1.2 ms; n = 10) compared with controls (rise time, 0.36 ± 0.06 ms; decay time, 8.6 ± 0.9 ms; n = 8). Pretreatment with the selective VEGF receptor 2 inhibitor ZM 323881 (10 nm) (Whittles et al., 2002) or SU 1498 (5 μm) (Shen et al., 1999) completely blocked IGF-1-induced enhancement of mEPSCs (ZM 323881, 1.2 ± 0.2 Hz, n = 6; SU 1498, 1.4 ± 0.2 Hz, n = 5; ZM 322881 plus IGF-1, 1.6 ± 0.2 Hz, n = 8; SU 1498 plus IGF-1, 1.6 ± 0.3 Hz, n = 6; p < 0.05 compared with IGF-1 alone). In addition, IGF-1-induced enhancement of mEPSC frequency was not observed in VEGF receptor 2 shRNA-expressing neurons (shRNA-VEGFR2, 1.3 ± 0.2 Hz, n = 6; shRNA-VEGFR2 plus IGF-1, 1.9 ± 0.3 Hz, n = 8; p < 0.05 compared with IGF-1 alone). These results reveal that increased expression of VEGF and hence activation of VEGF receptor 2 are required for IGF-1-induced synaptic enhancement.
Figure 7.

IGF-1 increases the frequency of mEPSCs through the activation of VEGF receptor 2. A, Representative traces of mEPSCs in control (A1, A2) or VEGF receptor 2-shRNA-expressing (shRNA-VEGFR2) (A3) hippocampal neurons from IGF-1 (300 ng/ml) treatment for 24 h with (A2) or without ZM 323881 (10 nm) (A1). B, Cumulative distribution of the mEPSC interevent interval. IGF-1 induces a significant decrease in the interevent interval (i.e., increased frequency), which is blocked by pretreatment with ZM 323881. C, Cumulative distribution of the mEPSC amplitude. The amplitude of mEPSCs was not significantly affected by IGF-1 treatment. D, E, The bar graphs showing the summary data of the effect of IGF-1 on the average frequency and amplitude of the mEPSCs in control or shRNA-VEGFR2-expressing hippocampal neurons with or without ZM 323881 (10 nm) or SU 1498 (5 μm) pretreatment. The total number of experiments performed with separate cultures is shown in parentheses. Data are presented as mean ± SEM. *p < 0.05 compared with the vehicle (0.1% DMSO)-treated control group by unpaired Student's t test.
To further determine the role of HIF-1α activation in development of IGF-1-induced enhancement of mEPSCs, we pretreated hippocampal neurons with echinomycin or HIF-1α-DN. As shown in Figure 8, neither echinomycin nor HIF-1α-DN treatment alone affected the frequency (echinomycin, 1.6 ± 0.3 Hz, n = 7; HIF-1α-DN, 1.5 ± 0.3 Hz, n = 6; p > 0.05 compared with control) or amplitude of mEPSCs (echinomycin, 11.2 ± 2.1 pA, n = 7; HIF-1α-DN, 10.9 ± 2.5 pA, n = 6; p > 0.05 compared with control). However, both treatments significantly blocked the enhancement effect of IGF-1 on the frequency of mEPSCs (echinomycin plus IGF-1, 2.1 ± 0.3 Hz, n = 8; HIF-1α-DN plus IGF-1, 2.2 ± 0.3 Hz, n = 8; p < 0.05 compared with IGF-1 alone). In contrast, overexpression of HIF-1α-CA significantly increased the frequency of mEPSCs (8.7 ± 0.9 Hz; n = 5; p < 0.05 compared with control) and occluded enhancement by IGF-1 (9.1 ± 0.7 Hz; n = 6; p > 0.05 compared with IGF-1 alone). HIF-1α-CA treatment alone had no effect on mEPSC amplitude (13.3 ± 2.7 pA; n = 5; p > 0.05 compared with control). We found that mEPSC frequency and amplitude recorded in HIF-1α-shRNA-expressing neurons (shRNA-I, 1.8 ± 0.3 Hz and 11.2 ± 2.5 pA, n = 4; shRNA-II, 1.6 ± 0.3 Hz and 11.9 ± 2.4 pA, n = 4) were not significantly different compared with values for shRNA-DsRed-expressing neurons (1.5 ± 0.2 Hz and 11.2 ± 2.5 pA; n = 4), whereas HIF-1α shRNA-I and shRNA-II completely blocked IGF-1-induced enhancement of mEPSCs (control shRNA-DsRed plus IGF-1, 6.2 ± 0.5 Hz, n = 6; shRNA-I plus IGF-1, 2.3 ± 0.3 Hz, n = 6; shRNA-II plus IGF-1, 2.4 ± 0.3 Hz, n = 6; p < 0.05 compared with shRNA-DsRed plus IGF-1) (Fig. 9A–E).
Figure 8.

HIF-1 is required for IGF-1-induced increase in the mEPSCs. A, Representative traces of mEPSCs in hippocampal neurons from IGF-1 (300 ng/ml) treatment for 24 h with echinomycin (0.5 μm) (A1) or in HIF-1α-DN- (A2) or HIF-1α-CA-expressing (A3) hippocampal neurons from IGF-1 treatment for 24 h. B, Cumulative distribution of the mEPSC interevent interval. The IGF-1-induced increase in the mEPSC frequency is blocked by pretreatment with echinomycin or in HIF-1α-DN-expressing hippocampal neurons. HIF-1α-CA-expressing hippocampal neurons show a significant increase in the mEPSC frequency. C, Cumulative distribution of the mEPSC amplitude. The amplitude of mEPSCs was not significantly affected by IGF-1 treatment. D, E, The bar graphs show the summary data of the effect of IGF-1 on the average frequency and amplitude of the mEPSCs with echinomycin or in HIF-1α-DN- or HIF-1α-CA-expressing hippocampal neurons. The data of control and IGF-1 treatment were taken from Figure 7. The total number of experiments performed with separate cultures is shown in parentheses. Data are presented as mean ± SEM. *p < 0.05 compared with the vehicle (0.1% DMSO)-treated control group by unpaired Student's t test.
Figure 9.

IGF-1 does not alter the mEPSC frequency in HIF-1α-shRNA-expressing hippocampal neurons. A, Representative traces of mEPSCs in control shRNA-Ds-Red (A1), HIF-1α-shRNA-I- (A2), and HIF-1α-shRNA-II-expressing (A3) hippocampal neurons from IGF-1 (300 ng/ml) treatment for 24 h. B, Cumulative distribution of the mEPSC interevent interval. IGF-1 has no effect on the frequency of mEPSCs in shRNA-I- or shRNA-II-expressing hippocampal neurons. C, Cumulative distribution of the mEPSC amplitude. The amplitude of mEPSCs was not significantly affected by IGF-1 treatment in control shRNA-Ds-Red, shRNA-I-, or shRNA-II-expressing hippocampal neurons. D, E, The bar graphs show the summary data of the effect of IGF-1 on the average frequency and amplitude of the mEPSCs in control shRNA-Ds-Red, shRNA-I-, or shRNA-II-expressing hippocampal neurons. The data of control and IGF-1 treatment were taken from Figure 7. The total number of experiments performed with separate cultures is shown in parentheses. Data are presented as mean ± SEM. *p < 0.05 compared with the control group by unpaired Student's t test.
To confirm that IGF-1-induced enhancement of excitatory synaptic transmission was not attributable to residual IGF-1 in cultures, we tested the acute effect of IGF-1 (300 ng/ml) on mEPSCs. Compared with control neurons, neurons exposed to IGF-1 for 1 h had no significant difference in frequency (control, 1.3 ± 0.2 Hz, n = 8; IGF-1–1 h, 1.8 ± 0.4 Hz, n = 6; p > 0.05 compared with control) or amplitude of mEPSCs (control, 10.8 ± 1.6 pA, n = 8; IGF-1–1 h, 10.9 ± 2.2 pA, n = 6; p > 0.05 compared with control) (Fig. 10A–E). These results rule out a possible role of residual IGF-1 in cultures in governing enhancement of synaptic transmission occurring after prolonged IGF-1 exposure.
Figure 10.

VEGF increases the frequency of mEPSCs. A, Representative traces of mEPSCs in hippocampal neurons from IGF-1 (300 ng/ml) treatment for 1 h (A1) or VEGF (1 ng/ml) treatment for 1 h (A2) or 12 h (A3). B, Cumulative distribution of the mEPSC interevent interval. VEGF induces a significant decrease in the interevent interval. C, Cumulative distribution of the mEPSC amplitude. The amplitude of mEPSCs was not significantly affected by IGF-1 or VEGF treatment. D, E, The bar graphs show the summary data of the effects of IGF-1 and VEGF on the average frequency and amplitude of the mEPSCs in control or shRNA-VEGFR2-expressing hippocampal neurons with or without ZM 323881 (10 nm) or SU 1498 (5 μm) pretreatment. The data of control were taken from Figure 7. The total number of experiments performed with separate cultures is shown in parentheses. Data are presented as mean ± SEM. *p < 0.05 compared with the vehicle (0.1% DMSO)-treated control group by unpaired Student's t test.
Finally, we showed that treatment of hippocampal neuron cultures with VEGF (1 ng/ml) for 1 or 12 h mimicked the effect of IGF-1 in eliciting a significant increase in frequency of mEPSCs (VEGF–1 h, 2.9 ± 0.4 Hz, n = 5; VEGF–12 h, 5.8 ± 1.4 Hz, n = 10; p < 0.05 compared with control), whereas amplitude of mEPSCs was not significantly affected (VEGF–1 h, 11.7 ± 1.7 pA, n = 5; VEGF–12 h, 13.2 ± 2.6 pA, n = 10; p > 0.05 compared with control) (Fig. 10A–E). No significant difference was found in rise time (from 20 to 80% of the peak) or weighted decay time of mEPSCs in VEGF-treated hippocampal neurons (VEGF–1 h, rise time, 0.38 ± 0.09 ms, and decay time, 8.6 ± 1.6 ms, n = 5; VEGF–12 h, rise time, 0.34 ± 0.08 ms, and decay time, 8.2 ± 1.2 ms, n = 10) compared with controls (rise time, 0.36 ± 0.06 ms, and decay time, 8.6 ± 0.9 ms; n = 8). In addition, pretreatment with ZM 323881 (10 nm) or SU 1498 (5 μm) completely blocked VEGF (for 12 h)-induced enhancement of mEPSCs (ZM 323881, 1.5 ± 0.3 Hz, n = 4; SU 1498, 1.4 ± 0.3 Hz, n = 3; ZM 322881 plus VEGF, 1.9 ± 0.4 Hz, n = 5; SU 1498 plus VEGF, 1.7 ± 0.3 Hz, n = 4; p < 0.05 compared with VEGF alone). Furthermore, VEGF-induced enhancement of mEPSC frequency was not observed in VEGF receptor 2 shRNA-expressing neurons (shRNA-VEGFR2, 1.4 ± 0.3 Hz, n = 4; shRNA-VEGFR2 plus VEGF, 2.1 ± 0.6 Hz, n = 6; p < 0.05 compared with VEGF alone). Together, these results strongly suggest that IGF-1 enhances excitatory synaptic transmission in hippocampal neuron cultures through HIF-1α upregulation and VEGF secretion.
Discussion
This paper presents data that support a novel role of HIF-1α-mediated VEGF expression in IGF-1-induced enhancement of excitatory synaptic transmission in hippocampal neuron cultures. We demonstrated that IGF-1 stimulates HIF-1α expression by de novo transcription of the HIF-1α gene through activation of the PI3K/Akt/mTOR signaling pathway. VEGF released from neurons may act, at least in part, via VEGF receptor 2 to enhance excitatory synaptic transmission.
IGF-1-induced VEGF synthesis and secretion has been reported in several non-neuron cell lines, including human retinal pigment epithelial cells (Punglia et al., 1997), colon cancer cells (Fukuda et al., 2002), endometrial adenocarcinoma cells (Bermont et al., 2001), and human mesangial cells (Gruden et al., 2003). Here, we demonstrated for the first time, to our knowledge, that IGF-1 induces VEGF production in nearly pure primary hippocampal neuron cultures. Our data demonstrate a positive correlation between IGF-1-induced increases in VEGF mRNA level and protein production. We found that VEGF production started to increase 3 h after IGF-1 treatment, approached maximal levels at 12 h, and remained elevated until ∼24 h. This time course for IGF-1-induced VEGF production is similar to that previously shown for non-neuronal cells. However, it is noteworthy that the levels of IGF-1-induced VEGF production we observed in hippocampal neurons were lower than reported in non-neuronal cells. It remains unclear whether preexisting IGF-1 receptor levels in these cell types are different or posttranscriptional regulatory mechanisms for increasing VEGF expression in response to IGF-1 stimulation vary among cell types. Because secreted VEGF protein levels were determined in culture media, our data do not allow us to exclude the possibility that the efficiency of VEGF secretion or the metabolic turnover rate of VEGF varies considerably among cell types.
HIF-1 is the principal regulator of hypoxia-induced VEGF expression. It is now well established that HIF-1 can be activated by conditions other than hypoxia. Various growth factors and cytokines have been shown to be capable of stimulating synthesis, as well as stabilizing and activating, HIF-1α (Sharp and Bernaudin, 2004). Under hypoxic conditions, lack of hydroxylation prevents HIF-1α degradation by the ubiquitin–proteasome system and leads to rapid HIF-1α accumulation (Maxwell et al., 1999; Jaakkola et al., 2001). In this study, the stimulatory effect of IGF-1 on HIF-1α protein expression does not imply a significant inhibition of HIF-1α degradation but instead an increase in synthesis. This increment is related in timely manner to an increase in HIF-1α mRNA, suggesting this effect is attributable to transcriptional upregulation of HIF-1α gene expression. This hypothesis is supported by observations that IGF-1-induced HIF-1α expression was completely blocked by pretreatment with the transcriptional inhibitor actinomycin D and that the time courses of HIF-1α turnover were not significantly altered by IGF-1 in the presence of the translation inhibitor cycloheximide.
A pressing question that follows these observations is how IGF-1 activates HIF-1α gene expression. IGF-1 receptors transduce IGF-1 signals to the nucleus primarily via the PI3K/Akt and MAPK pathways. Our finding that the IGF-1-induced increase in HIF-1α expression was blocked by two structurally unrelated PI3K inhibitors and the mTOR inhibitor, supports a pathway involving PI3K and mTOR. This is consistent with reports showing that activation of the PI3K/Akt/mTOR signaling pathway by IGF-1 can stimulate HIF-1α expression in colon cancer cells (Fukuda et al., 2002) and ARPE-19 cells (Treins et al., 2005). The molecular mechanism by which PI3K/Akt regulates HIF-1α transcription remains to be elucidated. A recent study in pulmonary artery smooth muscle cells indicated that hypoxia can increase HIF-1α transcription through activation of the PI3K/Akt signaling pathway and nuclear factor-κB (NFκB) (Belaiba et al., 2007). Given involvement of the PI3K/Akt pathway in activation of NFκB (Sizemore et al., 1999; Madrid et al., 2000), it is possible that PI3K/Akt stimulates HIF-1α indirectly by inducing NFκB, which in turn binds and therefore activates the HIF-1α promoter. Our findings showed that the MAPK pathway is not involved in IGF-1-induced HIF-1α accumulation. This contrasts with observations made in a previous study, which reported a dual requirement for PI3K and MAPK signaling in IGF-1-induced HIF-1α expression in colon cancer cells (Fukuda et al., 2002). This discrepancy could be attributable to differences in experimental design as well as differences in cell types.
Consistent with previous studies (Fukuda et al., 2002; Treins et al., 2005), the current study showed that blockade of mTOR signaling with rapamycin inhibited IGF-1-induced HIF-1α expression. Because our results indicate that the inhibitory effect of rapamycin was less than those observed for LY294002 and wortmannin, it is possible that other members of the PI3K signaling pathway may be involved in mediating IGF-1-induced HIF-1α expression. Although the mechanism by which mTOR regulates HIF-1α protein expression remains to be established, it is highly likely that mTOR acts mainly through regulation of translational control to mediate its effects on HIF-1α. Additional studies are required to examine this possibility.
What are the functional consequences of IGF-1-induced VEGF synthesis and secretion? Our data indicate that increased VEGF secretion is accompanied by a concomitant increase in the frequency but not amplitude of mEPSCs and that this enhancement is blocked by the selective VEGF receptor 2 inhibitors or knockdown of VEGF receptor 2 expression by shRNA. An increase in the frequency of mEPSCs is classically interpreted as an increase in the number of glutamatergic synaptic contacts and/or a presynaptic enhancement of glutamate release probability (Katz, 1969). However, IGF-1 (300 ng/ml) treatment for 24 h does not affect glutamatergic synapse density identified by vesicular glutamate transporter 1/PSD-95 colocalization (supplemental Fig. S7, available at www.jneurosci.org as supplemental material), arguing against a global change in synaptic contacts. Thus, the observed increases in mEPSC frequency by IGF-1 or VEGF treatment are most likely attributable to an enhancement of presynaptic release probability. Additional studies are needed to clarify this possibility. The lack of effect of IGF-1 or VEGF on mEPSC kinetics also implies that their action on glutamatergic transmission is not mediated by a change in postsynaptic responsiveness to glutamate. Interestingly, the observed synaptic enhancement to VEGF exposure was more evident when VEGF was applied for 12 h. Although the mechanism underlying this delayed appearance of VEGF action remains unclear, an intriguing possibility is its induction because of a complex set of signaling mechanisms. The effect of VEGF on glutamatergic transmission is still controversial, with evidence for both inhibition (McCloskey et al., 2005) and enhancement (Kim et al., 2008). The reasons for these discrepancies are unclear. They may be attributable to use of different doses and timescales of VEGF challenges, leading to activation of different cellular events that vary in mode of action. Here, we extended these findings by showing for the first time that stimulation of HIF-1α expression is required for induction of IGF-1-induced VEGF secretion and synaptic potentiation. This notion is supported by our findings that both genetic disruption and pharmacological blockade of HIF-1α prevented IGF-1-induced VEGF secretion and enhancement of mEPSC frequency. In addition, treatment of hippocampal neurons with VEGF mimicked the action of IGF-1 in enhancing mEPSC frequency. Together, these results reveal a novel role for HIF-1-mediated VEGF expression in regulation of excitatory synaptic transmission.
In conclusion, we not only demonstrated that IGF-1 is able to induce HIF-1-mediated VEGF synthesis and secretion in hippocampal neurons, but we also identified the molecular mechanism by which IGF-1 increases HIF-1α expression through the activation of PI3K/Akt/mTOR signaling pathway. Our findings also highlight the importance of VEGF in signal processing in hippocampal neurons and confirm that excitatory synaptic transmission is certainly regulated by locally released VEGF (Kim et al., 2008). It is unknown whether this might occur in hippocampal slices or intact animals and its functional relevance remains elusive. Given evidence to date indicates that blood vessels and glia are major sites of the actions of VEGF in the brain (Ruiz de Almodovar et al., 2009), we cannot exclude the possibility that VEGF may also act on these non-neuronal cells to mediate its effect on glutamatergic transmission in intact tissue preparations or may modulate glutamatergic transmission, but have very different effects depending on the preparations. It is noteworthy that, although the VEGF expression in hippocampal neurons is low under basal physiological conditions, it is strongly upregulated after cerebral ischemia (Jin et al., 2000) or status epilepticus (Nicoletti et al., 2008) to exert neuroprotective effects. It is uncertain whether VEGF exerts its neuroprotective effect by altering the glutamatergic transmission. Although increased glutamatergic transmission would be more likely to promote neuronal damage (Hara and Snyder, 2007), augmentation of glutamatergic function may also increase the secretion of some protective factors (i.e., neuropeptide Y) to protect neurons from cell death (El Bahh et al., 2001; Silva et al., 2005). Additional studies are necessary to explore this issue. Despite the clear significance of VEGF in neuron survival, there is strong evidence that neuronal VEGF has an additional role in linking hippocampal activity with neurogenesis, learning, and memory (Cao et al., 2004). Furthermore, neuronal VEGF expression in the hippocampus has been considered to be an important mediator for producing antidepressant behaviors (Lee et al., 2009). It will be interesting to determine whether neuronal VEGF exerts these physiological effects through enhancement of excitatory synaptic transmission.
Footnotes
This work was supported by National Health Research Institute (Taiwan) Grant NHRI-EX97-9618NI and National Science Council (Taiwan) Grant NSC97-2321-B-006-008. We thank Drs. Ju-Ming Wang and Joseph T. Tseng for expert technical assistance.
References
- Balkowiec A, Katz DM. Cellular mechanisms regulating activity-dependent release of native brain-derived neurotrophic factor from hippocampal neurons. J Neurosci. 2002;22:10399–10407. doi: 10.1523/JNEUROSCI.22-23-10399.2002. [DOI] [PMC free article] [PubMed] [Google Scholar]
- Belaiba RS, Bonello S, Zähringer C, Schmidt S, Hess J, Kietzmann T, Görlach A. Hypoxia up-regulates hypoxia-inducible factor-1α transcription by involving phosphatidylinositol 3-kinase and nuclear factor κB in pulmonary artery smooth muscle cells. Mol Biol Cell. 2007;18:4691–4697. doi: 10.1091/mbc.E07-04-0391. [DOI] [PMC free article] [PubMed] [Google Scholar]
- Bermont L, Lamielle F, Lorchel F, Fauconnet S, Esumi H, Weisz A, Adessi GL. Insulin up-regulates vascular endothelial growth factor and stabilizes its messengers in endometrial adenocarcinoma cells. J Clin Endocrinol Metab. 2001;86:363–368. doi: 10.1210/jcem.86.1.7153. [DOI] [PubMed] [Google Scholar]
- Canabal DD, Potian JG, Duran RG, McArdle JJ, Routh VH. Hyperglycemia impairs glucose and insulin regulation of nitric oxide production in glucose-inhibited neurons in the ventromedial hypothalamus. Am J Physiol Regul Integr Comp Physiol. 2007;293:R592–R600. doi: 10.1152/ajpregu.00207.2007. [DOI] [PubMed] [Google Scholar]
- Cao L, Jiao X, Zuzga DS, Liu Y, Fong DM, Young D, During MJ. VEGF links hippocampal activity with neurogenesis, learning and memory. Nat Genet. 2004;36:827–835. doi: 10.1038/ng1395. [DOI] [PubMed] [Google Scholar]
- Chavez JC, LaManna JC. Activation of hypoxia-inducible factor-1 in the rat cerebral cortex after transient global ischemia: potential role of insulin-like growth factor-1. J Neurosci. 2002;22:8922–8931. doi: 10.1523/JNEUROSCI.22-20-08922.2002. [DOI] [PMC free article] [PubMed] [Google Scholar]
- Chen J, Zhao S, Nakada K, Kuge Y, Tamaki N, Okada F, Wang J, Shindo M, Higashino F, Takeda K, Asaka M, Katoh H, Sugiyama T, Hosokawa M, Kobayashi M. Dominant-negative hypoxia-inducible factor-1 reduces tumorigenicity of pancreatic cancer cells through the suppression of glucose metabolism. Am J Pathol. 2003;162:1283–1291. doi: 10.1016/s0002-9440(10)63924-7. [DOI] [PMC free article] [PubMed] [Google Scholar]
- El Bahh B, Auvergne R, Leré C, Brana C, Le Gal La Salle G, Rougier A. Decreased epileptic susceptibility correlates with neuropeptide Y overexpression in a model of tolerance to excitotoxicity. Brain Res. 2001;894:209–217. doi: 10.1016/s0006-8993(01)02027-3. [DOI] [PubMed] [Google Scholar]
- Favata MF, Horiuchi KY, Manos EJ, Daulerio AJ, Stradley DA, Feeser WS, Van Dyk DE, Pitts WJ, Earl RA, Hobbs F, Copeland RA, Magolda RL, Scherle PA, Trzaskos JM. Identification of a novel inhibitor of mitogen-activated protein kinase kinase. J Biol Chem. 1998;273:18623–18632. doi: 10.1074/jbc.273.29.18623. [DOI] [PubMed] [Google Scholar]
- Ferrara N, Davis-Smyth T. The biology of vascular endothelial growth factor. Endocr Rev. 1997;18:4–25. doi: 10.1210/edrv.18.1.0287. [DOI] [PubMed] [Google Scholar]
- Fukuda R, Hirota K, Fan F, Jung YD, Ellis LM, Semenza GL. Insulin-like growth factor 1 induces hypoxia-inducible factor 1-mediated vascular endothelial growth factor expression, which is dependent on MAP kinase and phosphatidylinositol 3-kinase signaling in colon cancer cells. J Biol Chem. 2002;277:38205–38211. doi: 10.1074/jbc.M203781200. [DOI] [PubMed] [Google Scholar]
- Garrett TA, Van Buul JD, Burridge K. VEGF-induced Rac1 activation in endothelial cells is regulated by the guanine nucleotide exchange factor Vav2. Exp Cell Res. 2007;313:3285–3297. doi: 10.1016/j.yexcr.2007.05.027. [DOI] [PMC free article] [PubMed] [Google Scholar]
- Gingras AC, Kennedy SG, O'Leary MA, Sonenberg N, Hay N. 4E-BP1, a repressor of mRNA translation, is phosphorylated and inactivated by the Akt (PKB) signaling pathway. Genes Dev. 1998;12:502–513. doi: 10.1101/gad.12.4.502. [DOI] [PMC free article] [PubMed] [Google Scholar]
- Gruden G, Araf S, Zonca S, Burt D, Thomas S, Gnudi L, Viberti G. IGF-I induces vascular endothelial growth factor in human mesangial cells via a Src-dependent mechanism. Kidney Int. 2003;63:1249–1255. doi: 10.1046/j.1523-1755.2003.00857.x. [DOI] [PubMed] [Google Scholar]
- Hara MR, Snyder SH. Cell signaling and neuronal death. Annu Rev Pharmacol Toxicol. 2007;47:117–141. doi: 10.1146/annurev.pharmtox.47.120505.105311. [DOI] [PubMed] [Google Scholar]
- Hirsilä M, Koivunen P, Xu L, Seeley T, Kivirikko KI, Myllyharju J. Effect of desferrioxamine and metals on the hydroxylases in the oxygen sensing pathway. FASEB J. 2005;19:1308–1310. doi: 10.1096/fj.04-3399fje. [DOI] [PubMed] [Google Scholar]
- Hoffman AF, Lupica CR. Direct actions of cannabinoids on synaptic transmission in the nucleus accumbens: a comparison with opioids. J Neurophysiol. 2001;85:72–83. doi: 10.1152/jn.2001.85.1.72. [DOI] [PubMed] [Google Scholar]
- Huang CC, Chou PH, Yang CH, Hsu KS. Neonatal isolation accelerates the developmental switch in the signalling cascades for long-term potentiation induction. J Physiol. 2005;569:789–799. doi: 10.1113/jphysiol.2005.098160. [DOI] [PMC free article] [PubMed] [Google Scholar]
- Jaakkola P, Mole DR, Tian YM, Wilson MI, Gielbert J, Gaskell SJ, Kriegsheim Av, Hebestreit HF, Mukherji M, Schofield CJ, Maxwell PH, Pugh CW, Ratcliffe PJ. Targeting of HIF-α to the von Hippel-Lindau ubiquitylation complex by O2-regulated prolyl hydroxylation. Science. 2001;292:468–472. doi: 10.1126/science.1059796. [DOI] [PubMed] [Google Scholar]
- Jin K, Zhu Y, Sun Y, Mao XO, Xie L, Greenberg DA. Vascular endothelial growth factor (VEGF) stimulates neurogenesis in vitro and in vivo. Proc Natl Acad Sci U S A. 2002;99:11946–11950. doi: 10.1073/pnas.182296499. [DOI] [PMC free article] [PubMed] [Google Scholar]
- Jin KL, Mao XO, Nagayama T, Goldsmith PC, Greenberg DA. Induction of vascular endothelial growth factor and hypoxia-inducible factor-1α by global ischemia in rat brain. Neuroscience. 2000;99:577–585. doi: 10.1016/s0306-4522(00)00207-4. [DOI] [PubMed] [Google Scholar]
- Kallio PJ, Pongratz I, Gradin K, McGuire J, Poellinger L. Activation of hypoxia-inducible factor 1α: posttranscriptional regulation and conformational change by recruitment of the Arnt transcription factor. Proc Natl Acad Sci U S A. 1997;94:5667–5672. doi: 10.1073/pnas.94.11.5667. [DOI] [PMC free article] [PubMed] [Google Scholar]
- Katz B. The release of neural transmitter substances. Liverpool: Liverpool UP; 1969. [Google Scholar]
- Kazi AA, Jones JM, Koos RD. Chromatin immunoprecipitation analysis of gene expression in the rat uterus in vivo: estrogen-induced recruitment of both estrogen receptor α and hypoxia-inducible factor 1 to the vascular endothelial growth factor promoter. Mol Endocrinol. 2005;19:2006–2019. doi: 10.1210/me.2004-0388. [DOI] [PubMed] [Google Scholar]
- Ke Q, Costa M. Hypoxia-inducible factor-1 (HIF-1) Mol Pharmacol. 2006;70:1469–1480. doi: 10.1124/mol.106.027029. [DOI] [PubMed] [Google Scholar]
- Kim BW, Choi M, Kim YS, Park H, Lee HR, Yun CO, Kim EJ, Choi JS, Kim S, Rhim H, Kaang BK, Son H. Vascular endothelial growth factor (VEGF) signaling regulates hippocampal neurons by elevation of intracellular calcium and activation of calcium/calmodulin protein kinase II and mammalian target of rapamycin. Cell Signal. 2008;20:714–725. doi: 10.1016/j.cellsig.2007.12.009. [DOI] [PubMed] [Google Scholar]
- Kjeldsen T, Andersen AS, Wiberg FC, Rasmussen JS, Schäffer L, Balschmidt P, Møller KB, Møller NP. The ligand specificities of the insulin receptor and the insulin-like growth factor 1 receptor reside in different regions of a common binding site. Proc Natl Acad Sci U S A. 1991;88:4404–4408. doi: 10.1073/pnas.88.10.4404. [DOI] [PMC free article] [PubMed] [Google Scholar]
- Kong D, Park EJ, Stephen AG, Calvani M, Cardellina JH, Monks A, Fisher RJ, Shoemaker RH, Melillo G. Echinomycin, a small-molecule inhibitor of hypoxia-inducible factor-1 DNA-binding activity. Cancer Res. 2005;65:9047–9055. doi: 10.1158/0008-5472.CAN-05-1235. [DOI] [PubMed] [Google Scholar]
- Kovács Z, Ikezaki K, Samoto K, Inamura T, Fukui M. VEGF and flt. Expression time kinetics in rat brain infarct. Stroke. 1996;27:1865–1872. doi: 10.1161/01.str.27.10.1865. discussion 1872–1873. [DOI] [PubMed] [Google Scholar]
- Krum JM, Khaibullina A. Inhibition of endogenous VEGF impedes revascularization and astroglial proliferation: roles for VEGF in brain repair. Exp Neurol. 2003;181:241–257. doi: 10.1016/s0014-4886(03)00039-6. [DOI] [PubMed] [Google Scholar]
- Kutner RH, Zhang XY, Reiser J. Production, concentration and titration of pseudotyped HIV-1-based lentiviral vectors. Nat Protoc. 2009;4:495–505. doi: 10.1038/nprot.2009.22. [DOI] [PubMed] [Google Scholar]
- Lando D, Peet DJ, Whelan DA, Gorman JJ, Whitelaw ML. Asparagine hydroxylation of the HIF transactivation domain a hypoxic switch. Science. 2002;295:858–861. doi: 10.1126/science.1068592. [DOI] [PubMed] [Google Scholar]
- Lee CC, Huang CC, Wu MY, Hsu KS. Insulin stimulates postsynaptic density-95 protein translation via the phosphoinositide 3-kinase-Akt-mammalian target of rapamycin signaling pathway. J Biol Chem. 2005;280:18543–18550. doi: 10.1074/jbc.M414112200. [DOI] [PubMed] [Google Scholar]
- Lee JS, Jang DJ, Lee N, Ko HG, Kim H, Kim YS, Kim B, Son J, Kim SH, Chung H, Lee MY, Kim WR, Sun W, Zhuo M, Abel T, Kaang BK, Son H. Induction of neuronal vascular endothelial growth factor expression by cAMP in the dentate gyrus of the hippocampus is required for antidepressant-like behaviors. J Neurosci. 2009;29:8493–8505. doi: 10.1523/JNEUROSCI.1321-09.2009. [DOI] [PMC free article] [PubMed] [Google Scholar]
- Madrid LV, Wang CY, Guttridge DC, Schottelius AJ, Baldwin AS, Jr, Mayo MW. Akt suppresses apoptosis by stimulating the transactivation potential of the RelA/p65 subunit of NF-κB. Mol Cell Biol. 2000;20:1626–1638. doi: 10.1128/mcb.20.5.1626-1638.2000. [DOI] [PMC free article] [PubMed] [Google Scholar]
- Marti HH, Risau W. Systemic hypoxia changes the organ-specific distribution of vascular endothelial growth factor and its receptors. Proc Natl Acad Sci U S A. 1998;95:15809–15814. doi: 10.1073/pnas.95.26.15809. [DOI] [PMC free article] [PubMed] [Google Scholar]
- Maxwell PH, Wiesener MS, Chang GW, Clifford SC, Vaux EC, Cockman ME, Wykoff CC, Pugh CW, Maher ER, Ratcliffe PJ. The tumour suppressor protein VHL targets hypoxia-inducible factors for oxygen-dependent proteolysis. Nature. 1999;399:271–275. doi: 10.1038/20459. [DOI] [PubMed] [Google Scholar]
- McCloskey DP, Croll SD, Scharfman HE. Depression of synaptic transmission by vascular endothelial growth factor in adult rat hippocampus and evidence for increased efficacy after chronic seizures. J Neurosci. 2005;25:8889–8897. doi: 10.1523/JNEUROSCI.2577-05.2005. [DOI] [PMC free article] [PubMed] [Google Scholar]
- Miele C, Rochford JJ, Filippa N, Giorgetti-Peraldi S, Van Obberghen E. Insulin and insulin-like growth factor-I induce vascular endothelial growth factor mRNA expression via different signaling pathways. J Biol Chem. 2000;275:21695–21702. doi: 10.1074/jbc.M000805200. [DOI] [PubMed] [Google Scholar]
- Nicoletti JN, Shah SK, McCloskey DP, Goodman JH, Elkady A, Atassi H, Hylton D, Rudge JS, Scharfman HE, Croll SD. Vascular endothelial growth factor is up-regulated after status epilepticus and protects against seizure-induced neuronal loss in hippocampus. Neuroscience. 2008;151:232–241. doi: 10.1061/j.neuroscience.2007.09.083. [DOI] [PMC free article] [PubMed] [Google Scholar]
- Párrizas M, Gazit A, Levitzki A, Wertheimer E, LeRoith D. Specific inhibition of insulin-like growth factor-1 and insulin receptor tyrosine kinase activity and biological function by tyrphostins. Endocrinology. 1997;138:1427–1433. doi: 10.1210/endo.138.4.5092. [DOI] [PubMed] [Google Scholar]
- Punglia RS, Lu M, Hsu J, Kuroki M, Tolentino MJ, Keough K, Levy AP, Levy NS, Goldberg MA, D'Amato RJ, Adamis AP. Regulation of vascular endothelial growth factor expression by insulin-like growth factor 1. Diabetes. 1997;46:1619–1626. doi: 10.2337/diacare.46.10.1619. [DOI] [PubMed] [Google Scholar]
- Rosenstein JM, Mani N, Khaibullina A, Krum JM. Neurotrophic effects of vascular endothelial growth factor on organotypic cortical explants and primary cortical neurons. J Neurosci. 2003;23:11036–11044. doi: 10.1523/JNEUROSCI.23-35-11036.2003. [DOI] [PMC free article] [PubMed] [Google Scholar]
- Ruiz de Almodovar C, Lambrechts D, Mazzone M, Carmeliet P. Role and therapeutic potential of VEGF in the nervous system. Physiol Rev. 2009;89:607–648. doi: 10.1152/physrev.00031.2008. [DOI] [PubMed] [Google Scholar]
- Sabers CJ, Martin MM, Brunn GJ, Williams JM, Dumont FJ, Wiederrecht G, Abraham RT. Isolation of a protein target of the FKBP12-rapamycin complex in mammalian cells. J Biol Chem. 1995;270:815–822. doi: 10.1074/jbc.270.2.815. [DOI] [PubMed] [Google Scholar]
- Salceda S, Caro J. Hypoxia-inducible factor 1α (HIF-1α) protein is rapidly degraded by the ubiquitin-proteasome system under normoxic conditions. Its stabilization by hypoxia depends on redox-induced changes. J Biol Chem. 1997;272:22642–22647. doi: 10.1074/jbc.272.36.22642. [DOI] [PubMed] [Google Scholar]
- Sandau KB, Zhou J, Kietzmann T, Brüne B. Regulation of the hypoxia-inducible factor 1α by the inflammatory mediators nitric oxide and tumor necrosis factor-alpha in contrast to desferroxamine and phenylarsine oxide. J Biol Chem. 2001;276:39805–39811. doi: 10.1074/jbc.M107689200. [DOI] [PubMed] [Google Scholar]
- Semenza GL. Hypoxia-inducible factor 1: master regulator of O2 homeostasis. Curr Opin Genet Dev. 1998;8:588–594. doi: 10.1016/s0959-437x(98)80016-6. [DOI] [PubMed] [Google Scholar]
- Sharp FR, Bernaudin M. HIF1 and oxygen sensing in the brain. Nat Rev Neurosci. 2004;5:437–448. doi: 10.1038/nrn1408. [DOI] [PubMed] [Google Scholar]
- Shen BQ, Lee DY, Zioncheck TF. Vascular endothelial growth factor governs endothelial nitric-oxide synthase expression via a KDR/Flk-1 receptor and a protein kinase C signaling pathway. J Biol Chem. 1999;274:33057–33063. doi: 10.1074/jbc.274.46.33057. [DOI] [PubMed] [Google Scholar]
- Silva AP, Xapelli S, Grouzmann E, Cavadas C. The putative neuroprotective role of neuropeptide Y in the central nervous system. Curr Drug Targets CNS Neurol Disord. 2005;4:331–347. doi: 10.2174/1568007054546153. [DOI] [PubMed] [Google Scholar]
- Sizemore N, Leung S, Stark GR. Activation of phosphatidylinositol 3-kinase in response to interleukin-1 leads to phosphorylation and activation of the NF-κB p65/RelA subunit. Mol Cell Biol. 1999;19:4798–4805. doi: 10.1128/mcb.19.7.4798. [DOI] [PMC free article] [PubMed] [Google Scholar]
- Slomiany MG, Rosenzweig SA. Hypoxia-inducible factor-1-dependent and -independent regulation of insulin-like growth factor-1-stimulated vascular endothelial growth factor secretion. J Pharmacol Exp Ther. 2006;318:666–675. doi: 10.1124/jpet.106.104158. [DOI] [PubMed] [Google Scholar]
- Sutter CH, Laughner E, Semenza GL. Hypoxia-inducible factor 1alpha protein expression is controlled by oxygen-regulated ubiquitination that is disrupted by deletions and missense mutations. Proc Natl Acad Sci U S A. 2000;97:4748–4753. doi: 10.1073/pnas.080072497. [DOI] [PMC free article] [PubMed] [Google Scholar]
- Suzuki K, Ikegaya Y, Matsuura S, Kanai Y, Endou H, Matsuki N. Transient upregulation of the glial glutamate transporter GLAST in response to fibroblast growth factor, insulin-like growth factor and epidermal growth factor in cultured astrocytes. J Cell Sci. 2001;114:3717–3725. doi: 10.1242/jcs.114.20.3717. [DOI] [PubMed] [Google Scholar]
- Treins C, Giorgetti-Peraldi S, Murdaca J, Monthouël-Kartmann MN, Van Obberghen E. Regulation of hypoxia-inducible factor (HIF)-1 activity and expression of HIF hydroxylases in response to insulin-like growth factor I. Mol Endocrinol. 2005;19:1304–1317. doi: 10.1210/me.2004-0239. [DOI] [PubMed] [Google Scholar]
- Vlahos CJ, Matter WF, Hui KY, Brown RF. A specific inhibitor of phosphatidylinositol 3-kinase, 2-(4-morpholinyl)-8-phenyl-4H-1-benzopyran-4-one (LY294002) J Biol Chem. 1994;269:5241–5248. [PubMed] [Google Scholar]
- Wang DS, Miura M, Demura H, Sato K. Anabolic effects of 1,25-dihydroxyvitamin D3 on osteoblasts are enhanced by vascular endothelial growth factor produced by osteoblasts and by growth factors produced by endothelial cells. Endocrinology. 1997;138:2953–2962. doi: 10.1210/endo.138.7.5275. [DOI] [PubMed] [Google Scholar]
- Wang GS, Hong CJ, Yen TY, Huang HY, Ou Y, Huang TN, Jung WG, Kuo TY, Sheng M, Wang TF, Hsueh YP. Transcriptional modification by a CASK-interacting nucleosome assembly protein. Neuron. 2004;42:113–128. doi: 10.1016/s0896-6273(04)00139-4. [DOI] [PubMed] [Google Scholar]
- Whittles CE, Pocock TM, Wedge SR, Kendrew J, Hennequin LF, Harper SJ, Bates DO. ZM 323881, a novel inhibitor of vascular endothelial growth factor-receptor-2 tyrosine kinase activity. Microcirculation. 2002;9:513–522. doi: 10.1038/sj.mn.7800164. [DOI] [PubMed] [Google Scholar]
- Widenfalk J, Lipson A, Jubran M, Hofstetter C, Ebendal T, Cao Y, Olson L. Vascular endothelial growth factor improves functional outcome and decreases secondary degeneration in experimental spinal cord contusion injury. Neuroscience. 2003;120:951–960. doi: 10.1016/s0306-4522(03)00399-3. [DOI] [PubMed] [Google Scholar]
- Yamashita T, Ishikawa T, Takahashi T. Developmental increase in vesicular glutamate content does not cause saturation of AMPA receptors at the calyx of Held synapse. J Neurosci. 2003;23:3633–3638. doi: 10.1523/JNEUROSCI.23-09-03633.2003. [DOI] [PMC free article] [PubMed] [Google Scholar]
- Zhu Y, Jin K, Mao XO, Greenberg DA. Vascular endothelial growth factor promotes proliferation of cortical neuron precursors by regulating E2F expression. FASEB J. 2003;17:186–193. doi: 10.1096/fj.02-0515com. [DOI] [PubMed] [Google Scholar]