

Abstract
Adaptive processes over many timescales endow neurons with sensitivity to stimulus changes over a similarly wide range of scales. Although spike timing of single neurons can precisely signal rapid fluctuations in their inputs, the mean firing rate can convey information about slower-varying properties of the stimulus. Here, we investigate the firing rate response to a slowly varying envelope of whisker motion in two processing stages of the rat vibrissa pathway. The whiskers of anesthetized rats were moved through a noise trajectory with an amplitude that was sinusoidally modulated at one of several frequencies. In thalamic neurons, we found that the rate response to the stimulus envelope was also sinusoidal, with an approximately frequency-independent phase advance with respect to the input. Responses in cortex were similar but with a phase shift that was about three times larger, consistent with a larger amount of rate adaptation. These response properties can be described as a linear transformation of the input for which a single parameter quantifies the phase shift as well as the degree of adaptation. These results are reproduced by a model of adapting neurons connected by synapses with short-term plasticity, showing that the observed linear response and phase lead can be built up from a network that includes a sequence of nonlinear adapting elements. Our study elucidates how slowly varying envelope information under passive stimulation is preserved and transformed through the vibrissa processing pathway.
Introduction
Neural systems are subject to adaptive processes over a wide range of timescales (Wark et al., 2007). These processes lead to history dependence of the responses in a neural system. In a simple example, a step increase in stimulus typically causes a rapid increase in firing rate, followed by a slower decrease (Adrian and Zotterman, 1926; Koch, 1999; Dayan and Abbott, 2001; Gerstner and Kistler, 2002). Such response dynamics emphasize change in the stimulus and accentuate high frequencies (Benda and Herz, 2003; Drew and Abbott, 2006), an effect that has long been speculated to increase the efficiency of information transmission (Barlow, 1961; Atick, 1992). However, although adaptation is prevalent throughout the nervous system, its function remains only partially understood (Wark et al., 2007).
Neurons fire precisely in response to input fluctuations on timescales of milliseconds (Bryant and Segundo, 1976; Bialek et al., 1991; Mainen and Sejnowski, 1995): throughout sensory pathways, instantaneous fluctuations in firing probability can reliably encode millisecond-range stimulus changes (Bair, 1999; Tiesinga et al., 2008; Petersen et al., 2009). However, natural stimuli typically fluctuate over a wide range of spatial and temporal scales; the slowly varying envelope of fine-scale fluctuations can also contain meaningful information. For example, rodents performing whisker-mediated active exploration can modulate the offset, amplitude, and frequency of their whisking waveforms (Carvell and Simons, 1995; Berg and Kleinfeld, 2003). To decode the location and nature of an object, neuronal responses to these modulations must be disambiguated (Fee et al., 1997; Ahissar et al., 2000; Curtis and Kleinfeld, 2009). Whether sensory neurons jointly encode high-frequency fluctuations, corresponding to fast whisker vibration, and slowly varying signals, such as overall modulation of whisking, is unclear.
Recently, Lundstrom et al. (2008) showed that the firing rate of rat neocortical neurons in vitro encodes variations in the mean or variance of a noisy input on timescales from seconds to minutes. Firing rates behaved as a linear transformation of the slowly varying stimulus envelope, with a special property: regardless of the frequency of the envelope, the response showed the same phase advance with respect to the input. This behavior was well described by the operation of “fractional differentiation,” which is a generalization of the more familiar integer (e.g., first or second) order differentiation (Podlubny, 1999; Kleinz and Osler, 2000; Oldham and Spanier, 2006). Similar to integer order differentiation, fractional differentiation implies increased sensitivity to changes in the input; however, in contrast to integer order differentiation, the output of fractional differentiation contains information about a broad range of input frequencies.
Here we aimed to explore how firing rate adaptation affects the in vivo encoding of the slowly varying stimulus envelope in two different structures within the rat vibrissa sensory pathway. We recorded from thalamic and cortical neurons at locations likely to be separated by several synapses (Petersen, 2007; Diamond et al., 2008; Fox, 2008). We found that the firing rate of both the thalamic and the cortical neuronal populations approximates fractional differentiation of the stimulus envelope. This behavior can be described with a single parameter, the order of fractional differentiation, whose value increases farther away from the periphery together with the degree of adaptation.
Materials and Methods
In vivo recording.
Experiments were performed in 5- to 8-week-old Wistar rats (n = 12) anesthetized with urethane (1.2–1.4 g/kg, i.p.). Animals were placed in a stereotaxic device (Narishige) while their body temperature was maintained at 37°C using a homeothermic heating pad (FHC). Eyelid and hindpaw reflexes were monitored, and urethane was administered as necessary. Using glass pipettes filled with saline (0.9 g NaCl/100 ml), cell-attached recordings were obtained from single neurons in the neocortex and thalamus that clearly responded to brisk whisker movements. For the neocortex, craniotomies were centered at 2 mm posterior and 5 mm lateral relative to bregma; neurons (n = 28) were recorded at depths of 0.9–1.5 mm, estimated to be within layer 5 (Manns et al., 2004). For the thalamus, craniotomies were centered at 3 mm posterior and 2.8 mm lateral relative to bregma, and neurons (n = 8) were recorded at depths of 5–6 mm, which we presumed were neurons from the ventral posteromedial (VPM) nucleus (Voigt et al., 2008). Recordings were digitized at 10 kHz [Axon Multiclamp 700B (Molecular Devices); CED 1401, Spike 2 software (Cambridge Electronic Design)].
Whisker stimuli.
All whiskers present on the right side of the snout were jointly introduced into a rigid plastic micropipette, which was glued to a piezoelectric bender (Physik Instrumente) and affixed to the micropipette tip with a small amount of adhesive paste. The stimulator had a dynamic range of 400 μm. Whisker position stimuli consisted of normally distributed unit variance white noise sampled at 10 kHz, which was then convolved with a Gaussian filter (full-width half-maximum of 16.7 ms) to smooth the stimulus on a 10 ms timescale. The filtered noise sequence was then scaled by a value chosen such that only the most extreme 1% of position values were outside the dynamic range of the wafer (±200 μm). These extremal values were fixed at ±200 μm. The noise was then multiplied by a sine-wave envelope that varied between 0.4 and 1. The particular noise sequence differed on each stimulus cycle. Each stimulus block involved a series of slowly varying sine-wave envelopes with differing periods, T = 1–32 s. For thalamic neurons, sine waves with T = 1, 2, 4, 8, 16, 32 s were presented for 128 s per period T, giving a total block length of 768 s. Blocks with the periods presented in increasing and decreasing order were alternated. For cortical neurons, sine waves with four of the six periods were each presented for 160 s, giving a total block length of 640 s. In other words, the presented period sequences were T = 1, 2, 16, 32 s (n = 10 neurons), T = 1, 4, 8, 32 s (n = 5 neurons), or T = 2, 4, 8, 16 s (n = 13 neurons). Thus, for T = 1, 2, 4, 8, 16, and 32 s, there were 15, 23, 18, 18, 23, and 15 data points, respectively. For thalamic neurons, the full set of six periods was presented to each cell.
Finding spike times.
Recorded voltages were detrended, i.e., the best-fit linear trend was removed. Spike times were recorded when the potential crossed a threshold that was determined individually for each neuron. This threshold was always greater than the maximum average voltage found from 100 ms windows over the 640 or 768 s block. Time-varying firing rates were found by taking a histogram of spike times.
Fitting sine waves to firing rates.
As in previous work (Lundstrom et al., 2008), the firing rate for each neuron over a single cycle of the input (T) was averaged over trials (for clearer visual presentation in Figs. 1 and 3, average rates were computed across trials over two cycles of the input, 2T). Each cycle or period, T, was discretized into 20 time bins. For each neuron and period length T, the amplitude and phase shift of the response with respect to the stimulus were found by least-squares fitting the zero-mean response to Asin(2πt/T + ϕ), with the two parameters A and ϕ. The gain for each period was found by dividing A by the mean firing rate of the neuron for that period. Neurons with <500 recorded spikes for any presented period were excluded. Data from two additional cortical neurons were excluded because their responses were clearly not stimulus sensitive. Except for these stimulus-insensitive cells, the responses of neurons were fit at all recorded frequencies: if a neuron was used, its fits to envelopes at all frequencies were included, and frequencies were not selectively rejected.
Figure 1.

Cortical neurons respond with sinusoidal firing rates when whisker motion has a slow sine-wave envelope. a, b, Whisker positions with an SD sine-wave envelope of period T = 2 s (a) and T = 8 s (b). Red dashed lines represent position SD (axis at right). Note the different timescales in a and b. c, d, Changes in SD result in spikes as seen in the juxtacellularly recorded potentials. e, f, Firing rates, represented by solid lines, are calculated by binning spikes from all repeats of a given period and have phase leads of 33° and 48°, respectively. Green dashed lines are the absolute velocity envelope, calculated as the smoothed absolute value of the derivative of whisker position (axis at right). The absolute velocity has the same phase as the position SD envelope (compare green lines in e, f and red lines in a, b). Data shown are from a single neuron.
Figure 3.

Thalamic neurons respond with sinusoidal firing rates when whisker motion has a slow sine-wave envelope. a, b, Whisker positions with an SD sine-wave envelope of period of T = 4 s (a) and T = 16 s (b); red dashed lines, position SD (axis at right). c, d, Changes in envelope result in juxtacellularly recorded spikes. e, f, Firing rates are calculated by binning spikes from all repeats of a given period, are represented by solid lines and have phase leads of 14° and 1.4°, respectively. Green dashed lines, Average absolute velocity envelope, calculated as in Figure 1 (axis at right). Data shown are from a single neuron.
Neural modeling.
The neural network consisted of Hodgkin–Huxley (HH) neurons (Hodgkin and Huxley, 1952; Dayan and Abbott, 2001) and synapses that incorporated facilitation and depression (Varela et al., 1997). Two slow adaptation currents were added to the HH neurons as described previously (Lundstrom et al., 2008) with time constants of τ = 0.3 and 6 s and conductances of 0.05 and 0.004 times the leak conductance, respectively. Facilitation and depression variables (F, d, and D) in the synapses relaxed exponentially to one with time constants of 0.1, 1.5, and 12 s for facilitation, fast depression, and slow depression, respectively. For facilitation, each input spike increased F by 0.6, and for depression each input spike decreased d and D to new values of 0.9d and 0.999D, respectively. This is equivalent to calculating the synaptic conductance amplitudes according to the following:
where ti is the ith presynaptic spike time in seconds. The synaptic conductance amplitude, G = FdD, for each neuron was then summed and filtered by an exponential with a time constant of 3 ms. This total synaptic input was introduced to the final HH neuron as an additive current of the form GTotal(V − 0), with GTotal = 0.5G in units of millisiemens per square millimeter.
Fractional differentiation.
In general, if the firing rate r(t) depends linearly on a time-varying input x(t), this can be written in the time (t) or frequency (f) domain as follows:
where the constants k and r0 are the gain and mean firing rate, and the filter h(t) is convolved with the input. In the frequency domain, the convolution becomes multiplication of the Fourier-transformed filter H(f) and input X(f). Fractional differentiation (Podlubny, 1999; Kleinz and Osler, 2000; Oldham and Spanier, 2006) is a generalization of the differentiation operation, dα/dtα, to cases in which the order of differentiation, α, is a non-integer number. In the frequency domain, fractional differentiation of order α corresponds to a filter H(f) given by (i2πf)α. To understand the effect of such a filter, it is helpful to express the (complex) Fourier components in polar notation, X(f) = |X(f)|eiϕf, where |X(f)| is the magnitude of the sinusoidal component at frequency f and ϕf is its phase. Given the identity i = eiπ/2, the fractional differentiation filter in polar form becomes
 |
Then the zero-mean rate response in the frequency domain is
 |
Thus, if a neuron or neural circuit functions as a fractional differentiator, the magnitude of each frequency component of the rate response will be given by that of the input scaled by a gain proportional to (2πf)α, and each rate component will have a frequency-independent phase lead of απ/2 with respect to the stimulus. The order of fractional differentiation α is proportional to the amount of phase advance between input and output. The responses of single cortical neurons are best fit by α ∼0.15 (Lundstrom et al., 2008), which is intermediate between two extremes: α = 0 corresponds to no adaptation and zero phase difference between input and output, whereas α = 1 is first-order differentiation (Yi et al., 2000), which has a phase lead of 90° degrees. For example, when the input x(t) = sin(2πft), then the fractional derivative with order α is dαx(t)/dtα = (2πf)α sin(2πft + (απ)/2). If the signal x(t) is a step function, the resulting response will be a power law decay (discussed by Lundstrom et al., 2008). The order α of fractional differentiation can thus be determined from the gain–frequency relationship and phase leads. In practice, we computed α as a population measure, after averaging phase leads and gains for each T. Specifically, to find α from phase leads, a circular mean from the leads of individual neurons was found for each T; the grand mean across all T was then used to find α. Similarly, to find α from gains, a mean gain was found for each T; plotted as a function of T, the negative slope of the log-log linear fit gave α. Confidence intervals (95%) were found using 10,000 bootstrap data samples (bias corrected and accelerated percentile method) chosen from the distribution of α values as determined for each neuron using gain or phase. Although finding α for each individual neuron led to consistent conclusions at the population level, the extent to which individual neurons could be characterized as fractional differentiators was variable (supplemental data, available at www.jneurosci.org as supplemental material). Rather, our data support using fractional differentiation to describe adaptation at the population level.
Results
We recorded from neurons in the barrel cortex (n = 28) and thalamus (n = 8) of anesthetized rats during movement of the whiskers through a white noise trajectory with a temporally modulated amplitude. Whiskers were moved such that the SD envelope of their position was a sine wave (Fig. 1a,b); this is equivalent to a sinusoidally varying envelope for average whisker speed, a stimulus feature that is often correlated with firing rate in whisker cortical and thalamic neurons (Pinto et al., 2000; Arabzadeh et al., 2003, 2005; Hasenstaub et al., 2007; Petersen et al., 2008; Jadhav et al., 2009) (Fig. 1e,f). Cortical neurons were sensitive to this sine-wave envelope (Fig. 1c,d) and responded with a sinusoidally varying firing rate (Fig. 1e,f). The phase of the firing rate response led that of the stimulus. This phase lead indicates the presence of adaptation, whereas a phase lag would suggest facilitation.
Previous work (Lundstrom et al., 2008) has found that the firing rate adaptation of individual in vitro neocortical neurons can be approximated by the linear operation of fractional differentiation (Podlubny, 1999; Kleinz and Osler, 2000; French and Torkkeli, 2008). A key property of this operation is that the output shows phase leads that are constant across frequency (Lundstrom et al., 2008). We thus examined how the phase of in vivo cortical firing rate responses varied with stimulus period. For T = 4–32 s, mean phase leads were not significantly different (Fig. 2a) (for additional analysis, see supplemental data, available at www.jneurosci.org as supplemental material). The order of fractional differentiation can be determined from phase leads or from fits to the gain of firing rate with increasing period. For cortical neurons, we found good agreement between the order determined using phases [0.49, bootstrap 95% confidence intervals (C.I.) of 0.41–0.60; see Materials and Methods] (Fig. 2a) and that using gains (0.52, 95% C.I. of 0.36–0.67) (Fig. 2c,d).
Figure 2.

Rate adaptation in the barrel cortex is consistent with fractional differentiation for periods T = 4–32 s. a, For T = 4–32 s, response phase leads were constant in neocortical neurons (n = 28; p = 0.99, Watson–Williams circular ANOVA) (Berens, 2009; Zar, 2009), with an average phase lead of 44° (order of fractional differentiation α = 0.49). For each period, the circular mean was calculated, with error bars representing 95% confidence intervals (Zar, 2009). The dashed line represents the grand mean of the circular mean angles for T = 4, 8, 16, and 32 s. b, The distribution of phase leads narrows with increasing average firing rate. c, Neuronal gain (amplitude divided by mean of the sine-wave fit to firing rate curves) decreases with increasing period. d, Assuming a power law dependence of gain on frequency, as predicted for fractional differentiators, the exponent of the power law (or negative slope on a log-log plot) gives the order of fractional differentiation (Lundstrom et al., 2008). Error bars represent SE. Here, the value of α = 0.52 found from gains agrees with that found for phases, α = 0.49.
Our results suggest that the average response from a small population of neurons embedded in intact circuitry and responding to whisker stimuli can be approximated by fractional differentiation; the rate response displayed by individual neurons can be approximated by fractional differentiation to greater or lesser degrees (supplemental data, available at www.jneurosci.org as supplemental material). Although this relationship is only approximate and holds at the population level, it provides us with a single parameter that captures the degree of adaptation, or the amount of phase shift, in the response with respect to the stimulus. We emphasize that these results describe responses from an intact neural circuit as whiskers are stimulated. Thus, adaptation and facilitation of the signal could occur at many sites, in contrast to previous results (Lundstrom et al., 2008) showing fractional differentiation in single in vitro neurons, in which the measured adaptation came from mechanisms related to spike generation.
The phase lead from adaptation seen in these in vivo cortical neurons was three times greater than that of in vitro cortical neurons, in which adaptation was caused by intrinsic mechanisms (Lundstrom et al., 2008). We thus sought to determine how adaptive phase leads change across stages of a sensory pathway in vivo. We examined neurons in the thalamus using similar stimuli to those for cortex (Fig. 3a,b); neurons of the VPM nucleus of the thalamus are two synapses removed from whisker transduction, whereas cortical neurons are at least three synapses away and likely more for our recorded neurons (for review, see Petersen, 2007; Diamond et al., 2008). Compared with in vivo cortical neurons, we found that thalamic neurons had responses with a phase lead that was approximately three times smaller (Fig. 3e,f).
After examining the phase leads of responses as stimulus period varied, we found that, similar to cortical neurons, mean phases were not different for the periods T = 4–32 s (Fig. 4a) (for additional analysis, see supplemental data, available at www.jneurosci.org as supplemental material). Thus, thalamic neurons also behaved as fractional differentiators, although with a smaller order. Computed from phases and using T = 4–32 s, the differentiation order for thalamic neurons was 0.20 (95% C.I. of 0.08–0.37) (Fig. 4a), whereas from gains it was 0.12 (95% C.I. of −0.12 to 0.35) (Fig. 4c,d). The wider confidence intervals of the estimate from gains may have resulted from the comparatively low firing rates of thalamic neurons: gains were obtained by taking a ratio of firing rates (Fig. 4c) and hence were susceptible to noise from small denominators.
Figure 4.

Rate adaptation in the thalamus gives a constant phase that indicates a lower order of differentiation than in the cortex. a, Average response phase leads were constant in thalamic neurons (n = 8; p = 0.95, Watson–Williams circular ANOVA) (Berens, 2009; Zar, 2009), with an overall average phase lead of 18° (order of fractional differentiation α = 0.20). b, The distribution of phase leads narrows with increasing average firing rate. c, Neuronal gain, computed as in Figure 2, decreases with increasing period more weakly than would be expected from the overall average phase. d, Assuming a power law decrease, the negative slope gives α = 0.12. Symbols and error bars are as in Figure 2.
The order of differentiation determined from the mean phase lead of thalamic neurons (0.20) was similar to the 0.15 found previously for in vitro cortical neurons, caused purely by intrinsic neuronal properties (Lundstrom et al., 2008). The measured phase shift, together with the fact that adaptation increases from thalamus to cortex, suggests that the order of differentiation may increase as the neural network incorporates more adaptive components, such as neurons with firing rate adaptation (Higgs et al., 2006; La Camera et al., 2006; Arsiero et al., 2007) and short-term synaptic plasticity (Tsodyks and Markram, 1997; Varela et al., 1997; Puccini et al., 2007). Each stage of adaptation would then contribute to the overall order of differentiation as measured between input and measured output.
To test this hypothesis, we constructed a small neural network comprising 100 neurons connected via 100 synapses to a final, output neuron (Fig. 5a). Using the same experimental stimuli, implemented now as an injected current, we measured the phases and magnitude of the firing rate responses of the output neuron. We added adaptation successively to each component. Neuronal adaptation was implemented using two slow afterhyperpolarization currents tuned to give approximate power law adaptation (Lundstrom et al., 2008). Adapting synapses included facilitation, fast depression, and slower depression (Varela et al., 1997). We found that, as the number of adaptive components increased, the order of fractional differentiation also increased (Fig. 5b,c), leading to similar results in Figure 5b as were experimentally observed in cortex (Fig. 2a). The precise shapes of the curves in Figure 5b depend on tuning of the adaptation and plasticity parameters. For example, increasing synaptic depression increases the overall phase lead, whereas increasing synaptic facilitation decreases it. An intervening synapse with facilitation but no depression can cancel out the adaptation of the two neuronal layers, such that the final phase lead is close to zero (supplemental data, available at www.jneurosci.org as supplemental material).
Figure 5.
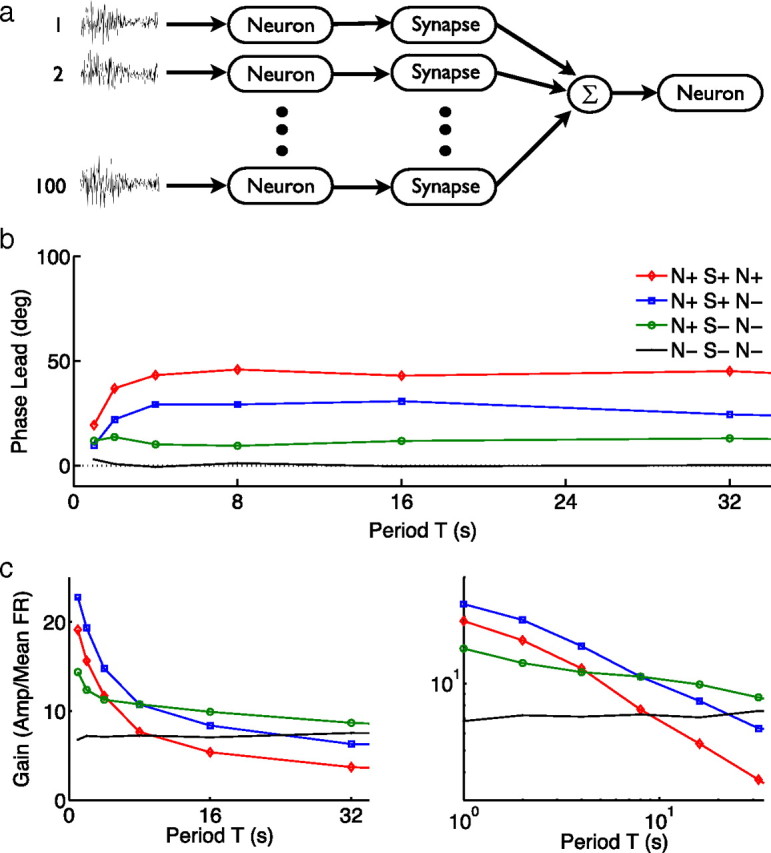
Neural network demonstrates increased order of fractional differentiation. a, Gaussian noise current with sine-wave envelopes was injected into 100 presynaptic HH neurons; the spike trains of these neurons passed through synapses incorporating short-term plasticity (Varela et al., 1997) before summation and injection into an output neuron. b, Phase leads of the output spiking rate were measured for four different networks: no adaptation or short-term plasticity (solid line; N− S− N−), with adapting neurons in the first layer (circles; N+ S− N−), with adapting neurons in the first layer and synapses with short-term plasticity (squares; N+ S+ N−), and with adapting neurons and synapses with short-term plasticity (diamonds; N+ S+ N+). A larger constant phase corresponds to a larger order of fractional differentiation. Mean phase for T = 4–32 s gave orders of α = 0.0, 0.12, 0.32, and 0.49 for the networks in the order listed above. c, Steeper slopes suggest an increased order of fractional differentiation. Best fit lines for T = 4–32 s gave orders of α = –0.02, 0.12, 0.40, and 0.55.
Discussion
Neural systems are endowed with numerous mechanisms implementing different forms of adaptation, at the single neuron, synaptic, and circuit level (Dayan and Abbott, 2001; Wark et al., 2007). In adapting systems, the gain is established by the preceding stimulus sequence and thus responses tend to be larger during an upward change and smaller during a downward change. The net result is an apparent anticipation of the input such that, for a periodic stimulus, the phase of the output precedes that of the input. In contrast, facilitation leads to phase lags.
Here, we studied frequency-dependent phase leads for three reasons: first, to examine how in vivo adaptation, as reflected in the phase leads, affects encoding of slowly varying properties of the stimulus; second, to determine whether the operation of fractional differentiation observed in single neurons recorded in vitro is seen in in vivo circuit-level adaptation; and third, to quantify the degree of adaptation in multiple processing stages. We found that, in the whisker system, firing rate adaptation approximates a linear encoding of the envelope given by fractional differentiation, such that the rate shows an approximately frequency-independent phase lead with respect to the stimulus envelope. This suggests a correspondence between the timescale of adaptation and the timescale of slow changes in the stimulus (Fairhall et al., 2001; Lundstrom et al., 2008; Wark et al., 2009).
Here, we did not distinguish between different cortical and thalamic neuron types. Distinct signals contained in whisker motion, such as whisking versus touch, are likely to be represented by pathways segregated across different thalamic structures and cortical circuits (for review, see Diamond et al., 2008). However, these distinctions are likely to be relevant to components of whisker motion with frequencies in the whisking range and above, far higher than those of the slow envelope information addressed here (1/T < 1 Hz). Furthermore, in the anesthetized animal, we are unable to address coding differences that arise from behaviorally distinct inputs. Here, therefore, we considered responses from all neurons that were clearly sensitive to whisker movement, grouping all cortical and all thalamic responses separately. We focused on possible shared coding strategies of cortical or thalamic neurons and on overall differences between cortical and thalamic neurons.
We found that, as a population, the rate adaptation of both thalamic and cortical neurons can be succinctly described as an encoding of the stimulus envelope through the operation of fractional differentiation, giving constant phase advances for a wide range of input frequencies. The fractional differentiation paradigm provides a single quantity, the order of differentiation α, which effectively characterizes the degree of adaptation and provides a means to compare adaptation to complex stimuli across multiple processing levels. Neuronal firing rates in the whisker system adapt at the receptor, thalamic, and cortical levels (Ahissar et al., 2001; Sosnik et al., 2001; Castro-Alamancos, 2004b; Petersen et al., 2009). Consistent with this previous work, we found that thalamic neurons adapted less than cortical neurons, with a fractional order of differentiation of ∼0.18 versus 0.50. It is likely that grouping neurons, e.g., by cell type or thalamic location, would reduce the variability observed in the cell population.
The adaptation we measured in cortical neurons is likely attributable to a combination of intrinsic mechanisms (Díaz-Quesada and Maravall, 2008; Lundstrom et al., 2008) and thalamocortical and intracortical synaptic depression (Katz et al., 2006). The reduction in cortical firing rate in response to repetitive whisker deflections at a given frequency is in part attributable to depression at thalamocortical synapses (Castro-Alamancos and Oldford, 2002; Chung et al., 2002; Khatri et al., 2004; Petersen et al., 2009). In the awake active animal, however, thalamocortical synapses are already essentially depressed, a condition not captured in our anesthetized preparation (Fanselow and Nicolelis, 1999; Castro-Alamancos, 2004a). Although barrel cortical neurons receive inputs from both excitatory and inhibitory synapses in an intracortical feedback circuit (Petersen, 2007; Diamond et al., 2008; Fox, 2008), we used a simple feedforward network model to test whether fractional differentiation persists or accumulates across neuronal stages. We found that synaptic depression and intrinsic membrane properties can augment the order of differentiation.
Biophysically, the presence of multiple-timescale adaptation suggests the presence of multiple weighted adaptation mechanisms covering many timescales, perhaps balanced to maintain signal strength despite requirements for conveying information about stimulus change. In our network model, intrinsic adaptation time constants and conductance gain parameters for the neurons were hand-tuned as described previously (Lundstrom et al., 2008) to yield approximate fractional order dynamics. Parameters of short-term synaptic plasticity were also tuned: starting from an established model (Varela et al., 1997), time constants and gains for the two depression timescales were adjusted so that the overall network with adapting neuron gave a phase response similar to cortical data (Fig. 2a). The resulting parameters differ from those previously measured (Varela et al., 1997) primarily in that the amount of depression is less: although in that study, fast depression after each action potential decreased the relative response amplitude to ∼0.4 (τ = 0.4–0.6 s) and slow depression to 0.975 (τ = ∼9 s), here fast and slow depression decreased amplitudes to 0.9 (τ = 1.5 s) and 0.999 (τ = 12 s), respectively. The precise value of synaptic adaptation parameters depends on the number of input neurons, in this case 100. Furthermore, increasing the amount of adaptation (or facilitation) at the synapse in general gives rise to an overall greater phase lead (or lag).
Neuronal spike trains encode stimulus information on multiple timescales. In previous work, we have shown that rapid fluctuations in whisker position are represented in cortex in normalized units: after a change in the overall scale of the signal, the relationship between the stimulus and the probability of a spike adapts such that its dynamic range spans the new stimulus range (Maravall et al., 2007). This effect, seen during passive stimulation, may underlie the coding of whisker position by the phase in the whisk cycle, rather than absolute position, observed in awake, behaving animals (Curtis and Kleinfeld, 2009). As has been noted previously (Fairhall et al., 2001), coding using such a normalized scheme raises the issue of ambiguity: how and where is the information about the whisk offset and overall amplitude, required to locate an object in space, represented? In awake, head-fixed animals, Fee et al. (1997) found that, along with locked responses to whisking, the firing rate of cortical barrel neurons is indeed weakly modulated by the overall whisking envelope. Our present results further show that modulations in thalamic and cortical firing rates encode the slowly varying envelope, with a long history dependence resulting in phase leads of up to seconds. Cortical neurons combine representation of the stimulus envelope with full rescaling, or normalization, of instantaneous spiking probability (Maravall et al., 2007); conversely, the extent to which thalamic neurons normalize their firing probability is variable (A. Alenda, R. Petersen, M. Bale, and M. Maravall, unpublished data). Separation of adaptive timescales allowing encoding of distinct signal components on multiple timescales may be a general property of sensory systems (Fairhall et al., 2001; Baccus and Meister, 2002; Ulanovsky et al., 2004; Wark et al., 2007; Kayser et al., 2009).
Footnotes
This work was supported by the following: International Human Frontier Science Program Organization short-term fellowship (B.N.L.); Spanish Ministry of Science and Innovation Grant BFU2008-03017/BFI (M.M.), cofunded by the European Regional Development Fund; CONSOLIDER Grant CSD2007-00023; European Commission Coordination Action ENINET, Contract LSHM-CT-2005-19063; and a McKnight Scholar Award in the Neurosciences (A.L.F.). We thank Albert Compte, Matthew Higgs, David Kleinfeld, Rasmus Petersen, and William Spain for helpful discussions. All authors designed the study and revised the paper. B.N.L. and M.M. designed the experiments. B.N.L. performed the experiments and simulations, analyzed the data, and wrote the initial draft.
References
- Adrian ED, Zotterman Y. The impulses produced by sensory nerve endings. Part 2. The response of a single end-organ. J Physiol. 1926;61:151–171. doi: 10.1113/jphysiol.1926.sp002281. [DOI] [PMC free article] [PubMed] [Google Scholar]
- Ahissar E, Sosnik R, Haidarliu S. Transformation from temporal to rate coding in a somatosensory thalamocortical pathway. Nature. 2000;406:302–306. doi: 10.1038/35018568. [DOI] [PubMed] [Google Scholar]
- Ahissar E, Sosnik R, Bagdasarian K, Haidarliu S. Temporal frequency of whisker movement. II. Laminar organization of cortical representations. J Neurophysiol. 2001;86:354–367. doi: 10.1152/jn.2001.86.1.354. [DOI] [PubMed] [Google Scholar]
- Arabzadeh E, Petersen RS, Diamond ME. Encoding of whisker vibration by rat barrel cortex neurons: implications for texture discrimination. J Neurosci. 2003;23:9146–9154. doi: 10.1523/JNEUROSCI.23-27-09146.2003. [DOI] [PMC free article] [PubMed] [Google Scholar]
- Arabzadeh E, Zorzin E, Diamond ME. Neuronal encoding of texture in the whisker sensory pathway. PLoS Biol. 2005;3:e17. doi: 10.1371/journal.pbio.0030017. [DOI] [PMC free article] [PubMed] [Google Scholar]
- Arsiero M, Lüscher HR, Lundstrom BN, Giugliano M. The impact of input fluctuations on the frequency–current relationships of layer 5 pyramidal neurons in the rat medial prefrontal cortex. J Neurosci. 2007;27:3274–3284. doi: 10.1523/JNEUROSCI.4937-06.2007. [DOI] [PMC free article] [PubMed] [Google Scholar]
- Atick JJ. Could information theory provide an ecological theory of sensory processing? Network. 1992;3:213–251. doi: 10.3109/0954898X.2011.638888. [DOI] [PubMed] [Google Scholar]
- Baccus SA, Meister M. Fast and slow contrast adaptation in retinal circuitry. Neuron. 2002;36:909–919. doi: 10.1016/s0896-6273(02)01050-4. [DOI] [PubMed] [Google Scholar]
- Bair W. Spike timing in the mammalian visual system. Curr Opin Neurobiol. 1999;9:447–453. doi: 10.1016/S0959-4388(99)80067-1. [DOI] [PubMed] [Google Scholar]
- Barlow HB. Possible principles underlying the transformation of sensory messages. In: Rosenblith W, editor. Sensory communication. Cambridge, MA: Massachusetts Institute of Technology; 1961. [Google Scholar]
- Benda J, Herz AV. A universal model for spike-frequency adaptation. Neural Comput. 2003;15:2523–2564. doi: 10.1162/089976603322385063. [DOI] [PubMed] [Google Scholar]
- Berens P. CircStat: a MATLAB toolbox for circular statistics. J Stat Soft. 2009;31:1–21. [Google Scholar]
- Berg RW, Kleinfeld D. Rhythmic whisking by rat: retraction as well as protraction of the vibrissae is under active muscular control. J Neurophysiol. 2003;89:104–117. doi: 10.1152/jn.00600.2002. [DOI] [PubMed] [Google Scholar]
- Bialek W, Rieke F, de Ruyter van Steveninck RR, Warland D. Reading a neural code. Science. 1991;252:1854–1857. doi: 10.1126/science.2063199. [DOI] [PubMed] [Google Scholar]
- Bryant HL, Segundo JP. Spike initiation by transmembrane current: a white-noise analysis. J Physiol. 1976;260:279–314. doi: 10.1113/jphysiol.1976.sp011516. [DOI] [PMC free article] [PubMed] [Google Scholar]
- Carvell GE, Simons DJ. Task- and subject-related differences in sensorimotor behavior during active touch. Somatosens Mot Res. 1995;12:1–9. doi: 10.3109/08990229509063138. [DOI] [PubMed] [Google Scholar]
- Castro-Alamancos MA. Absence of rapid sensory adaptation in neocortex during information processing states. Neuron. 2004a;41:455–464. doi: 10.1016/s0896-6273(03)00853-5. [DOI] [PubMed] [Google Scholar]
- Castro-Alamancos MA. Dynamics of sensory thalamocortical synaptic networks during information processing states. Prog Neurobiol. 2004b;74:213–247. doi: 10.1016/j.pneurobio.2004.09.002. [DOI] [PubMed] [Google Scholar]
- Castro-Alamancos MA, Oldford E. Cortical sensory suppression during arousal is due to the activity-dependent depression of thalamocortical synapses. J Physiol. 2002;541:319–331. doi: 10.1113/jphysiol.2002.016857. [DOI] [PMC free article] [PubMed] [Google Scholar]
- Chung S, Li X, Nelson SB. Short-term depression at thalamocortical synapses contributes to rapid adaptation of cortical sensory responses in vivo. Neuron. 2002;34:437–446. doi: 10.1016/s0896-6273(02)00659-1. [DOI] [PubMed] [Google Scholar]
- Curtis JC, Kleinfeld D. Phase-to-rate transformations encode touch in cortical neurons of a scanning sensorimotor system. Nat Neurosci. 2009;12:492–501. doi: 10.1038/nn.2283. [DOI] [PMC free article] [PubMed] [Google Scholar]
- Dayan P, Abbott LF. Cambridge, MA: Massachusetts Institute of Technology; 2001. Theoretical neuroscience: computational and mathematical modeling of neural systems. [Google Scholar]
- Diamond ME, von Heimendahl M, Knutsen PM, Kleinfeld D, Ahissar E. “Where” and “what” in the whisker sensorimotor system. Nat Rev Neurosci. 2008;9:601–612. doi: 10.1038/nrn2411. [DOI] [PubMed] [Google Scholar]
- Díaz-Quesada M, Maravall M. Intrinsic mechanisms for adaptive gain rescaling in barrel cortex. J Neurosci. 2008;28:696–710. doi: 10.1523/JNEUROSCI.4931-07.2008. [DOI] [PMC free article] [PubMed] [Google Scholar]
- Drew PJ, Abbott LF. Models and properties of power-law adaptation in neural systems. J Neurophysiol. 2006;96:826–833. doi: 10.1152/jn.00134.2006. [DOI] [PubMed] [Google Scholar]
- Fairhall AL, Lewen GD, Bialek W, de Ruyter Van Steveninck RR. Efficiency and ambiguity in an adaptive neural code. Nature. 2001;412:787–792. doi: 10.1038/35090500. [DOI] [PubMed] [Google Scholar]
- Fanselow EE, Nicolelis MA. Behavioral modulation of tactile responses in the rat somatosensory system. J Neurosci. 1999;19:7603–7616. doi: 10.1523/JNEUROSCI.19-17-07603.1999. [DOI] [PMC free article] [PubMed] [Google Scholar]
- Fee MS, Mitra PP, Kleinfeld D. Central versus peripheral determinants of patterned spike activity in rat vibrissa cortex during whisking. J Neurophysiol. 1997;78:1144–1149. doi: 10.1152/jn.1997.78.2.1144. [DOI] [PubMed] [Google Scholar]
- Fox K. Barrel cortex. Cambridge, UK: Cambridge UP; 2008. [Google Scholar]
- French AS, Torkkeli PH. The power law of sensory adaptation: simulation by a model of excitability in spider mechanoreceptor neurons. Ann Biomed Eng. 2008;36:153–161. doi: 10.1007/s10439-007-9392-9. [DOI] [PubMed] [Google Scholar]
- Gerstner W, Kistler WM. Spiking neuron models: single neurons, populations, plasticity. Cambridge, UK: Cambridge UP; 2002. [Google Scholar]
- Hasenstaub A, Sachdev RN, McCormick DA. State changes rapidly modulate cortical neuronal responsiveness. J Neurosci. 2007;27:9607–9622. doi: 10.1523/JNEUROSCI.2184-07.2007. [DOI] [PMC free article] [PubMed] [Google Scholar]
- Higgs MH, Slee SJ, Spain WJ. Diversity of gain modulation by noise in neocortical neurons: regulation by the slow afterhyperpolarization conductance. J Neurosci. 2006;26:8787–8799. doi: 10.1523/JNEUROSCI.1792-06.2006. [DOI] [PMC free article] [PubMed] [Google Scholar]
- Hodgkin AL, Huxley AF. A quantitative description of membrane current and its application to conduction and excitation in nerve. J Physiol. 1952;117:500–544. doi: 10.1113/jphysiol.1952.sp004764. [DOI] [PMC free article] [PubMed] [Google Scholar]
- Jadhav SP, Wolfe J, Feldman DE. Sparse temporal coding of elementary tactile features during active whisker sensation. Nat Neurosci. 2009;12:792–800. doi: 10.1038/nn.2328. [DOI] [PubMed] [Google Scholar]
- Katz Y, Heiss JE, Lampl I. Cross-whisker adaptation of neurons in the rat barrel cortex. J Neurosci. 2006;26:13363–13372. doi: 10.1523/JNEUROSCI.4056-06.2006. [DOI] [PMC free article] [PubMed] [Google Scholar]
- Kayser C, Montemurro MA, Logothetis NK, Panzeri S. Spike-phase coding boosts and stabilizes information carried by spatial and temporal spike patterns. Neuron. 2009;61:597–608. doi: 10.1016/j.neuron.2009.01.008. [DOI] [PubMed] [Google Scholar]
- Khatri V, Hartings JA, Simons DJ. Adaptation in thalamic barreloid and cortical barrel neurons to periodic whisker deflections varying in frequency and velocity. J Neurophysiol. 2004;92:3244–3254. doi: 10.1152/jn.00257.2004. [DOI] [PubMed] [Google Scholar]
- Kleinz M, Osler TJ. A child's garden of fractional derivatives. Coll Math J. 2000;31:82–88. [Google Scholar]
- Koch C. Biophysics of computation: information processing in single neurons. New York: Oxford UP; 1999. [Google Scholar]
- La Camera G, Rauch A, Thurbon D, Lüscher HR, Senn W, Fusi S. Multiple time scales of temporal response in pyramidal and fast spiking cortical neurons. J Neurophysiol. 2006;96:3448–3464. doi: 10.1152/jn.00453.2006. [DOI] [PubMed] [Google Scholar]
- Lundstrom BN, Higgs MH, Spain WJ, Fairhall AL. Fractional differentiation by neocortical pyramidal neurons. Nat Neurosci. 2008;11:1335–1342. doi: 10.1038/nn.2212. [DOI] [PMC free article] [PubMed] [Google Scholar]
- Mainen ZF, Sejnowski TJ. Reliability of spike timing in neocortical neurons. Science. 1995;268:1503–1506. doi: 10.1126/science.7770778. [DOI] [PubMed] [Google Scholar]
- Manns ID, Sakmann B, Brecht M. Sub- and suprathreshold receptive field properties of pyramidal neurones in layers 5A and 5B of rat somatosensory barrel cortex. J Physiol. 2004;556:601–622. doi: 10.1113/jphysiol.2003.053132. [DOI] [PMC free article] [PubMed] [Google Scholar]
- Maravall M, Petersen RS, Fairhall AL, Arabzadeh E, Diamond ME. Shifts in coding properties and maintenance of information transmission during adaptation in barrel cortex. PLoS Biol. 2007;5:e19. doi: 10.1371/journal.pbio.0050019. [DOI] [PMC free article] [PubMed] [Google Scholar]
- Oldham KB, Spanier J. Mineola, NY: Dover Publications; 2006. The fractional calculus: theory and applications of differentiation and integration to arbitrary order. [Google Scholar]
- Petersen CC. The functional organization of the barrel cortex. Neuron. 2007;56:339–355. doi: 10.1016/j.neuron.2007.09.017. [DOI] [PubMed] [Google Scholar]
- Petersen RS, Brambilla M, Bale MR, Alenda A, Panzeri S, Montemurro MA, Maravall M. Diverse and temporally precise kinetic feature selectivity in the VPm thalamic nucleus. Neuron. 2008;60:890–903. doi: 10.1016/j.neuron.2008.09.041. [DOI] [PubMed] [Google Scholar]
- Petersen RS, Panzeri S, Maravall M. Neural coding and contextual influences in the whisker system. Biol Cybern. 2009;100:427–446. doi: 10.1007/s00422-008-0290-5. [DOI] [PubMed] [Google Scholar]
- Pinto DJ, Brumberg JC, Simons DJ. Circuit dynamics and coding strategies in rodent somatosensory cortex. J Neurophysiol. 2000;83:1158–1166. doi: 10.1152/jn.2000.83.3.1158. [DOI] [PubMed] [Google Scholar]
- Podlubny I. San Diego: Academic; 1999. Fractional differential equations: an introduction to fractional derivatives, fractional differential equations, to methods of their solution and some of their applications. [Google Scholar]
- Puccini GD, Sanchez-Vives MV, Compte A. Integrated mechanisms of anticipation and rate-of-change computations in cortical circuits. PLoS Comput Biol. 2007;3:e82. doi: 10.1371/journal.pcbi.0030082. [DOI] [PMC free article] [PubMed] [Google Scholar]
- Sosnik R, Haidarliu S, Ahissar E. Temporal frequency of whisker movement. I. Representations in brain stem and thalamus. J Neurophysiol. 2001;86:339–353. doi: 10.1152/jn.2001.86.1.339. [DOI] [PubMed] [Google Scholar]
- Tiesinga P, Fellous JM, Sejnowski TJ. Regulation of spike timing in visual cortical circuits. Nat Rev Neurosci. 2008;9:97–107. doi: 10.1038/nrn2315. [DOI] [PMC free article] [PubMed] [Google Scholar]
- Tsodyks MV, Markram H. The neural code between neocortical pyramidal neurons depends on neurotransmitter release probability. Proc Natl Acad Sci U S A. 1997;94:719–723. doi: 10.1073/pnas.94.2.719. [DOI] [PMC free article] [PubMed] [Google Scholar]
- Ulanovsky N, Las L, Farkas D, Nelken I. Multiple time scales of adaptation in auditory cortex neurons. J Neurosci. 2004;24:10440–10453. doi: 10.1523/JNEUROSCI.1905-04.2004. [DOI] [PMC free article] [PubMed] [Google Scholar]
- Varela JA, Sen K, Gibson J, Fost J, Abbott LF, Nelson SB. A quantitative description of short-term plasticity at excitatory synapses in layer 2/3 of rat primary visual cortex. J Neurosci. 1997;17:7926–7940. doi: 10.1523/JNEUROSCI.17-20-07926.1997. [DOI] [PMC free article] [PubMed] [Google Scholar]
- Voigt BC, Brecht M, Houweling AR. Behavioral detectability of single-cell stimulation in the ventral posterior medial nucleus of the thalamus. J Neurosci. 2008;28:12362–12367. doi: 10.1523/JNEUROSCI.3046-08.2008. [DOI] [PMC free article] [PubMed] [Google Scholar]
- Wark B, Lundstrom BN, Fairhall A. Sensory adaptation. Curr Opin Neurobiol. 2007;17:423–429. doi: 10.1016/j.conb.2007.07.001. [DOI] [PMC free article] [PubMed] [Google Scholar]
- Wark B, Fairhall A, Rieke F. Timescales of inference in visual adaptation. Neuron. 2009;61:750–761. doi: 10.1016/j.neuron.2009.01.019. [DOI] [PMC free article] [PubMed] [Google Scholar]
- Yi TM, Huang Y, Simon MI, Doyle J. Robust perfect adaptation in bacterial chemotaxis through integral feedback control. Proc Natl Acad Sci U S A. 2000;97:4649–4653. doi: 10.1073/pnas.97.9.4649. [DOI] [PMC free article] [PubMed] [Google Scholar]
- Zar JH. Biostatistical analysis. Ed 5. Upper Saddle River, NJ: Pearson Education; 2009. [Google Scholar]