

Abstract
Accumulation of toxic amyloid-β (Aβ) in the cerebral cortex and hippocampus is a major pathological feature of Alzheimer's disease (AD). The neurotrophin receptor p75NTR has been proposed to mediate Aβ-induced neurotoxicity; however, its role in the development of AD remains to be clarified. The p75NTR/ExonIII−/− mice and APPSwe/PS1dE9 mice were crossed to generate transgenic AD mice with deletion of p75NTR gene. In APPSwe/PS1dE9 transgenic mice, p75NTR expression was localized in the basal forebrain neurons and degenerative neurites in neocortex, increased with aging, and further activated by Aβ accumulation. Deletion of the p75NTR gene in APPSwe/PS1dE9 mice reduced soluble Aβ levels in the brain and serum, but increased the accumulation of insoluble Aβ and Aβ plaque formation. There was no change in the levels of amyloid precursor protein (APP) and its proteolytic derivatives, or α-, β-, and γ-secretase activities, or in levels of BACE1, neprilysin (NEP), and insulin-degrading enzyme (IDE) proteins. Aβ production by cortical neurons of APPSwe/PS1dE9 mice was reduced by deletion of p75NTR gene in vitro. Recombinant extracellular domain of p75NTR attenuated the oligomerization and fibrillation of synthetic Aβ42 peptide in vitro, and reduced local Aβ plaques after hippocampus injection in vivo. In addition, deletion of p75NTR attenuated microgliosis but increased the microhemorrhage profiles in the brain. The deletion of p75NTR did not significantly change the cognitive function of the mice up to the age of 9 months. Our data suggest that p75NTR plays a critical role in regulating Aβ levels by both increasing Aβ production and attenuating its aggregation, and they caution that a therapeutic intervention simply reducing p75NTR may exacerbate AD pathology.
Introduction
Alzheimer's disease (AD) is a neurodegenerative disorder characterized by accumulation of amyloidogenic plaques and neurofibrillary tangles in the brain, loss of cholinergic neurons, and a progressive loss of cognitive functions. Soluble Aβ peptide plays a central role in the neurotoxicity and the development of AD (Ma et al., 2006; Lacor et al., 2007). The oligomers are the most toxic species of Aβ, causing neuronal death, neuritic degeneration, and dysfunction in synaptic transmission in AD (Lambert et al., 1998; Hardy and Selkoe, 2002; Malaplate-Armand et al., 2006; Lacor et al., 2007). The level of Aβ in the brain is maintained by the dynamic balance of its production and clearance (Hardy and Selkoe, 2002; Wang et al., 2006a). Understanding the pathways involving Aβ production and clearance will allow developing therapies to hold the progression of the disease.
Neurotrophin signaling pathways are known to affect production of Aβ and development of AD (Capsoni et al., 2000, 2002). Transgenic animals expressing the antibody against nerve growth factor (NGF) develop AD-associated pathology that can be alleviated by the delivery of NGF (Capsoni et al., 2002). NGF signaling via TrkA reduces Aβ production, whereas it facilitates Aβ production via the p75 neurotrophin receptor (p75NTR) (Costantini et al., 2005a, 2006). p75NTR is highly expressed in cholinergic neurons in the basal forebrain that are most vulnerable in AD. Overexpression or delivery of NGF in primates and human can ameliorate the degeneration of cholinergic neurons (Koliatsos et al., 1991; Tuszynski et al., 1996, 1998). However, the significance of p75NTR in AD pathogenesis is not clear, and conflicting data have been reported. Recent studies suggest that binding of Aβ to p75NTR mediates neuronal death in vitro and in vivo (Kuner et al., 1998; Costantini et al., 2005b; Sotthibundhu et al., 2008) and neuritic degeneration in AD mice (Knowles et al., 2009). However, the activation of p75NTR by Aβ has also been shown to promote survival of human neurons (Zhang et al., 2003).
p75NTR is a type I receptor membrane protein, which is proteolytically processed by α-secretase-like and γ-secretase-mediated cleavages similar to the processing of amyloid precursor protein (APP) (Jung et al., 2003; Gowrishankar et al., 2004; Zampieri et al., 2005). Presenilin 1 M146V mutation increases γ-secretase cutting of p75NTR (Hatchett et al., 2007). Further processing of the C-terminal fragment by γ-secretase releases the p75-ICD cytosolic fragment that mediates death signaling (Jung et al., 2003; Bronfman, 2007). APP directly interacts with p75NTR, which mediates neuronal death of basal forebrain neurons (Fombonne et al., 2009).
The complexity of signals mediated by p75NTR raises the question of the functional roles of p75NTR in the development of AD in vivo (Coulson, 2006). Although p75NTR plays a critical role in the death of neurons mediated by Aβ and proneurotrophins, the role of p75NTR in Aβ metabolism in AD has not been explored so far in vivo. In the present study, we used a genetic approach to examine the roles of p75NTR in regard to Aβ burden and AD-like pathology. We found that p75NTR plays different roles in Aβ metabolism.
Materials and Methods
Generation of APPSwe/PS1dE9 transgenic mice with deletion of p75NTR gene
p75NTR knock-out mice (p75NTR/ExonIII−/− mice) and APPSwe/PS1dE9 transgenic mice were obtained from The Jackson Laboratory. p75NTR/ExonIII−/− mice were constructed on a 129/Sv and have a targeted deletion of exon III of the p75NTR locus (Lee et al., 1992). These mice produce a shorter isoform of p75NTR lacking the extracellular domain of the receptor responsible for neurotrophin binding (von Schack et al., 2001). APPSwe/PS1dE9 transgenic mice were on a C57BL/6 background, and bear a chimeric mouse/human (Mo/Hu) APP695 with mutations linked to familial AD (KM 593/594 NL) and human PS1 carrying the exon-9-deleted variant associated with familial AD (PS1dE9) in one locus under control of prion promoter element (Jankowsky et al., 2001). APPSwe/PS1dE9 transgenic mice were APPSwe/PS1dE9+/− and begin to develop senile plaques in the cerebral cortex and hippocampus at 3–4 months of age.
APPSwe/PS1dE9 and p75NTR/ExonIII−/− mice were crossed to generate APPSwe/PS1dE9/p75NTR+/− (APP+/−p75+/−) mice. APP+/− p75+/− mice were backcrossed with the p75NTR/ExonIII−/− mice for 10 generations to produce APP+/−p75−/− mice with nearly pure 129/Sv background. An APP+/−p75−/− mouse was crossed with a 129/Sv mouse to obtain a male APP+/−p75+/− mouse, which was next crossed with female 129/Sv mice and p75NTR knock-out mice to breed six kinds of genotypes, including APP+/−p75−/−, APP+/−p75+/−, APP+/−p75+/+, APP−/−p75+/+, APP−/−p75+/−, and APP−/− p75−/−. Mice were maintained on ad libitum food and water with a 12 h light/dark cycle. Mice were subjected to experiments at 3, 6, and 9 months of age (n = 10–12 in each group, half male and half female). All animal cross-breeding and husbandry procedures performed were approved by the Flinders University Animal Welfare Committee and Flinders University Biosafety Committee.
Behavioral test
This task represents a classic version of the Morris water maze task and was conducted following the protocols reported previously with minor modification (Yau et al., 2007; Wang et al., 2010b). In brief, the test was conducted in a pool (diameter 200 cm) that was filled with opaque water containing white nontoxic dye (24 ± 2°C) and surrounded by a set of spatial cues (Markowska et al., 1993). The tank was imaginarily divided into four quadrants, and four start positions were located at the intersections of the quadrants (Frick and Fernandez, 2003). The test consisted of platform trials in 4 consecutive days, followed by a probe trial. From the first day to the fourth day, the daily session consisted of four platform trials during which a round platform (diameter 8 cm) was submerged 1 cm under water surface in a quadrant. The mouse explored in the pool and escaped on the platform. If the mouse failed to locate the platform in 120 s, it was directed to the platform. Once the mouse escaped on the platform, it remained on the platform for 10 s. Twenty-four hours after the last platform trial, all mice were given a single probe trial, in which the platform was withdrawn, to assess the final strength of memory traces. Performance in all tasks was recorded and analyzed by a computer-based video tracking system and image analyzing software (ANY-maze, Stoelting). In platform trials, distance (path from the start location to the platform, in centimeters), latency (the time taken to reach the platform from the start location, in seconds), and swim speed (average speed during a trial, in centimeters per second) were measured, while in probe trials quadrant time (percentages of time spent in the platform quadrant) and platform crossings (the number of times that the mice crossed the exact location of the platform) were measured. For latency and swim distance in platform trials, lower numbers indicate better performance. For quadrant time and platform crossings in probe trials, higher numbers indicate better performance (more time spent in the correct quadrant and more crossings over the platform location) (Frick and Fernandez, 2003).
Tissue sampling
Animals were killed by overdosing with pentobarbital (0.08 g/kg). Blood was sampled from the right atrium of the heart, followed by intracardial perfusion with 100 ml of 0.1% NaNO2 in phosphate buffer. Brains were sampled and weighed on a digital electronic balance with a readability of 1 mg (BX-420H, Shimadzu Scientific Instruments). Left brain hemisphere for histological analysis was fixed in 4% paraformaldehyde, pH 7.4, for 24 h and incubated for 24 h in 30% sucrose for subsequent cryoprotection. Coronal sections of the brain were cut at 35 μm thickness with a cryosectioning microtome and stored at 4°C in PBS containing 0.1% sodium azide until use. Right brain hemisphere was snap frozen in liquid nitrogen and stored at −80°C for future biochemical analysis.
AD-type pathology and quantitative image analysis
To examine the expression of p75NTR in the brain, brain sections of 9-month-old APPSwe/PS1dE9 mice were stained using rabbit polyclonal anti-human p75NTR antibody (Ab 9650, a gift from Dr. M. Chao, Skirball Institute, New York University, New York, NY) (Huber and Chao, 1995) following the free-floating immunohistochemistry protocol as described previously (Wang et al., 2009a). Immunofluorescence was used to examine the colocalization between p75NTR-positive fibers and amyloid plaques, with Ab 9650 for p75NTR, antibody N52 (Sigma-Aldrich) for neurofilament 200 (NF200), and thioflavine S for fibrillar plaque. Sections were observed with confocal fluorescence microscope (Radiance 2000MP, Bio-Rad).
The staining for brain total Aβ, microgliosis, astrogliosis, and microhemorrhage was processed as described previously (Wang et al., 2009a). Briefly, a series of five equally spaced tissue sections (∼1.3 mm apart) spanning the entire brain were randomly selected and stained using free-floating immunohistochemistry for total Aβ (Biotin-conjugated mouse anti-Aβ antibody 6E10, Serotec; 1:1000 dilution), activated microglia (rat monoclonal anti-CD45, Millipore Bioscience Research Reagents; 1:2000 dilution), and astrocyte (rabbit polyclonal anti-glial fibrillary acidic protein, Dako, Denmark; 1:1000 dilution), respectively. Sections were incubated overnight with primary antibodies at 4°C and further developed with biotinylated secondary antibodies and the ABC kit (Vector Laboratories) using diaminobenzidine and glucose oxidase as substrates.
For the compact Aβ plaque staining, a series of sections was mounted and stained with Congo red. In brief, the sections were treated with working sodium chloride solution (containing sodium chloride saturated in 80% alcohol and 0.01% sodium hydroxide) at room temperature for 20 min, then placed directly into working Congo red solution (containing saturated Congo red in working sodium chloride solution) for 1 h, and dehydrated rapidly in absolute alcohol.
Images were collected at 4× magnification using constant bulb temperature and exposure, with all images acquired in the same session. The area of neocortex and hippocampus was selected for automatic quantification by ImageJ of Aβ, microglia, astrocyte immunostaining, and Congo red-positive Aβ plaque, yielding the area fraction of the total positive staining against the area of tissue analyzed. The average of the individual measurements was used to calculate group means and SEs.
Microhemorrhage staining and quantification were performed following the method described before (Wang et al., 2009b). In brief, a series of five sections were mounted on the slides and stained for hemosiderin using 2% potassium ferrocyanide in 2% hydrochloric acid for 15 min, followed by a counterstain in a 1% Neutral Red solution for 10 min at room temperature. Microhemorrhage events in the form of the number of Prussian blue-positive profiles were counted in the brains of each mouse on all sections under microscope, and the average number of hemosiderin deposits was calculated per each brain hemisphere.
All image analyses were processed in a blind manner.
Quantification of Aβ peptide levels by ELISA
ELISA analysis of the brain Aβ was processed as described previously (Wang et al., 2009a). Briefly, frozen brain was homogenized and sonicated in TBS containing protease inhibitors (Boehringer Mannheim). Homogenates were centrifuged at 100,000 × g for 1 h at 4°C, and the resultant supernatant was collected, representing the TBS-soluble fraction (Aβ-TBS). The resultant pellet was suspended and sonicated in water containing 2% SDS and protease inhibitors. The SDS solubilized homogenates were centrifuged at 100,000 × g for 1 h at 4°C, and the resultant supernatant was collected, representing the SDS-soluble fraction (Aβ-SDS). The resultant pellet was then extracted in 70% formic acid (FA) and centrifuged, and the resultant supernatant was collected, representing the SDS-insoluble fraction (Aβ-FA). Before ELISA assay, formic acid extracts were neutralized by 1:20 dilution into 1 m Tris phosphate buffer, pH 11, and then diluted in sample buffer. Concentrations of Aβ40 and of Aβ42 in brain extract and serum were quantitatively measured by ELISA according to the manufacturer's instructions (Covance). Using the wet weight of brain tissue in the original homogenate, the final values of brain Aβ were expressed as picomoles per gram wet weight of brain.
APP proteolytic processing and α-, β-, and γ-secretase activities
APP derivatives were analyzed by Western blot analyses as performed according to our procedures described previously (George et al., 2004). Briefly, brain proteins (20 μg) from brain homogenates (SDS fraction) were boiled in Laemmli sample buffer containing 8% β-mercaptoethanol, loaded onto 4–12% Bis-Tris gradient gels (Invitrogen), and electrophoresed. Separated proteins were transferred from the gels onto pure nitrocellulose (Bio-Rad), and the membranes were boiled in PBS for 5 min. Membranes were then blocked in casein-blocking buffer [0.5% (w/v) in PBS]. The blots were probed with the following antibodies: WO2 (1:2000, mouse monoclonal directed to residues 5–8 of Aβ that recognizes APPfl, APPα, and CTFα) (Ida et al., 1996), 369 (1:2000, rabbit polyclonal directed to C-terminal region of APP that recognizes APPfl, CTFα, and CTFβ) (Buxbaum et al., 1990), and anti-APPβ antibody (1:2000, Signet). After incubation with the primary antibody and then the secondary HRP-conjugated antibody, the blots were developed using an enhanced chemiluminescence (ECL) kit (Lumigen TMA-6, GE Healthcare-Pharmacia Biotech) as per the manufacturer's instructions. The GeneGnome chemiluminescence imager (Syngene) was used to capture the signals and quantitation was performed using GeneTools analysis software (Syngene). The membranes were stripped and reprobed for β-actin with polyclonal antibody directed to β-actin (Sigma). The band density of the APP derivatives was normalized to the density of β-actin signal.
α-, β-, and γ-secretase activities were measured according to the manufacturer's protocols (R&D Systems). In brief, the fresh brain tissues were pulverized in liquid nitrogen, and aliquoted for secretase assays. Secretases were extracted in the extraction buffer provided in the product kits, and their activities were measured by adding a secretase-specific peptide conjugated to the reporter molecules EDANS and DABCYL. Cleavage of the peptide by the secretase physically separates the EDANS and DABCYL, allowing for the release of a fluorescent signal, which is proportional to the level of secretase enzymatic activity. The fluorescent signal was read at an excitation wavelength of 355 nm and emission at 510 nm with a 495 nm cutoff.
Western blot analysis
The levels of p75NTR and the molecules involving Aβ production and degradation were analyzed using Western blotting. Total brain homogenates were subjected to SDS-PAGE (8–12% acrylamide). The blots were probed with the following antibodies: rabbit anti-p75NTR polyclonal antibody (G3231 from Promega for full-length p75NTR and ANT-007 from Alomone for shed extracellular domain), anti-BACE1 monoclonal antibody (MAB931, R&D Systems), anti-insulin-degrading enzyme (IDE) polyclonal antibody (25970, Abcam), anti-neprilysin (NEP) polyclonal antibody (NEP11-A, Alpha Diagnostic), anti-LRP monoclonal antibody (5A6, Abcam), and anti-β actin monoclonal antibody (Sigma-Aldrich). The band density of the APP derivatives was normalized to that of β-actin.
Primary cortical neuron culture
Primary neuron culture was performed according to our methods described previously (Wang et al., 2010c). In brief, 1-month-old female APP+/−p75−/− and APP+/−p75−/− mice were killed by Lethabarb. The cortex was sliced into 0.5-mm-thick sections in PBS supplemented with Hibernate A/B27, and shaken in a tube containing papain for 30 min in a 30°C water bath. The cell suspension was applied to Optiprep density gradient medium (Sigma-Aldrich) and centrifuged at 800 × g. Fractions containing neurons were collected and washed briefly in Hibernate A/B27 with 0.5 mm glutamine by centrifuging at 200 × g twice. The cell pellets were resuspended in Neurobasal A/B27 with 0.5 mm glutamine, 5 ng/ml bFGF, 10,000 U/ml penicillin, and 1 mg/ml streptomycin. Cell density was counted and adjusted accordingly to 2.5 × 10⁵/ml with culture medium. The cells were plated in triplicate onto poly-d-lysine (100 mg/ml)-coated 24 multiwell plates and were maintained in a humidified atmosphere in 37°C, 5% CO2. Both culture medium and cell lysate prepared in RIPA buffer were collected after culture for 3 and 5 d for Aβ ELISA assay.
Effects of the p75NTR extracellular domain on Aβ oligomerization and fibrillation
Aβ preparation.
Synthetic Aβ42 was purchased from American Peptide and prepared following the protocols described previously (Dahlgren et al., 2002). In brief, the Aβ42 peptide was dissolved in 1,1,1,3,3,3-hexafluoro-2-propanol (HFIP, Sigma) at 1 mg/ml, and was aliquoted in Eppendorf tubes. The HFIP was allowed to evaporate in the fume hood, and the resulting clear peptide film was dried under vacuum overnight.
Inhibition of Aβ oligomerization.
Aβ42 (2.5 μg) was dissolved and incubated at a final concentration of 20 μm with recombinant extracellular domain of p75NTR, which is fused with Fc fragment of human IgG (p75/Fc) to increase the stability (R&D Systems), at various concentrations (0.2, 2, and 10 μm) in DMEM at 4°C for 24 h according to the protocol described previously (Stine et al., 2003). The same amount of Aβ42 without incubation or incubated with human IgG (HuIgG) at a molar ratio of 1:0.5 was used as a control. Samples were run on Tris-Tricine gel, and Aβ was visualized by Western blot analysis with biotin-conjugated 6E10 antibody.
Inhibition of Αβ fibrillation and disaggregation of preformed Aβ fibril.
The effects of p75NTR extracellular domain on Aβ fibrillation and fibril disaggregation were examined with methods described previously (Stine et al., 2003; Wang et al., 2009a). For the inhibition of Aβ fibrillation, 25 μm Aβ42 (30 μg) was incubated with 10 μm p75/Fc or HuIgG in DMEM containing 10 mm HCl at 37°C for 1 d. For disaggregation of preformed Aβ fibril, preformed fibrils were then incubated with 12.5 μm p75/Fc or HuIgG for an additional 3 d at 37°C. For both incubations, Aβ42 and HuIgG were incubated alone under the same conditions, along with the experiment as controls. At the end of incubations, the samples were measured by adding the reaction solution to 3 ml of 5 μm thioflavine T (ThT) solution (50 mm phosphate buffer, pH 6.0, Sigma). Fluorescence emission of ThT is shifted when it binds to β-sheet aggregate structures of amyloid fibrils (LeVine, 1993). Fluorescence intensity was monitored at an excitation wavelength of 450 nm and an emission wavelength of 482 nm by a Luminescence spectrometer PE-LS50B (PerkinElmer) with both excitation and emission bandwidths of 5 nm. Readings were the results of the average of three values determined by a time scan after subtracting out the fluorescence contribution from free ThT. Each experiment was performed in triplicate.
Electron microscopy.
A 10 μl aliquot of different Aβ incubation samples as described above was spotted onto a glow-discharged, carbon-coated Formvar grid (ProSiTech) and incubated for 20 min. The droplet then was displaced with an equal volume of 2.5% (v/v) glutaraldehyde in water and incubated for an additional 6 min. Finally, the peptide was stained with 10 μl of 1% (v/v) filtered (0.2 μm) uranyl acetate in water for 6 min. This solution was wicked off and then the grid was air-dried. Samples were examined using a Joel 1200 EX transmission electron microscopy equipped with Megaview 3 Digital Camera.
Hippocampus injection of p75/Fc and Aβ plaque analysis
Nine-month-old APPSwe/PS1dE9 mice, which contained numerous amyloid deposits in the brain, were anesthetized with halothane and placed in a stereotaxic apparatus (Stoelting). A midsagittal incision was made to expose the cranium, and a burr hole was drilled with a dental drill over the left hippocampi to the following coordinates: anteroposterior, −2.3 mm; lateral, 1.8 mm; ventral, 2.0 mm; all taken from bregma. p75/Fc (3 μg in 3 μl) was injected into the left hippocampus of mice (n = 4). HuIgG (6 μg in 3 μl; the equivalent molar to p75/Fc) was injected in the same approach as a control. One week after injection, brains were fixed and sectioned. Five sections around the injection site were selected per animal. Aβ plaques were stained using biotin-conjugated 6E10 antibody. The area fraction of Aβ plaque in hippocampus was quantified with ImageJ under the same settings in a blinded manner. The area fraction of Aβ plaque in hippocampus of the injection side was normalized with the control side. To see the diffusion of injected p75/Fc in the hippocampus, three mice were killed 24 h after injection and brain sections were stained against Fc fragment of human IgG.
Statistical analysis
Unless otherwise stated, the data in the text and figures are expressed as mean ± SEM. Statistical comparisons between groups were assayed using t test, one-way ANOVA, or two-way repeated-measures ANOVA for testing the significance of values. In the analysis of Morris water maze, the data on distance and latency were analyzed by two-way repeated-measures ANOVA with treatment as between-subjects factor and training block as within-subjects factor. p values <0.05 were considered significant. All these analyses were performed using SPSS for Windows version 13.0.
Results
The levels of p75NTR in the brain of APPSwe/PS1dE9 transgenic mice
To understand the roles of p75NTR in the development of AD, we examined the level of p75NTR in the brain. First, we measured p75NTR levels in brain homogenates at various ages, using Western blotting. As shown in Figure 1A, p75NTR level increased with age in both the transgenic mice and their wild-type littermates. p75NTR level at 9 months of age was significantly higher in the AD transgenic mice than in the wild-type mice. We next examined the sites of expression of p75NTR in the brain by immunohistochemistry and found that p75NTR was localized in the cholinergic neurons of basal forebrain of both APPSwe/PS1dE9 transgenic mice and their littermates (Fig. 1B). There was no obvious difference in the intensity of p75NTR staining in the basal forebrain cholinergic neurons over time in either transgenic or wild-type mice. However, in the brain of APPSwe/PS1dE9 mice, we observed p75NTR-positive fibers in the neocortex and hippocampus at 3 months of age when Aβ begins to deposit (data not shown), and observed the p75NTR-positive fibers and degenerative neurites at 6 months of age in the neocortex and hippocampus of APPSwe/PS1dE9 transgenic mice. The number of degenerative neurites increased at 9 months of age. We also found that amyloid plaques in the neocortex of APPSwe/PS1dE9 transgenic mice were almost always associated with p75NTR-positive degenerative neurites located in their cores (Fig. 1C). However, we did not observe the p75NTR-positive fibers and degenerative neurites at all time points in the brain of wild-type mice. We did not see any obvious p75NTR expression in the thalamus at all time points (data not shown). These data indicate that the level of p75NTR increases with the age and is related to Aβ load in the brain.
Figure 1.
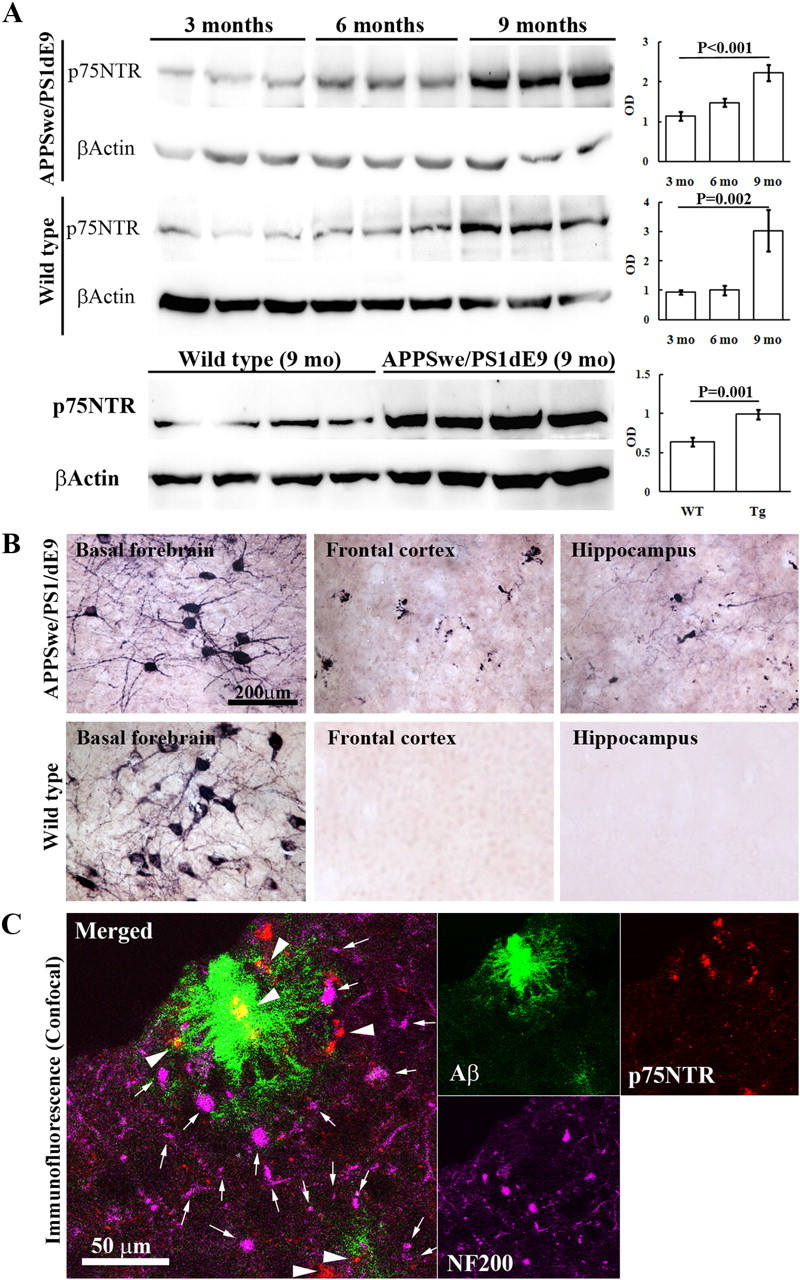
Expression of p75NTR in the brain. p75NTR expression in the brain was measured by Western blot and immunohistochemistry (n = 10 in each group). A, Brain homogenates of APPSwe/PS1dE9 mice and their wild-type littermates at 3, 6, and 9 months of age were subjected to Western blot analysis probed with rabbit anti-p75NTR polyclonal antibody (G3231) and monoclonal antibody to β-actin. B, Sections of basal forebrain, frontal lobe, and hippocampus from 9-month-old APPSwe/PS1dE9 mice and their wild-type littermates were stained using free-floating immunohistochemistry for p75NTR with rabbit anti-p75NTR polyclonal antibody (Ab9650). C, Representative confocal images for colocalization of p75NTR-positive fibers and fibrillar plaques in brain of 9-month-old APPSwe/PS1dE9 mice, with Ab 9650 for p75NTR (arrowheads), N52 for neurofilament 200 (NF200, arrows), and thioflavine S for fibrillar plaque.
Deletion of p75NTR exacerbates Aβ-related pathologies
To investigate whether p75NTR plays a role in Aβ deposition, APP+/−p75−/− mice were generated by crossing APPSwePS1dE9 mice with mice lacking the p75NTR gene. First we evaluated Aβ deposition in the brains by staining the Aβ plaques with Congo red, a histological dye that binds to fibril proteins enriched in β-sheet conformation at high affinity, and is commonly used to detect the fibrillar Aβ plaques (Frid et al., 2007). Interestingly, we found a clear trend of a p75NTR gene dosage effect on Aβ deposition in the brain. At the age of 9 months, mice with p75NTR gene deleted (APP+/−p75−/−) had a significantly higher plaque density (number of plaques per square millimeter of area, p < 0.001), average plaque size (p < 0.001), and area fraction (percentage of area occupied by Aβ plaques, p < 0.001) in their brains than mice with two copies of p75NTR gene (APP+/−p75+/+), while mice with one copy of p75NTR gene (APP+/−/p75+/−) showed plaque density and area fraction between those of APP+/−p75+/+ and APP+/−p75−/− mice (Fig. 2A–I).
Figure 2.
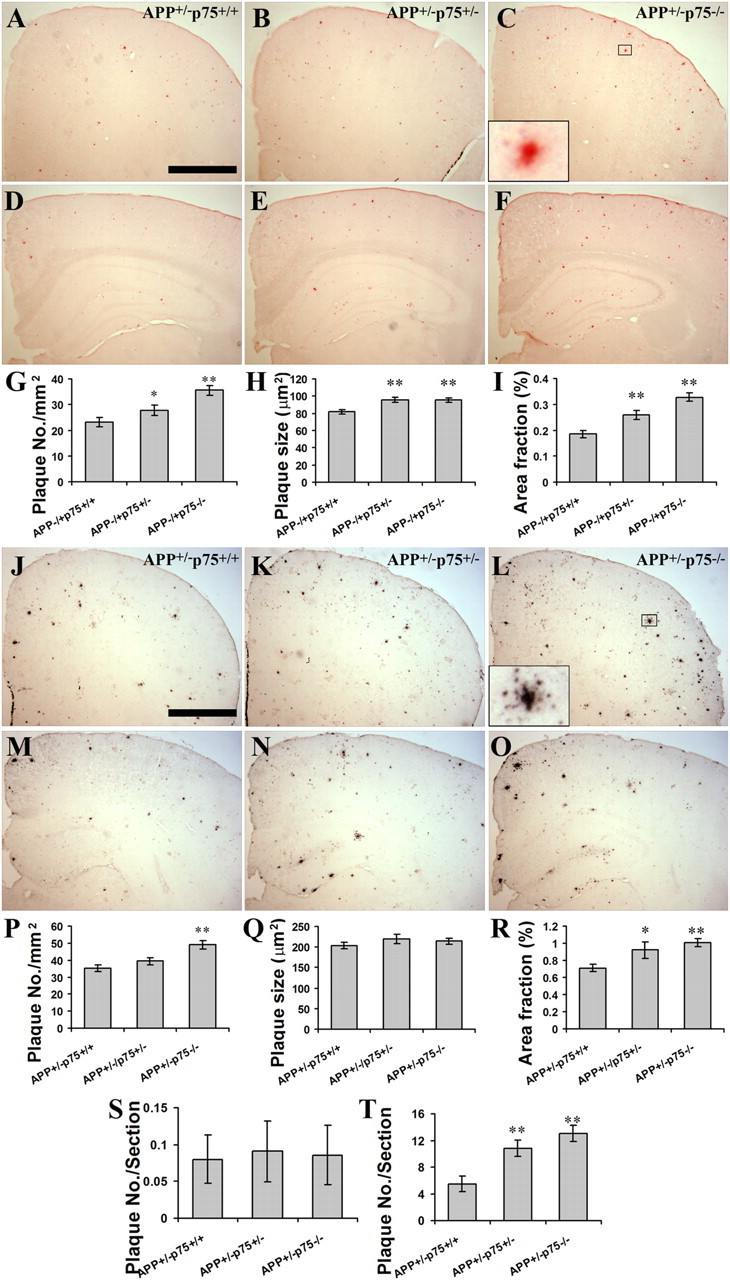
Aβ plaque burden in the brain of mice with different genotypes. A series of five equally spaced tissue sections (∼1.3 mm apart) spanning the whole brain were stained using free-floating immunohistochemistry for total Aβ plaque, or using Congo red staining for compact Aβ plaque (n = 10 in each group). A–C, Congo red-positive Aβ plaques in frontal lobe of 9-month-old APP+/−p75+/+, APP+/−p75+/−, and APP+/−p75−/− mice. D–F, Congo red-positive Aβ plaques in hippocampus of 9-month-old APP+/− p75+/+, APP+/−p75+/−, and APP+/−p75−/− mice. G–H, Comparison of Congo red-positive Aβ plaque density (G), average size (H), and area fraction (I) in neocortex and hippocampus of 9-month-old animals. J–L, IHC-positive Aβ plaques in frontal lobe of 9-month-old APP+/−p75+/+, APP+/−p75+/−, and APP+/−p75−/− mice. M–Q, IHC-positive Aβ plaques in hippocampus of 9-month-old APP+/−p75+/+, APP+/−p75+/−, and APP+/−p75−/− mice. P–R, Comparison of IHC-positive Aβ plaque density (P), average size (Q), and area fraction (R) in neocortex and hippocampus of 9-month-old animals. S, T, Comparison of Congo red-positive Aβ plaque density in the brains of 3- (S) and 6- (T) month-old animals. * and ** denote p < 0.05 or p < 0.01 versus APP+/−p75+/+. Scale bar, 1 mm.
As Congo red stains the fibrillar plaques only, we further stained the brain with anti-Aβ antibody 6E10 to illustrate the diffuse and fibrillar Aβ deposition. While we found that the 6E10-stained pan-Aβ plaques had a higher density, bigger size, and higher area fraction than Congo red-stained fibrillar Aβ plaques, comparative results of 6E10-stained Aβ plaque among mice with various copies of p75NTR gene were similar to those of Congo red-stained fibrillar plaque, with APP+/−p75−/− mice having a higher plaque density (p < 0.001) and area fraction (p = 0.004) than APP+/−/p75+/+ mice (Fig. 2J–R).
To examine the time course effect of p75NTR deletion on Aβ deposition, we next stained the Aβ plaque in the brains at the age of 3 and 6 months. We counted the plaque numbers in the brain under the microscope in a blind manner, and found that the young animals had fewer plaques in their brains. APP+/−p75−/− mice had more plaques in their brains than APP+/−p75−/+ (p = 0.185) and APP+/−p75+/+ (p < 0.001) at 6 months of age (Fig. 2T), when Aβ accumulation in the brain begins to accelerate, but not at 3 months of age (Fig. 2S), when Aβ plaque just begins to form (Wang et al., 2006b).
These results clearly indicate that deletion of p75NTR exacerbates the Aβ plaque formation in a gene dosage-dependent manner.
Deletion of p75NTR decreases Aβ production but increases Aβ deposition in the brain
To further understand the effect of p75NTR deletion on Aβ deposition, we measured the levels of the different aggregation states of Aβ in the brain by ELISA. Aβ was sequentially extracted in TBS, 2% SDS, and 70% formic acid. In general, Aβ in the TBS fraction represents the soluble form, Aβ in the SDS fraction represents the diffuse Aβ plaques, and Aβ in the formic acid fraction represents the fibrillar Aβ plaques. Aβ levels were determined by both Aβ40- and Aβ42-specific sandwich ELISA. Total Aβ level was generated from the sum of Aβ40 and Aβ42 of the different fractions. Consistent with the Aβ pathology results, the APP+/−p75−/− mice had more total Aβ, Aβ40, and Aβ42 in their brain than APP+/−p75+/+ mice at 3, 6, and 9 months of age (Fig. 3A–C). Further analysis of distinct Aβ pools showed a difference between APP+/−p75−/− mice and APP+/−p75+/+ mice. Compared with APP+/−p75+/+ mice at all time points, APP+/−p75−/− mice had less TBS-soluble Aβ, comparable SDS-soluble Aβ, and more SDS-insoluble Aβ (Fig. 3A–C).
Figure 3.

Aβ levels in the brain and Aβ productions in vitro. A–C, Comparison of Aβ in TBS, SDS, and FA and total Aβ, Αβ40, and Αβ42 among groups at 3, 6, and 9 months of age (n = 10 in each group). Aβ in the brain was extracted sequentially in TBS, 2% SDS, and 70% FA water solution. Aβ peptide concentrations in the brain of animals were measured by ELISA. D–F, Comparison of total Aβ, Aβ40, and Aβ42 in serum at 3, 6, and 9 months of age. Aβ peptide concentrations in the serum of animals were measured by ELISA. G–H, Aβ production of cortical neurons in vitro. The cortex of 1-month-old female APP+/−p75+/+ and APP+/−p75−/− mice was isolated and cultured at 2.5 × 10⁵/ml in Neurobasal A/B27 with 0.5 mm glutamine, 5 ng/ml bFGF, 10,000 U/ml penicillin, and 1 mg/ml streptomycin in triplicate. Both culture medium and cell lysate prepared in RIPA buffer were collected after culture for 3 (G) and 5 (H) days and measured for Aβ by ELISA. * and ** denote p < 0.05 or p < 0.01 versus APP+/−p75+/+ mice.
We further measured the serum Aβ. Consistent with the brain TBS-soluble Aβ levels, APP+/−p75−/− mice had significant lower serum levels of total Aβ, Aβ40, and Aβ42 than APP+/−p75+/+ mice at 9 months of age (p = 0.045).
The above data indicate that deletion of p75NTR increases the total Aβ levels in the brain, with increased fibrillar Αβ levels but decreased soluble Aβ levels. Alternative possibilities may underlie these changes: p75NTR deletion could influence either Aβ production and/or Aβ deposition.
We next investigated whether p75NTR deletion poses significant impact on the Aβ production by determining the Aβ production of cortical neurons in vitro. Cortical neurons were isolated from brains of 1-month-old APP+/−p75−/− and APP+/−p75+/+ mice, and cultured for 3 or 5 days (Fig. 3G,H). The culture medium and cell lysate of cultured neurons were collected and measured for Aβ concentration by a sandwich ELISA. Neurons from APP+/−p75−/− mice produced less total Aβ (sum of Aβ in culture medium and cell lysate) in both culture medium and cell lysate fractions than neurons from APP+/−p75+/+ mice at day 5 (Fig. 3H). These data are consistent with the levels of brain and serum soluble Aβ, which were lower in APP+/−p75−/− mice than in APP+/−p75+/+ mice.
Together, these data suggest that deletion of p75NTR gene decreases Aβ production but increases Aβ deposition in the brain.
Deletion of p75NTR does not affect APP expression and proteolytic processing, secretase activities, and Aβ-degrading enzymes
Aβ is generated from sequential APP cleavages by β- and γ-secretases on the cell membrane. APP is mainly cleaved by three proteolytic enzymes: α-, β-, and γ-secretases. Sequential cleavage by β- and γ-secretases generates Aβ (amyloidogenic processing of APP), while sequential cleavage by α- and γ-secretases precludes generation of Aβ (nonamyloidogenic processing of APP) (Thinakaran and Koo, 2008). To investigate whether exacerbated Aβ pathology and decreased Aβ production by p75NTR deletion are related to the changes in APP expression and its amyloidogenic processing, APP proteolytic products present in the brain homogenates were analyzed by Western blotting using three selective antibodies. As shown in Figure 4A, the expression of full-length APP (APPfl) and its derivates APPα, APPβ, CTFα, and CTFβ did not significantly differ between the APP+/−p75+/+ and APP+/−p75−/− mice.
Figure 4.
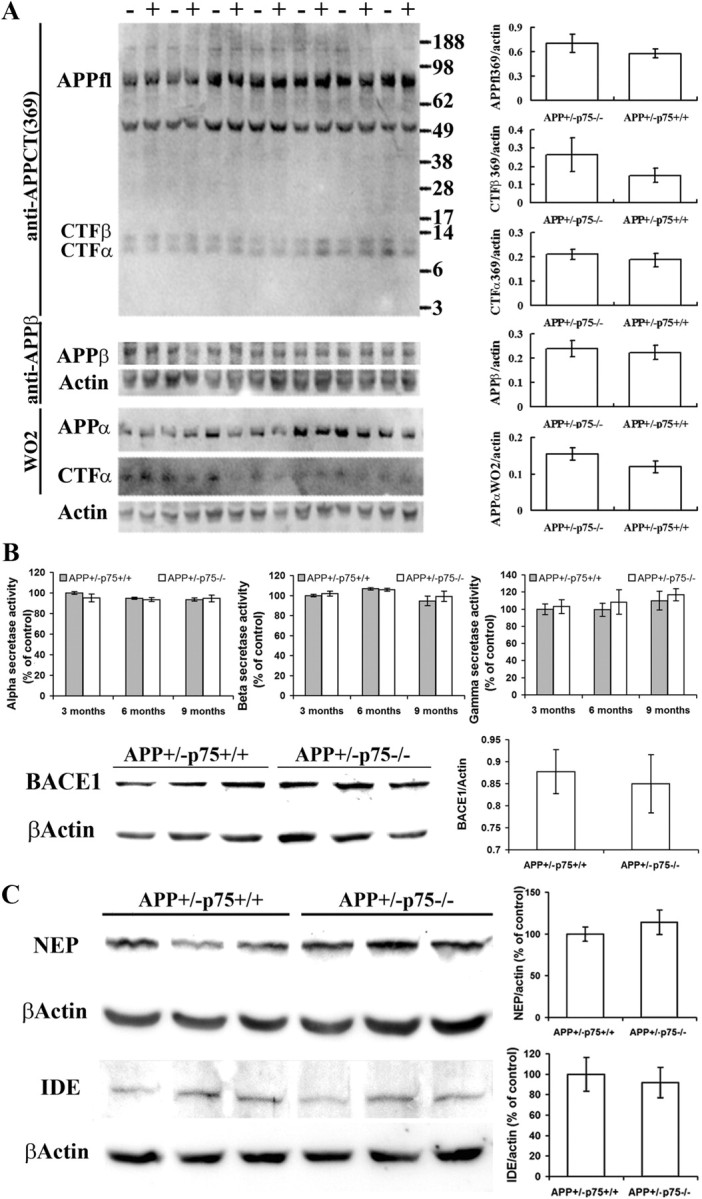
APP proteolytic processing, secretase activities, and Aβ-degrading enzymes. A, APP expression and proteolytic processing. Western blot analyses were performed to detect the APP expression and APP proteolytic derivates in the brain homogenates of 9-month-old animals using antibodies directed to APPfl, APPα, APPβ, CTFα, and CTFβ. “−” denotes APP+/−p75−/− mice, and “+” denotes APP+/−/p75+/+ mice. B, Secretase activities and BACE1 expression. Shown are α-, β-, and γ-secretase activities in the brain of 9-month-old APP+/−p75+/+ and APP+/−p75−/− mice, which were measured with secretase-specific peptides conjugated to the reporter molecules EDANS and DABCYL. Cleavage of the peptide by the secretase physically separates the EDANS and DABCYL, allowing for the release of a fluorescent signal, which is proportional to the level of secretase enzymatic activity. The protein levels of BACE1 in the brain of APP+/−p75+/+ and APP+/−p75−/− mice were measured by Western blot analysis probed with anti-BACE1 monoclonal antibody. C, Levels of NEP and IDE in the brain. The protein levels of NEP and IDE in the brain homogenates of 9-month-old APP+/−p75+/+ and APP+/−p75−/− mice were measured by Western blot analysis with antibodies directed to NEP and IDE. n = 10 in each group.
We next measured the activities of the α-, β-, and γ-secretases, which are key enzymes of the APP proteolytic processing, by adding secretase-specific peptides conjugated to the reporter molecules. Consistently, the activities of these enzymes are similar between APP+/−p75−/− and APP+/−p75+/+ mice at 3, 6, and 9 months of age (Fig. 4B). We further examined the expression of BACE1, the rate-limiting enzyme of Aβ production, with Western blot and consistently the BACE1 expression in APP+/−p75−/− mice did not differ from that in APP+/− p75+/+ at 9 months of age (Fig. 4B). The increase in amyloid plaques in the brain of p75NTR knock-out AD mice may be due to the reduction in Aβ degradation by enzymes. IDE and NEP are the two key enzymes that degrade Aβ (Wang et al., 2006a). We further determined the expression of NEP and IDE in the brain homogenate of 9-month-old mice by Western blot. As shown in Figure 4C, there is no significant difference in brain protein levels of NEP and IDE between APP+/− p75−/− and APP+/−p75+/+ mice. These data suggest that p75NTR deletion has no significant influence on expression and proteolytic processing of APP, secretase activities, and Aβ degradation.
Recombinant extracellular domain of p75NTR attenuates Aβ aggregation
It is well known that p75NTR binds Aβ (Yaar et al., 1997, 2002) and it can be extracellularly cleaved by metalloproteases and tumor necrosis factor converting enzyme (TACE) to generate the soluble extracellular domain of p75NTR (Weskamp et al., 2004; Ahmed et al., 2006; Sotthibundhu et al., 2008). We hypothesized that the p75NTR extracellular domain may exert a protective role against Aβ deposition and aggregation. First we examined whether p75NTR could interfere with the aggregation of Aβ. Aβ monomers were incubated with recombinant extracellular domain of p75NTR (p75/Fc) at various concentrations with HuIgG as a control. Interestingly, we found that p75/Fc, but not HuIgG, inhibited Aβ oligomerization in a dose-dependent manner (Fig. 5A).
Figure 5.
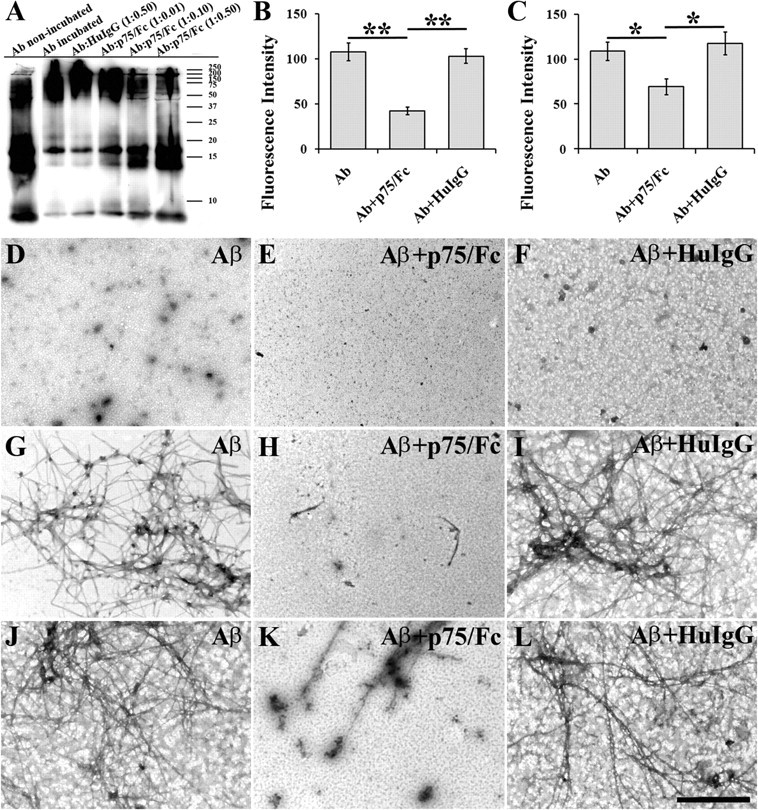
Extracellular domain of p75NTR attenuates Aβ aggregation. A, Dose-dependent inhibition of Aβ oligomerization by p75/Fc in vitro. Aβ42 (final concentration 20 μm) was incubated with p75/Fc at various molar ratios (1:0.01, 1:0.1, and 1:0.5) or HuIgG (molar ratio, 1:0.5) at 4°C for 24 h. “Aβ non-incubated” is the control Aβ42 peptide without incubation at 4°C for 24 h. “Aβ incubated” is the control Aβ42 peptide (final concentration 20 μm) that was incubated alone at 4°C for 24 h. Bands were visualized by Western blot analysis probed with biotin-conjugated 6E10 antibody. B, Inhibition of Aβ fibrillation by p75/Fc. Twenty-five micromolar Aβ42 peptide (30 μg) was incubated with 12.5 μm p75/Fc or HuIgG in DMEM containing 10 mm HCl at 37°C for 24 h. The same amount of Aβ42 was incubated alone under the same conditions as control. The Aβ fibrils were measured by ThT assay. C, Disaggregation of preformed Aβ fibrils by p75/Fc. Twenty-five micromolar Aβ42 (30 μg) was incubated at a concentration of at 37°C for 1 d to generate fibrils. Preformed fibrils were then incubated with the 12.5 μm p75/Fc or HuIgG for an additional 3 d at 37°C. Aβ42 was incubated alone under the same conditions, along with the experiment as control. The Aβ fibrils were measured by ThT assay. D–L, Electron micrographs showing morphology of Aβ assembly in the presence or absence of p75/Fc. D–F, Aβ oligomerization. Aβ42 was incubated alone (D) or with p75/Fc (E) or HuIgG (F) at 4°C for 24 h. G–I, Aβ fibrillation. Aβ42 was incubated alone (G) or with p75/Fc (H) or HuIgG (I) at 37°C for 24 h. J–L, Disaggregation of Aβ fibrils. Preformed Aβ was incubated alone (J) or with p75/Fc (K) or HuIgG (L) at 37°C for an additional 3 d. Scale bar, 500 nm.
We next determined whether p75/Fc interferes with Aβ fibrillation, Aβ42 was incubated alone, or with p75/Fc or HuIgG, and the formed fibrils were measured by adding thioflavine T, a dye with high affinity for β-sheet conformation. The fluorescence intensity of Aβ incubated with p75/Fc was lower than that of Aβ incubated alone (p < 0.001) or with HuIgG (p < 0.001) (Fig. 5B). The fluorescence intensity did not differ between Aβ incubated alone and Aβ incubated with HuIgG (p = 0.385), indicating that p75/Fc inhibited Aβ fibrillation.
To determine whether p75/Fc promotes the disaggregation of preformed Aβ fibrils, the preformed Aβ fibrils were incubated with p75/Fc. As shown in Figure 5C, the fluorescence intensity of preformed Aβ fibrils incubated with p75/Fc was lower than that of preformed Aβ fibrils incubated alone (p = 0.042) or with HuIgG (p = 0.019). No difference in fluorescence intensity was observed between preformed Aβ fibrils incubated alone or with HuIgG (p = 0.590). These data indicate that p75/Fc has the ability to promote the disaggregation of preformed Aβ fibrils, and also imply the potential of the p75/Fc in Aβ clearance.
The morphologies of the assemblies present following Aβ incubations with or without p75/Fc were examined using electron microscopy (EM). Numerous irregular or globular structures were formed when Aβ was incubated alone under oligomer-forming conditions (Fig. 5D). However, when Aβ was incubated with p75/Fc, fewer oligomer structures were seen (Fig. 5E). Addition of HuIgG to Aβ solution did not cause remarkable change in the density of oligomers compared to that of Aβ incubated alone (Fig. 5F). When Aβ42 was incubated under fibril-forming conditions, abundant fibrils, mainly nonbranched filaments, were formed. Fibrils with different morphologies could be observed, including short fibrils, twisted long fibrils, and occasionally some small aggregates mixed with fibrils. In contrast, marked reduction of fibrils was seen when Aβ42 was incubated with p75/Fc. Some squares of grids prepared from this solution did not show any fibrils. There were no long fibrils on all examined squares of grids. Aβ42 samples incubated with HuIgG showed dense fibrils similar to these observed in Aβ samples incubated alone. Preformed Aβ fibrils (Fig. 5J) were further incubated with p75/Fc for an additional 3 d; most preformed fibrils disassembled, and numerous small, relatively amorphous aggregates were observed (Fig. 5K). In contrast, addition of HuIgG did not change the morphologies of the preformed Aβ fibrils (Fig. 5L). These experiments were repeated three times and the results were consistent.
We further investigated the effect of p75/Fc on Aβ plaques in vivo. p75/Fc was injected stereologically into the left hippocampus of 9-month-old APPSwe/PS1dE9. First, we examined the diffusion of injected p75/Fc protein in the brain sections 24 h after injection. Immunostaining against Fc of human IgG showed extensive diffusion of the protein in the injected hippocampus, whereas little protein diffused into the contralateral hippocampus (Fig. 6A, arrow). Interestingly, we found that the local plaque number was reduced at the p75/Fc injection site in comparison with the control side (Fig. 6B,D). This effect may not be due to the local injury, which could remove the local plaque by an inflammatory mechanism (Nakagawa et al., 2000), as the HuIgG injection did not induce a significant reduction in plaque number (Fig. 6C,D). To see whether the p75NTR extracellular domain is shed in AD mice, we used p75NTR antibody against the N terminus (ANT-007) to performed Western blot on the brain homogenates. The fragment of shed extracellular domain of p75NTR was also detected in the brain of wild-type and APPSwe/PS1dE9 mice (Fig. 6E). These findings further confirm the effect of the p75NTR extracellular domain on Aβ aggregation in vivo and, importantly, suggest the physiological roles of the p75NTR shedding event in the development of AD.
Figure 6.
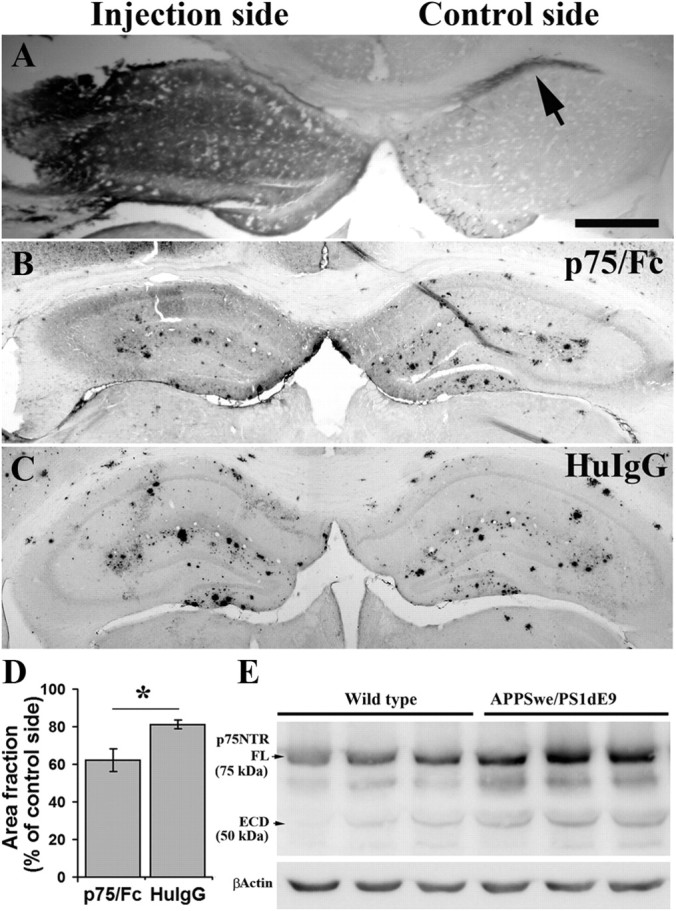
Hippocampus injection of p75/Fc reduces local Aβ plaques. p75/Fc (3 μg in 3 μl) or HuIgG (6 μg in 3 μl, the equivalent molar to p75/Fc) were injected into the left hippocampus of 9-month-old APPSwe/PS1dE9 mice (n = 4 in each group). One week after injection, Aβ plaques in hippocampus were stained using biotin-conjugated 6E10 antibody and quantified. The area fraction of Aβ plaque in hippocampus of the injection side was normalized with the control side. A, Distribution and diffusion of p75/Fc 24 h after injection in the left hippocampus. Sections were stained with antibody to Fc of human IgG. B, C, Representative images of hippocampus Aβ plaque staining 7 d after injection of p75/Fc (B) or HuIgG (C) into the hippocampus of 9-month-old APPSwe/PS1 mice. D, Comparison of Aβ plaque burden in hippocampus between p75/Fc and HuIgG injection groups. E, Expression of p75NTR extracellular domain (ECD) in the brain of wild-type and APPSwe/PS1dE9 mice at age of 9 months. To see the diffusion of injected p75/Fc in the hippocampus, three mice were killed 24 h after injection and brain sections were stained against Fc fragment of human IgG. Extensive diffusion of the protein was observed in the injected hippocampus, whereas little protein diffused into the contralateral hippocampus (arrow). * denotes p < 0.05.
Deletion of p75NTR exacerbates other AD-type pathologies
We also examined microgliosis in the mouse brains. Obvious microgliosis was observed in the brains of APP+/−p75−/− and APP+/−p75+/+ mice, but not APP−/−p75+/+ and APP−/− p75−/− mice (Fig. 7A–D). Consistent with Aβ plaque burden in the brains, APP+/−p75−/− mice had a significantly higher area fraction of microgliosis overall, as well as in both neocortex and hippocampus, than APP+/−/p75+/+ mice (Fig. 7E–G).
Figure 7.

Microgliosis and microhemorrhage in the brain of animals with different genotypes. A series of five equally spaced tissue sections spanning the brain were stained using free-floating immunohistochemistry for activated microglia (n = 10 in each group). A–D, Representative images of staining in APP−/−p75+/+ (A), APP+/−p75+/+ (B), APP+/−p75−/− (C), and APP−/−p75−/− (D) mice. No obvious microgliosis was observed in the brain of APP−/−p75+/+ and APP−/−p75−/− mice. E, Comparison of CD45 area fraction in neocortex and hippocampus among groups. F, Comparison of CD45 area fraction in neocortex. G, Comparison of CD45 area fraction in hippocampus. H, Comparison of microhemorrhage profile among mice with different genotypes. * and ** denote p < 0.05 or p < 0.01 versus APP−/−p75+/+ mice, # and ## denote p < 0.05 or p < 0.01 versus APP+/−p75+/+ mice, and & and && denote p < 0.05 or p < 0.01 versus APP−/−p75−/− mice, as determined by one-way ANOVA. Scale bar, 1 mm.
We examined the microhemorrhage in the brain. There were low levels of microhemorrhage profiles in APP−/−p75+/+, APP+/−p75+/+, and APP−/−p75−/− mice, and significantly higher levels of microhemorrhage profiles in APP+/−p75−/− mice (Fig. 7H).
Deletion of p75NTR does not lessen the memory deficits at 9 months of age
To investigate the influence of p75NTR deletion on cognitive function, mice with different genotypes (APP+/−p75−/−, APP+/−p75+/+, APP−/−p75+/+, and APP−/−p75−/−) were subjected to the Morris water maze test. There were no differences in performance of either platform trials or probe trial among different groups at ages of 3, 6, and 9 months (Fig. 8A,B). This was not attributable to the presence of motor deficits, because all the groups of mice exhibited similar swimming speeds (Fig. 8C). In the probe trial, APP−/−p75−/− mice entered the platform area more frequently and spent more time in the target quadrant area than APP+/−p75+/+ mice, but the difference between the two groups did not reach the statistical significance (Fig. 8D,E). There were no differences in performance of either platform trials or probe trial between APP+/−p75+/+ and APP+/−p75−/− mice. These data suggest that deletion of p75NTR gene does not lessen the cognitive impairment of AD mice until 9 months of age.
Figure 8.

Deletion of p75NTR does not lessen memory deficits until 9 months of age. Nine-month-old animals were subjected to Morris water maze test for a consecutive 5 d (n = 10 in each group). A, Latency taken to escape from the water in the platform trials. B, Distance taken to escape from the water in the platform trials. C, Swimming speed during the consecutive days of training. D, The number of crosses over the exact location of the hidden platform in the probe trial. E, Percentage of time spent in the quadrant area relative to the total time spent in the pool in the probe trial. The results are means ± SEM.
Discussion
In the present study, we found that p75NTR played differential roles in Aβ metabolism. The deletion of p75NTR resulted in an increased deposition of insoluble Aβ in the brain but decreased soluble Aβ in the brain and blood, and decreased Aβ production by cortical neurons in vitro. Consequently, the deletion of p75NTR exacerbates AD pathologies such as increased amyloid plaques and microgliosis. We further found that the extracellular domain of p75NTR suppresses Aβ aggregation in vitro and in vivo. Our studies provide novel evidence that p75NTR plays a critical role in the development of AD.
Cholinergic neurons in the basal forebrain express p75NTR, TrkA, TrkB, and TrkC (Salehi et al., 2000). Strikingly, neurons in other brain regions normally express little or no p75NTR. However, the reports on the levels of p75NTR expression in AD patients and during aging remain controversial (Salehi et al., 2000; Hu et al., 2002; Ginsberg et al., 2006). Our study showed that p75NTR expression increases with age, and APPSwe/PS1dE9 mice had a higher p75NTR expression level than their wild-type littermates. This is consistent with a recent study that suggests that Aβ promotes p75NTR expression (Chakravarthy et al., 2010). Consistent with previous findings, we found that p75NTR is mainly localized in basal forebrain neurons, and in APPSwe/PS1dE9 mice some degenerative fibers and neurites also express p75NTR, suggesting that p75NTR may play a role in neurite degeneration. Indeed, a recent study has demonstrated that p75NTR mediates Aβ-induced neurite atrophy (Knowles et al., 2009). Accumulating evidence indicates that p75NTR also plays a critical role in degeneration of cholinergic neurons in response to Aβ (Sotthibundhu et al., 2008) and to proneurotrophins (Friedman, 2000; Podlesniy et al., 2006; Volosin et al., 2008), while a recent study suggested that p75NTR is neuroprotective for the sympathetic nervous system in a mouse model of AD (Bengoechea et al., 2009).
In the present study, the deletion of p75NTR decreased soluble Aβ in the brain, as reflected by TBS extracted fraction, and in the blood. The reduction of soluble Aβ in the p75NTR knock-out AD mice suggests that the production of Aβ in these mice may be reduced. Indeed, our in vitro studies, where Aβ clearance is not complicated, showed that Aβ production by cortical neurons of AD mice was significantly reduced in the absence of p75NTR, suggesting that p75NTR mediates Aβ production by neurons (Costantini et al., 2006). However, α-, β-, and γ-secretase assays did not show any significant changes in enzymatic activities in p75NTR knock-out AD mice. Western blot analysis also did not show any significant differences in APP levels and proteolytic processing. How p75NTR regulates Aβ production is not clear. It is known that neurotrophin signaling plays an important role in AD development (Coulson et al., 2009). Multiple ligands bind to p75NTR, which may mediate AD development (Dechant and Barde, 2002). In addition to neurotrophins and proneurotrophins, which are prototypic ligands for p75NTR, Aβ is also a ligand of p75NTR (Yaar et al., 1997). Neurotoxic Aβ oligomers can directly interact with p75NTR extracellular domain (Knowles et al., 2009). Whether the Aβ/p75NTR signaling causes a positive feedback for Aβ production is not known, but the NGF/p75NTR signaling pathway increases the production of Aβ (Costantini et al., 2005a, 2006). As p75NTR interacts with APP (Fombonne et al., 2009), p75NTR ligands may enhance the endocytosis of APP and increase the production of Aβ via the endocytosis-dependent mechanism (Koo and Squazzo, 1994; Cirrito et al., 2008).
Although the deletion of p75NTR gene reduced soluble Aβ, the total Aβ levels, in particular, the insoluble fractions as reflected by formic acid extraction were significantly increased in p75NTR knock-out AD mice. The increase in total Aβ after p75NTR deletion suggests that p75NTR plays a protective role against amyloid plaque formation and Aβ deposition in AD. Our studies showed for the first time that the extracellular domain of p75NTR inhibited the aggregation of Aβ and increased dissociation of preformed fibrous Aβ as reflected by measurement of ThT fluorescence and EM in vitro. Furthermore, after injection of the extracellular domain-Fc into the hippocampus, amyloid plaques in the injected hippocampus were reduced. The mechanism by which the p75NTR extracellular domain reduced amyloid plaques may be similar to that of anti-Aβ antibodies (Wang et al., 2010a). It may inhibit the aggregation in vivo and enhance transport and removal from the extracellular space. Thus, it is tempting to speculate that the extracellular domain of p75NTR may act as an Aβ-sequestering molecule to clear Aβ in vivo.
p75NTR, like APP and other type I transmembrane receptors, can be cleaved extracellularly by metalloproteases and generate soluble extracellular domain (Weskamp et al., 2004; Zampieri et al., 2005; Ahmed et al., 2006; Bronfman, 2007; Sotthibundhu et al., 2008). Under physiological conditions, the extracellular domain of p75NTR released by the proteolysis may suppress the deposition of Aβ and promote its clearance. The loss of p75NTR by gene deletion caused significant increase in Aβ deposition and insoluble Aβ, while steady-state production of Aβ by neurons in vitro and in vivo is significantly reduced in the absence of p75NTR. No significant change in the level of IDE and NEP and no change in the LRP (data not shown), a key receptor transporting Aβ across BBB, were found in p75NTR knock-out AD mice, suggesting that the absence of p75NTR may not significantly affect the enzymatic degradation and transport across BBB of Aβ. The evidence from our current study strongly suggests that the extracellular domain of p75NTR plays a critical role in reducing the aggregation and deposition of Aβ.
However, it is noteworthy that in a recent study where the Thy1-hAPPLond/Swe mice were crossed with the same p75NTR−/− mice, there was no significant difference in either Aβ plaque burden or soluble Aβ level in the brain at 5–7 months of age, when significant Aβ plaques were obvious in the brain (Knowles et al., 2009). The reason for the inconsistency in brain Aβ burden of the two studies remains unknown, but it is likely due to the difference in animal models. The double transgenes in our model may facilitate the generation of Aβ where p75NTR extracellular domain is critical in the clearance of Aβ and keeping the homeostasis of extracellular Aβ, whereas in the single transgenic mice, whose Aβ production is relatively low, other Aβ clearance mechanisms may be sufficient in the clearance of extracellular Aβ.
Although p75NTR deletion caused a significant increase in Aβ deposition in the brain, there was no significant difference in Morris water maze test. The reason underlying the discrepant results is not known. Previous studies showed that p75NTR depletion increases the size and the number of cholinergic neurons in the basal forebrain and enhances acetylcholine synthesis (Yeo et al., 1997; Greferath et al., 2000; Naumann et al., 2002). p75NTR is found to mediate long-term depression and may be a negative regulator of learning and memory (Woo et al., 2005). A recent study showed that the spatial learning and hippocampal long-term potentiation are significantly increased in p75NTR knock-out mice (Barrett et al., 2010), suggesting that p75NTR may reduce the hippocampal learning capacity. Consistent with this study, we also found that the learning ability of p75NTR knock-out mice looks better than wild-type mice (Fig. 8). Thus, no significant change in learning and memory in APP+/p75NTR−/− may reflect that increased Aβ antagonizes the effect of p75NTR deletion on spatial learning of mice in the present study.
Collectively, our data suggest that p75NTR may have two-sided effects on Aβ metabolism (Fig. 9). On one hand, p75NTR signaling may increase Aβ production and enhance steady-state levels of Aβ, which may increase AD pathology. On the other hand, the extracellular domain of p75NTR after shedding from the membrane may bind and sequester Aβ, thus suppressing its aggregation and reducing Aβ deposition in the brain. Thus, p75NTR knock-out produced a net result of increased Aβ deposition and aggravated AD pathology in the brain. It appears that the shed extracellular domain had a dominant effect on Aβ metabolism and clearance. The two-sided effects of p75NTR on Aβ suggest the importance of Aβ clearance in AD development. Our data, together with previous studies, which showed that p75NTR mediates neurotoxicity in response to Aβ and proneurotrophins, strongly suggest that p75NTR represents a valid therapeutic target for the treatment of AD (Dechant and Barde, 2002; Coulson et al., 2009; Knowles et al., 2009). Our data caution that simply reducing expression of p75NTR may exacerbate AD pathology. However, the use of the extracellular domain may not only attenuate neurotoxic signals by blocking Aβ– and proneurotrophin–p75NTR interactions on cell membrane, but also may suppress Aβ aggregation and deposition and enhance Aβ clearance from the brain. In addition, we found that recombinant extracellular domain of p75NTR is also able to block the Aβ- (supplemental Fig. 1, available at www.jneurosci.org as supplemental material) and proNGF-induced neurotoxicity in vitro (Wang et al., 2010c). These data suggest that recombinant extracellular domain of p75NTR may be a desirable anti-AD agent to facilitate Aβ clearance by inhibiting Aβ aggregation, and to protect cholinergic neurons from Aβ- and proneurotrophin-induced neurotoxicity by blocking their interaction with p75NTR.
Figure 9.

Schematic diagram depicting functions of p75NTR in Aβ metabolism. p75NTR may have two-sided effects on Aβ metabolism. On one hand, p75NTR signaling may increase Aβ production and enhance steady-state levels of Aβ, which may increase AD pathology. In addition to Aβ production, p75NTR also mediates Aβ and proNGF-mediated neurotoxicity such as neuron death and neurite degeneration. On the other hand, the extracellular domain of p75NTR after shedding from the membrane may bind and sequester Aβ, and thus suppress Aβ aggregation and reduce Aβ deposition in the brain. Meanwhile, the extracellular domain of p75NTR may also block the interaction of p75NTR and its ligands (e.g., Aβ or proNGF) by competitive binding, and thus attenuate the p75NTR signaling that leads to the neurotoxicity. ECD denotes extracellular domain of p75NTR.
Footnotes
This project is supported by National Health and Medical Research Council Grant 480422, Flinders Medical Center Foundation grants, National Natural Science Foundation of China Grant 30973144, and Natural Science Foundation Project of CQCSTC No. CSTC2010BA5004. Y.-J.W. is supported by an International Postgraduate Research Scholarship at Flinders University. We thank Professor Moses Chao from New York University School of Medicine for the gift of p75NTR antibodies (9650).
References
- Ahmed Z, Mazibrada G, Seabright RJ, Dent RG, Berry M, Logan A. TACE-induced cleavage of NgR and p75NTR in dorsal root ganglion cultures disinhibits outgrowth and promotes branching of neurites in the presence of inhibitory CNS myelin. FASEB J. 2006;20:1939–1941. doi: 10.1096/fj.05-5339fje. [DOI] [PubMed] [Google Scholar]
- Barrett GL, Reid CA, Tsafoulis C, Zhu W, Williams DA, Paolini AG, Trieu J, Murphy M. Enhanced spatial memory and hippocampal long-term potentiation in p75 neurotrophin receptor knockout mice. Hippocampus. 2010;20:145–152. doi: 10.1002/hipo.20598. [DOI] [PubMed] [Google Scholar]
- Bengoechea TG, Chen Z, O'Leary DA, Masliah E, Lee KF. p75 reduces beta-amyloid-induced sympathetic innervation deficits in an Alzheimer's disease mouse model. Proc Natl Acad Sci U S A. 2009;106:7870–7875. doi: 10.1073/pnas.0901533106. [DOI] [PMC free article] [PubMed] [Google Scholar]
- Bronfman FC. Metalloproteases and gamma-secretase: new membrane partners regulating p75 neurotrophin receptor signaling? J Neurochem. 2007;103(Suppl 1):91–100. doi: 10.1111/j.1471-4159.2007.04781.x. [DOI] [PubMed] [Google Scholar]
- Buxbaum JD, Gandy SE, Cicchetti P, Ehrlich ME, Czernik AJ, Fracasso RP, Ramabhadran TV, Unterbeck AJ, Greengard P. Processing of Alzheimer beta/A4 amyloid precursor protein: modulation by agents that regulate protein phosphorylation. Proc Natl Acad Sci U S A. 1990;87:6003–6006. doi: 10.1073/pnas.87.15.6003. [DOI] [PMC free article] [PubMed] [Google Scholar]
- Capsoni S, Ugolini G, Comparini A, Ruberti F, Berardi N, Cattaneo A. Alzheimer-like neurodegeneration in aged antinerve growth factor transgenic mice. Proc Natl Acad Sci U S A. 2000;97:6826–6831. doi: 10.1073/pnas.97.12.6826. [DOI] [PMC free article] [PubMed] [Google Scholar]
- Capsoni S, Giannotta S, Cattaneo A. Nerve growth factor and galantamine ameliorate early signs of neurodegeneration in anti-nerve growth factor mice. Proc Natl Acad Sci U S A. 2002;99:12432–12437. doi: 10.1073/pnas.192442999. [DOI] [PMC free article] [PubMed] [Google Scholar]
- Chakravarthy B, Gaudet C, Ménard M, Atkinson T, Brown L, Laferla FM, Armato U, Whitfield J. Amyloid-beta peptides stimulate the expression of the p75NTR neurotrophin receptor in SHSY5Y human neuroblastoma cells and AD transgenic mice. J Alzheimers Dis. 2010;19:915–925. doi: 10.3233/JAD-2010-1288. [DOI] [PubMed] [Google Scholar]
- Cirrito JR, Kang JE, Lee J, Stewart FR, Verges DK, Silverio LM, Bu G, Mennerick S, Holtzman DM. Endocytosis is required for synaptic activity-dependent release of amyloid-beta in vivo. Neuron. 2008;58:42–51. doi: 10.1016/j.neuron.2008.02.003. [DOI] [PMC free article] [PubMed] [Google Scholar]
- Costantini C, Weindruch R, Della Valle G, Puglielli L. A TrkA to p75 NTR molecular switch activates amyloid beta-peptide generation during aging. Biochem J. 2005a;391:59–67. doi: 10.1042/BJ20050700. [DOI] [PMC free article] [PubMed] [Google Scholar]
- Costantini C, Rossi F, Formaggio E, Bernardoni R, Cecconi D, Della-Bianca V. Characterization of the signaling pathway downstream p75 neurotrophin receptor involved in beta-amyloid peptide-dependent cell death. J Mol Neurosci. 2005b;25:141–156. doi: 10.1385/JMN:25:2:141. [DOI] [PubMed] [Google Scholar]
- Costantini C, Scrable H, Puglielli L. An aging pathway controls the TrkA to p75NTR receptor switch and amyloid beta-peptide generation. EMBO J. 2006;25:1997–2006. doi: 10.1038/sj.emboj.7601062. [DOI] [PMC free article] [PubMed] [Google Scholar]
- Coulson EJ. Does the p75 neurotrophin receptor mediate Abeta-induced toxicity in Alzheimer's disease? J Neurochem. 2006;98:654–660. doi: 10.1111/j.1471-4159.2006.03905.x. [DOI] [PubMed] [Google Scholar]
- Coulson EJ, May LM, Sykes AM, Hamlin AS. The role of the p75 neurotrophin receptor in cholinergic dysfunction in Alzheimer's disease. Neuroscientist. 2009;15:317–323. doi: 10.1177/1073858408331376. [DOI] [PubMed] [Google Scholar]
- Dahlgren KN, Manelli AM, Stine WB, Jr, Baker LK, Krafft GA, LaDu MJ. Oligomeric and fibrillar species of amyloid-beta peptides differentially affect neuronal viability. J Biol Chem. 2002;277:32046–32053. doi: 10.1074/jbc.M201750200. [DOI] [PubMed] [Google Scholar]
- Dechant G, Barde YA. The neurotrophin receptor p75(NTR): novel functions and implications for diseases of the nervous system. Nat Neurosci. 2002;5:1131–1136. doi: 10.1038/nn1102-1131. [DOI] [PubMed] [Google Scholar]
- Fombonne J, Rabizadeh S, Banwait S, Mehlen P, Bredesen DE. Selective vulnerability in Alzheimer's disease: amyloid precursor protein and p75(NTR) interaction. Ann Neurol. 2009;65:294–303. doi: 10.1002/ana.21578. [DOI] [PMC free article] [PubMed] [Google Scholar]
- Frick KM, Fernandez SM. Enrichment enhances spatial memory and increases synaptophysin levels in aged female mice. Neurobiol Aging. 2003;24:615–626. doi: 10.1016/s0197-4580(02)00138-0. [DOI] [PubMed] [Google Scholar]
- Frid P, Anisimov SV, Popovic N. Congo red and protein aggregation in neurodegenerative diseases. Brain Res Rev. 2007;53:135–160. doi: 10.1016/j.brainresrev.2006.08.001. [DOI] [PubMed] [Google Scholar]
- Friedman WJ. Neurotrophins induce death of hippocampal neurons via the p75 receptor. J Neurosci. 2000;20:6340–6346. doi: 10.1523/JNEUROSCI.20-17-06340.2000. [DOI] [PMC free article] [PubMed] [Google Scholar]
- George AJ, Holsinger RM, McLean CA, Laughton KM, Beyreuther K, Evin G, Masters CL, Li QX. APP intracellular domain is increased and soluble Abeta is reduced with diet-induced hypercholesterolemia in a transgenic mouse model of Alzheimer disease. Neurobiol Dis. 2004;16:124–132. doi: 10.1016/j.nbd.2004.01.009. [DOI] [PubMed] [Google Scholar]
- Ginsberg SD, Che S, Wuu J, Counts SE, Mufson EJ. Down regulation of trk but not p75NTR gene expression in single cholinergic basal forebrain neurons mark the progression of Alzheimer's disease. J Neurochem. 2006;97:475–487. doi: 10.1111/j.1471-4159.2006.03764.x. [DOI] [PubMed] [Google Scholar]
- Gowrishankar K, Zeidler MG, Vincenz C. Release of a membrane-bound death domain by gamma-secretase processing of the p75NTR homolog NRADD. J Cell Sci. 2004;117:4099–4111. doi: 10.1242/jcs.01263. [DOI] [PubMed] [Google Scholar]
- Greferath U, Bennie A, Kourakis A, Bartlett PF, Murphy M, Barrett GL. Enlarged cholinergic forebrain neurons and improved spatial learning in p75 knockout mice. Eur J Neurosci. 2000;12:885–893. doi: 10.1046/j.1460-9568.2000.00976.x. [DOI] [PubMed] [Google Scholar]
- Hardy J, Selkoe DJ. The amyloid hypothesis of Alzheimer's disease: progress and problems on the road to therapeutics. Science. 2002;297:353–356. doi: 10.1126/science.1072994. [DOI] [PubMed] [Google Scholar]
- Hatchett CS, Tyler S, Armstrong D, Dawbarn D, Allen SJ. Familial Alzheimer's disease presenilin 1 mutation M146V increases gamma secretase cutting of p75NTR in vitro. Brain Res. 2007;1147:248–255. doi: 10.1016/j.brainres.2007.02.002. [DOI] [PubMed] [Google Scholar]
- Hu XY, Zhang HY, Qin S, Xu H, Swaab DF, Zhou JN. Increased p75(NTR) expression in hippocampal neurons containing hyperphosphorylated tau in Alzheimer patients. Exp Neurol. 2002;178:104–111. doi: 10.1006/exnr.2002.8018. [DOI] [PubMed] [Google Scholar]
- Huber LJ, Chao MV. Mesenchymal and neuronal cell expression of the p75 neurotrophin receptor gene occur by different mechanisms. Dev Biol. 1995;167:227–238. doi: 10.1006/dbio.1995.1019. [DOI] [PubMed] [Google Scholar]
- Ida N, Hartmann T, Pantel J, Schröder J, Zerfass R, Förstl H, Sandbrink R, Masters CL, Beyreuther K. Analysis of heterogeneous A4 peptides in human cerebrospinal fluid and blood by a newly developed sensitive Western blot assay. J Biol Chem. 1996;271:22908–22914. doi: 10.1074/jbc.271.37.22908. [DOI] [PubMed] [Google Scholar]
- Jankowsky JL, Slunt HH, Ratovitski T, Jenkins NA, Copeland NG, Borchelt DR. Co-expression of multiple transgenes in mouse CNS: a comparison of strategies. Biomol Eng. 2001;17:157–165. doi: 10.1016/s1389-0344(01)00067-3. [DOI] [PubMed] [Google Scholar]
- Jung KM, Tan S, Landman N, Petrova K, Murray S, Lewis R, Kim PK, Kim DS, Ryu SH, Chao MV, Kim TW. Regulated intramembrane proteolysis of the p75 neurotrophin receptor modulates its association with the TrkA receptor. J Biol Chem. 2003;278:42161–42169. doi: 10.1074/jbc.M306028200. [DOI] [PubMed] [Google Scholar]
- Knowles JK, Rajadas J, Nguyen TV, Yang T, LeMieux MC, Vander Griend L, Ishikawa C, Massa SM, Wyss-Coray T, Longo FM. The p75 neurotrophin receptor promotes amyloid-β(1–42)-induced neuritic dystrophy in vitro and in vivo. J Neurosci. 2009;29:10627–10637. doi: 10.1523/JNEUROSCI.0620-09.2009. [DOI] [PMC free article] [PubMed] [Google Scholar]
- Koliatsos VE, Applegate MD, Knüsel B, Junard EO, Burton LE, Mobley WC, Hefti FF, Price DL. Recombinant human nerve growth factor prevents retrograde degeneration of axotomized basal forebrain cholinergic neurons in the rat. Exp Neurol. 1991;112:161–173. doi: 10.1016/0014-4886(91)90066-l. [DOI] [PubMed] [Google Scholar]
- Koo EH, Squazzo SL. Evidence that production and release of amyloid beta-protein involves the endocytic pathway. J Biol Chem. 1994;269:17386–17389. [PubMed] [Google Scholar]
- Kuner P, Schubenel R, Hertel C. Beta-amyloid binds to p75NTR and activates NFkappaB in human neuroblastoma cells. J Neurosci Res. 1998;54:798–804. doi: 10.1002/(SICI)1097-4547(19981215)54:6<798::AID-JNR7>3.0.CO;2-T. [DOI] [PubMed] [Google Scholar]
- Lacor PN, Buniel MC, Furlow PW, Clemente AS, Velasco PT, Wood M, Viola KL, Klein WL. Aβ oligomer-induced aberrations in synapse composition, shape, and density provide a molecular basis for loss of connectivity in Alzheimer's disease. J Neurosci. 2007;27:796–807. doi: 10.1523/JNEUROSCI.3501-06.2007. [DOI] [PMC free article] [PubMed] [Google Scholar]
- Lambert MP, Barlow AK, Chromy BA, Edwards C, Freed R, Liosatos M, Morgan TE, Rozovsky I, Trommer B, Viola KL, Wals P, Zhang C, Finch CE, Krafft GA, Klein WL. Diffusible, nonfibrillar ligands derived from Abeta1–42 are potent central nervous system neurotoxins. Proc Natl Acad Sci U S A. 1998;95:6448–6453. doi: 10.1073/pnas.95.11.6448. [DOI] [PMC free article] [PubMed] [Google Scholar]
- Lee KF, Li E, Huber LJ, Landis SC, Sharpe AH, Chao MV, Jaenisch R. Targeted mutation of the gene encoding the low affinity NGF receptor p75 leads to deficits in the peripheral sensory nervous system. Cell. 1992;69:737–749. doi: 10.1016/0092-8674(92)90286-l. [DOI] [PubMed] [Google Scholar]
- LeVine H., 3rd Thioflavine T interaction with synthetic Alzheimer's disease beta-amyloid peptides: detection of amyloid aggregation in solution. Protein Sci. 1993;2:404–410. doi: 10.1002/pro.5560020312. [DOI] [PMC free article] [PubMed] [Google Scholar]
- Ma QL, Lim GP, Harris-White ME, Yang F, Ambegaokar SS, Ubeda OJ, Glabe CG, Teter B, Frautschy SA, Cole GM. Antibodies against beta-amyloid reduce Abeta oligomers, glycogen synthase kinase-3beta activation and tau phosphorylation in vivo and in vitro. J Neurosci Res. 2006;83:374–384. doi: 10.1002/jnr.20734. [DOI] [PubMed] [Google Scholar]
- Malaplate-Armand C, Florent-Béchard S, Youssef I, Koziel V, Sponne I, Kriem B, Leininger-Muller B, Olivier JL, Oster T, Pillot T. Soluble oligomers of amyloid-beta peptide induce neuronal apoptosis by activating a cPLA2-dependent sphingomyelinase-ceramide pathway. Neurobiol Dis. 2006;23:178–189. doi: 10.1016/j.nbd.2006.02.010. [DOI] [PubMed] [Google Scholar]
- Markowska AL, Long JM, Johnson CT, Olton DS. Variable-interval probe test as a tool for repeated measurements of spatial memory in the water maze. Behav Neurosci. 1993;107:627–632. doi: 10.1037//0735-7044.107.4.627. [DOI] [PubMed] [Google Scholar]
- Nakagawa Y, Reed L, Nakamura M, McIntosh TK, Smith DH, Saatman KE, Raghupathi R, Clemens J, Saido TC, Lee VM, Trojanowski JQ. Brain trauma in aged transgenic mice induces regression of established abeta deposits. Exp Neurol. 2000;163:244–252. doi: 10.1006/exnr.2000.7375. [DOI] [PubMed] [Google Scholar]
- Naumann T, Casademunt E, Hollerbach E, Hofmann J, Dechant G, Frotscher M, Barde YA. Complete deletion of the neurotrophin receptor p75NTR leads to long-lasting increases in the number of basal forebrain cholinergic neurons. J Neurosci. 2002;22:2409–2418. doi: 10.1523/JNEUROSCI.22-07-02409.2002. [DOI] [PMC free article] [PubMed] [Google Scholar]
- Podlesniy P, Kichev A, Pedraza C, Saurat J, Encinas M, Perez B, Ferrer I, Espinet C. Pro-NGF from Alzheimer's disease and normal human brain displays distinctive abilities to induce processing and nuclear translocation of intracellular domain of p75NTR and apoptosis. Am J Pathol. 2006;169:119–131. doi: 10.2353/ajpath.2006.050787. [DOI] [PMC free article] [PubMed] [Google Scholar]
- Salehi A, Ocampo M, Verhaagen J, Swaab DF. p75 neurotrophin receptor in the nucleus basalis of meynert in relation to age, sex, and Alzheimer's disease. Exp Neurol. 2000;161:245–258. doi: 10.1006/exnr.1999.7252. [DOI] [PubMed] [Google Scholar]
- Sotthibundhu A, Sykes AM, Fox B, Underwood CK, Thangnipon W, Coulson EJ. β-Amyloid1–42 induces neuronal death through the p75 neurotrophin receptor. J Neurosci. 2008;28:3941–3946. doi: 10.1523/JNEUROSCI.0350-08.2008. [DOI] [PMC free article] [PubMed] [Google Scholar]
- Stine WB, Jr, Dahlgren KN, Krafft GA, LaDu MJ. In vitro characterization of conditions for amyloid-beta peptide oligomerization and fibrillogenesis. J Biol Chem. 2003;278:11612–11622. doi: 10.1074/jbc.M210207200. [DOI] [PubMed] [Google Scholar]
- Thinakaran G, Koo EH. APP trafficking, processing and function. J Biol Chem. 2008;283:29615–29619. doi: 10.1074/jbc.R800019200. [DOI] [PMC free article] [PubMed] [Google Scholar]
- Tuszynski MH, Roberts J, Senut MC U HS, Gage FH. Gene therapy in the adult primate brain: intraparenchymal grafts of cells genetically modified to produce nerve growth factor prevent cholinergic neuronal degeneration. Gene Ther. 1996;3:305–314. [PubMed] [Google Scholar]
- Tuszynski MH, Smith DE, Roberts J, McKay H, Mufson E. Targeted intraparenchymal delivery of human NGF by gene transfer to the primate basal forebrain for 3 months does not accelerate beta-amyloid plaque deposition. Exp Neurol. 1998;154:573–582. doi: 10.1006/exnr.1998.6956. [DOI] [PubMed] [Google Scholar]
- Volosin M, Trotter C, Cragnolini A, Kenchappa RS, Light M, Hempstead BL, Carter BD, Friedman WJ. Induction of proneurotrophins and activation of p75NTR-mediated apoptosis via neurotrophin receptor-interacting factor in hippocampal neurons after seizures. J Neurosci. 2008;28:9870–9879. doi: 10.1523/JNEUROSCI.2841-08.2008. [DOI] [PMC free article] [PubMed] [Google Scholar]
- von Schack D, Casademunt E, Schweigreiter R, Meyer M, Bibel M, Dechant G. Complete ablation of the neurotrophin receptor p75NTR causes defects both in the nervous and the vascular system. Nat Neurosci. 2001;4:977–978. doi: 10.1038/nn730. [DOI] [PubMed] [Google Scholar]
- Wang YJ, Zhou HD, Zhou XF. Clearance of amyloid-beta in Alzheimer's disease: progress, problems and perspectives. Drug Discov Today. 2006a;11:931–938. doi: 10.1016/j.drudis.2006.08.004. [DOI] [PubMed] [Google Scholar]
- Wang YJ, Pollard AN, Zhou HD, Zhong JH, Zhou XF. Proceedings of the Australian Neuroscience Society. Sydney: Australian Neuroscience Society; 2006b. Characterization of an Alzheimer's disease mouse model bearing mutant genes of amyloid precursor protein and human presenilin; p. 150. [Google Scholar]
- Wang YJ, Pollard A, Zhong JH, Dong XY, Wu XB, Zhou HD, Zhou XF. Intramuscular delivery of a single chain antibody gene reduces brain Abeta burden in a mouse model of Alzheimer's disease. Neurobiol Aging. 2009a;30:364–376. doi: 10.1016/j.neurobiolaging.2007.06.013. [DOI] [PubMed] [Google Scholar]
- Wang YJ, Thomas P, Zhong JH, Bi FF, Kosaraju S, Pollard A, Fenech M, Zhou XF. Consumption of grape seed extract prevents amyloid-beta deposition and attenuates inflammation in brain of an Alzheimer's disease mouse. Neurotox Res. 2009b;15:3–14. doi: 10.1007/s12640-009-9000-x. [DOI] [PubMed] [Google Scholar]
- Wang YJ, Zhou HD, Zhou XF. Modified immunotherapies against Alzheimer's disease: toward safer and effective amyloid-beta clearance. J Alzheimers Dis. 2010a;21:1065–1075. doi: 10.3233/jad-2010-100195. [DOI] [PubMed] [Google Scholar]
- Wang YJ, Gao CY, Yang M, Liu XH, Sun Y, Pollard A, Dong XY, Wu XB, Zhong JH, Zhou HD, Zhou XF. Intramuscular delivery of a single chain antibody gene prevents brain Abeta deposition and cognitive impairment in a mouse model of Alzheimer's disease. Brain Behav Immun. 2010b;24:1281–1293. doi: 10.1016/j.bbi.2010.05.010. [DOI] [PubMed] [Google Scholar]
- Wang YJ, Valadares D, Sun Y, Wang X, Zhong JH, Liu XH, Majd S, Chen L, Gao CY, Chen S, Lim Y, Pollard A, Aguilar E, Gai WP, Yang M, Zhou XF. Effects of proNGF on neuronal viability, neurite growth and amyloid-beta metabolism. Neurotox Res. 2010c;17:257–267. doi: 10.1007/s12640-009-9098-x. [DOI] [PubMed] [Google Scholar]
- Weskamp G, Schlöndorff J, Lum L, Becherer JD, Kim TW, Saftig P, Hartmann D, Murphy G, Blobel CP. Evidence for a critical role of the tumor necrosis factor alpha convertase (TACE) in ectodomain shedding of the p75 neurotrophin receptor (p75NTR) J Biol Chem. 2004;279:4241–4249. doi: 10.1074/jbc.M307974200. [DOI] [PubMed] [Google Scholar]
- Woo NH, Teng HK, Siao CJ, Chiaruttini C, Pang PT, Milner TA, Hempstead BL, Lu B. Activation of p75NTR by proBDNF facilitates hippocampal long-term depression. Nat Neurosci. 2005;8:1069–1077. doi: 10.1038/nn1510. [DOI] [PubMed] [Google Scholar]
- Yaar M, Zhai S, Pilch PF, Doyle SM, Eisenhauer PB, Fine RE, Gilchrest BA. Binding of beta-amyloid to the p75 neurotrophin receptor induces apoptosis. A possible mechanism for Alzheimer's disease. J Clin Invest. 1997;100:2333–2340. doi: 10.1172/JCI119772. [DOI] [PMC free article] [PubMed] [Google Scholar]
- Yaar M, Zhai S, Fine RE, Eisenhauer PB, Arble BL, Stewart KB, Gilchrest BA. Amyloid beta binds trimers as well as monomers of the 75-kDa neurotrophin receptor and activates receptor signaling. J Biol Chem. 2002;277:7720–7725. doi: 10.1074/jbc.M110929200. [DOI] [PubMed] [Google Scholar]
- Yau JL, McNair KM, Noble J, Brownstein D, Hibberd C, Morton N, Mullins JJ, Morris RG, Cobb S, Seckl JR. Enhanced hippocampal long-term potentiation and spatial learning in aged 11β-hydroxysteroid dehydrogenase type 1 knock-out mice. J Neurosci. 2007;27:10487–10496. doi: 10.1523/JNEUROSCI.2190-07.2007. [DOI] [PMC free article] [PubMed] [Google Scholar]
- Yeo TT, Chua-Couzens J, Butcher LL, Bredesen DE, Cooper JD, Valletta JS, Mobley WC, Longo FM. Absence of p75NTR causes increased basal forebrain cholinergic neuron size, choline acetyltransferase activity, and target innervation. J Neurosci. 1997;17:7594–7605. doi: 10.1523/JNEUROSCI.17-20-07594.1997. [DOI] [PMC free article] [PubMed] [Google Scholar]
- Zampieri N, Xu CF, Neubert TA, Chao MV. Cleavage of p75 neurotrophin receptor by alpha-secretase and gamma-secretase requires specific receptor domains. J Biol Chem. 2005;280:14563–14571. doi: 10.1074/jbc.M412957200. [DOI] [PubMed] [Google Scholar]
- Zhang Y, Hong Y, Bounhar Y, Blacker M, Roucou X, Tounekti O, Vereker E, Bowers WJ, Federoff HJ, Goodyer CG, LeBlanc A. p75 neurotrophin receptor protects primary cultures of human neurons against extracellular amyloid β peptide cytotoxicity. J Neurosci. 2003;23:7385–7394. doi: 10.1523/JNEUROSCI.23-19-07385.2003. [DOI] [PMC free article] [PubMed] [Google Scholar]