

Abstract
Clinical evidence suggests that cortical excitability is increased in depressives. We investigated its cellular basis in a mouse model of depression. In a modified version of forced swimming (FS), mice were initially forced to swim for 5 consecutive days and then were treated daily with repetitive transcranial magnetic stimulation (rTMS) or sham treatment for the following 4 weeks without swimming. On day 2 through day 5, the mice manifested depression-like behaviors. The next and last FS was performed 4 weeks later, which revealed a 4 week maintenance of depression-like behavior in the sham mice. In slices from the sham controls, excitability in cingulate cortex pyramidal cells was elevated in terms of membrane potential and frequencies of spikes evoked by current injection. Depolarized resting potential was shown to depend on suppression of large conductance calcium-activated potassium (BK) channels. This BK channel suppression was confirmed by measuring spike width, which depends on BK channels. Chronic rTMS treatment during the 4 week period significantly reduced the depression-like behavior. In slices obtained from the rTMS mice, normal excitability and BK channel activity were recovered. Expression of a scaffold protein Homer1a was reduced by the FS and reversed by rTMS in the cingulate cortex. Similar recovery in the same behavioral, electrophysiological, and biochemical features was observed after chronic imipramine treatment. The present study demonstrated that manifestation and disappearance of depression-like behavior are in parallel with increase and decrease in cortical neuronal excitability in mice and suggested that regulation of BK channels by Homer1a is involved in this parallelism.
Introduction
A number of hypotheses have been proposed for depression pathogenesis. The monoamine hypothesis is supported, because monoaminergic networks are targets of antidepressant drugs (Schildkraut, 1965; Coppen and Wood, 1983). The neuroplasticity hypothesis emerged from the rapid acceptance of adult neuroneogenesis combined with clinical findings such as the reduced hippocampal volume in depressives (Manji and Duman, 2001). Along with other promising hypotheses (Nestler et al., 2002), an emerging line of clinical evidence seems to be consolidated into yet another concept. Cortical excitability is shown to be increased in depressives (Bajbouj et al., 2006b) and normalized by treatments with transcranial magnetic stimulation (TMS; Bajbouj et al., 2005) or electroconvulsive therapy (ECT; Bajbouj et al., 2006a). These reports indicate an association between cortical excitability and depression, although other data on patients' brain activity, based on cerebral blood flow or glucose metabolism, do not necessarily agree with a generalized increase in cortical excitability (Paus and Barrett, 2004). Underpinning increased excitability, cortical GABA content was shown to be reduced in depressives (Sanacora et al., 1999) and recovered by ECT (Sanacora et al., 2003) or drugs (Sanacora et al., 2002). In contrast to these studies on inhibitory circuits, the excitatory component has not been studied in this light.
Our previous experiments (Sakagami et al., 2005; Kato, 2009) may provide a suitable platform to examine altered properties of excitatory neurons in depression model animals. In rats subjected to a model ECT [electroconvulsive shock (ECS)], we revealed that cortical pyramidal cell excitability was reduced, depending on Homer1a. Homer1, implicated in the etiology of major depression (Rietschel et al., 2010), is a member of the scaffold protein family Homer and consists of two splice variants (Brakeman et al., 1997; Kato et al., 1997). Homer1b/c, a constitutively expressed variant, binds to receptors, including metabotropic glutamate receptors (mGluRs), and cross-links them by self-dimerization. The other variant Homer1a is activity-dependently expressed and misses the dimerizing domain, therefore serving as a dominant-negative regulator against Homer1b/c. As a second role, Homer1a can activate group I mGluRs from inside neurons (Ango et al., 2001). ECS induces a massive Homer1a expression (>6-fold; Altar et al., 2004). We showed that ECS-induced Homer1a activates mGluRs, eventually facilitating large conductance calcium-activated potassium (BK, “big K(Ca)”) channels (Sakagami et al., 2005). In these experiments, however, pyramidal cell excitability reduced by the model treatment was demonstrated in normal animals, but not in depression models.
In the present experiments, depression model mice were prepared by a modified version of the forced swimming paradigm, and treatment of depression-like behavior by TMS was attempted in lieu of ECS. TMS is used as a less invasive alternative to ECT for treatment of major depression (Paus and Barrett, 2004; O'Reardon et al., 2007; Janicak et al., 2008; Rossi et al., 2009). These two methods are reasonably estimated to share common neurobiological mechanisms (Fujiki and Steward, 1997; Zyss et al., 1997; Lisanby and Belmaker, 2000). By using these model mice and the model treatment, the present study investigates association of cortical pyramidal cell excitability and depression-like behavior.
Materials and Methods
Animals.
All experiments were performed in accordance with the guiding principles of the Physiological Society of Japan and with the approval of the Animal Care Committee of Kanazawa Medical University (Uchinada, Ishikawa, Japan). C57BL/6 male mice (15–20 weeks old; 23–36 g-weight) were kept under an automatic day–night control (12:12 h) and allowed ad libitum access to food and water.
Behavioral studies.
For forced swimming, a transparent cylinder of acrylate (24 cmϕ, 60 cm high) filled with 25°C water (25 cm deep) was used. The mice were forced to swim for 10 min daily for 5 consecutive days (on days 1–5) and on day 32, all of which was video recorded into a PC, and the swimming trajectory was analyzed by ANY-Maze, a video tracking software (Stoelting).
Repetitive transcranial magnetic stimulation.
Repetitive transcranial magnetic stimulation (rTMS) was delivered with a magnetic stimulator designed for clinical use (Magstim Rapid, MRS1000/50, Magstim Company). Biphasic magnetic pulses were delivered: pulse rise time, 60 μs; pulse duration, 250 μs. The strength of the pulse was 80% of the maximum output of the machine. Animals were gently held by hand with the aid of a plastic cylinder, and a small figure 8-shaped coil for rodents (5 cmϕ) was then placed over the skull with a direct contact to the head skin. The longitudinal axis of the coil was oriented vertical to the midline, and the center of the coil was positioned approximately over the bregma region. Stimulation intensity was as large as to cause muscle twitch in the lower extremities, which was detected manually by the experimenter. Since the coil is flat and designed for superficial stimulation, we considered that the lower extremity twitch means that the present TMS affected a widely extended area of the cerebral cortex. Nevertheless, on the basis of the present coil position and orientation, it may be estimated that the direction of the generated magnetic field is in the rostrocaudal direction, with the resultant electric field parallel to the cortical surface. A chronic, high-frequency rTMS was applied daily at 10 Hz for 5 s once a day for 4 weeks. Sham-treated mice were handled similarly to those treated with TMS and heard the same click sound but did not receive stimulation.
Thus, the present study relied upon one particular stimulation protocol, with which 50 pulses were delivered each day. The daily number of stimulations was therefore much smaller than that in protocols for treatment of human depressives, in which cortices are often stimulated roughly 1000 times a day (Paus and Barrett, 2004). In experiments with rodent depression models or those relevant to its neurobiological mechanisms, the total number and the frequency of often used stimulation were summarized to range from 100 to 10,000 and from 15 to 20 Hz, respectively (Post and Keck, 2001). The total number in the present protocol, i.e., 1400, fits within this range. The frequency (10 Hz) is slightly lower but is still categorized as a high-frequency stimulation.
Slice experiments.
Mice used for behavioral studies were killed by decapitation under ether anesthesia. The brain was dissected out and soaked into a medium (pH 7.4; 25°C) containing the following (in mm): 124 NaCl, .3.3 KCl, 1.3 KH2PO4, 26 NaHCO3, 2.5 CaCl2, 2.0 MgSO4, and 10 glucose. Slices of the cingulate cortex were cut with a slicer at 200 μm (Zero-1, Dosaka). Frontal sections were made from the region corresponding to the dorsal and ventral anterior cingulate cortical areas defined by an atlas (Hof et al., 2000). Slices were placed in a recording chamber on the stage of an upright microscope (Eclipse E600FN, Nikon) with a ×40 water-immersion objective (Fluor 40X0.80W, Nikon). The chamber was continuously perfused with medium (25°C) and bubbled with a mixture of 95% O2 and 5% CO2. For recording, we used patch pipettes (resistance, 4–10 MΩ) filled with a solution (pH 7.3) containing the following (in mm): 130 K-gluconate, 10 KCl, 2 MgCl2, 2 Na-ATP, 0.4 Na-GTP, 0.2 EGTA, 10 HEPES, 5 K2-Phosphocreatine, with pH adjusted to 7.2–7.3 using KOH. Whole-cell recordings were made from layer II/III pyramidal cells that had sufficiently negative resting membrane potentials (≤55 mV) without spontaneous action potentials. Membrane potentials were recorded in the current-clamp mode (Axoclamp 200A and B, Molecular Devices) and digitized at 10 kHz (Digidata 1322 and pCLAMP10, Molecular Devices).
To assess membrane excitability of recorded neurons, depolarizing currents (0.05–0.5 nA for 500 ms) were injected through the patch pipette. Currents of varying intensities were injected every 1 min, and spikes were elicited repetitively. The firing pattern was typical to regular spiking neurons (McCormick et al., 1985). To assess the spike width, a train of five pulses of depolarizing currents were injected at 100 Hz. The duration (4–5 ms) and intensity of injected currents were adjusted in such a way that each pulse evoked a single spike. The time point of spike initiation was easily determined because of a clear deflection of the membrane potential at the transition from the passive to active phase of voltage rising. Based on the voltage at this spike initiation and that at the peak, the spike half-height was calculated. On the depolarizing and repolarizing phases of the spike, the two time points corresponding to this spike half-height were determined. The spike half-width was defined as the time length between these two time points.
Quantitative real-time PCR.
After the behavioral test, three mice from each experimental group were killed for PCR. Cerebral cortical tissue was rapidly dissected out, placed into liquid nitrogen, and then stored at −80°C until used for mRNA extraction with an RNeasy lipid tissue kit (QIAGEN). Reverse transcription was done with SuperScript III First-Strand Synthesis SuperMix for quantitative real-time PCR (Life Technologies). We used an Applied Biosystems 7900HT Real-Time PCR System with TaqMan probes and the other requisite chemicals following the manufacturer's indications (Applied Biosystems). Measurement was based on the ΔΔCt cycle threshold method. Sets of probes and primers (relevant gene) were as follows: Mm00607939_s1 (β-actin); Mm00516078_m1 (BK channel; potassium large conductance calcium-activated channel, subfamily M, α member 1); 5′-FAM-AGCAGCGCCTTGAGTTCTTGTGGCTA-TAMRA-3′ (Homer 1a probe), 5′-TGTCCTGCTGTAAATAAAGCCATCT-3′ (Homer 1a forward primer). AGTATAATCATCTTAACTATCTAGCACCTTCTG (Homer 1a backward); 5′-FAM-CGAACCCAGGCCCTCTCTCATGCT-TAMRA-3′ (Homer 1c probe), ACACCCGATGTGACACAGAACT (Homer 1c forward), TCAACCTCCCAGTGGTTGCT (Homer 1c backward); where FAM is 6-carboxyfluorescein and TAMRA is 6-carboxytetramethylrhodamine. Expression of BK channel, Homer1a, and Homer1b/c genes was first standardized by expression of β-actin in the same sample obtained from one mouse. For each experimental group, two samples from three individuals, i.e., six samples in total, were subjected to RT-PCR analysis. These six samples of β-actin-standardized data were averaged and expressed relatively to the naive control [Control (non-forced swimming)].
Western blot.
Cingulate cortex was obtained from mice after various treatments and homogenized in cold lysis buffer (lithium lauryl sulfate, 2%; aprotinin, 1.7 mg/ml; phenylmethylsulfonyl fluoride, 10 mg/ml; sodium orthovanadate, 1 mm). The homogenate was centrifuged at 15,000 rpm for 15 min at 4°C. Supernatants were collected, and then the protein concentration was determined with an assay kit based on the Bradford method (Bio-Rad). Protein samples (40 μg) were heated at 90°C in SDS polyacrylamide sample buffer, analyzed by SDS-PAGE with 5–15% or 10–20% Ready Gels (Bio-Rad), and transferred to nitrocellulose membrane following standard Western blotting procedures. After blocking with a skim milk solution (5%), immunoblotting was done with goat anti-Homer1a (1:500; SC8922; Santa Cruz Biotechnology) and rabbit anti-β-actin antibodies (1:2000; IMG-5142A; Imgenex). After reaction with HRP-conjugated secondary antibodies (donkey anti-goat IgG, 1:1000. HAF109, R&D Systems; goat anti-rabbit IgG, 1:1000, catalog no. 32460, Thermo Scientific), bands at 30 kDa (Homer1a) and 42 kDa (β-actin) were detected with a chemiluminescence substrate kit (SuperSignal West Femto kit, Thermo Scientific) and a detector (LAS-4000, FUJIFILM). The band intensities were quantified by using ImageJ software.
Drugs used.
Imipramine (Imi) was injected (i.p.) once a day for 4 weeks (15 mg/kg daily), while the sham group (Imi-Sham) received an injection of saline (0.2 ml). Charybdotoxin (50 nm; Alomone), a blocker for the large conductance calcium-activated potassium BK channel, was applied into the bath. Anti-BK channel antibody against intracellular C terminus (3 μg/ml; Alomone) was included in an internal solution of patch pipettes. Recording was started 10 min after whole-cell break-in so that the antibody was allowed to diffuse into recorded neurons.
Data analysis.
Data are expressed as averages ± SEM. For statistics, pairwise or unpaired t tests and repeated-measure or one-way ANOVA followed by t tests with Bonferroni corrections or by Tukey's HSD (Honestly Significant Difference) test were used (SPSS, version 18; Japan IBM). The significance level was set at p < 0.05.
Results
Modified forced swimming
In the original, 2 day version of forced swimming (FS) for rats, it was reported that the first day of swimming made the swimming distance shorter and the immobility time longer on the second day (Porsolt et al., 1977, 1978). This clearly indicates that swimming on one day should affect the swimming on the next day and that testing itself unavoidably induces a further advancement of depression-like behavior. Such a dual nature of the FS test may well have complicated interpretation of the results when test and treatment procedures were performed in parallel (Sachdev et al., 2002; Kim et al., 2006). To overcome this dual nature and make the best of this widely used test paradigm, we attempted to separate the induction and test phases of the FS.
For this purpose, mice were forced to swim for 10 min daily for 5 days. The immobility time and total distance traveled on day 1 were 158.3 ± 23.1 s and 26.9 ± 1.7 m (N = 10; Fig. 1A,B). These two indices for the immobility were significantly changed on day 2, with the immobility time increased to 335.7 ± 28.9 s and the distance reduced to 12.1 ± 0.9 m. These changes were preserved up to day 5 (425.6 ± 30.8 s and 7.4 ± 0.6 m). The two indices were both significantly different on days 2 through 5 as compared with those on day 1 (always p < 0.001). From day 6 on, these mice were kept in the home cage without swimming for 4 weeks, after which a last swim was imposed on day 32. In this swim, the immobility time (385.8 ± 29.8 s) or distance traveled (7.1 ± 0.9 m) was not significantly different from those on day 5 (425 ± 16.5 s and 7.1 ± 0.9 m), indicating that the 4 week survival with no treatment failed to ameliorate the immobility induced by the present FS paradigm. The depression-like state thus turned out to be durable for 4 weeks without additional swimming, offering the possibility that the last FS session on day 32 could be used as a test session for detecting effects of therapeutic intervention during the preceding 4 week period.
Figure 1.
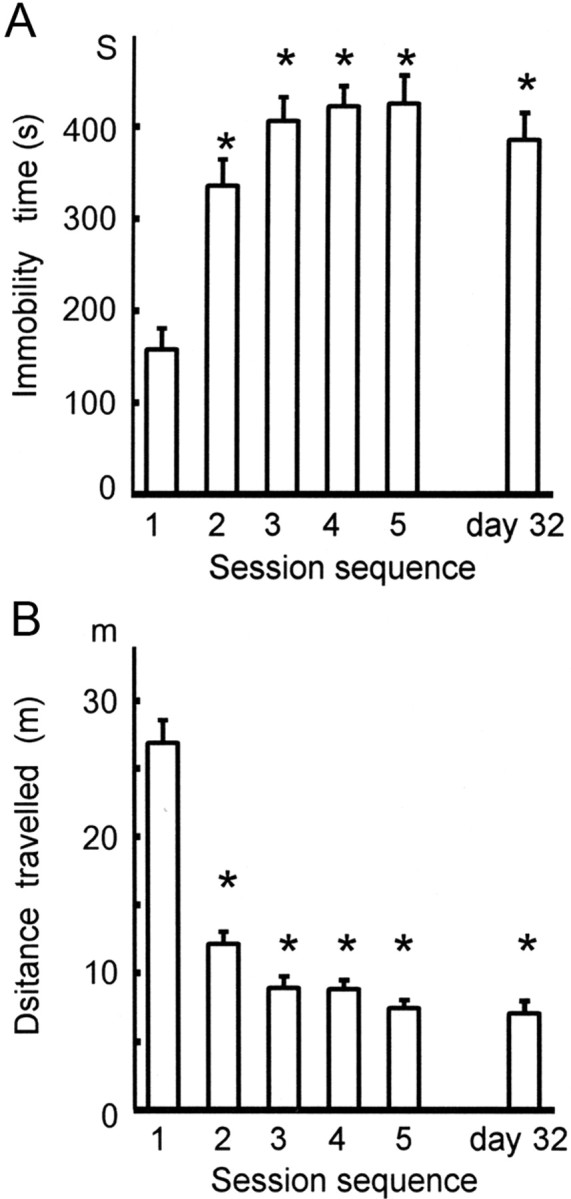
Immobility induced by the 5 day paradigm of forced swimming and its maintenance for 4 weeks. A, Immobility as assessed by the immobility time during the 5 consecutive days and on day 32. The immobility time (in seconds) over the 10 min swimming time was significantly shorter on day 1 than on days 2, 3, 4, 5, and 32. During the last 4 weeks there was no spontaneous recovery of the immobility time. One-way ANOVA followed by pairwise t tests with Bonferroni corrections was used for data shown in both A and B; *p < 0.001. B, As a mirror image of the graph in A, the total distance traveled (in meters) was significantly longer on day 1 than on days 2, 3, 4, 5, and 32. During the last 4 weeks, there was no spontaneous recovery of the distance traveled; *p < 0.001.
Recovery of depression-like behaviors with rTMS
In mice different from those described in Fig. 1, the effects of 4-week-long treatment with TMS were examined by using the same FS test (Fig. 2A,B). Imipramine treatment was also attempted to confirm the responsiveness of the present FS paradigm to imipramine, which is the hallmark of the original FS test (Porsolt et al., 1977, 1978). We compared changes in the two parameters of immobility, immobility time and distance traveled, between mice treated with rTMS [TMS(FS)] and those that were treated similarly bur received no stimulation [TMS Sham(FS)], and also between mice injected with imipramine [Imi(FS)] and those injected with saline [Imi Sham(FS)]. We added the labeling “(FS)” for the mouse groups once subjected to the FS and “(non-FS)” for those that never swam.
Figure 2.

Recovery of the FS-induced immobility by anti-depressant treatments. A, Four groups of mice were subjected to the 5 day FS and to different treatments during the following 4 weeks. On day 32, significant differences in the immobility time were observed between the groups treated with TMS [TMS(FS)] and sham TMS [TMS Sham(FS)] and between the groups treated with imipramine [Imi (FS)] and saline [Imi Sham(FS)]. On day 5, no significant differences were observed among the four groups. Since all the mice described in this figure had episodes of FS, the labeling “(FS)” was added to the group names for clarity. In the following figures also we labeled the mouse group in this way wherever applicable. For both A and B, unpaired t tests were used; *p < 0.05, **p < 0.005. B, Likewise, there was no significant change in the distance traveled on day 5. On day 32, however, significant differences in the distance traveled were detected between the TMS(FS) and TMS-Sham(FS) groups and between the Imi(FS) and Imi-Sham(FS) groups; *p < 0.05, **p < 0.001.
The immobility time on day 5 was not significantly different among the four groups: 400.0 ± 44.5 s [TMS(FS), N = 10], 420.1 ± 16.4 s [TMS Sham(FS), N = 9], 406.2 ± 14.9 s [Imi(FS), N = 6], and 354.0 ± 28.1 s [Imi Sham(FS), N = 6]. Likewise, the distance traveled was not significantly different: 7.3 ± 1.5 m [TMS(FS)], 7.3 ± 0.9 m [TMS Sham(FS)], 6.5 ± 0.7 m [Imi(FS)], and 8.6 ± 1.9 m [Imi Sham(FS)]. After 4 weeks of treatment, the immobility time on day 32 was significantly shorter in the TMS(FS) (230.6 ± 29.8 s) and Imi(FS) groups (215.0 ± 23.5 m) than in the respective controls [TMS-Sham(FS), 372.5 ± 30.2 s, p < 0.005; Imi-Sham(FS), 410.7 ± 42.0 s, p < 0.05]. The distance traveled was longer in the TMS(FS) (15.8 ± 1.6 m) and Imi(FS) groups (12.6 ± 0.9 m) than in the respective controls [TMS-Sham(FS), 7.3 ± 0.9 m, p < 0.001; Imi-Sham(FS), 7.0 ± 1.4 m, p < 0.05]. Thus, treatment with rTMS was found effective in normalizing the two immobility indices for the FS test, and the imipramine responsiveness confirmed the suitability of the present FS paradigm as an alternative to the original FS test.
There was a large variability in the scores among the groups on the first days, and the Imi-Sham(FS) mice exhibited a significantly higher mobility than the other groups (Fig. 2). On day 5, however, all the mice became nearly equally immobile. On day 32, despite the initial bias favoring a higher mobility, the Imi-Sham(FS) mice remained significantly less mobile than the Imi(FS) group. Therefore, we concluded that the initial bias in the Imi-Sham(FS) group had no serious influence on the present results and interpretations.
Increased cortical excitability in FS mice and its recovery by rTMS
In brain slices obtained from the mice used for behavior, we compared resting membrane potential in cingulate cortex upper layer pyramidal neurons under a current clamp (Fig. 3A). The resting membrane potential in the TMS-Sham(FS) group was significantly more depolarized [−64.9 ± 1.0 mV, N = 19, p < 0.001; TMS-Sham(FS)] than the naive control group [−69.5 ± 0.6 mV, N = 15, Control(non-FS)], suggesting that excitability in the cortex of the FS mouse [TMS-Sham(FS)] is increased in terms of the resting membrane potential. We have shown previously that ECS hyperpolarizes rat visual cortex pyramidal cells and reduces their excitability, which was dependent on facilitation of large conductance calcium-activated potassium (BK) channels (Sakagami et al., 2005; Kato, 2009). ECS is an animal model of ECT for human depressives, raising the possibility that the FS-induced depression-like behavior in the present study may also be related to changes in BK channel activity. To verify BK channel suppression with the FS, we used anti-BK channel antibody (Ab) and the BK channel blocker charybdotoxin (CTx) to block BK channels in neurons obtained from TMS-Sham(FS) mice as well as naive control mice [Control(non-FS)] (Fig. 3A). In TMS-Sham(FS) cells, blockade by neither Ab [−65.5 ± 1.4 mV, N = 15, TMS-Sham(FS)+Ab] nor CTx [−65.1 ± 1.1 mV, N = 18, TMS-Sham(FS)+CTx] significantly advanced the already observed depolarization in TMS-Sham(FS) cells [−64.9 ± 1.0 mV, N = 19, TMS-Sham(FS)], exhibiting occlusion of their blocking effects (Fig. 3C). In control cells, by contrast, blockade by Ab [−64.3 ± 1.6 mV, N = 25, Control(non-FS)+Ab] or CTx [−64.3 ± 1.6 mV, N = 7, Control(non-FS)+CTx] made the resting membrane potential significantly more depolarized than unblocked controls [−69.5 ± 0.6 mV, N = 15, p < 0.05, Control(non-FS)]. The occlusion of the blocking effects in TMS-Sham(FS) cells indicates that BK channels are already suppressed in these cells before applying the blocking agents.
Figure 3.
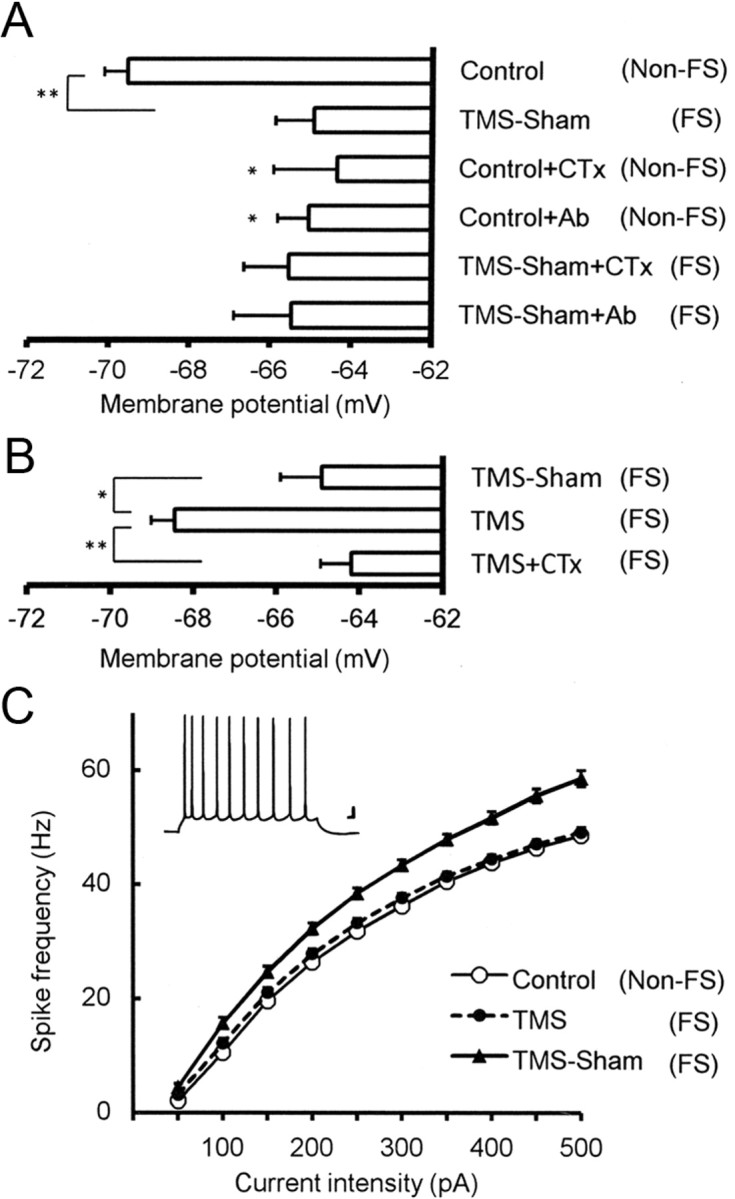
Electrophysiological properties in cingulate cortex pyramidal cells from FS mice and its responsiveness to rTMS treatment. A, Changes in resting membrane potential induced by the FS and BK channel blockade. Resting membrane potential (in mV) was significantly depolarized by the 5 day FS [TMS-Sham(FS)] as compared with the naive control [Control(non-FS)]. Since the naive controls were not subject to the FS, we added in the labeling “(non-FS)” for clarity. Effects of the BK channel blockade by an anti-BK channel antibody or the blocker charybdotoxin were occluded in the TMS-Sham(FS) group, but not in the control(non-FS) group. Resting membrane potential in TMS-Sham(FS) cells was not significantly depolarized either by Ab or CTx [TMS-Sham(FS)+Ab, TMS-Sham(FS)+CTx] and stayed at the level comparable to control(non-FS) neurons under BK channel blockade [Control(non-FS)+Ab, Control(non-FS)+CTx]. This indicates that BK channels are already suppressed in TMS-Sham(FS) cells without either blocking agent; *p < 0.05, **p < 0.001; one-way ANOVA followed by Tukey HSD tests for both A and B. B, Recovery of the resting membrane potential by rTMS in a manner dependent on BK channels. The resting membrane potential in the TMS(FS) group was significantly more hyperpolarized than that in TMS-Sham(FS) neurons and that in TMS(FS) neurons under BK channel blockade by CTx [TMS(FS)+CTx]. *p < 0.02, **p < 0.001. C, Frequencies of action potentials elicited by injecting depolarizing currents of various intensities. The frequency is significantly higher in TMS-Sham(FS) neurons than in those from the control and TMS(FS) groups, except with 50 pA (repeated measure ANOVA followed by Tukey HSD tests; for significance levels, see Results). Inset, Specimen recording of spikes evoked in a control neuron by an injection of 500-ms-long current (150 pA). Scale bars, 10 mV, 20 ms.
Then we examined the effect of TMS on the FS-induced suppression of BK channels (Fig. 3B). Comparison was made among the resting membrane potentials in TMS-Sham(FS) group neurons [−64.9 ± 1.0 mV, N = 19, TMS-Sham(FS)], TMS(FS) group neurons [−68.5 ± 0.6 mV, N = 15; TMS(FS)], and TMS(FS) group neurons treated with CTx [−64.2 ± 0.7, N = 29; TMS(FS)+CTx]. TMS(FS) group neurons were significantly more hyperpolarized than the TMS-Sham(FS) (p < 0.02) and TMS(FS)+CTx groups (p < 0.001), indicating that TMS is effective in normalizing the FS-induced depolarization in cortical pyramidal cells and that this TMS effect depends on BK channel facilitation.
To further confirm that the present FS test induces hyperexcitability in cortical neurons and that this is counteracted by TMS, we examined the frequency of action potentials evoked by injection of depolarizing currents of various intensities (Fig. 3C). Except for the experiments with 50 pA, the frequencies of evoked spikes were significantly higher in the TMS-Sham(FS) group than in the control group as well as the TMS(FS) group: p < 0.05 (100 pA), p < 0.01 (150 and 200 pA), and p < 0.001 (250–500 pA; repeated measure ANOVA followed by Tukey HSD tests). With 300 pA, the frequencies were 36.2 ± 0.8 Hz [Control(non-FS), N = 17], 43.4 ± 1.4 Hz [TMS-Sham(FS), N = 20], and 37.6 ± 0.8 Hz [TMS(FS), N = 14]. No difference was observed between the control and TMS(FS) groups with any current intensities. This finding confirmed that excitability of cingulate cortex neurons was elevated by FS and rescued by TMS treatment. Behind these phenomena BK channels are likely to be involved, given our previous report (Sakagami et al., 2005) that similarly measured frequencies of evoked spikes were increased by CTx in neocortical slices obtained from normal (non-FS) rats, and decreased by ECS in a CTx-sensitive manner.
Since BK channels affect the descending phase of spikes and determine spike width in central neurons (Faber and Sah, 2003), we examined the spike width in FS mouse cells [Fig. 4A; TMS-Sham(FS)] and its responsiveness to TMS [Fig. 4A; TMS(FS)]. To evoke spikes, a train of five short, depolarizing pulses were injected at 100 Hz with the intensity adjusted in such a way that each pulse could evoke a single action potential. First, we compared half-widths of spikes evoked by this 5-pulse train between the naive control and TMS-Sham(FS) groups (Fig. 4B). Spikes were significantly broader in the TMS-Sham(FS) group (2.1 ± 0.1 ms for the fifth spike, N = 20) than the naive Control(non-FS) group [Control(non-FS); 1.4 ± 0.1 ms, N = 22, p < 0.001], suggesting that BK channels were suppressed by the FS. Then, we examined more directly whether BK channel suppression is involved. BK channel suppression by anti-BK channel Ab [TMS-Sham(FS)+Ab, 2.1 ± 0.2 ms, N = 13] or CTx [TMS-Sham(FS)+CTx, 2.4 ± 0.2 ms, N = 18] failed to further enlarge the widths of already broadened spikes in TMS-Sham(FS) mouse neurons, exhibiting occlusion of the effect by the FS and that by BK channel blockade. In control neurons, application of Ab [Control(non-FS)+Ab, 2.3 ± 0.1 ms, N = 27] or CTx [Control(non-FS)+CTx, 2.2 ± 0.1 ms, N = 6] to control neurons made the spike width larger. Among the six groups tested here, significant differences was detected between the control group and each of the other groups (p < 0.001). There were no significant differences within the groups except for the control(non-FS) group.
Figure 4.

Spike broadening induced by the FS in cingulate cortex pyramidal cells and its recovery by rTMS. A, Specimen recordings of spikes evoked by a 5 pulse train of depolarizing currents at 100 Hz in cingulate cortex pyramidal cell from naive control [Control(non-FS)]-, TMS-Sham(FS)-, and TMS(FS)-treated mice. Scale bars, 20 mV, 10 ms. B, Half-widths of the five evoked spikes in cells from control(non-FS) or TMS-Sham (FS) mice, with or without BK channel blockade. Either anti-BK channel Ab or CTx was used for BK channel blockade. The width in TMS-Sham(FS) cells was significantly larger than in control(non-FS) cells. TMS-Sham(FS) neurons under BK channel blockade and those without blockade did not significantly differ in the spike width, suggesting that BK channels were suppressed in the TMS-Sham(FS) group; *p < 0.001; repeated measure ANOVA followed by Tukey HSD test for both B and C. C, Recovery of the FS-induced spike broadening by rTMS in a manner dependent on BK channels. The width of the fifth spike in TMS-Sham(FS) neurons was significantly broader than that in control(non-FS) neurons and that in TMS-Sham(FS) neurons under BK channel blockade by CTx [TMS-Sham(FS)+CTx]; *p < 0.001.
We then showed that TMS treatment is effective in reducing the spike width broadened by the FS test (Fig. 4C). In the TMS(FS) group, the spike width was significantly smaller [TMS(FS), 1.6 ± 0.1 ms for the fifth spike, N = 23] than the TMS-Sham(FS) group (2.1 ± 0.1 ms, N = 22, p < 0.001). However, CTx application abolished this effect of TMS, and the spike became significantly broader [TMS(FS)+CTx; 2.0 ± 0.1 ms, N = 15, p < 0.001] than that of the TMS(FS) group. These findings confirmed that the FS induces BK channel suppression, which is normalized by TMS.
Downregulation of Homer1a gene expression with FS and its recovery by TMS
BK channel suppression in the present experiments may be due to changes in gene expression. To test this, we did quantitative real-time PCR analysis in cortical tissue (Fig. 5). Expression of BK channel, Homer1a, and Homer1b/c genes was first standardized by β–actin expression. Then, the standardized expression of each gene was expressed relative to the data from naive control mice [Control(non-FS)]. Significant reduction of Homer1a expression was detected in TMS-Sham(FS) mice [Control(non-FS); 1.00 ± 0.21, N = 6 vs TMS-Sham(FS); 0.14 ± 0.03, N = 6; p < 0.001]. This reduction of Homer1a mRNA expression by the FS test was partly recovered by TMS [TMS(FS); 0.27 ± 0.07, N = 6, p < 0.05]. However, this recovery was only partial, since the expression level was still significantly lower than that in the control(non-FS) group (p < 0.005). Expression of Homer1b/c and BK channels was not significantly different among the three groups, pointing to the possibility that BK channel suppression may be attributed to modification on channel activity.
Figure 5.

Quantitative real-time PCR analysis. FS-induced changes in expression of BK channel and Homer1 genes in the cortex were measured with TaqMan probes by using the ΔΔCt method. Expression of BK channel, Homer1a, and Homer1b/c mRNA was first standardized by expression of β-actin in the same tissue and expressed relative to the data taken from the naive control(non-FS) mice[(Control(non-FS)]. Significant reduction of Homer1a expression was detected in the TMS-Sham(FS) group. Homer1a expression was significantly augmented by TMS as compared to the TMS-Sham(FS) group, pointing to a TMS-induced recovery of Homer1a expression. Expression of BK channel and Homer1b/c mRNA was not significantly different; *p < 0.05, **p < 0.001; one-way ANOVA followed by Tukey HSD test.
In our previous report, Homer1a facilitated BK channel activity (Sakagami et al., 2005). Although the tissue samples in the present experiments were not exclusively obtained from cingulate cortex pyramidal cells, these results are at least consistent with the interpretation that the marked reduction of Homer1a expression by the FS test may have negated BK channel activity. TMS treatment recovered Homer1a expression partly but significantly. This partial recovery may be sufficient to allow normal BK channel activity to reappear. Alternatively, the partial recovery at the mRNA expression level may be sufficient to ensure a more robust recovery of Homer1a expression at the protein level. We therefore tested these possibilities by Western blot.
Reduction of Homer1a expression by the FS and its recovery by TMS were confirmed at the protein level by Western blot (Fig. 6A). The densities of the bands representing Homer1a were first quantified by ImageJ software and then standardized by the densities of the corresponding β-actin bands located in the same lanes. These standardized densities of the Homer1a bands were averaged for each experimental group. The averaged densities were then expressed relative to that of the control(non-FS) group (Fig. 6C). Homer1a level in cingulate cortex lysate was lower in the TMS-Sham(FS) group (0.58 ± 0.12, N = 3, p < 0.05) than in the control(non-FS) group (1.00 ± 0.08, N = 6) or the TMS(FS) group (0.91 ± 0.07, N = 3). As compared with the mRNA expression, FS-induced reduction of Homer1a protein in the TMS-Sham(FS) group was more modest, and its TMS-induced recovery in the TMS(FS) group was to a higher extent. It is suggested that Homer1a mRNA templates may be used more efficiently for protein translation in the FS-subjected mice, whether TMS-treated or Sham-treated. Thus, Homer1a protein expression appears to be more closely correlated with behavioral changes induced by the FS and TMS than Homer1a mRNA expression.
Figure 6.

Expression of Homer1a protein in cingulate cortex. A, B, Western blot of samples obtained from various groups of mice. Tissue was obtained from the following: (1) control(non-FS) [Control(non-FS)]; (2) FS-subjected and TMS-treated [TMS(FS)]; (3) FS-subjected and TMS sham-treated [TMS Sham(FS)]; (4) FS-subjected and Imi-injected [Imi(FS)]; and (5) FS-treated and saline-injected [Imi Sham(FS)] mice. C, Quantification of Homer1a protein expression. The densities of Homer1a bands were first standardized relative to the corresponding β-actin band densities and then averaged (N = 3–6); *p < 0.05; one-way ANOVA followed by Tukey HSD test.
Comparison of TMS and imipramine effects on Homer1a expression and electrophysiological properties
We also examined Homer1a expression induced by Imi treatment at the protein level (Fig. 6B,C). Western blot analysis showed that the tissue content of Homer1a protein, as assessed in the same method as for the TMS(FS) group, was significantly larger in the Imi(FS) group (0.86 ± 0.16, N = 3, p < 0.05) than in the Imi-Sham(FS) group (0.38 ± 0.19, N = 3). Imi treatment thus induced Homer1a protein expression to much the same extent as TMS treatment (Fig. 6). These results suggest that amelioration of the depression-like behavior by TMS and Imi may depend on the same mechanism involving Homer1a expression.
These findings prompted us to compare electrophysiological properties in slices obtained from the Imi(FS) and Imi-Sham(FS) groups. The spike half-widths, measured at the fifth spikes with the same method used for the other groups, were 1.5 ± 0.1 ms (N = 15) in the Imi(FS) group and 2.0 ± 0.1 ms (N = 10) in the Imi-Sham(FS) group, which were significantly different (p < 0.001). The resting membrane potential was also significantly different between the two groups: −68.5 ± 0.8 mV [Imi(FS), N = 15] versus −65.3 ± 0.6 mV [Imi-Sham(FS), N = 14, p < 0.005]. So was the frequency of spikes evoked by injecting 300 pA current: 36.4 ± 1.1 Hz [Imi(FS), N = 14] versus 42.8 ± 2.4 Hz [Imi-Sham(FS), N = 15, p < 0.01]. Overall, Imi and TMS recovered all the electrophysiological properties that we examined in cingulate cortex pyramidal cells to much the same extent. It is therefore suggested that the present Imi- and TMS-induced recovery of depression-like behavior (Fig. 2) may be based on similar cellular mechanisms that resulted in reversal of increased cortical pyramidal cell excitability.
Thus, our modified version of FS enabled us to show the BK channel suppression associated with depression-like state and its recovery by 4-week-long chronic treatments. Despite such a clear advantage of the present 5 day FS over the original 2 day FS, it should be mentioned that the FS in general could occasionally be interpreted to represent a learning-based active adaptation to helpless circumstances. It is reported that BK channel suppression accompanies trace eye blink conditioning, a hippocampus-dependent learning (Matthews et al., 2008), raising the possibility that the present BK channel suppression might also be induced by a form of learning. On the other hand, another depression model procedure, chronic mild stress (CMS), is reported to increase neuronal excitability in lateral amygdala pyramidal cells (Rosenkranz et al., 2010). Although the examined structures are different, this common electrophysiological feature induced by both CMS and the present FS suggests the equivalence of, or similarities between, CMS and the present 5 day FS as rodent models of depression.
Discussion
Consistent with cortical hyperexcitability in human depressives (Bajbouj et al., 2006b), we demonstrated hyperexcitability in excitatory neurons in the cingulate cortex of FS mice. Downregulation of GABAergic transmission is shown to contribute to the hyperexcitability (Sanacora et al., 1999). A glutamatergic alteration is also proposed (Krystal et al., 2002). These reports and the present finding taken together suggest that defects in both excitatory and inhibitory components of cortical circuits underlie depressive symptoms.
Dual nature of FS tests
Forced swimming, FS, was invented originally as a means by which to evaluate antidepressant effects of drug candidate compounds in rats (Porsolt et al., 1977). In this original paradigm, which lasts for 2 days, a depression-like state is induced on the first day, and its recovery by therapeutic measure is tested on the second day. Since human depressives are known to respond to antidepressants with a latent period of weeks, the question may arise as to whether the 24-h-long acute effects detected in this test represent antidepressant effects applicable to human depressives.
In the mouse version of FS (Porsolt et al., 1978), the induction and test procedures are in series within a single session, with the test procedure immediately following the induction procedure. No therapeutic attempts could be applied between the induction and test phases. One way of overcoming these difficulties in the original FS would be that only the test session alone is used to assess depression-like states induced by other independent methods, including gene modification (Miyamoto et al., 2002) or olfactory bulbectomy (Vieyra-Reyes et al., 2008). However, as a reliable test method for distinguishing antidepressant and anxiolytic drugs, the FS paradigm has been widely used over 30 years. To make the best of this verified paradigm, we attempted temporal separation of the induction and test phases with a 4 week interval.
In the present modification, 10-min-long swimming was forced for 5 consecutive days as the induction procedure. The immobility time and distance traveled became longer and shorter, respectively, on day 2 than on day 1 and these changes were kept up from day 2 though day 5. Thereafter, the mice were housed in their home cages until the next and last FS test was performed in 4 weeks. The last test revealed that a depression-like state still persisted, indicating that our modified FS paradigm provides a suitable platform on which to assess the effect of 4-week-long chronic therapies. The present experiments used this platform to show that chronic rTMS or imipramine treatment reverses depression-like symptoms. Importantly, the responsiveness to imipramine in the present study, which is the kernel of the original FS (Porsolt et al., 1977, 1978), seems to qualify the present FS for an alternative to the original FS.
TMS effects on various versions of FS tests
The advantage of the present FS is that a distinction can be made between preventive and therapeutic effects of chronic interventions such as the 4-week-long rTMS. Studies concerned with TMS effects on FS models of depression to date failed to adequately separate these two effects. It is reported that a 1 or 2 day trial of rTMS of normal rats has improved performance in the FS test that followed the rTMS trial (Fleischmann et al., 1995). Since the FS followed the rTMS, what they examined was not therapeutic effects of rTMS on already induced depression but preventive effects on a forthcoming depressive event in normal rats. Likewise, it is reported that a single trial of rTMS for 5 min (Zyss et al., 1997) and daily rTMS sessions for 7 days (Kim et al., 2006) in normal rats improved performance in the FS. These experiments are relevant to the preventive effect, since the tests followed the TMS treatment. In another study, chronic rTMS was applied for 5 consecutive days, with FS tests performed every 2 days in parallel (Sachdev et al., 2002). The depression-like symptom would then be inevitably exacerbated by the test procedure itself (Sachdev et al., 2002; Keck et al., 2001). In the present study, we modified the original version of the FS test to investigate therapeutic effects of rTMS independently of the depression-inducing aspect of the FS test.
Pyramidal cell hyperexcitability associated with depression-like behavior
Once the induction of depression-like states and its TMS-induced reversal were established, we were able to investigate whether pyramidal cell excitability was associated with depression-like behaviors. First, we revealed that resting membrane potential in cingulate cortex pyramidal cells was more depolarized in the model and was reversibly recovered after rTMS. Second, in the same cingulate cortex cells, spikes were found to be broader and recovered by rTMS. Both phenomena depended on BK channels, which were shown to be suppressed in FS mouse neurons.
There are several possibilities underlying downregulation of BK channels in the FS mouse. First, the trafficking of BK channels might be in favor of the cytosolic population. Consistent with this possibility, glutamate receptor trafficking involved in long-term potentiation (LTP) suggests that a sizable channel trafficking can rather rapidly occur within several minutes. This time period would be fast enough to explain the rapid onset of the present depression-like behavior. The second possibility is reduction at the protein level. This may occur concurrently with the channel internalization. These two possibilities could neither be excluded nor positively supported by the present data, and is worth further testing. Third, BK channel properties may be modified. Only this possibility seems to have direct relevance to the present experiments. We must therefore focus on this possibility here.
In agreement with the third possibility, we previously showed that ECS facilitates BK channels by modifying their channel properties and that ECS and BK channel facilitation was linked by ECS-induced expression of Homer1a (Sakagami et al., 2005). Homer1a is expressed activity-dependently upon strong stimulation such as LTP-inducing tetanization in hippocampal slices or flashing light stimulation arriving at the visual cortex (Brakeman et al., 1997; Kato et al., 1997). By intracellularly injecting a blocking antibody against Homer1a in neocortex pyramidal cells, we have revealed that ECS-induced Homer1a expression mediates the facilitation of BK channels (Sakagami et al., 2005). In accordance with this, the present experiments demonstrated that the baseline level of Homer1a expression was downregulated by the FS and recovered by rTMS in the cortex. On the other hand, expression of the constitutively expressed Homer1b/c remained unchanged. This finding is consistent with our proposal that Homer 1a expression ameliorates depression symptoms by facilitating BK channels, whereas reduction of its expression downregulates these channels, causing depression-like behaviors. Dysfunction of Homer proteins is implicated in neuropsychiatric disorders and their models (Szumlinski et al., 2006). In particular, Homer1 has been implicated in the etiology of major depression by a recent genome-wide association study (Rietschel et al., 2010). Orsetti et al. (2008) reported downregulation of Homer1 mRNA in rats under CMS without pinpointing Homer1a. Overall, Homer1a is likely to modify BK channel properties to support the third possibility. However, consistent with the first and second possibilities, BK channel trafficking might also be regulated by Homer1a, since Homer1 can bind to other proteins located in the postsynaptic density and BK channels have proline-rich domains that bind to Homer1. Nevertheless, the present BK channel suppression was observed only in the later spikes in a spike train but not in the first spike, which implies a channel modification rather than an increased channel number, according to Shao et al. (1999).
It was in the visual cortex that our previous ECS experiments (Sakagami et al., 2005) revealed Homer1a-dependent BK channel facilitation. In the present experiments, we used cingulate cortex slices to show the FS-induced downregulation of BK channel activity and its TMS-aided upregulation. Our ECS and TMS procedures are likely to affect a widely extended area of the cerebral cortex. We therefore consider that both of the stimulations modulate BK channels over the wide area. It is then suggested that the present RT-PCR based on tissue collected from a wide cortical area may still have relevance to the Homer1a-dependent regulation of BK channel activity in the cingulate cortex. On the other hand, given that the tissue used for the present PCR contains all types of cells, the data do not represent gene expression occurring strictly in upper layer pyramidal cells, from which the present electrophysiological recordings were collected. With all these limitations, the present PCR findings are still consistent with our proposal that a reduced BK channel activity and its TMS-aided recovery in cortical neurons is mediated by Homer1a expression. The present Western blotting results also support this proposal.
The present findings showed that both chronic rTMS and Imi treatments induce Homer1a expression, facilitate BK channels, and reduce increased neuronal excitability in cingulate pyramidal cells in FS-subjected mice, resulting in amelioration of the depression-like phenotype. It is currently considered that hippocampal neurogenesis mediates the antidepressant effects of chronic application of Imi (Santarelli et al., 2003; Surget et al., 2008), other antidepressant drugs, and ECS (Malberg et al., 2000). The present study raises the possibility that effects of chronic Imi, as well as those of rTMS, may also be attributable to treatment-induced normalization of hyperexcitability in cortical neurons.
We have recently found the same suppression of BK channels and cortical hyperexcitability in 3xTg Alzheimer's model mice, which are recovered by ECS in a Homer1a-dependent manner as well (Yamamoto et al., 2011). This common abnormality in model mice for Alzheimer's and depression might serve as the target for a novel therapy that is both antidepressant and anti-Alzheimer's at the same time.
Footnotes
This work was supported by a Grant-in-Aid for Scientific Research (22500360) from the Japan Society for Promotion of Sciences, Grants for Collaborative Research (C2006-5, C2007-2), and High-Tech Research (H2008-14, H2009-14, and H2010-14) from Kanazawa Medical University and a Grant from the Science Research Promotion Fund of the Promotion and Mutual Aid Corporation for Private Schools of Japan. We express our gratitude to Dr. H. Nishijo (Toyama University, Toyama, Japan) and Dr. K. Yamada (Nagoya University, Nagoya, Japan) for advice. We also thank H. Adachi, S. Muramoto, and K. Yamada for their assistance.
The authors declare no competing financial interests.
References
- Altar CA, Laeng P, Jurata LW, Brockman JA, Lemire A, Bullard J, Bukhman YV, Young TA, Charles V, Palfreyman MG. Electroconvulsive seizures regulate gene expression of distinct neurotrophic signaling pathways. J Neurosci. 2004;24:2667–2677. doi: 10.1523/JNEUROSCI.5377-03.2004. [DOI] [PMC free article] [PubMed] [Google Scholar]
- Ango F, Prézeau L, Muller T, Tu JC, Xiao B, Worley PF, Pin JP, Bockaert J, Fagni L. Agonist-independent activation of metabotropic glutamate receptors by the intracellular protein Homer. Nature. 2001;411:962–965. doi: 10.1038/35082096. [DOI] [PubMed] [Google Scholar]
- Bajbouj M, Brakemeier EL, Schubert F, Lang UE, Neu P, Schindowski C, Danker-Hopfe H. Repetitive transcranial magnetic stimulation of the dorsolateral prefrontal cortex and cortical excitability in patients with major depressive disorder. Exp Neurol. 2005;196:332–338. doi: 10.1016/j.expneurol.2005.08.008. [DOI] [PubMed] [Google Scholar]
- Bajbouj M, Lang UE, Niehaus L, Hellen FE, Heuser I, Neu P. Effects of right unilateral electroconvulsive therapy on motor cortical excitability in depressive patients. J Psychiatr Res. 2006a;40:322–327. doi: 10.1016/j.jpsychires.2005.07.002. [DOI] [PubMed] [Google Scholar]
- Bajbouj M, Lisanby SH, Lang UE, Danker-Hopfe H, Heuser I, Neu P. Evidence for impaired cortical inhibition in patients with unipolar major depression. Biol Psychiatry. 2006b;59:395–400. doi: 10.1016/j.biopsych.2005.07.036. [DOI] [PubMed] [Google Scholar]
- Brakeman PR, Lanahan AA, O'Brien R, Roche K, Barnes CA, Huganir RL, Worley PF. Homer: a protein that selectively binds metabotropic glutamate receptors. Nature. 1997;386:284–288. doi: 10.1038/386284a0. [DOI] [PubMed] [Google Scholar]
- Coppen A, Wood K. Biological classification of depressive illness. Br J Clin Pharmacol. 1983;15(Suppl 2):161S–164S. doi: 10.1111/j.1365-2125.1983.tb05861.x. [DOI] [PMC free article] [PubMed] [Google Scholar]
- Faber ES, Sah P. Ca2+-activated K+ (BK) channel inactivation contributes to spike broadening during repetitive firing in the rat lateral amygdala. J Physiol. 2003;552:483–497. doi: 10.1113/jphysiol.2003.050120. [DOI] [PMC free article] [PubMed] [Google Scholar]
- Fleischmann A, Prolov K, Abarbanel J, Belmaker RH. The effect of transcranial magnetic stimulation of rat brain on behavioral models of depression. Brain Res. 1995;699:130–132. doi: 10.1016/0006-8993(95)01018-q. [DOI] [PubMed] [Google Scholar]
- Fujiki M, Steward O. High frequency transcranial magnetic stimulation mimics the effects of ECS in upregulating astroglial gene expression in the murine CNS. Brain Res Mol Brain Res. 1997;44:301–308. doi: 10.1016/s0169-328x(96)00232-x. [DOI] [PubMed] [Google Scholar]
- Hof PR, Young WG, Bloom FE, Belichenko PV, Celio MR. Comparative cytoarchitectonic atlas of the C57BL/6 and 129/Sv mouse brain. Amsterdam: Elsevier; 2000. [Google Scholar]
- Janicak PG, O'Reardon JP, Sampson SM, Husain MM, Lisanby SH, Rado JT, Heart KL, Demitrack MA. Transcranial magnetic stimulation in the treatment of major depressive disorder: a comprehensive summary of safety experience from acute exposure, extended exposure, and during reintroduction treatment. J Clin Psychiatry. 2008;69:222–232. doi: 10.4088/jcp.v69n0208. [DOI] [PubMed] [Google Scholar]
- Kato A, Ozawa F, Saitoh Y, Hirai K, Inokuchi K. Vesl, a gene encoding VASP/Ena family related protein, is upregulated during seizure, long-term potentiation and synaptogenesis. FEBS Lett. 1997;412:183–189. doi: 10.1016/s0014-5793(97)00775-8. [DOI] [PubMed] [Google Scholar]
- Kato N. Neurophysiological mechanisms of electroconvulsive therapy for depression. Neurosci Res. 2009;64:3–11. doi: 10.1016/j.neures.2009.01.014. [DOI] [PubMed] [Google Scholar]
- Keck ME, Welt T, Post A, Müller MB, Toschi N, Wigger A, Landgraf R, Holsboer F, Engelmann M. Neuroendocrine and behavioral effects of repetitive transcranial magnetic stimulation in a psychopathological animal model are suggestive of antidepressant-like effects. Neuropsychopharmacology. 2001;24:337–349. doi: 10.1016/S0893-133X(00)00191-3. [DOI] [PubMed] [Google Scholar]
- Kim EJ, Kim WR, Chi SE, Lee KH, Park EH, Chae JH, Park SK, Kim HT, Choi JS. Repetitive transcranial magnetic stimulation protects hippocampal plasticity in an animal model of depression. Neurosci Lett. 2006;405:79–83. doi: 10.1016/j.neulet.2006.06.023. [DOI] [PubMed] [Google Scholar]
- Krystal JH, Sanacora G, Blumberg H, Anand A, Charney DS, Marek G. Glutamate and GABA systems as targets for novel antidepressant and mood-stabilizing treatments. Mol Psychiatry. 2002;7(Suppl 1):S71–S80. doi: 10.1038/sj.mp.4001021. [DOI] [PubMed] [Google Scholar]
- Lisanby SH, Belmaker RH. Animal models of the mechanisms of action of repetitive transcranial magnetic stimulation (rTMS) comparisons with electroconvulsive shock (ECS) Depress Anxiety. 2000;12:178–187. doi: 10.1002/1520-6394(2000)12:3<178::AID-DA10>3.0.CO;2-N. [DOI] [PubMed] [Google Scholar]
- Malberg JE, Eisch AJ, Nestler EJ, Duman RS. Chronic antidepressant treatment increases neurogenesis in adult rat hippocampus. J Neurosci. 2000;20:9104–9110. doi: 10.1523/JNEUROSCI.20-24-09104.2000. [DOI] [PMC free article] [PubMed] [Google Scholar]
- Manji HK, Duman RS. Impairments of neuroplasticity and cellular resilience in severe mood disorders: implications for the development of novel therapeutics. Psychopharmacol Bull. 2001;35:5–49. [PubMed] [Google Scholar]
- Matthews EA, Weible AP, Shah S, Disterhoft JF. The BK-mediated fAHP is modulated by learning a hippocampus-dependent task. Proc Natl Acad Sci U S A. 2008;105:15154–15159. doi: 10.1073/pnas.0805855105. [DOI] [PMC free article] [PubMed] [Google Scholar]
- McCormick DA, Connors BW, Lighthall JW, Prince DA. Comparative electrophysiology of pyramidal and sparsely spiny stellate neurons of the neocortex. J Neurophysiol. 1985;54:782–806. doi: 10.1152/jn.1985.54.4.782. [DOI] [PubMed] [Google Scholar]
- Miyamoto Y, Yamada K, Noda Y, Mori H, Mishina M, Nabeshima T. Lower sensitivity to stress and altered monoaminergic neuronal function in mice lacking the NMDA receptor epsilon 4 subunit. J Neurosci. 2002;22:2335–2342. doi: 10.1523/JNEUROSCI.22-06-02335.2002. [DOI] [PMC free article] [PubMed] [Google Scholar]
- Nestler EJ, Gould E, Manji H, Buncan M, Duman RS, Greshenfeld HK, Hen R, Koester S, Lederhendler I, Meaney M, Robbins T, Winsky L, Zalcman S. Preclinical models: status of basic research in depression. Biol Psychiatry. 2002;52:503–528. doi: 10.1016/s0006-3223(02)01405-1. [DOI] [PubMed] [Google Scholar]
- O'Reardon JP, Solvason HB, Janicak PG, Sampson S, Isenberg KE, Nahas Z, McDonald WM, Avery D, Fitzgerald PB, Loo C, Demitrack MA, George MS, Sackeim HA. Efficacy and safety of transcranial magnetic stimulation in the acute treatment of major depression: a multisite randomized controlled trial. Biol Psychiatry. 2007;62:1208–1216. doi: 10.1016/j.biopsych.2007.01.018. [DOI] [PubMed] [Google Scholar]
- Orsetti M, Di Brisco F, Canonico PL, Genazzani AA, Ghi P. Gene regulation in the frontal cortex of rats exposed to the chronic mild stress paradigm, an animal model of human depression. Eur J Neurosci. 2008;27:2156–2164. doi: 10.1111/j.1460-9568.2008.06155.x. [DOI] [PubMed] [Google Scholar]
- Paus T, Barrett J. Transcranial magnetic stimulation (TMS) of the human frontal cortex: implications for repetitive TMS treatment of depression. J Psychiatry Neurosci. 2004;29:268–279. [PMC free article] [PubMed] [Google Scholar]
- Porsolt RD, Le Pichon M, Jalfre M. Depression: a new animal model sensitive to antidepressant treatments. Nature. 1977;266:730–732. doi: 10.1038/266730a0. [DOI] [PubMed] [Google Scholar]
- Porsolt RD, Bertin A, Jalfre M. “Behavioural despair” in rats and mice: strain differences and the effects of imipramine. Eur J Pharmacol. 1978;51:291–294. doi: 10.1016/0014-2999(78)90414-4. [DOI] [PubMed] [Google Scholar]
- Post A, Keck ME. Transcranial magnetic stimulation as a therapeutic tool in psychiatry: what do we know about the neurobiological mechanisms? J Psychiatr Res. 2001;35:193–215. doi: 10.1016/s0022-3956(01)00023-1. [DOI] [PubMed] [Google Scholar]
- Rietschel M, Mattheisen M, Frank J, Treutlein J, Degenhardt F, Breuer R, Steffens M, Mier D, Esslinger C, Walter H, Kirsch P, Erk S, Schnell K, Herms S, Wichmann HE, Schreiber S, Jöckel KH, Strohmaier J, Roeske D, Haenisch B, et al. Genome-wide association-, replication-, and neuroimaging study implicates HOMER1 in the etiology of major depression. Biol Psychiatry. 2010;68:578–585. doi: 10.1016/j.biopsych.2010.05.038. [DOI] [PubMed] [Google Scholar]
- Rosenkranz JA, Venheim ER, Padival M. Chronic stress causes amygdala hyperexcitability in rodents. Biol Psychiatry. 2010;67:1128–1136. doi: 10.1016/j.biopsych.2010.02.008. [DOI] [PMC free article] [PubMed] [Google Scholar]
- Rossi S, Hallett M, Rossini PM, Pascual-Leone A Safety of TMS Consensus Group. Safety, ethical considerations, and application guidelines for the use of transcranial magnetic stimulation in clinical practice and research. Clin Neurophysiol. 2009;120:2008–2039. doi: 10.1016/j.clinph.2009.08.016. [DOI] [PMC free article] [PubMed] [Google Scholar]
- Sachdev PS, McBride R, Loo C, Mitchell PM, Malhi GS, Croker V. Effects of different frequencies of transcranial magnetic stimulation (TMS) on the forced swim test model of depression in rats. Biol Psychiatry. 2002;51:474–479. doi: 10.1016/s0006-3223(01)01298-7. [DOI] [PubMed] [Google Scholar]
- Sakagami Y, Yamamoto K, Sugiura S, Inokuchi K, Hayashi T, Kato N. Essential roles of Homer-1a in homeostatic regulation of pyramidal cell excitability: a possible link to clinical benefits of electroconvulsive shock. Eur J Neurosci. 2005;21:3229–3239. doi: 10.1111/j.1460-9568.2005.04165.x. [DOI] [PubMed] [Google Scholar]
- Sanacora G, Mason GF, Rothman DL, Behar KL, Hyder F, Petroff OA, Berman RM, Charney DS, Krystal JH. Reduced cortical gamma-aminobutyric acid levels in depressed patients determined by proton magnetic resonance spectroscopy. Arch Gen Psychiatry. 1999;56:1043–1047. doi: 10.1001/archpsyc.56.11.1043. [DOI] [PubMed] [Google Scholar]
- Sanacora G, Mason GF, Rothman DL, Krystal JH. Increased occipital cortex GABA concentrations in depressed patients after therapy with selective serotonin reuptake inhibitors. Am J Psychiatry. 2002;159:663–665. doi: 10.1176/appi.ajp.159.4.663. [DOI] [PubMed] [Google Scholar]
- Sanacora G, Mason GF, Rothman DL, Hyder F, Ciarcia JJ, Ostroff RB, Berman RM, Krystal JH. Increased cortical GABA concentrations in depressed patients receiving ECT. Am J Psychiatry. 2003;160:577–579. doi: 10.1176/appi.ajp.160.3.577. [DOI] [PubMed] [Google Scholar]
- Santarelli L, Saxe M, Gross C, Surget A, Battaglia F, Dulawa S, Weisstaub N, Lee J, Duman R, Arancio O, Belzung C, Hen R. Requirement of hippocampal neurogenesis for the behavioral effects of antidepressants. Science. 2003;301:805–809. doi: 10.1126/science.1083328. [DOI] [PubMed] [Google Scholar]
- Schildkraut JJ. The catecholamine hypothesis of affective disorders: a review of supporting evidence. Am J Psychiatry. 1965;122:509–522. doi: 10.1176/ajp.122.5.509. [DOI] [PubMed] [Google Scholar]
- Shao LR, Halvorsrud R, Borg-Graham L, Storm JF. The role of BKtype Ca2+-dependent K+ channels in spike broadening during repetitive firing in rat hippocampal pyramidal cells. J Physiol. 1999;521:135–146. doi: 10.1111/j.1469-7793.1999.00135.x. [DOI] [PMC free article] [PubMed] [Google Scholar]
- Surget A, Saxe M, Leman S, Ibarguen-Vargas Y, Chalon S, Griebel G, Hen R, Belzung C. Drug-dependent requirement of hippocampal neurogenesis in a model of depression and of antidepressant reversal. Biol Psychiatry. 2008;64:293–301. doi: 10.1016/j.biopsych.2008.02.022. [DOI] [PubMed] [Google Scholar]
- Szumlinski KK, Kalivas PW, Worley PF. Homer proteins: implications for neuropsychiatric disorders. Curr Opin Neurobiol. 2006;16:251–257. doi: 10.1016/j.conb.2006.05.002. [DOI] [PubMed] [Google Scholar]
- Vieyra-Reyes P, Mineur YS, Picciotto MR, Túnez I, Vidaltamayo R, Drucker-Colín R. Antidepressant-like effects of nicotine and transcranial magnetic stimulation in the olfactory bulbectomy rat model of depression. Brain Res Bull. 2008;77:13–18. doi: 10.1016/j.brainresbull.2008.05.007. [DOI] [PMC free article] [PubMed] [Google Scholar]
- Yamamoto K, Ueta Y, Wang L, Yamamoto R, Inoue N, Inokuchi K, Aiba A, Yonekura H, Kato N. Suppression of a neocortical potassium channel activity by intracellular amyloid-β and its rescue with Homer1a. J Neurosci. 2011;31:11100–11109. doi: 10.1523/JNEUROSCI.6752-10.2011. [DOI] [PMC free article] [PubMed] [Google Scholar]
- Zyss T, Górka Z, Kowalska M, Vetulani J. Preliminary comparison of behavioral and biochemical effects of chronic transcranial magnetic stimulation and electroconvulsive shock in the rat. Biol Psychiatry. 1997;42:920–924. doi: 10.1016/S0006-3223(96)00518-5. [DOI] [PubMed] [Google Scholar]