

Abstract
Certain experimental models support morphine can play a beneficial role against damage in the neuronal system. In this study, we find morphine as well as endomorphin-1 and endomorphin-2 can protect against intracellular amyloid β (iAβ) toxicity in human and rat primary neuronal cultures and in rat brains in vivo. Morphine reverses the electrophysiological changes induced by iAβ, including current density, resting membrane potential and capacitance. Also morphine improves the spatial memory performance in rats infected by iAβ packaged virus and in APP/PS1 mice in Morris water maze tests. Morphine protection is mediated through inducing estradiol release in hippocampal neurons measured by ELISA and liquid chromatography–mass spectrometry, possibly by increasing P450 cytochrome aromatase activity. Released estradiol induces upregulation of heat shock protein 70 (Hsp70). Hsp70 protects against intracellular amyloid toxicity by rescuing proteasomal activity which is impaired by iAβ. This is the first time, to our knowledge, that induction of estradiol release in hippocampal neurons by morphine is reported. Our data may contribute to both Alzheimer's disease therapy and pain clinics where morphine is widely used.
Introduction
Morphine has been a widely used medicine in clinics for a long time as an effective treatment for diarrhea and pain (Zhang et al., 2008). Several lines of evidence suggest that morphine may be neuroprotective. In rat neonatal hypoxia–ischemia model, morphine application immediately after hypoxia decreases infarct volume in the brain (Zhou et al., 1998). In zebrafish embryos, morphine, at certain concentrations, enhances neuron proliferation, increases the number of certain neuronal populations, and protects against glutamate damage in motor neurons and Pax-6-positive neurons in vivo (Sanchez-Simon et al., 2010). Morphine is found to be protective against microglia-mediated lipopolysccharide- or 1-methyl-4-phenylpyridinium-induced dopaminergic neurotoxicity in rat primary mesencephalic neuron/glia cultures (Qian et al., 2007). In rat neuronal/glial cultures, morphine is reported to prevent cell death induced by HIV envelope glycoprotein gp120IIIB or BaL (Avdoshina et al., 2010). Exogenous morphine preincubation improves the population of spike amplitudes of evoked field potentials, indicating that preconditioning with morphine might be neuroprotective (Ammon-Treiber et al., 2005). Morphine preconditioning induces opioid receptor-dependent neuroprotection against ischemia in rats and reduced ischemia-induced cell death in the CA1 regions of hippocampal slices (Zhao et al., 2006). In mouse hippocampal slices with oxygen-glucose deprivation, morphine preconditioning improves neuronal cell survival rate through protein kinase C ε (PKCε) (Liu et al., 2008).
Alzheimer's disease (AD) is characterized by three major hallmarks: extracellular senile plaques composed of amyloid β (Aβ) deposits, intracellular neurofibrillary tangles consisting of tau, and synaptic/neuronal loss (Price and Sisodia, 1998). The amyloid hypothesis states that Aβ, especially Aβ1–42, is toxic to cells and is therefore the initiator for AD pathology (Price and Sisodia, 1998). Recently, a modified amyloid hypothesis, the so called “intracellular amyloid hypothesis,” appeared (Li et al., 2007), which states that intracellular Aβ (iAβ) accumulation is the early event in AD development (Li et al., 2007). A strong piece of direct evidence for iAβ cytotoxicity comes from an experiment where microinjection of Aβ1–42 induces significant cell death in human primary cultured neurons (Zhang et al., 2002). Since iAβ effectively causes cell death in neurons and could be one of the primary events of AD development (Zhang et al., 2002), in the present study, iAβ was used as an inducer of cytotoxicity in neurons. The purpose of this study is to determine whether morphine plays a neuroprotective role against iAβ toxicity, and therefore whether it could have the potential as an AD prevention or treatment. We find that morphine, as well as endomorphin-1 (EM-1) and endomorphin-2 (EM-2), can protect against iAβ toxicity in human neuronal and rat hippocampal neuronal primary cultures and in rat brain in vivo. Furthermore, we investigate how morphine protection is mediated. Our data show that morphine induces estrogen release from local hippocampal neurons, possibly by increasing P450 aromatase activity. Increased estrogen triggers upregulation of heat shock protein 70 (Hsp70). Hsp70 protects against iAβ toxicity by increasing proteasomal activity, which is reduced by iAβ.
Materials and Methods
Chemicals, peptides, recombinant proteins, cDNA constructs, siRNAs, and antibodies
Morphine hydrochloride (China Drug Regulation Bureau, Beijing, China), EM-1 (Tocris Bioscience), EM-2 (Tocris Bioscience), naloxone (Tocris Bioscience), naltrindole (Tocris Bioscience), β-funaltrexamine (β-FNA; Tocris Bioscience), nor-binaltorphimine (nor-BNI; Tocris Bioscience), tamoxifen (Tax; Sigma), phenol red (Sigma), lipofectamine 2000 (Invitrogen), staurosporine (STS; Sigma), etoposide (Etop; Sigma), glutamate (Glu; Sigma), kainic acid (KA; Sigma), H2O2 (Beijing Chemicals), TNF-α (Sigma), tunicamycin (Tocris Bioscience), thapsigargin (Tocris Bioscience), phorbol esters (Sigma), PKA inhibitor fragment (6–22; Tocris Bioscience), bovine serum albumin (BSA)-conjugated morphine (BAS-M; a kind gift from Dr. Z. Gong, Institute for Military Medical Sciences, Beijing, China), 17-β-estradiol (βE2; Sigma), MG-132, a potent and cell permeable proteasome inhibitor (Sigma), lactacystein (Promega), and Z-VEID-fmk (CalBiochem) were used in the experiments. Aβ1–42 and the reversed control Aβ42–1 peptides (Bachem) were dissolved in sterile distilled water at 25 μm and immediately frozen at −20°C. Recombinant Hsp70 (Calbiochem), caspase-6 (Calbiochem), and BSA (Sigma) were used for microinjection. The cDNA constructs of pCep4β-cAβ1–42 expressing intracellularly located Aβ1–42 (Zhang et al., 2002), pCep4β-sAβ1–42 expressing secreted Aβ1–42 (Zhang et al., 2002), wild-type (WT) estrogen receptor (ER) (Zhang et al., 2004), ER with deletion of its DNA binding domain (ERΔDBD) (Zhang et al., 2004), wild-type androgen receptor (AR) (Zhang et al., 2004), 15579 (Zhang et al., 2004), 12474 (Zhang et al., 2004), wild-type p53 (Zhang et al., 2002), p53 dominant negative (Zhang et al., 2002), Bcl2 (Zhang et al., 2002), PKA dominant-negative construct (PKAI) (Day et al., 1989), mutant PKAI (PKAIM) (Day et al., 1989), and EGFP-fused ubiquitin (Ub-EGFP; a kind gift from Dr. R. Vabulas, Max Planck Institute of Biochemistry, Martinsried, Germany) were diluted with PBS before microinjection at 30 μg/ml. All siRNAs and controls (Qiagen) were diluted into 5 nm before injection or transfection by HiPerFect (Qiagen) as described by the manufacturer. The silencing efficiency and off-target effects of all siRNAs were verified by Qiagen. Antibodies to Hsp70 (Stressgen), Hsc70 (Stressgen), activated-Bax 6A7 (R & D Systems), actin (Santa Cruz Biotechnology), ERα (Santa Cruz Biotechnology), βE2 (Santa Cruz Biotechnology), morphine (Santa Cruz Biotechnology), μ-opioid receptor (MOR; Santa Cruz Biotechnology), Aβ 6E10 (Signet), and control IgG rabbit serum (Sigma) were used for Western blot, immunostaining, medium absorption, and microinjection. For medium absorption, precleaned protein-A Sepharose beads (Sigma) were coated with antibodies for overnight at 4°C and used for absorption of conditioned medium. β Secretase Activity Assay Kit (Abcam; Ab65357) and γ-Secretase Activity Kit (R & D Systems; FP003) were used to measure β- and γ-secretase activities as described by the manufacturer.
Cell culture
Primary cultures of human neurons were prepared from 8- to 12-week-old fetal brains following the protocol approved by the Peking University Medical School Institutional Review Board (IRB00001052-0572). Rat primary neurons were cultured from newborn Sprague Dawley rat hippocampus, and mouse primary neurons were cultured from the hippocampus in newborn mice indicated, following the regulations of Peking University Animal Care and Use Committee. In brief, fresh fetal whole-brain or rat hippocampal tissues were dissociated with 0.25% trypsin (Invitrogen), which was then inactivated by 10% decomplemented fetal bovine serum (FBS; HyClone). The mixture was triturated through pipette to make a homogenous mixture. After filtering the mixture through 70 μm sterilized filters, the flow-through was centrifuged. The pellet was then washed once with PBS and once with DMEM containing 0.225% sodium bicarbonate, 1 mm sodium pyruvate, 2 mm l-glutamine, 0.1% dextrose, and 1× antibiotic Pen-Strep (all from Invitrogen) with 5% FBS. Cells were then plated on poly-l-lysine-coated (Sigma) plates or glass coverslips at a density of 3 × 10⁶ cells/ml. Neurons were incubated at 37°C in DMEM without phenol red with 5% FBS and with 5% circulating CO2. Cytarabine was added to culture media 24 h after plating at 10 μm to inhibit cell growth. Medium was changed every 48 h. Cells were treated for experiments at 7 d in culture. MCF-7 and MDA-MB231 cells (a kind gift from Dr. Y. Shang, School of Medicine, Peking University, Beijing, China) were maintained in RPMI 1640 medium (Invitrogen). For morphine, EM-1 and EM-2 treatment in neuronal culture, chemicals were diluted from the stock solutions into indicated concentrations with culture medium, added to the culture, and incubated for the indicated time at 37°C.
Microinjection
Thin-walled borosilicate glass capillaries (outer diameter, 1.0 mm; inner diameter, 0.5 mm) with microfilament (MTW100F-4; World Precision Instruments) were pulled with a Flaming–Brown micropipette puller (P-97; Sutter Instrument) to obtain injection needles with a tip diameter of ∼0.5 μm. Microinjections were performed in the cytosol of each cell using the Eppendorf Microinjector FemtoJet and Eppendorf Micromanipulator. Neurons were injected with 25 fl per shot at an injection pressure of 100 hPa, a compensation pressure of 50 hPa, and an injection time of 0.1 s. Aβ peptides were diluted with PBS (0.14 m NaCl, 0.003 m KCl, 0.01 m Na2HPO4, 0.002 m KH2PO4, pH 7.2) before microinjection at 10 nm. Recombinant Hsp70, caspase-6, and BSA were injected at 5 μg/ml. The solutions were injected at the indicated concentrations with 100 μg/ml dextran Texas Red (DTR; molecular weight, 3000; Invitrogen) as a fluorescent marker to recognize the injected cells. Approximately 90% of neurons survived the injections for at least 16 d (LeBlanc, 1995).
Adenovirus infection
Intracellular Aβ1–42 cDNA was subcloned from pEGFP-N3 into pAdTrack with BglII and XhoI digestions. Adenovirus was packaged in HEK293 cells, and the infectious particle was measured as 2 × 10⁶ particles/ml (multiplicity of infection, 1.33). To infection of cell cultures, the purified virus supernatant was added to cell culture medium at a dilution of 1:500 for 24 h.
Electrophysiology
Whole-cell voltage-clamp recordings were performed on cultured hippocampal neurons. An Axopatch 200B amplifier (Molecular Devices) was used for whole-cell patch clamp. Before electrophysiological recording, culture medium was replaced with a bath solution containing the following (in mm): 141 NaCl, 2.5 KCl, 1.3 MgCl2, 2.4 CaCl2, 1.25 NaH2PO4, 10 HEPES, and 11 d-glucose (all from Sigma; pH 7.35). To block voltage-dependent Na+ and Ca2+ currents, 1 μm TTX (Fishes Research Institute, Hebei, China) and 100 μm CdCl2 (Sigma) were added to bath solution. Patch pipettes were pulled on a P97 Flaming–Brown micropipettes puller. Pipettes had a resistance of 3–5 MΩ. The electrodes were filled with the following (in mm): 115 K-gluconate, 5 KCl, 2.5 MgCl2, 1 CaCl2, 10 EGTA, 5 Na2-ATP, and 10 HEPES (all from Sigma; pH 7.25). The neurons were held at −70 mV and then depolarized from −60 to 80 mV with 10 mV steps, and each pulse lasted for 500 ms (Hou et al., 2009). For IA current isolation, neurons were first held at −40 mV to completely inactivate IA and then depolarized from −60 to 80 mV as before. Then the currents were recorded and subtracted from those evoked from the −100 mV holding potential using Clampfit 8.0 (Molecular Devices).
Morris water maze
Animal treatments.
Male Sprague Dawley rats (∼250 g of body weight) or wild-type and APP/PS1 mice (∼30 g of body weight) were used in water maze experiments. Rats and mice were housed under constant temperature and humidity conditions on a 12 h light/dark cycle with food and water available. Rats were randomly divided into six groups: PBS, pH 7.4, treatment group; morphine (1.2 μl; 500 μm) treatment group; Aβ (1 μl of iAβ-expressing virus in 0.2 μl of PBS) treatment group; EGFP (1 μl of EGFP-expressing virus in 0.2 μl of PBS) treatment group; Aβ plus morphine (1 μl of iAβ-expressing virus and 0.2 μl of 3 mm morphine) cotreatment group; and EGFP plus morphine (1 μl of EGFP-expressing virus and 0.2 μl of 3 mm morphine) cotreatment group. Mice were divided into four groups: wild type, APP/PS1, wild type with morphine treatment (1.2 μl; 500 μm), and APP/PS1 with morphine treatment (1.2 μl; 500 μm). Solution (1.2 μl) was injected into each hippocampus over a 2 min period through a Hamilton microsyringe, and the needle was left in place for additional 3 min. Injections were performed for 3 successive days.
Water maze tests.
The Morris water maze apparatus consisted of a circular swimming pool measuring 120 cm in diameter and 50 cm in height for rats and 60 cm in diameter and 50 cm in height for mice. It was placed in a room where many extramaze cues were available on the walls. The pool was filled to a depth of 30 cm with 21–22°C water. The hidden platform top was a circular plate measuring 10 cm in diameter. The hidden platform was located 2 cm below the water surface. On the second day, rats/mice were trained to escape onto the hidden platform in the water maze. The pool was conceptually divided into four quadrants with equal area size. The hidden platform was placed in the center of one of the quadrants throughout the experiment. Each of the four cardinal points of perimeter of the pool was used randomly as a starting location. Before the experiment, the times rats spent in each quadrant (including the target quadrant) without the platform placed were recorded. A trial began when a rat/mouse was placed in the pool facing the wall and ended when the rat escaped onto the platform. The escape latency to the platform was recorded. If a rat failed to escape within 60 s, the trial was terminated, the escape latency was defined as 60 s, and the rat was guided to the platform by the experimenter. Rats/mice were given four trials per day for 5 consecutive days (total of 20 trials). On the sixth day, a probe trial test was performed by recording the times spent in each quadrant without a platform.
Immunocytochemistry
Cells were permeabilized in PBS-Triton X-100 at 4°C, blocked with 10% donkey serum at room temperature, and incubated with anti-activated Bax antibody 6A7 (1:200) or anti-MOR (1:500) at 4°C for 24 h. Cy2 or Cy3-conjugated donkey anti-rabbit antibody was applied as the secondary antibody. The nuclei were then staining by Hoechst 33258 (1 μg/ml; Sigma) for 15 min in dark. The coverslips were mounted with Immunon mounting medium (Shandon) onto glass slides. The results were analyzed by using fluorescence microscope (Olympus BH2-RFCA) with a digital camera (Olympus DP70 digital microscope camera).
Liquid chromatography–mass spectrometry
17-α-Estradiol (αE2) was purchased from Sigma. Estrone (E1), βE2, estriol (E3), βE2-d3, and E1-d2 were purchased as powders from Wako. Methanol, acetonitrile, ethyl acetate, hexane, and dichloromethane (all at HPLC grade) were purchased from Fisher Chemical. HPLC-grade water was prepared using a Milli-Q RC apparatus (Millipore). All analytes were extracted simultaneously using one Oasis hydrophilic-lipophilic-balanced (HLB) cartridge (6 ml, 500 mg; Waters). The cartridge was preconditioned with 6 ml of ethyl acetate, 6 ml of acetonitrile, and 12 ml of distilled water. The cytolymph samples (∼50 ml) spiked with 10 ng of all surrogate standards (E1-d2 and βE2-d3) were extracted through the HLB cartridges at a flow rate of 5–10 ml/min. The cartridges were rinsed with 10 ml of distilled water and then dried under a flow of nitrogen. All analytes were subsequently eluted with 15 ml of ethyl acetate and 6 ml of ethyl acetate/acetonitrile (1:1, v/v). The extracts were dried and redissolved in 0.2 ml of ethyl acetate and 1.8 ml of hexane. The mixed solutions were applied to silica cartridges (3 ml, 500 mg; Waters) that had been preconditioned with 4 ml water-saturated ethyl acetate and 4 ml hexane/ethyl acetate (90:10, v/v). After the cartridges were rinsed with 3 ml of hexane/ethyl acetate (90:10, v/v), the fraction F1 containing E1, αE2, and βE2 were eluted with 3 ml of hexane/ethyl acetate (38:62, v/v), and the fraction F2 containing E3 were subsequently eluted by 3 ml of water-saturated ethyl acetate. F2 eluates were dried and reconstituted with 0.5 ml of acetonitrile for E3 by liquid chromatography–electrospray ionization tandem mass spectrometry (LC-ESI-MS/MS). To analyze the estrogens except E3, F1 was dried and redissolved with 1 ml hexane-methylene chloride (DCM; 1:1, v/v), and then passed through the preconditioned Florisil cartridges (6 ml, 1 g; Waters). Ten milliliters of a mixture of DCM (1:1, v/v) were discarded, and the fraction containing E1, αE2, and βE2 was eluted with 6 ml of acetone–DCM (1:9, v/v). The solution was evaporated to dryness under a gentle stream of nitrogen and reconstituted with 0.5 ml of acetonitrile.
The LC apparatus was an ACQUITY UPLC (Waters). All analytes were separated using a Waters ACQUITY UPLC BEH C18 column (2.1 × 100 mm; particle size, 1.7 μm). The column was maintained at 40°C at a flow rate of 0.3 ml/min, and the injection volume was 5 μl. Acetonitrile (A) and water (B) were used for analyzing estrogens. The gradient condition was initiated with 20% (A) followed by a linear increase to 100% (A) in 6.0 min, and was held at 100% for 1.0 min, and then decreased to the initial composition in 0.1 min. The column was then equilibrated for 3.0 min. Mass spectrometry was performed using a Quattro Premier XE detector (Waters), which was operated with ESI in the negative ion mode. The detection conditions of the mass spectrometer were as follows: capillary voltage, 2.8 kV; source temperature, 110°C; desolvation temperature, 400°C; desolvation gas flow, 800 l/h; and cone gas flow, 50 l/h. Finally, data acquisition was performed under time-segmented conditions based on the chromatographic separation of the target compounds to maximize sensitivity of detection (Table 1). Identification of the target estrogens was accomplished by comparing the retention time (within 2%) and the ratio (within 20%) of the two selected precursor ion–production with those of standards. To automatically correct the losses of analytes during sample preparation and the matrix-induced change in ionization, and to compensate for variations in instrument response from injection to injection, E1-d2 was used as a surrogate standard for E1, and βE2-d3 was used for αE2, βE2 and E3. The limits of detection of E1, αE2, βE2, and E3 were 2.5, 1.5, 6, and 3 pg/ml, respectively.
Table 1.
The separation conditions and maximize sensitivity of detection of the target compounds
| Compound | Retention time (min) | Multiple reaction monitoring transition | Cone voltage (V) | Collision energy (eV) |
|---|---|---|---|---|
| Estrone (E1) | 4.06 | 269 > 145 | 60 | 40 |
| 269 > 159 | 36 | |||
| Estrone-d2 (E1-d2) | 4.05 | 271 > 147 | 56 | 38 |
| 17-α-Estradiol (αE2) | 3.89 | 271 > 145 | 60 | 36 |
| 271 > 183 | 42 | |||
| 17-β-Estradiol (βE2) | 3.71 | 271 > 145 | 60 | 48 |
| 271 > 183 | 38 | |||
| 17-β-Estradiol-d3 (βE2-d3) | 3.69 | 274 > 185 | 58 | 46 |
| Estriol (E3) | 2.45 | 287 > 145 | 60 | 40 |
| 287 > 171 | 34 |
Measurement of neuronal cell death
Cells were fixed in fresh 4% paraformaldehyde and 4% sucrose in PBS for 20 min at room temperature and permeabilized in 0.1% Triton X-100 and 0.1% sodium citrate in PBS for 2 min on ice. Terminal deoxynucleotidyl transferase-biotin dUTP nick-end labeling (TUNEL) staining was performed using the in situ cell death detection kit I as described by the manufacturer (Roche). The coverslips were then washed once in distilled water for 5 min and mounted on glass slides to be observed under a fluorescence microscope. For the noninjected cells, the percentage of cell death was determined by the ratio of the number of TUNEL-positive cells over the total of 100 cells in one count. The average of five counts was calculated as the percentage of neuronal cell death in a certain treatment. For the injected cells, the percentage of cell death was determined as the ratio of the number of DTR-TUNEL-double-positive cells over the total number of DTR-positive cells. For the infected tissue, the percentage of cell death was determined by the ratio of the number of TUNEL-positive cells over 100 EGFP-positive cells.
Real-time PCR
Cells were harvested and total RNA was isolated with TRIGene reagent (GenStar BioSolutions). Total RNA (2 μg) was reverse transcribed using TransScript II First-Strand cDNA Synthesis SuperMix (Beijing TransGen Biotech). Real-time PCRs were done using TransStart Green qPCR SuperMix UDG (Beijing TransGen Biotech). Sequences of primers for the rat CYP19 (P450 cytochrome aromatase) used were as follows: forward, 5′-GCCTGTCGTGGACTTGGT-3′; reverse, 5′-TTCCGATGTTCAGAATGATGTT-3′. Sequences of primers for the rat β amyloid cleaving enzyme (BACE)-1 used were as follows: forward, 5′-TTGCCCAAGAAAGTATTTGA-3′; reverse, 5′-GATGCGGAAGGACTGATT-3′. Sequences of primers for the rat BACE-2 used were as follows: forward, 5′-AGGTAGTCTTGTCCTGGGTG-3′; reverse, 5′-TGGCCTTGTCTGCGTTAT-3′. Real-time PCR quantifications were run in triplicate for each sample, and the average were determined. To use the comparative Ct method for relative quantification, the amplification efficiency of target and housekeeping genes must be approximately equal. Quantification was done using the comparative Ct method, and expression levels for the target gene were normalized to the GAPDH of each sample (2−▵Ct = 2−[Ct(target gene)−Ct(GAPDH)]). Amplification was done for 45 cycles at 95°C for 30 s, 59°C for 30 s, 72°C for 30 s, 95°C for 1 min, 59°C for 30 s, and 95°C for 30 s.
ELISA
ELISA was used to determine the concentrations of βE2 and testosterone in the culture medium and Aβ1–40 and Aβ1–42 in the hippocampal tissues of APP/PS1 mice. Conditioned culture medium was collected and kits for determine βE2 (Assay Designs) and testosterone (DIAsource ImmunoAssays) were used to measure their concentrations as described by the manufacturer. The kits for determining Aβ1–42 (R & D Systems) were used as described by the manufacturer. Then the relative optical intensity of each well was read out by the microplate reader (Bio-Rad 480).
Proteasomal activity assay
Neuronal proteins were extracted in the cell lysis buffer (50 mm Tris, pH 8.0, 150 mm NaCl, 1% NP-40, 0.1% SDS) after treatments. Proteasomal activities were measured with cell extracts added by Proteasom-Glu Assay System (Promega) as described by the manufacturer.
Western blots
Neuronal proteins were extracted in the cell lysis buffer (50 mm Tris, pH 8.0, 150 mm NaCl, 1% NP-40, 0.1% SDS), and protein concentrations were measured by bicinchoninic acid (BCA) assay (Pierce). Protein extracts were denatured at 100°C for 5 min and separated on 15% SDS-PAGE at 70 V for ∼2 h. Proteins were transferred to Immobilon-P polyvinylidene fluoride membrane (Millipore) at 100 milliamps for 2 h. The membrane was blocked with 5% nonfat milk in Tris-buffered saline with 0.1% Tween 20 (TBS-T) at room temperature for 1 h. Anti-Hsp70, anti-Hsc70, anti-MOR, anti-Aβ 6E10, and anti-actin antibodies were diluted at 1:1000 for Western blots as primary antibodies. After 3 washes of 10 min each with TBS-T, goat anti-rabbit IgG conjugated with horseradish peroxidase (HRP) was added in a dilution of 1:2500 as the secondary antibody. The secondary HRP was detected by enhanced chemiluminescence. Optical density was analyzed by Bio-Rad ChemiDox.
Statistical evaluation
Statistical significance was assessed by one-way ANOVA. Sheffé's test was applied as a post hoc test for the significant difference showed by ANOVAs. A p value of <0.05 was used as an indicative of statistical significance. Power analysis for each experiment to validate group size was done using SPSS software, version 13.0.
Results
Morphine, endomorphin-1, and endomorphin-2 reduced cytotoxicity caused by intracellular Aβ
To examine the protective effects of morphine, we determined whether morphine could be neuroprotective against iAβ toxicity in cultured cells. In rat hippocampal neuronal cultures, microinjected iAβ1–42 induced ∼50% cell death compared to injection marker dye DTR alone in 24 h after direct microinjection of peptides measured by TUNEL (Fig. 1A). In our previous study, the injected iAβ1–42 contained monomeric, dimeric, trimeric, and high-molecular-weight fibrillar forms, while the toxic components were likely dimers, trimers, and fibrillars (Zhang et al., 2002). The injected Aβ remained in the neurons for at least 4 d, as indicated by the cytotoxicity data (Zhang et al., 2002). Aβ toxicity reached a maximal plateau at 4 d and lasted for 16 d after injection (Zhang et al., 2002). Microinjection of control reversed peptide Aβ42–1 did not induce remarkable cell death. Morphine (1 μm) had minimal effects on Aβ42–1 (Fig. 1A). To explore the dose effect of morphine, different dosages of morphine ranging from 0.1 to 10 μm were added to neurons injected with Aβ1–42. Morphine, at 0.5, 1, and 5 μm, but not at 10 μm, blocked Aβ-induced cell death (Fig. 1A). Since 1 μm morphine gave the maximal protective effect (Fig. 1A), we used this dose for the later in vitro experiments. To compare the dosage we used in the present study to the levels of morphine in the serum in patients from clinics, literature reported that in the cancer patients with chronic pain, slow-release morphine was applied daily after an immediate-release dose. Serum levels of morphine and its metabolites morphine-6-glucuronide and morphine-3-glucuronide were measured as 66, 257, and 1943 nm, respectively. (Klepstad et al., 2000). In rat hippocampal and human neuronal cultures, morphine (1 μm), as well as EM-1 (1 μm) and EM-2 (1 μm), reduced cell death caused by iAβ to ∼25% (Fig. 1B). To confirm the above protective effects of morphine, rat hippocampal neurons in culture were infected by Adeno-5 virus containing intracellularly expressed Aβ1–42, which coded for the entire human Aβ1–42 sequence (42 amino acids) without any signal peptide (Zhang et al., 2002). As previously showed in human neurons (Hou et al., 2009), this construct (cAβ1–42) expressed Aβ mainly in the cytosol with very low level secreted to the culture medium (Fig. 1C, top panel) when tested in C6 rat glioma cell line with the antibody (6E10) specific to human Aβ. In contrast, the sequence coding for Aβ1–42 with an additional signal peptide (sAβ1–42) expressed Aβ in the cytosol as well as secreted into the medium (Fig. 1C, top panel). The ELISA data for human Aβ confirmed that, in C6 cells, cAβ1–42 expressed Aβ mainly in the cytosol, whereas sAβ1–42 in both the cytosol and secreted form (Fig. 1C, middle panel). The toxicity of cAβ1–42 and sAβ1–42 was examined in the previous study that, when microinjected, cAβ1–42 induced much higher toxicity than sAβ1–42 in human neurons (Zhang et al., 2002). Here, rat hippocampal neurons was infected with Adeno-5 virus packaged with cAβ1–42 constructs with or without treatments of morphine (1 μm), EM-1 (1 μm) or EM-2 (1 μm). Similar to observed with Aβ peptide microinjection, Aβ induced ∼40% cell death at 24 h after infection, morphine, EM-1 and EM-2 protected such cell death by ∼50% (Fig. 1C).
Figure 1.
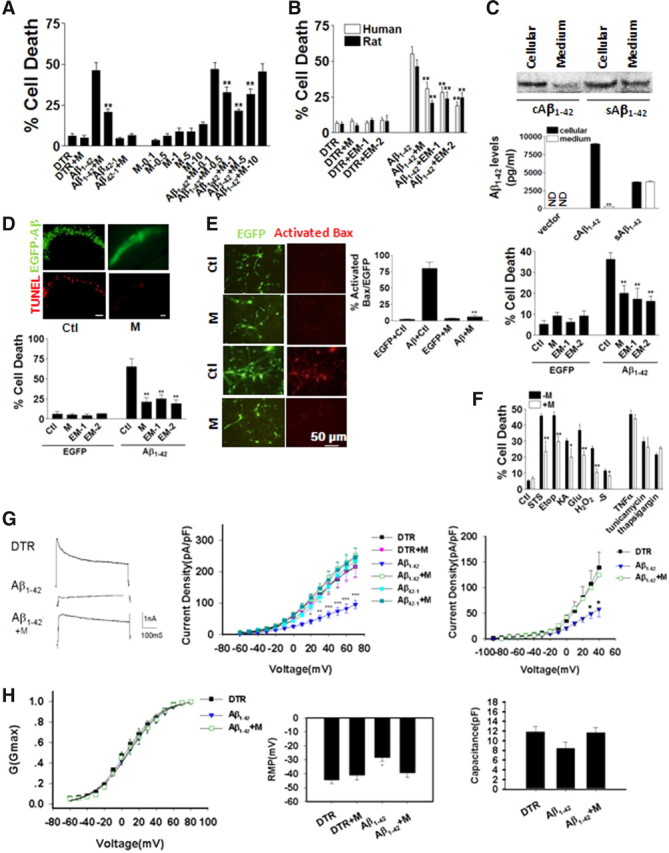
Morphine, endomorphin-1, and endomorphin-2 reduced cytotoxicity caused by intracellular Aβ. A, In cultured rat hippocampal neurons, cells were microinjected with Aβ1–42 or control reversed peptide Aβ42–1. Different doses of morphine (M) ranging from 0.1–10 μm were added to cells injected with Aβ1–42 (200 cells were injected for each treatment in each experiment, and every experiment was repeated 3 times in independent preparations). **p < 0.01 compared with the iAβ1–42 group. B, Morphine, EM-1, and EM-2 significantly reduced cell death induced by iAβ1–42 microinjection at 24 h treatment in human whole-brain and rat hippocampal neuronal cultures in three independent preparations (200 cells were injected for each treatment in each experiment, and every experiment was repeated 3 times). **p < 0.01 compared with the iAβ1–42 group. C, Top, The construct cAβ1–42 expressed Aβ mainly in the cytosol with very low level secreted to the culture medium when tested in C6 rat glioma cell line with the antibody (6E10) specific to human Aβ. In contrast, the sequence coding for Aβ1–42 with an additional signal peptide (sAβ1–42) expressed Aβ in the cytosol as well as that secreted into the medium. Middle, The ELISA data for human Aβ confirmed that, in C6 cells, cAβ1–42 expressed Aβ mainly in the cytosol, whereas sAβ1–42 in both the cytosol and secreted form. Bottom, In rat hippocampal neuronal cultures, neurons infected by EGFP-expressing or iAβ1–42-expressing Adeno-5 virus were treated with M, EM-1, or EM-2. M, EM-1, and EM-2 remarkably increased cell viability in iAβ1–42 group at 24 h (200 cells were counted for each treatment in each experiment, and every experiment was repeated 3 times). **p < 0.01 compared with iAβ1–42 group. ND, Not detected. D, Rat hippocampus CA1 areas were injected with EGFP-expressing or iAβ1–42-expressing Adeno-5 virus. Top, TUNEL-positive cells were less in the morphine-treated tissue than in the control tissue. Bottom, M, EM-1, and EM-2 greatly increased cell survival in iAβ1–42 group at 24 h (200 cells were counted for each treatment in each experiment, and every experiment was repeated 3 times). **p < 0.01 compared with iAβ1–42 group. E, Rat hippocampal neurons infected with EGFP-expressing or iAβ1–42-expressing Adeno-5 virus stained with activated Bax. Morphine reduced the level of activated Bax to the control group level at 24 h (200 cells were counted for each treatment in each experiment, and every experiment was repeated 3 times). **p < 0.01 compared with iAβ1–42 group. F, Morphine reduced toxicities by STS, Etop, KA, Glu, H2O2, serum deprivation (-S), TNF-α, tunicamycin, and thapsigargin in cultured rat hippocampal neurons at 24 h of treatment (200 cells were counted for each treatment in each experiment, and every experiment was repeated 3 times in independent preparations). **p < 0.01 compared with the −M group. G, Left, Typical traces recorded from control, iAβ1–42, and iAβ1–42+M group of neurons after 24 h treatment. Calibration: 1 nA, 100 ms. Middle, Whole-cell K+ current density recorded from different treatment groups at 24 h (10 cells were recorded for each treatment in each experiment, and every experiment was repeated 3 times in independent preparations). Right, A-type K+ current density recorded from different treatment groups at 24 h (10 cells were recorded for each treatment in each experiment, and every experiment was repeated 3 times in independent preparations). *p < 0.05; **p < 0.01; ***p < 0.001 compared with the control group. H, Left, Activation curve of K+ current at 24 h. There was no difference between treatment groups (10 cells were recorded for each treatment in each experiment, and every experiment was repeated 3 times in independent preparations). Middle, iAβ1–42 decreased the membrane capacitance of injected neurons at 24 h, although the difference was not statistically significant (p = 0.06; n = 3). Right, Resting membrane potentials recorded from different treatment groups at 24 h (10 cells were recorded for each treatment in each experiment, and every experiment was repeated 3 times in independent preparations). Scale bars: D, E, 50 μm. Error bars indicate SEM.
To further confirm morphine protection in vivo, intracellularly expressed Aβ1–42 was packaged into Adeno-5 virus and infected to rat hippocampus CA1 area. iAβ1–42 induced ∼40% cell death compared to the vector control group containing only EGFP in the brain slices collected at 24 h after infection (Fig. 1D). The cell death was reduced to ∼20% by morphine, EM-1, and EM-2 (all at 500 μm, 1.2 μl; Fig. 1D). To indicate the types of cell death (apoptosis, necrosis, or autophagy), the proapoptotic protein-activated Bax was also examined in virus-infected cultured rat hippocampal neurons. iAβ1–42 promoted a dramatic increase of activated Bax, which was reduced to control levels by morphine application (1 μm; Fig. 1E). To further explore whether morphine protection was specific to iAβ1–42 toxicity, various insults were applied to cultured rat hippocampal neurons with or without the presence of morphine (Fig. 1F). The results indicated that morphine attenuated the toxicity induced by STS (1 μm), Etop (1 μm), KA (100 μm), Glu (100 μm), H2O2 (200 μm), and serum deprivation, suggesting that the neuroprotective effect of morphine could be extended beyond the amyloid toxicity (Fig. 1F). In contrast, morphine did not reverse the toxicity induced by TNF-α (100 μg/L), tunicamycin (100 μg/L), and thapsigargin (100 μm), suggesting that morphine protection was selective (Fig. 1F).
To test the electrophysiological properties of Aβ-treated neurons, K+ currents were recorded from rat hippocampal neurons microinjected with Aβ1–42 or Aβ42–1 peptides with or without treatment of morphine (Fig. 1G, left). Our results suggested that Aβ1–42 reduced the whole-cell K+ current density (Fig. 1G, left), consistent with the results reported previously (Good and Murphy, 1996; Hou et al., 2009). The voltage-dependent activation of K+ currents showed no significant changes in Aβ1–42-injected neurons with or without morphine treatment (Fig. 1G, middle). Furthermore, the A-type K+ current density of the Aβ1–42 injected cells was lower than that of the control group (Fig. 1G, right). Morphine treatment alone had no effect on the K+ current density (Fig. 1G, middle). However, it blocked the reduction of both whole-cell and A-type K+ current density induced by Aβ1–42 (Fig. 1G). Interestingly, there was a trend that Aβ1–42 decreased the membrane capacitance of injected neurons, although the difference was not statistically significant (p = 0.06). Morphine reversed the capacitance changes caused by Aβ1–42 (Fig. 1H, middle). The resting membrane potentials of these treated neurons were also recorded. After Aβ1–42 treatment, the resting potential increased significantly (−28.5 ± 2.38 mV) compared with the control group (−44.5 ± 2.54 mV; Fig. 1H, right). Morphine treatment rescued the membrane potential loss (−39.5 ± 3.04 mV; Fig. 1H, right).
To confirm morphine protective role in the spatial memory performance, the rats infected by virus packaged with iAβ1–42 in the hippocampus CA1 area in Morris water maze were tested. Instead of peripheral administration, morphine was injected into the hippocampus to ensure its protective effects were not secondary to effects induced by morphine to the peripheral systems. There were no significant differences in the time spent in the target quadrant before the training in various treatment groups (Fig. 2A, top left). iAβ1–42 increased the searching time to platform (Fig. 2A, top middle) and swimming distance of rats (Fig. 2A, top right), whereas morphine (500 μm, 1.2 μl) reversed the changes induced by iAβ (Fig. 2A, top middle, top right). There was no significant difference in the swimming speed, suggesting that there was no difference in rat general locomotive ability (Fig. 2A, bottom left). After the test, with the platform removed, the probe trial data showed that iAβ-infected rats spent significantly less time in the target quadrant than other groups of rats, and morphine injection reversed such effect (Fig. 2A, bottom right). The effects of morphine on spatial memory were also examined in the WT and APP/PS1 transgenic mice (Fig. 2B). Mice were examined at 6 months of age since APP/PS1 mice started to show abnormal LTP at ∼3 months and cognitive impairment at 6 months (Trinchese et al., 2004). Also, APP/PS1 mice showed intracellular Aβ deposition at 2.5 months and dramatic extracellular Aβ loads at 6 months (Blanchard et al., 2003). The similar improvement was observed in APP/PS1 mice performance with morphine treatment (Fig. 2B, top middle, top right, bottom right). The above results showed that morphine improved water maze test performance of rat infected with virus expressing intracellular Aβ or APP/PS1 mice.
Figure 2.

Morphine improved spatial memory performance in water maze tests in rats transduced with intracellular Aβ and APP/PS1 mice. A, Morris water maze tests were performed in rat infected with adenovirus packaged with intracellular Aβ1–42 in the presence or absence of morphine. Top left, Time spent in the target quadrant for each treatment group (n = 8). Time to platform (top middle), swimming distance (top right), and swimming speed (bottom left) were recorded with different treatment groups (n = 8 for each group). Bottom right, After the test, the platform was removed, and the time spent in the target quadrant for each group was recorded (n = 8). B, Morris water maze tests were performed in APP/PS1 mice in the presence or absence of morphine. Top left, Time spent in the target quadrant for each treatment group (n = 8). Time to platform (top middle), swimming distance (top right), and swimming speed (bottom left) were recorded with different treatment groups (n = 8 for each group). Bottom right, After the test, the platform was removed, and time spent in the target quadrant for each group was recorded (n = 8). **p < 0.01 compared with the control group. Data are presented as mean ± SE.
Morphine protection was mediated through μ-opioid receptor and estrogen receptor activation
We then explored the mechanisms of morphine protection against iAβ toxicity. There are three types of opioid receptors on rat hippocampal neuron surface, MOR, δ-opioid receptor (DOR), and κ-opioid receptor (KOR) (Charron et al., 2008; Cui et al., 2008). To determine whether opioid receptors were involved in morphine protection against iAβ and which receptors played critical roles in its protection, pan opioid receptor antagonist naloxone (1 μm) or antagonists to MOR (β-FNA; 1 μm), DOR (naltrindole; 1 μm), and KOR (nor-BNI; 1 μm) were applied with morphine to the neurons microinjected with Aβ1–42 peptide. Naloxone and β-FNA blocked morphine protection, suggesting that MORs might be involved in morphine protection against iAβ (Fig. 3A). To further confirm that MORs played important role in morphine protection, two siRNAs to MOR were coinjected to neurons microinjected with Aβ1–42 with or without treatment of morphine. The silencing efficiency and off-target effects of all siRNAs used in this study were verified by the manufacturer. While negative control siRNA did not alter morphine protection, two MOR siRNAs effectively reversed morphine protection, confirming that MORs were involved in morphine protection (Fig. 3B).
Figure 3.
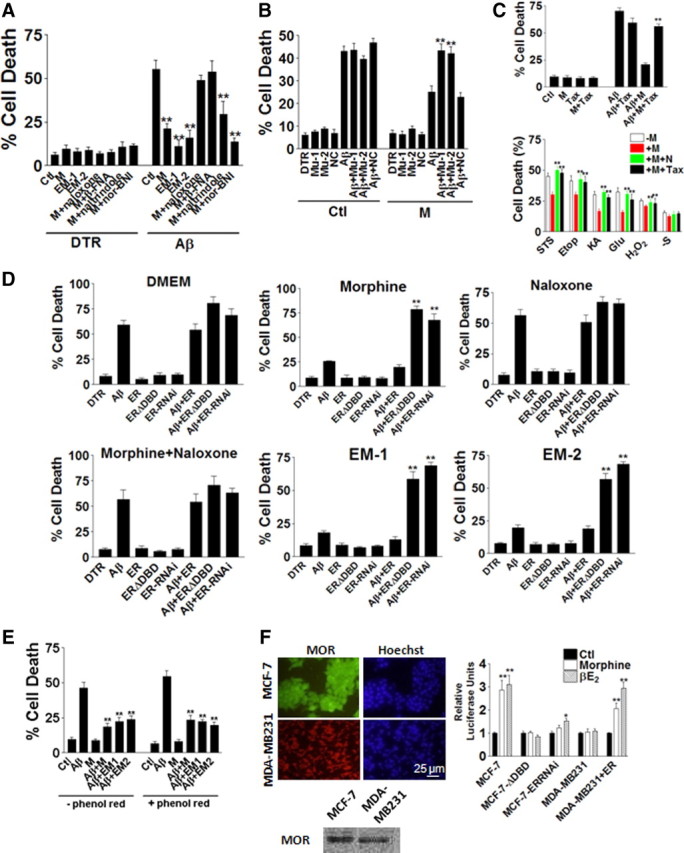
Morphine protection was mediated through μ-opioid receptor and estrogen receptor activation. A, Naloxone, naltrindole, β-FNA, and nor-BNI treatments for 24 h suggested that MORs were involved in morphine protection (200 cells were injected for each treatment in each experiment, and every experiment was repeated 3 times). **p < 0.01 compared with the iAβ1–42 group. B, Two siRNAs (Mu-1, Mu-2) and negative control siRNA were coinjected into neurons injected with iAβ1–42. Mu-1 and Mu-2 blocked morphine protection at 24 h (200 cells were injected for each treatment in each experiment, and every experiment was repeated 3 times). **p < 0.01 compared with the iAβ1–42 + M group. C, Top, Tax blocked morphine protection (200 cells were injected for each treatment in each experiment, and every experiment was repeated 3 times). Bottom, Naxloxone and Tax reversed morphine protection (200 cells were counted for each treatment in each experiment, and every experiment was repeated 3 times). **p < 0.01 compared with the iAβ1–42 + M group. D, Wild-type ER, ERΔDBD, and siRNA to ER (ER-RNAi) were coinjected into neurons injected with Aβ. Neurons were then treated with DMEM, morphine, naloxone, morphine plus naloxone, EM-1, or EM-2 for 24 h (200 cells were injected for each treatment in each experiment, and every experiment was repeated for three times). **p < 0.01 compared with the iAβ1–42 + M group. E, Phenol red did not affect morphine protection. Morphine protection was examined in culture medium with or without phenol red for 24 h (200 cells were injected for each treatment in each experiment, and every experiment was repeated 3 times). **p < 0.01 compared with the control group. F, Left, Immunostaining (top) and Western blot (bottom) showed the presence of MORs in MCF-7 and MDA-MB231 cells. Right, Luciferase reporter assay data showed that morphine induced ER activation in MCF-7 and MDA-MB231 cells transfected with ER at 24 h (repeated in 3 independent preparations). *p < 0.05; **p < 0.01 compared with the control group. Data are presented as mean ± SE.
Estrogen and androgen were reported to effectively protect against iAβ toxicity in human neurons (Zhang et al., 2004). To investigate whether morphine protection was mediated by ERs, tamoxifen (10 μm) was added to morphine treatment to Aβ1–42-injected neurons. Tax reduced morphine protection remarkably indicating that ERs might mediate morphine protection (Fig. 3C, top). Similarly, the involvement of MOR and ER was verified by naloxone and tamoxifen in the morphine protection against cytotoxicity induced by STS, Etop, KA, Glu, H2O2, and serum deprivation (Fig. 3C, bottom). To further confirm the involvement of ER, wild-type ER, ERΔDBD, and siRNA to ER were coinjected with Aβ1–42 into neurons with the treatments of DMEM only, morphine, naloxone, morphine with naloxone, EM-1, and EM-2. Our data showed that depletions of ER function by ERΔDBD or siRNA greatly reversed morphine protection, confirming that ERs were the key players (Fig. 3D). Since data suggested that phenol red in culture medium can mimic weak estrogen (Berthois et al., 1986), DMEM with or without phenol red were tested for their effects on morphine protection. There was no significant difference between two kinds of media (Fig. 3E). To examine whether morphine induced ER activation, breast cancer cell lines MCF-7 (ERα positive) and MDA-MB231 (ERα negative) were used. MORs were expressed in both cell lines, demonstrated by immunostaining and Western blot with MOR antibody (Fig. 3F, left). Luciferase reporter assay for estrogen response element suggested that in MCF-7 cells, morphine induced ER activation to almost the same degree as its agonist βE2, whereas MCF-7 transfected with ERΔDBD or ER siRNA did not respond to morphine (Fig. 3F, right). ERα-negative MDA-MB231 cells only responded to morphine when they were transfected with wild-type ER (Fig. 3F, right).
Morphine triggered estradiol release by neurons
We further investigated how morphine activated ERs. There were several possible ways that morphine activates ERs: (1) morphine binds to membrane MOR, activating ER through the signaling pathway; (2) morphine, as a small molecule, might get into cell membrane and bind to ER directly; (3) morphine induces estradiol release, which then in turn activates ER. Morphine and estrogen action pathways might interact with each other through PKA or PKC (Wagner et al., 1998; Farooqui et al., 2006). When PKA was inhibited by either PKA inhibitor fragment (6–22), PKAI, or PKAIM microinjection, there was no significant effect on morphine protection (Fig. 4A,B). PKC inhibitor STS (0.5 μm) or PKC activator phorbol esters (1 μm) did not alter morphine protection as well (Fig. 4A,B), suggesting that PKA or PKC might not be involved in morphine protection. To exclude the possibility that morphine could pass through cell plasma membrane, get into the cytosol area, and directly interact with cellular ER, BSA-M (0.5 mg/ml), which cannot pass through cell membrane, was added to Aβ1–42-injected neurons; BSA-M protected against iAβ1–42-induced cell death to almost the same extent as morphine, suggesting that morphine did not pass through cell membrane to have the protective effects (Fig. 4C).
Figure 4.

Morphine triggered estradiol release by neurons. A, Left, PKA inhibitor [PKA(−)], PKC inhibitor [PKC(−)], and PKC activator [PKC(+)] were added to morphine treatment for 24 h (200 cells were injected for each treatment in each experiment, and every experiment was repeated 3 times). **p < 0.01 compared with the control group. Right, Ratios of Aβ to control were calculated and plotted. There were no significant differences (ns) between morphine treatment alone and PKA(−), PKC(−), or PKC(+) (200 cells were injected for each treatment in each experiment and every experiment was repeated 3 times) compared with the M group. B, Left, PKAI and its mutant PKAIM were coinjected and treated by morphine for 24 h (200 cells were injected for each treatment in each experiment, and every experiment was repeated 3 times).**p < 0.01 compared with the control group. Right, Ratios of Aβ to control were calculated and plotted. There were no significant differences between morphine treatment alone and PKAI or PKAIM compared with M group (200 cells were injected for each treatment in each experiment, and every experiment was repeated 3 times). C, BSA-M still had protective effects at 24 h (200 cells were injected for each treatment in each experiment, and every experiment was repeated 3 times). **p < 0.01, compared with the iAβ1–42 group. D, Morphine treatment induced increased levels of βE2 and estrone, but not αE2 in culture medium at 24 h measured by LC-MS/MS (repeated in 3 independent preparations). **p < 0.01 compared with the control group. E, Morphine treatment induced increased levels of βE2 (top), but not testosterone (bottom) in culture medium at 24 h measured by ELISA (repeated in 3 independent preparations). **p < 0.01 compared with the control group. F, Wild-type AR and mutant AR (15579, 12474) did not alter morphine protection at 24 h (200 cells were injected for each treatment in each experiment, and every experiment was repeated 3 times). **p < 0.01 compared with the iAβ1–42 group. G, siRNA to P450 cytochrome aromatase (P450-RNAi) blocked morphine protection at 24 h (200 cells were injected for each treatment in each experiment, and every experiment was repeated 3 times). **p < 0.01 compared with the iAβ1–42 + M, iAβ1–42 + EM-1, iAβ1–42 + EM-2 groups. H, Left, Fluorescence recorded from real-time PCR (45 cycles). Right, Quantification of real-time PCR suggests that morphine treatment at 2 and 4 h increased levels of P450 cytochrome aromatase significantly (repeated in 3 independent preparations). *p < 0.05; **p < 0.01 compared with the control group. Data are presented as mean ± SE. I, The levels of mRNA of BACE-1 (left) and BACE-2 (right) were measured after 2 h treatment of morphine, naloxone, Tax, and combinations (repeated in 3 independent preparations). **p < 0.01 compared with the control group. J, BACE-1 and γ-secretase activities measured with or without the presence of morphine (repeated in 3 independent preparations). **p < 0.01 compared with the control group. K, Morphine did not alter the production of Aβ1–40 or Aβ1–42 in APP/PS1 mouse hippocampal tissues (repeated in 3 independent preparations). Data are presented as mean ± SE.
Another possible way that morphine interacted with ER was to induce estradiol release by neurons. Neurons could produce estrogen by themselves (Zwain and Yen, 1999; Kim et al., 2000). The amounts of βE2, its metabolite estrone, and inactive αE2 with or without morphine treatment were measured by LC-MS/MS. Our data showed that the levels of both βE2 and estrone remarkably increased in morphine-treated neurons, whereas αE2 levels remained unchanged (Fig. 4D). Since in neurons, estrogens were produced from testosterone by P450 cytochrome aromatase (Lephart, 1996), the amount of testosterone was also measured by ELISA. Although ELISA data showed remarkable increase of βE2 levels in the morphine-treated group, there was no difference in testosterone between morphine-treated and control groups (Fig. 4E). The protective effects of morphine were also examined in the neurons microinjected with wild-type AR and two point-mutation-containing dominate-negative mutants, 15579 and 12474 (Zhang et al., 2004). Deletions of AR function by both 15579 and 12474 did not alter morphine protection, suggesting that testosterone and AR might not be involved in morphine protection (Fig. 4F).
Given that testosterone did not change with morphine treatment, the involvement of P450 cytochrome aromatase was tested by applying its siRNA. P450 cytochrome aromatase siRNA greatly reduced protection induced by morphine, EM-1, and EM-2, indicating that P450 cytochrome aromatase played an important role resulting in the increase of estrogen formation (Fig. 4G). There are two possible ways of increased P450 cytochrome aromatase function: (1) the expression level of P450 cytochrome aromatase might increase, or (2) if the amount of P450 cytochrome aromatase is constant, its activity might enhance. The level of P450 cytochrome aromatase was examined by real-time PCR, and the data showed that the levels of P450 cytochrome aromatase increased significantly at 2 and 4 h of morphine treatment, suggesting that morphine upregulated P450 cytochrome aromatase expression and therefore enhanced its activity (Fig. 4H). Since there was a study reporting that morphine could regulate BACE-1 and BACE-2 levels in neuroblastoma HTB-11 cells (Pak et al., 2005), we also examined the levels of BACE-1 and BACE-2 mRNA in morphine, naloxone, tamoxifen, and combined treatment groups. Morphine increased both BACE-1 and BACE-2 mRNA levels after 2 h of treatment. Naloxone reversed the upregulation of both BACE-1 and BACE-2 mRNA levels by morphine, suggesting such an increase was mediated through opioid receptors (Fig. 4I). Tamoxifen also increased both BACE-1 and BACE-2 mRNA levels. In the presence of tamoxifen, morphine increased both BACE-1 and BACE-2 mRNA to greater levels, suggesting an additive effect of morphine and tamoxifen on regulating BACE-1 and BACE-2 (Fig. 4I). The activities of BACE-1 and γ-secretase were measured, and our data showed that with the presence of morphine, BACE-1 activity increased, whereas γ-secretase activity decreased (Fig. 4J). Since BACE-1 and γ-secretase activities were suggested to change Aβ production, the levels of Aβ1–40 and Aβ1–42 in the hippocampal tissue of APP/PS1 mice with or without morphine treatment (500 μm, 1.2 μl) were measured. After 24 h of treatment, the production of Aβ1–40 and Aβ1–42 did not show significant alterations (Fig. 4K).
Estradiol release induced by morphine was responsible for morphine protection
To address whether morphine protection against iAβ toxicity could be explained completely by estradiol release induced by morphine, neurons were treated under two procedures: pretreatment and posttreatment. In the pretreatment procedure, the first batch of neurons were treated with either control medium or morphine for 24 h, the conditioned medium was then taken out from these neurons and given to the second batch of neurons for a 24 h treatment, and the data were collected after conditioned medium treatment. In the posttreatment procedure, neurons were only treated with or without morphine for 24 h (Fig. 5A). When comparing morphine protection induced by the two procedures, there was no significant difference (Fig. 5B). Since morphine also induced an increase in ERα levels (Fig. 5C), the effects of overexpression of ERα were also investigated. Overexpression of ERα by microinjecting wild-type ER in neurons dramatically enhanced morphine protection in the pretreatment procedure, while ERΔDBD and ER siRNA blocked this effect, suggesting that morphine induced estrogen release and increase of ERα both contributed to morphine protection (Fig. 5D).
Figure 5.
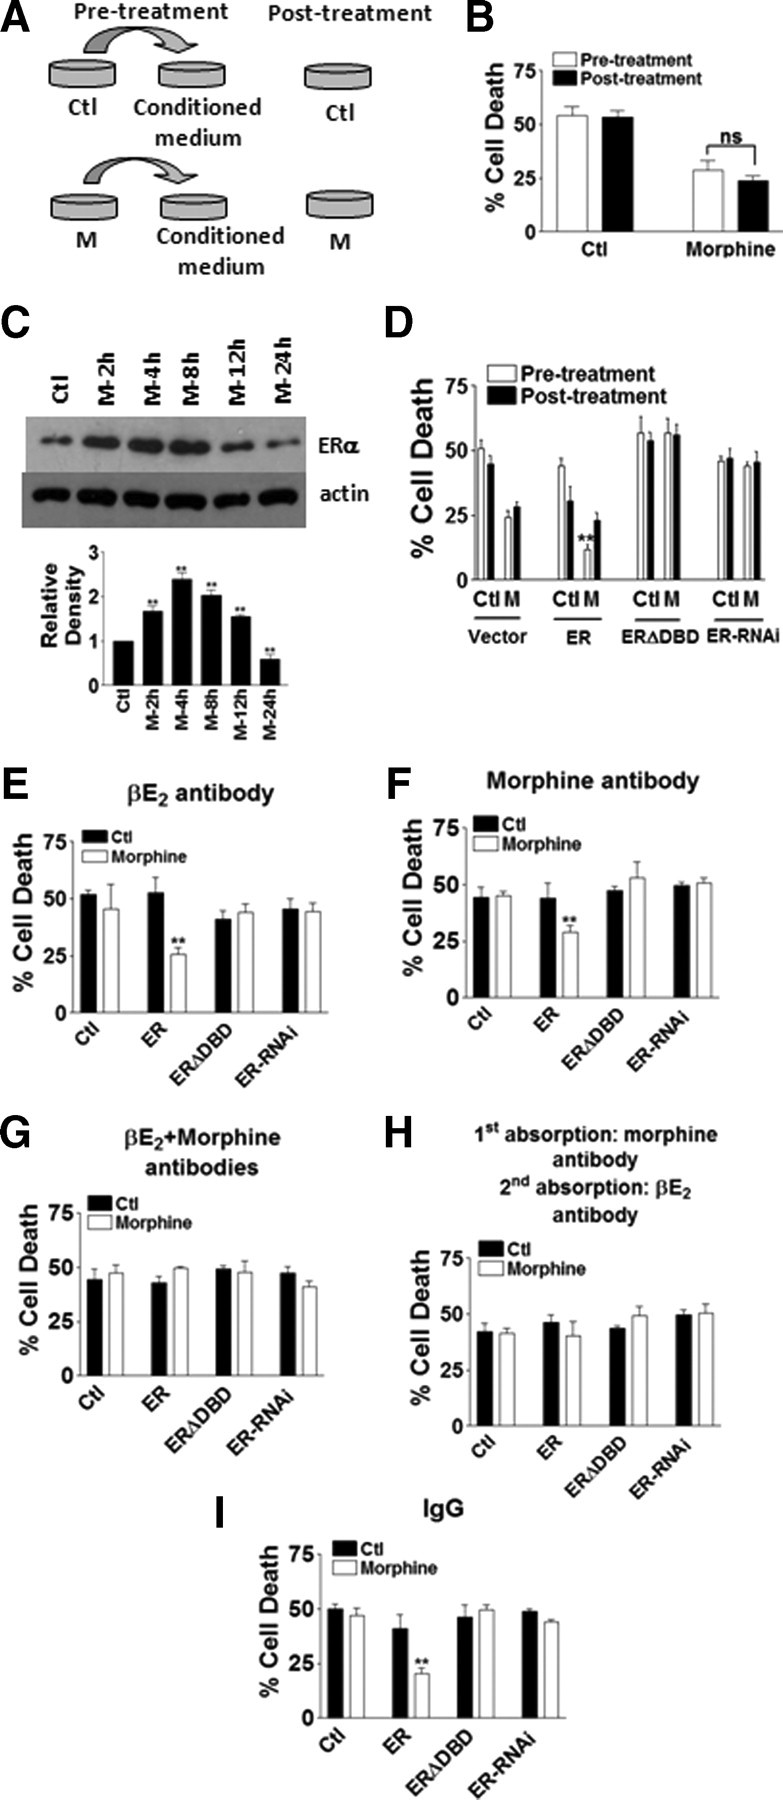
Estradiol release induced by morphine was responsible for morphine protection. A, Experimental procedures for pretreatment and posttreatment. B, There was no significant difference (ns) between pretreatment and posttreatment of morphine at 24 h (200 cells were counted for each treatment in each experiment, and every experiment was repeated 3 times). C, Top, Western blot showing the levels of ERα and actin with 2 to 24 h morphine treatments. Bottom, Quantification of of ERα levels from Western blot at specified time points (repeated in 3 independent preparations). **p < 0.01 compared with the control group. D, Morphine protection was significantly increased with ER overexpression in pretreatment at 24 h (200 cells were injected for each treatment in each experiment, and every experiment was repeated 3 times). **p < 0.01 compared with the control group. E, Conditioned medium from the pretreatment procedure was absorbed by βE2 antibody and then added to neurons for 24 h. F, Conditioned medium from the pretreatment procedure was absorbed by morphine antibody and then added to neurons for 24 h. G, Conditioned medium from the pretreatment procedure was absorbed by βE2 and morphine antibodies and then added to neurons for 24 h. H, Conditioned medium from the pretreatment procedure was first absorbed by morphine antibody and then by βE2 antibody, and then added to neurons for 24 h. I, Conditioned medium from the pretreatment procedure was absorbed by control IgG and then added to neurons for 24 h (200 cells were injected for each treatment in each experiment, and every experiment was repeated 3 times). **p < 0.01 compared with the control group. Data are presented as mean ± SE.
In the pretreatment procedure, the conditioned medium from the control group contained only morphine, and the conditioned medium from the morphine-treated group contained both morphine and released estradiol. To distinguish the protective effects by morphine and released estradiol, the conditioned medium was absorbed by estradiol antibody or morphine antibody, and then added to the second batch of neurons to observe morphine protection. When the conditioned medium was absorbed by βE2 or morphine antibody alone, with the overexpression of ER, there were still a significant amount of morphine protection (Fig. 5E,F), indicating that both estradiol and morphine contributed to morphine protection. When the conditioned medium was absorbed by βE2 and morphine antibodies together, or first by morphine antibody and then second by the βE2 antibody, morphine protection was completely abolished (Fig. 5G,H). Using rabbit IgG for absorption did not change morphine protection (Fig. 5I). Comparison of the data from Figure 5, F and H, indicated that, with ER overexpression, morphine protection can be explained completely by its induction of estrogen release.
Heat shock protein 70 was involved in morphine protection
The data above show that morphine protection against iAβ depends on morphine-induced estrogen release by neurons and upregulation of ERα. It was reported that the protective effects of estrogen against iAβ in human primary neurons were mediated by Hsp70 (Zhang et al., 2004). Therefore, the involvement of Hsp70 was examined in morphine protection in the current study. Heat shock transcription factor-1 (HSF1) knock-out mice did not produce Hsp70 or other members of heat shock family (McMillan et al., 1998). The presence of both ER and MOR was first confirmed in the neuronal culture of hippocampus from HSF1−/− mice to ensure these mice could respond to both estrogen and morphine (Fig. 6A).
Figure 6.
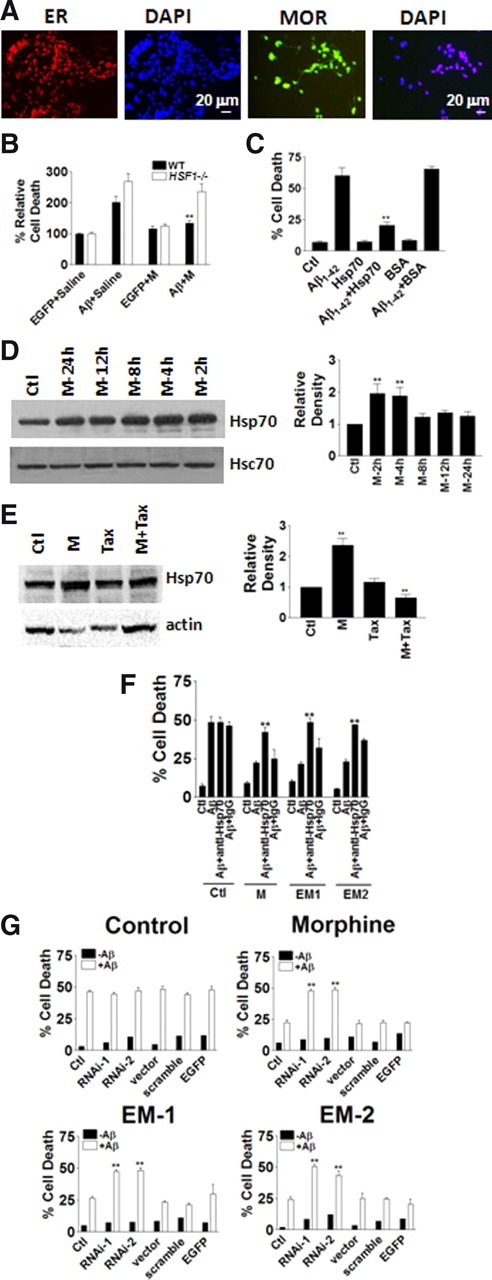
Heat shock protein 70 was involved in morphine protection. A, Primary neuronal cultures of the hippocampal regions from HSF1 knock-out (HSF1−/−) mice stained with ER or MOR antibodies. B, Mouse hippocampus CA1 areas were injected with EGFP-expressing or iAβ1–42-expressing Adeno-5 virus. Morphine greatly increased cell survival in the iAβ1–42 group at 24 h (200 cells were counted for each treatment in each experiment, and every experiment was repeated 3 times). **p < 0.01 compared with the iAβ1–42 group. C, Hsp70 protected hippocampal neurons in culture from iAβ1–42 toxicity at 24 h (200 cells were injected for each treatment in each experiment, and every experiment was repeated 3 times). **p < 0.01 compared with the iAβ1–42 group. D, Morphine induced increase of Hsp70 levels in 2 and 4 h treatments (repeated in 3 independent preparations). **p < 0.01 compared with the control group. E, Tax blocked Hsp70 increase induced by morphine at 2 h (repeated in 3 independent preparations). **p < 0.01 compared with the control group. F, Hsp70 antibody blocked M, EM-1, and EM-2 protections at 24 h (200 cells were injected for each treatment in each experiment, and every experiment was repeated 3 times). **p < 0.01 compared with the iAβ1–42 + M, iAβ1–42 + EM-1, and iAβ1–42 + EM-2 groups. G, Two siRNAs to Hsp70 (RNAi-1 and RNAi-2) blocked M, EM-1, and EM-2 protections at 24 h (200 cells were injected for each treatment in each experiment, and every experiment was repeated 3 times). **p < 0.01 compared with the iAβ1–42 + M, iAβ1–42 + EM-1, and iAβ1–42 + EM-2 groups. Data are presented as mean ± SE.
When infected with iAβ-expressing virus, cell death, measured by TUNEL, from the hippocampus CA1 area of HSF1−/− mice increased to ∼250% compared to control EGFP virus infection (Fig. 6B). Morphine (500 μm; 1.2 μl) reduced cell death in WT mice but not in HSF1−/− mice, suggesting that Hsps might be involved in morphine protection (Fig. 6B). To further identify which Hsps were responsible for morphine protection, recombinant Hsp70 was microinjected with Aβ1–42 peptide into cultured rat hippocampal neurons. Without morphine application, Hsp70 induced ∼60% protection, whereas control protein BSA did not protect at all (Fig. 6C). To associate Hsp70 and morphine protection together, the expression levels of Hsp70 with or without morphine treatment were first examined. Western blot data showed that morphine induced a remarkable increase of Hsp70 level in cultured hippocampal neurons (Fig. 6D). Tax effectively blocked morphine induced Hsp70 upregulation, suggesting that ER activation was involved in morphine-induced Hsp70 upregulation (Fig. 6E). Depletion of Hsp70 function by Hsp70-neutralizing antibody (Fig. 6F) and two siRNAs to Hsp70 (Fig. 6G) completely blocked morphine, EM-1, and EM-2 protection, indicating that Hsp70 was required for morphine protection.
Hsp70 protected against iAβ toxicity by increasing proteasomal activity
Cytotoxicity of iAβ was showed to be induced by p53 activation, Bax, and caspase-6 in human primary neurons (Zhang et al., 2002). Whether Hsp70 protected against p53, Bax, or caspase-6 was examined first. Recombinant Hsp70 was comicroinjected with p53 wild-type or dominant-negative constructs, recombinant Bax, Bcl2, or caspase-6 (Fig. 7A–C). Our data showed that Hsp70 did not protect against p53, Bax, or caspase-6 toxicity when these proapoptotic factors microinjected alone without iAβ into neurons (Fig. 7A–C). iAβ was reported to impair proteasome degradation (Ohyagi, 2008); therefore, we asked the question of whether Hsp70 prevented iAβ toxicity through rescuing proteasome degradation. Measured proteasomal activity showed that Hsp70 reversed the changes induced by iAβ1–42 (Fig. 7D). Proteasome inhibitor MG-132 (0.5, 1, and 10 μm) blocked Hsp70 protection, suggesting that Hsp70 recovered proteasomal activity impaired by iAβ (Fig. 7E). To further test this hypothesis, Ub-EGFP was microinjected into neurons. Under normal condition, ubiquitin was rapidly degraded by proteasome; therefore, at 24 h after injection, there were only a few EGFP spots detected (Fig. 7F, left). With impaired proteasomal activity induced by proteasome inhibitor MG-132 (0.5 μm) or lactacystein (20 μm), EGFP accumulated in more cells (Fig. 7F, middle, right). Coinjection of Hsp70 and Aβ1–42 peptide or Aβ1–42 cDNA construct effectively reversed the impairment of proteasomal activity induced by iAβ (Fig. 7G,H), suggesting that Hsp70 protection might be mediated through improved proteasomal activity.
Figure 7.
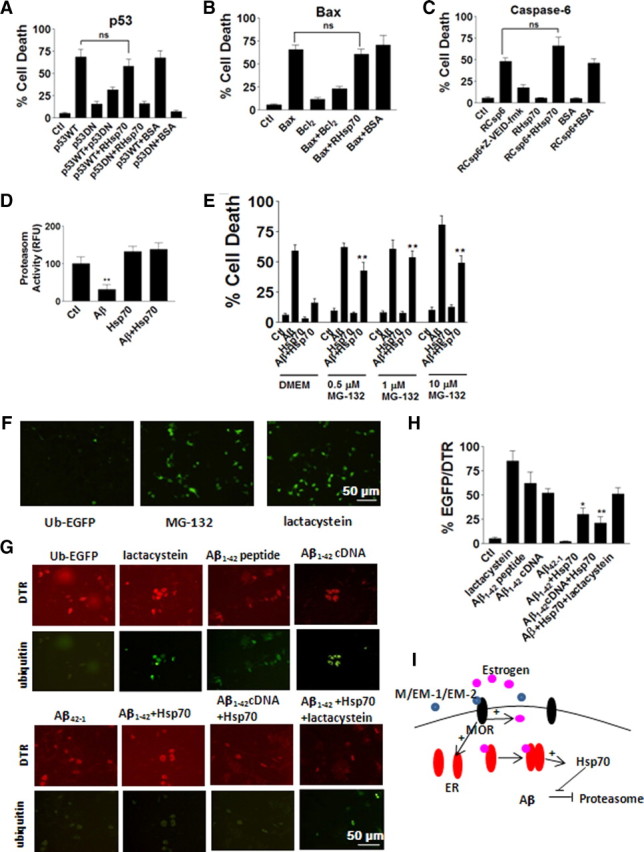
Hsp70 protected against iAβ toxicity by increasing proteasomal activity. A–C, Recombinant Hsp70 was comicroinjected into neurons with p53 wild-type or dominant-negative constructs (A), recombinant Bax, Bcl2 (B), or caspase-6 (C) at 24 h (200 cells were injected for each treatment in each experiment, and every experiment was repeated 3 times). D, Hsp70 itself protected against iAβ1–42 toxicity at 24 h (200 cells were injected for each treatment in each experiment, and every experiment was repeated 3 times). **p < 0.01 compared with the iAβ1–42 groups. E, Proteasome inhibitor MG-132 blocked Hsp70 protection at 24 h (200 cells were injected for each treatment in each experiment, and every experiment was repeated 3 times). **p < 0.01, compared with iAβ1–42 + Hsp70 groups. F, Ub-EGFP was used as an indicator for proteasomal activity at 24 h. G, Hsp70 rescued proteasomal activity impaired by iAβ1–42 at 24 h. H, Quantification of Aβ degradation associated with ubiquitin by number of EGFP-positive cells over DTR-positive cells (200 cells were injected for each treatment in each experiment, and every experiment was repeated 3 times). **p < 0.01 compared with the iAβ1–42 groups. Data are presented as mean ± SE. I, Schematic drawing of morphine protection pathway. Morphine, EM-1, or EM-2 induced estrogen release by neurons and upregulation of ER through binding to their receptor MOR on cell membrane. Activated ER then induced increase of Hsp70, which rescued proteasomal activity impaired by iAβ.
Discussion
In the present study, we find that morphine as well as EM-1 and EM-2 can reduce iAβ toxicity in human neuronal culture, rat hippocampal neuronal culture, and rat brain in vivo. Morphine reverses the electrophysiological changes induced by iAβ in cultured hippocampal neurons, including current density, resting membrane potential, and capacitance. Also, morphine improves the spatial memory performance of APP/PS1 mice and rats infected by iAβ packaged virus in Morris water maze tests. These in vivo data suggest that morphine can improve functions of neuronal transmission and cognitive performance.
Morphine is indicated to modulate cell death/survival and play antiapoptotic roles in neurons of the CNS. However, the mechanisms of morphine protection are not clear yet. Morphine preconditioning-induced ischemia tolerance is mediated through novel PKCε (nPKCε) isoform and NMDA receptors since morphine protection is greatly reduced by nPKCε and NMDA receptor-specific antagonists or by blockage of membrane translocations of nPKCε and NMDA receptors in mouse hippocampal slices (Liu et al., 2001; Fanjun et al., 2006). It is proposed that morphine-induced nitrogen oxide release mediates neuroprotection in a human neuroblastoma cell line against intracellular oxidative stress and neuroinflammation (Rambhia et al., 2005). Protection of morphine against peroxynitrite-induced apoptosis in primary rat neonatal astrocytes is mediated by phosphoinositide 3-kinase (Kim et al., 2001). Morphine decreases BACE-1 mRNA while increasing BACE-2 mRNA in human neuroblastoma HTB-11 cells. Downregulation of BACE-1 and upregulation of BACE-2 has been shown to decrease Aβ levels; therefore, morphine is suggested to be protective against extracellular Aβ toxicity (Pak et al., 2005). Our data showed that morphine increases both BACE-1 and BACE-2 mRNA in primary rat hippocampal neurons. In APP/PS1 mouse hippocampal tissues, morphine does not alter Aβ1–40 or Aβ1–42 production significantly. The differences between our data and the results reported by Pak et al. (2005) may be explained by cell-type specificity.
In this study, we find that morphine protection is mediated by inducing estradiol release from hippocampal neurons, possibly by increasing P450 cytochrome aromatase expression and therefore upregulating its activity. Released estrogen induces upregulation of Hsp70 through binding to its receptor ER, which is consistent with the fact that morphine induces Hsp70 and Hsp27 mRNA upregulation in rat brains (Ammon-Treiber et al., 2004). Hsp70 protects against intracellular amyloid toxicity by increasing proteasomal activity that is reduced by iAβ (Fig. 7I). We also provide a novel mechanism for morphine action: induction of estradiol release by neurons, which is protective against iAβ toxicity in our case. Although estrogen secretion by hippocampal neurons is described previously (Kretz et al., 2004; Prange-Kiel et al., 2006, 2008), this is the first time, to our knowledge, that induction of estradiol release in hippocampal neurons by morphine is reported. The efficacy of estrogen replacement therapy has been debated for a long time, and cognitive function is not necessarily improved after the therapy (Birge, 1996; Schneider and Finch, 1997; Mulnard, 2000; LeBlanc, 2002). Transgenic rodent models of AD show that elevated estrogen levels reduce deposition of Aβ in the brain (Pinkerton and Henderson, 2005). However, some studies have identified that estrogen replacement therapy improves senescent memory loss or functional decline in postmenopausal women (Kawas et al., 1997; Baldereschi et al., 1998; Yaffe et al., 1998; Maki and Resnick, 2001), while others demonstrated no benefits (Rapp et al., 2003; Shumaker et al., 2003; Galen Buckwalter et al., 2004; Kang et al., 2004). We think this may, at least partially, be attributed to the loss of estrogen receptors after menopause. Some studies suggest that early treatment of estrogen is beneficial, while others cannot reach specific conclusions. Therefore, even through our data show that morphine stimulates estrogen release by neurons and plays a protective role against amyloid toxicity, how to apply this knowledge to disease therapy in a chronic situation still needs extensive studies. On the other hand, because morphine has great side effects such as tolerance, physical dependence, respiratory suppression, and constipation (Zhang et al., 2008), which greatly limit its medical and clinical applications, alternatives should be developed to overcome these side effects. Our data also indicate that EM-1 and EM-2 can also reduce iAβ-induced cell death, suggesting that stimulating the release of endogenous EMs might be one of these alternatives. In our study, morphine upregulates P450 cytochrome aromatase expression. Evidence shows that cAMP and its analog inhibit P450 activity (Lephart, 1996). On the other hand, acute and chronic treatments of morphine are demonstrated to decrease cAMP levels in the brain (Duman et al., 1988). It is possible that morphine upregulates P450 levels through decreasing cAMP. A better understanding of morphine action mechanisms will help to develop new technologies and treatments to maximize its benefits and limit its side effects. These efforts will eventually lead to new clinical potentials for this ancient drug.
Footnotes
This work was supported by the National Program of Basic Research sponsored by the Ministry of Science and Technology of China (2009CB941301), a Roche research grant, Peking University President Research Grant, and a Ministry of Education recruiting research grant. The appropriate approvals and procedures were used concerning human subjects and animals. The protocol was approved by the Peking University Medical School Institutional Review Board (IRB00001052-0572). We thank Drs. Longchuan Yu, Yong Cheng (Peking University, Beijing, China), and Nan Sui (Institute of Psychology, Chinese Academy of Sciences) for assistance with the water maze test; Dr. Meizhi Liu (Peking Union Medical College Hospital) for technical assistance with measuring estrogen concentrations; Dr. Zehui Gong (Institute for Military Medical Sciences) for providing the BSA-M; Dr. Yongfeng Shang (School of Medicine, Peking University) for providing MCF-7 and MDA-MB231 cell lines; Dr. Richard Day (School of Medicine, University of Virginia, Charlottesville, VA) for providing PKAI and PKAIM constructs; Dr. Ramunas Vabulas (Max Planck Institute of Biochemistry, Martinsried, Germany) for providing the Ub-EGFP construct; Mr. Yu Tian (Technical Analysis Department, Beijing Municipal Public Security Bureau, Xuanwu Division) for technical assistance of measuring testosterone concentrations; Ms. Qiuyue Chen (College of Life Sciences, Peking University) for technical assistance with luciferase activity measurement; and Drs. Sam Sisodia (University of Chicago) and Karl Herrup (Rutgers University) for reading this manuscript and giving thoughtful suggestions.
The authors declare no competing financial interests.
References
- Ammon-Treiber S, Grecksch G, Stumm R, Riechert U, Tischmeyer H, Reichenauer A, Hollt V. Rapid, transient, and dose-dependent expression of hsp70 messenger RNA in the rat brain after morphine treatment. Cell Stress Chaperones. 2004;9:182–197. doi: 10.1379/CSC-42.1. [DOI] [PMC free article] [PubMed] [Google Scholar]
- Ammon-Treiber S, Stolze D, Schroder H, Loh H, Hollt V. Effects of opioid antagonists and morphine in a hippocampal hypoxia/hypoglycemia model. Neuropharmacology. 2005;49:1160–1169. doi: 10.1016/j.neuropharm.2005.06.016. [DOI] [PubMed] [Google Scholar]
- Avdoshina V, Biggio F, Palchik G, Campbell LA, Mocchetti I. Morphine induces the release of CCL5 from astrocytes: potential neuroprotective mechanism against the HIV protein gp120. Glia. 2010;58:1630–1639. doi: 10.1002/glia.21035. [DOI] [PMC free article] [PubMed] [Google Scholar]
- Baldereschi M, Di Carlo A, Lepore V, Bracco L, Maggi S, Grigoletto F, Scarlato G, Amaducci L. Estrogen-replacement therapy and Alzheimer's disease in the Italian Longitudinal Study on Aging. Neurology. 1998;50:996–1002. doi: 10.1212/wnl.50.4.996. [DOI] [PubMed] [Google Scholar]
- Berthois Y, Katzenellenbogen JA, Katzenellenbogen BS. Phenol red in tissue culture media is a weak estrogen: implications concerning the study of estrogen-responsive cells in culture. Proc Natl Acad Sci U S A. 1986;83:2496–2500. doi: 10.1073/pnas.83.8.2496. [DOI] [PMC free article] [PubMed] [Google Scholar]
- Birge SJ. Is there a role for estrogen replacement therapy in the prevention and treatment of dementia? J Am Geriatr Soc. 1996;44:865–870. doi: 10.1111/j.1532-5415.1996.tb03749.x. [DOI] [PubMed] [Google Scholar]
- Blanchard V, Moussaoui S, Czech C, Touchet N, Bonici B, Planche M, Canton T, Jedidi I, Gohin M, Wirths O, Bayer TA, Langui D, Duyckaerts C, Tremp G, Pradier L. Time sequence of maturation of dystrophic neurites associated with Abeta deposits in APP/PS1 transgenic mice. Exp Neurol. 2003;184:247–263. doi: 10.1016/s0014-4886(03)00252-8. [DOI] [PubMed] [Google Scholar]
- Charron C, Messier C, Plamondon H. Neuroprotection and functional recovery conferred by administration of kappa- and delta 1-opioid agonists in a rat model of global ischemia. Physiol Behav. 2008;93:502–511. doi: 10.1016/j.physbeh.2007.10.015. [DOI] [PubMed] [Google Scholar]
- Cui J, Chen Q, Yu LC, Zhang Y. Chronic morphine application is protective against cell death in primary human neurons. Neuroreport. 2008;19:1745–1749. doi: 10.1097/WNR.0b013e3283186fd7. [DOI] [PubMed] [Google Scholar]
- Day RN, Walder JA, Maurer RA. A protein kinase inhibitor gene reduces both basal and multihormone-stimulated prolactin gene transcription. J Biol Chem. 1989;264:431–436. [PubMed] [Google Scholar]
- Duman RS, Tallman JF, Nestler EJ. Acute and chronic opiate-regulation of adenylate cyclase in brain: specific effects in locus coeruleus. J Pharmacol Exp Ther. 1988;246:1033–1039. [PubMed] [Google Scholar]
- Fanjun M, Junfa L, Bingxi Z, Fang J. nPKCepsilon and NMDA receptors participate in neuroprotection induced by morphine pretreatment. J Neurosurg Anesthesiol. 2006;18:119–124. doi: 10.1097/00008506-200604000-00005. [DOI] [PubMed] [Google Scholar]
- Farooqui M, Geng ZH, Stephenson EJ, Zaveri N, Yee D, Gupta K. Naloxone acts as an antagonist of estrogen receptor activity in MCF-7 cells. Mol Cancer Ther. 2006;5:611–620. doi: 10.1158/1535-7163.MCT-05-0016. [DOI] [PubMed] [Google Scholar]
- Galen Buckwalter J, Crooks VC, Robins SB, Petitti DB. Hormone use and cognitive performance in women of advanced age. J Am Geriatr Soc. 2004;52:182–186. doi: 10.1111/j.1532-5415.2004.52053.x. [DOI] [PubMed] [Google Scholar]
- Good TA, Murphy RM. Effect of beta-amyloid block of the fast-inactivating K+ channel on intracellular Ca2+ and excitability in a modeled neuron. Proc Natl Acad Sci U S A. 1996;93:15130–15135. doi: 10.1073/pnas.93.26.15130. [DOI] [PMC free article] [PubMed] [Google Scholar]
- Hou JF, Cui J, Yu LC, Zhang Y. Intracellular amyloid induces impairments on electrophysiological properties of cultured human neurons. Neurosci Lett. 2009;462:294–299. doi: 10.1016/j.neulet.2009.07.031. [DOI] [PubMed] [Google Scholar]
- Kang DH, Yu ES, Yoon KI, Johnson R. The impact of gender on progression of renal disease: potential role of estrogen-mediated vascular endothelial growth factor regulation and vascular protection. Am J Pathol. 2004;164:679–688. doi: 10.1016/S0002-9440(10)63155-0. [DOI] [PMC free article] [PubMed] [Google Scholar]
- Kawas C, Resnick S, Morrison A, Brookmeyer R, Corrada M, Zonderman A, Bacal C, Lingle DD, Metter E. A prospective study of estrogen replacement therapy and the risk of developing Alzheimer's disease: the Baltimore Longitudinal Study of Aging. Neurology. 1997;48:1517–1521. doi: 10.1212/wnl.48.6.1517. [DOI] [PubMed] [Google Scholar]
- Kim HS, Park CH, Cha SH, Lee JH, Lee S, Kim Y, Rah JC, Jeong SJ, Suh YH. Carboxyl-terminal fragment of Alzheimer's APP destabilizes calcium homeostasis and renders neuronal cells vulnerable to excitotoxicity. Faseb J. 2000;14:1508–1517. doi: 10.1096/fj.14.11.1508. [DOI] [PubMed] [Google Scholar]
- Kim MS, Cheong YP, So HS, Lee KM, Kim TY, Oh J, Chung YT, Son Y, Kim BR, Park R. Protective effects of morphine in peroxynitrite-induced apoptosis of primary rat neonatal astrocytes: potential involvement of G protein and phosphatidylinositol 3-kinase (PI3 kinase) Biochem Pharmacol. 2001;61:779–786. doi: 10.1016/s0006-2952(01)00541-x. [DOI] [PubMed] [Google Scholar]
- Klepstad P, Skogvoll E, Kaasa S, Borchgrevink PC. Circadian distribution of oral opioid consumption in cancer patients. Methods Find Exp Clin Pharmacol. 2000;22:753–755. doi: 10.1358/mf.2000.22.10.802293. [DOI] [PubMed] [Google Scholar]
- Kretz O, Fester L, Wehrenberg U, Zhou L, Brauckmann S, Zhao S, Prange-Kiel J, Naumann T, Jarry H, Frotscher M, Rune GM. Hippocampal synapses depend on hippocampal estrogen synthesis. J Neurosci. 2004;24:5913–5921. doi: 10.1523/JNEUROSCI.5186-03.2004. [DOI] [PMC free article] [PubMed] [Google Scholar]
- LeBlanc A. Increased production of 4 kDa amyloid beta peptide in serum deprived human primary neuron cultures: possible involvement of apoptosis. J Neurosci. 1995;15:7837–7846. doi: 10.1523/JNEUROSCI.15-12-07837.1995. [DOI] [PMC free article] [PubMed] [Google Scholar]
- LeBlanc A. Estrogen and Alzheimer's disease. Curr Opin Investig Drugs. 2002;3:768–773. [PubMed] [Google Scholar]
- Lephart ED. A review of brain aromatase cytochrome P450. Brain Res Brain Res Rev. 1996;22:1–26. [PubMed] [Google Scholar]
- Li M, Chen L, Lee DH, Yu LC, Zhang Y. The role of intracellular amyloid beta in Alzheimer's disease. Prog Neurobiol. 2007;83:131–139. doi: 10.1016/j.pneurobio.2007.08.002. [DOI] [PubMed] [Google Scholar]
- Liu H, McPherson BC, Yao Z. Preconditioning attenuates apoptosis and necrosis: role of protein kinase C epsilon and -delta isoforms. Am J Physiol Heart Circ Physiol. 2001;281:H404–410. doi: 10.1152/ajpheart.2001.281.1.H404. [DOI] [PubMed] [Google Scholar]
- Liu Y, Nie YM, Wu WK. [The effect of PKC activation and Smac release on inhibition of myocardial cell apoptosis by Sini Decoction] Zhong Yao Cai. 2008;31:1675–1678. [PubMed] [Google Scholar]
- Maki PM, Resnick SM. Effects of estrogen on patterns of brain activity at rest and during cognitive activity: a review of neuroimaging studies. Neuroimage. 2001;14:789–801. doi: 10.1006/nimg.2001.0887. [DOI] [PubMed] [Google Scholar]
- McMillan DR, Xiao X, Shao L, Graves K, Benjamin IJ. Targeted disruption of heat shock transcription factor 1 abolishes thermotolerance and protection against heat-inducible apoptosis. J Biol Chem. 1998;273:7523–7528. doi: 10.1074/jbc.273.13.7523. [DOI] [PubMed] [Google Scholar]
- Mulnard RA. Estrogen as a treatment for Alzheimer disease. JAMA. 2000;284:307–308. [PubMed] [Google Scholar]
- Ohyagi Y. Intracellular amyloid beta-protein as a therapeutic target for treating Alzheimer's disease. Curr Alzheimer Res. 2008;5:555–561. doi: 10.2174/156720508786898514. [DOI] [PubMed] [Google Scholar]
- Pak T, Cadet P, Mantione KJ, Stefano GB. Morphine via nitric oxide modulates beta-amyloid metabolism: a novel protective mechanism for Alzheimer's disease. Med Sci Monit. 2005;11:BR357–BR366. [PubMed] [Google Scholar]
- Pinkerton JV, Henderson VW. Estrogen and cognition, with a focus on Alzheimer's disease. Semin Reprod Med. 2005;23:172–179. doi: 10.1055/s-2005-869485. [DOI] [PubMed] [Google Scholar]
- Prange-Kiel J, Fester L, Zhou L, Lauke H, Carretero J, Rune GM. Inhibition of hippocampal estrogen synthesis causes region-specific downregulation of synaptic protein expression in hippocampal neurons. Hippocampus. 2006;16:464–471. doi: 10.1002/hipo.20173. [DOI] [PubMed] [Google Scholar]
- Prange-Kiel J, Jarry H, Schoen M, Kohlmann P, Lohse C, Zhou L, Rune GM. Gonadotropin-releasing hormone regulates spine density via its regulatory role in hippocampal estrogen synthesis. J Cell Biol. 2008;180:417–426. doi: 10.1083/jcb.200707043. [DOI] [PMC free article] [PubMed] [Google Scholar]
- Price DL, Sisodia SS. Mutant genes in familial Alzheimer's disease and transgenic models. Annu Rev Neurosci. 1998;21:479–505. doi: 10.1146/annurev.neuro.21.1.479. [DOI] [PubMed] [Google Scholar]
- Qian L, Tan KS, Wei SJ, Wu HM, Xu Z, Wilson B, Lu RB, Hong JS, Flood PM. Microglia-mediated neurotoxicity is inhibited by morphine through an opioid receptor-independent reduction of NADPH oxidase activity. J Immunol. 2007;179:1198–1209. doi: 10.4049/jimmunol.179.2.1198. [DOI] [PubMed] [Google Scholar]
- Rambhia S, Mantione KJ, Stefano GB, Cadet P. Morphine modulation of the ubiquitin-proteasome complex is neuroprotective. Med Sci Monit. 2005;11:BR386–BR396. [PubMed] [Google Scholar]
- Rapp SR, Espeland MA, Shumaker SA, Henderson VW, Brunner RL, Manson JE, Gass ML, Stefanick ML, Lane DS, Hays J, Johnson KC, Coker LH, Dailey M, Bowen D. Effect of estrogen plus progestin on global cognitive function in postmenopausal women: the Women's Health Initiative Memory Study: a randomized controlled trial. JAMA. 2003;289:2663–2672. doi: 10.1001/jama.289.20.2663. [DOI] [PubMed] [Google Scholar]
- Sanchez-Simon FM, Arenzana FJ, Rodriguez RE. In vivo effects of morphine on neuronal fate and opioid receptor expression in zebrafish embryos. Eur J Neurosci. 2010;32:550–559. doi: 10.1111/j.1460-9568.2010.07317.x. [DOI] [PubMed] [Google Scholar]
- Schneider LS, Finch CE. Can estrogens prevent neurodegeneration? Drugs Aging. 1997;11:87–95. doi: 10.2165/00002512-199711020-00001. [DOI] [PubMed] [Google Scholar]
- Shumaker SA, Legault C, Rapp SR, Thal L, Wallace RB, Ockene JK, Hendrix SL, Jones BN, 3rd, Assaf AR, Jackson RD, Kotchen JM, Wassertheil-Smoller S, Wactawski-Wende J. Estrogen plus progestin and the incidence of dementia and mild cognitive impairment in postmenopausal women: the Women's Health Initiative Memory Study: a randomized controlled trial. JAMA. 2003;289:2651–2662. doi: 10.1001/jama.289.20.2651. [DOI] [PubMed] [Google Scholar]
- Trinchese F, Liu S, Battaglia F, Walter S, Mathews PM, Arancio O. Progressive age-related development of Alzheimer-like pathology in APP/PS1 mice. Ann Neurol. 2004;55:801–814. doi: 10.1002/ana.20101. [DOI] [PubMed] [Google Scholar]
- Wagner EJ, Ronnekleiv OK, Kelly MJ. Protein kinase A maintains cellular tolerance to mu opioid receptor agonists in hypothalamic neurosecretory cells with chronic morphine treatment: convergence on a common pathway with estrogen in modulating mu opioid receptor/effector coupling. J Pharmacol Exp Ther. 1998;285:1266–1273. [PubMed] [Google Scholar]
- Yaffe K, Sawaya G, Lieberburg I, Grady D. Estrogen therapy in postmenopausal women: effects on cognitive function and dementia. JAMA. 1998;279:688–695. doi: 10.1001/jama.279.9.688. [DOI] [PubMed] [Google Scholar]
- Zhang Y, McLaughlin R, Goodyer C, LeBlanc A. Selective cytotoxicity of intracellular amyloid beta peptide1–42 through p53 and Bax in cultured primary human neurons. J Cell Biol. 2002;156:519–529. doi: 10.1083/jcb.200110119. [DOI] [PMC free article] [PubMed] [Google Scholar]
- Zhang Y, Champagne N, Beitel LK, Goodyer CG, Trifiro M, LeBlanc A. Estrogen and androgen protection of human neurons against intracellular amyloid beta1–42 toxicity through heat shock protein 70. J Neurosci. 2004;24:5315–5321. doi: 10.1523/JNEUROSCI.0913-04.2004. [DOI] [PMC free article] [PubMed] [Google Scholar]
- Zhang Y, Chen Q, Yu LC. Morphine: a protective or destructive role in neurons? Neuroscientist. 2008;14:561–570. doi: 10.1177/1073858408314434. [DOI] [PubMed] [Google Scholar]
- Zhao P, Huang Y, Zuo Z. Opioid preconditioning induces opioid receptor-dependent delayed neuroprotection against ischemia in rats. J Neuropathol Exp Neurol. 2006;65:945–952. doi: 10.1097/01.jnen.0000235123.05677.4b. [DOI] [PubMed] [Google Scholar]
- Zhou Q, Krebs JF, Snipas SJ, Price A, Alnemri ES, Tomaselli KJ, Salvesen GS. Interaction of the baculovirus anti-apoptotic protein p35 with caspase-specificity, kinetics, and characterization of the caspase/p35 complex. Biochemistry. 1998;37:10757–10765. doi: 10.1021/bi980893w. [DOI] [PubMed] [Google Scholar]
- Zwain IH, Yen SS. Neurosteroidogenesis in astrocytes, oligodendrocytes, and neurons of cerebral cortex of rat brain. Endocrinology. 1999;140:3843–3852. doi: 10.1210/endo.140.8.6907. [DOI] [PubMed] [Google Scholar]