

Abstract
Estimates of the prevalence of speech and motor speech disorders in persons with complex neurodevelopmental disorders (CND) can inform research in the biobehavioural origins and treatment of CND. The goal of this research was to use measures and analytics in a diagnostic classification system to estimate the prevalence of speech and motor speech disorders in convenience samples of speakers with one of eight types of CND. Audio-recorded conversational speech samples from 346 participants with one of eight types of CND were obtained from a database of participants recruited for genetic and behavioural studies of speech sound disorders (i.e., excluding dysfluency) during the past three decades. Data reduction methods for the speech samples included narrow phonetic transcription, prosody-voice coding, and acoustic analyses. Standardized measures were used to cross-classify participants’ speech and motor speech status. Compared to the 17.8% prevalence of four types of motor speech disorders reported in a study of 415 participants with idiopathic Speech Delay (SD), 47.7% of the present participants with CND met criteria for one of four motor speech disorders, including Speech Motor Delay (25.1%), Childhood Dysarthria (13.3%), Childhood Apraxia of Speech (4.3%), and concurrent Childhood Dysarthria and Childhood Apraxia of Speech (4.9%). Findings are interpreted to indicate a substantial prevalence of speech disorders, and notably, a substantial prevalence of motor speech disorders in persons with some types of CND. We suggest that diagnostic classification information from standardized motor speech assessment protocols can contribute to research in the pathobiologies of CND.
Keywords: Apraxia, dysarthria, speech motor delay, speech sound disorders
Background
Speech is one of five heritable verbal traits (speech, language, reading, writing, spelling) in which some children have developmental delays or disorders (Shriberg, Lohmeier, Strand, & Jakielski, 2012; Truong et al., 2016). As with the other verbal traits, speech delays and disorders occur in both idiopathic contexts, and in the context of complex neurodevelopmental disorders (CND). The term complex in the latter classification is used to include environmental contributions to neurodevelopmental disorders. The goal of the present study was to estimate the prevalence of speech disorders and the prevalence of motor speech disorders in a database of audio-recorded speech samples from speakers with one of eight types of CND. The following is an overview of classification terms and concepts used in this paper.
Classification terms and concepts in childhood speech sound disorders
Although there is international consensus on Speech Sound Disorders (SSD) as the cover term for childhood (paediatric in medical contexts) speech and motor speech disorders (excluding stuttering), there is currently no consensus on standardized measures and a classification system to identify and quantify the severity of types of SSD (Bernthal, Bankson, & Flipsen, 2017; Bowen, 2015; McLeod & Baker, 2017; Rvachew, 2015; Rvachew & Brosseau-Lapré, 2012; Waring & Knight, 2013). A comparative analysis of measures and classification systems in SSD is beyond the focus of the present report. It is useful, however, to describe four dichotomies that are addressed in classification proposals for SSD that are central to discussions of the prevalence estimates based on findings described in the present study.
Idiopathic SSD and SSD in CND
As shown in Figure 1, the primary dichotomy in classification systems for childhood SSD is the division introduced – SSD in children with no known developmental involvements and SSD in children with disorders affecting cognitive, structural, sensory, motor, and/or affective development. Issues in and alternative perspectives to this categorical rather than dimensional classification of SSD in Figure 1 have been described for speech pathology (e.g., Morgan & Liégeois, 2010; Weismer, 2006) and in other literatures (e.g., Beglinger & Smith, 2001). In introductory textbooks in SSD, the primary focus is on idiopathic SSD, with disorders that have SSD in the context of CND typically sampled in chapters on ‘special populations’ (e.g., children with hearing disorders, children with craniofacial disorders, children with autism spectrum disorders). Unlike the idiopathic SSD literature, many CND in which speakers are at increased risk for speech disorder have their own research and clinical journals, professional associations, clinical specialists, and advocacy groups. This research, educational, and clinical separation of the two contexts for SSD is a scientific constraint on research addressing common biobehavioural questions.
Figure 1.
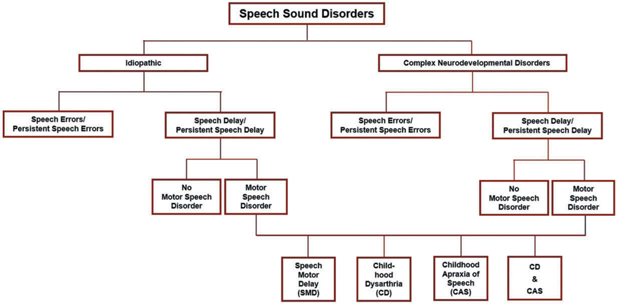
Four classification dichotomies in Speech Sound Disorders (SSD).
Speech errors and speech delay
A second dichotomy shown in Figure 1 is the division of speakers with SSD in each context into two classifications of speech disorders. Some speakers’ speech errors consist solely of common clinical distortions of speech sounds in challenging phonetic feature classes, such as in American English, distortions of the sibilant consonant in ‘see’ (sometimes referred to as a lisp) or distortions of the rhotic consonant in ‘ray.’ Other speakers, in addition to distorting some speech sounds, have age-inappropriate deletions of speech sounds and/or substitutions of speech sounds for one another. Unlike speakers with only speech sound distortions, speakers with age-inappropriate speech sound deletions and/or substitutions are at risk for delays and disorders in the four other verbal traits listed previously: language, reading, writing and spelling (Peterson, Pennington, Shriberg, & Boada, 2009). Conventional classification terms for this dichotomy, respectively, are articulation disorder and phonological disorder (Bowen, 2015). As defined presently, the classification system in this paper uses the terms Speech Errors (SE) for articulation disorder (only distortions), and Speech Delay (SD) for phonological disorder (deletions/substitutions and optionally distortions). Point-prevalence estimates using convenience and population-based samples of adults average 1.5–2% SE (Flipsen, 2015); population-based estimates of the prevalence of SD at 4–8 years in three countries average 3.6% (Eadie et al., 2015; Shriberg, Tomblin, & McSweeny, 1999; Wren, Miller, Peters, Emond, & Roulstone, 2016). As indicated previously, estimates of the prevalence of speech and motor speech disorders in CND are fractionated, with no research to date using the same or comparable methods, measures, and classification system with a representative sample of speakers with CND (Shriberg et al., 2010a, 2010b).
Normalization and persistence of SE and SD
As shown in Figure 1, a third SSD classification dichotomy differentiates speech disorders that normalize with or without treatment during the speech acquisition period from those that persist beyond the well-documented stages of speech development. The classification system to be described classifies speakers with SE (i.e., only speech sound distortions) past 9 years of age at assessment as having Persistent Speech Errors (PSE) and speakers with SD (i.e., speech sound deletions and/or substitutions and optionally distortions) past 9 years of age at assessment as having Persistent Speech Delay (PSD). As shown in Figure 1 and used in the present research, it is useful for many purposes to aggregate speakers younger and older than 9 years at assessment within the same research group or cohort (i.e., SE/PSE and SD/PSD).
Speech disorder and motor speech disorder
A fourth classification dichotomy in SSD, the primary focus of the present paper, addresses the hypothesis that SD and particularly PSD in some speakers may be associated with delays in neuromotor development. Processing deficits in neurocognitive domains are widely studied in idiopathic SD and other verbal trait disorders, whereas research in processing deficits in neuromotor domains in children with idiopathic speech-language deficits is less well-developed. In addition to the possibility of Childhood Apraxia of Speech (CAS; a neuromotor deficit in speech planning/programming) or Childhood Dysarthria (CD; a neuromotor deficit in speech execution), there is continuing research on the hypothesis of a third motor speech classification characterized by a delay in the development of precise and stable articulation that does not meet criteria for dysarthria or apraxia of speech (e.g., Bishop, 2002; Bradford, Murdoch, Thompson, & Stokes, 1997; Gaines & Missiuna, 2007; Goffman, 1999; Hill, 2001; Newmeyer et al., 2007; Rechetnikov & Maitra, 2009; Redle et al., 2015; Shriberg et al., 2010a; Vick et al., 2014; Visscher, Houwen, Scherder, Moolenaar, & Hartman, 2007; Zwicker, Missiuna, & Boyd, 2009). As shown in Figure 1 and described presently, Speech Motor Delay (SMD) has recently been proposed as a classification term for children proposed to have this third type of developmental deficit in speech motor processes (Shriberg, 2017; Shriberg, Kwiatkowski, & Mabie, 2019).
Neurocognitive and neuromotor processes in speech and motor speech disorders
The classification entities in Figure 2 are part of a research framework termed the Speech Disorders Classification System (SDCS; Shriberg, 2010a, 2010b; Shriberg, Kwiatkowski, & Mabie, 2019). As shown in the top section of Figure 2, distal substrates of speech and motor speech disorders include genomic, neurodevelopmental, and environmental risk and protective factors. Proximal substrates in the second section are divided into three speech processing domains – Representation, Transcoding, and Execution – each of which are mediated by feedforward and feedback processes. This generic sketch is based on many contemporary speech processing perspectives (e.g., Friederici, 2012; Guenther & Vladusich, 2012; Hickok& Poeppel, 2004; Nijland, Maassen, & van der Meulen, 2003; Terband, Maassen, Guenther, & Brumberg, 2014; van der Merwe, 2009; Ziegler & Ackermann, 2013; Ziegler, Aichert, & Staiger, 2012). The two speech disorders in the third section and reviewed previously, SD and SE, are presumed to be due to delays in auditory and somatosensory representational processes (e.g., Perkell, 2012; Terband et al., 2014). A deficit in Transcoding, a cover term for planning and/or programming speech movements, is generally proposed as the speech processing deficit in CAS (Shriberg et al., 2017; van der Merwe, 2009). Execution deficits, including deficits in the spatiotemporal movements in speech, prosody, and voice, are proposed to underlie CD as well as the recently proposed SMD. The term ‘delay’ in the latter classification is supported by findings indicating high early normalization rates in children with concurrent idiopathic SD (Shriberg, Campbell, Mabie, & McGlothlin, 2019). The fourth section in Figure 2 includes the behavioural markers currently used to identify the subtypes of SE and Motor Speech Disorder (MSD) shown above each sign or measure. The Method section and a Supplement for each of the papers in this research series include additional information on classification methods and measures.
Figure 2.
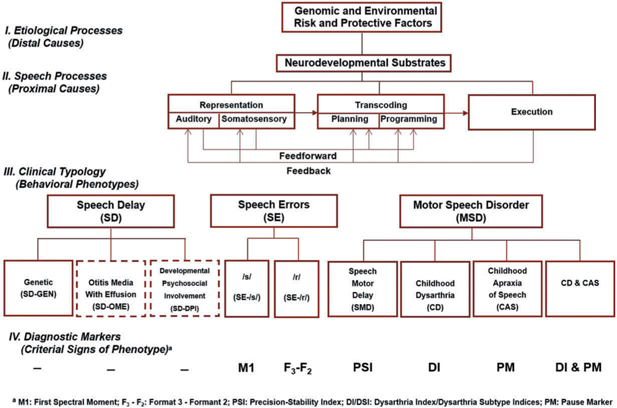
The Speech Disorders Classification System (SDCS).
Statement of purpose
Estimates of the prevalence of speech disorders and motor speech disorders in speakers with different CND are not presently available in research using the same methods, measures, and classification system. The goal of the present research was to obtain initial estimates of the prevalence of speech disorders and motor speech disorders in samples of persons with CND in a database of audio-recorded conversational speech samples from 346 speakers with one of eight types of CND. The hypothesis is that using similar methods, measures, and cross-classification system, estimates of the prevalence of motor speech disorders in persons with some types of CND will be significantly higher than recent estimates of the prevalence of motor speech disorders in children with idiopathic SD.
Method
Participants
Table 1 includes summary assessment, demographic, and cognitive-language information for participants in convenience samples of eight types of CND. Participants were recruited during the past three decades in research with investigators in several USA cities. All participants were assented and/or consented using procedures and forms approved by institutional review boards at the University of Wisconsin-Madison, the Mayo Clinic-Rochester, Minnesota, and research and clinical institutions in multiple cities where the participants were recruited and assessed. Appendix 1 includes the inclusionary criteria for participation in each of the eight study samples and a brief description of participants. As described presently, each of the 346 audio-recorded conversational samples that comprise the database for the present study were obtained using the same or comparable recording instrumentation, recording procedures, conversational speech sampling protocol, data reduction protocol and data reduction software. Data reduction for all speech samples from all groups was completed by the same group of research specialists.
Table 1.
Information for participants with one of eight types of Complex Neurodevelopmental Disorders (ordered alphabetically).a
| Group | Abbreviation | Assessment |
Demographic |
Cognitive-Language |
||||||||
|---|---|---|---|---|---|---|---|---|---|---|---|---|
| Original Sample |
SDCS Classified |
Age (yrs) |
Sex (%) |
Cognitionb |
Languagec |
|||||||
| n | n | % | M | SD | % Female | % Male | M | SD | M | SD | ||
| 16p11.2 deletion and duplication syndrome | 16p | 111 | 108 | 97.3 | 14.7 | 12.4 | 50.9 | 49.1 | * | * | * | * |
| 22q11.2 deletion syndrome | 22q | 18 | 17 | 94.4 | 10.2 | 3.3 | 35.3 | 64.7 | 77.8 | 11.5 | 77.4 | 11.8 |
| Autism Spectrum Disorder | ASD | 42 | 42 | 100 | 6 | 1.2 | 21.4 | 78.6 | 104.3 | 15.7 | 98.9 | 17.3 |
| Down syndrome | DS | 50 | 45 | 90 | 14.2 | 2.3 | 44.4 | 55.6 | 42.8 | 6.4 | 42.6 | 4.4 |
| Fragile X syndrome | FXS | 30 | 28 | 93.3 | 16 | 3.2 | 0 | 100 | 38.3 | 5.4 | 48.6 | 4.1 |
| Galactosemia | GAL | 31 | 31 | 100 | 8.8 | 2.9 | 35.5 | 64.5 | 86.7 | 16.4 | 79.6 | 15.3 |
| Idiopathic Intellectual Disability | IID | 26 | 23 | 88.5 | 36.4 | 7 | 52.2 | 47.8 | * | * | * | * |
| Severe Traumatic Brain Injury | TBI | 54 | 52 | 96.3 | 7.3 | 2.9 | 42.3 | 57.7 | * | * | * | * |
| Totals | 362 | 346 | 95.6 | 13.3 | 10.3 | 39 | 61 | 70 | 11 | 69.4 | 10.6 | |
Cell values for demographic and cognitive-language variables are for the 346 participants that were eligible to be classified using Speech Disorders Classification System (SDCS) measures. Standardized cognitive and language data were not currently available for participants in three of the eight groups.
Standard scores for IQ Composite: (Kaufman & Kaufman, 2004). IQ Scores: (Thorndike, Hagen, & Sattler, 1986).
= no data.
Standard scores for Oral Composite: (Carrow-Woolfolk, 1995). Standard scores for Core Language: (Semel, Wiig, & Secord, 2003).
= no data.
As shown in the first four columns in Table 1, only findings for participants who met SDCS criteria for classification of their motor speech status were included in the present study. A later section describes criteria for classifiable samples. The group-wise percentage of classifiable participants in the eight CND samples ranged from 88.5% to 100%, averaging 95.6%. The chronological ages of participants averaged 13.3 years and the male:female ratios across groups averaged 1.8:1. Participants in the five groups with available data had average standardized scores that were significantly lower than their typically-developing same-sexed age-matched peers on measures of cognition (M = 70.0; SD = 11.0) and language (M = 69.4; SD = 10.6).
Speech and motor speech classification
Cross-classification
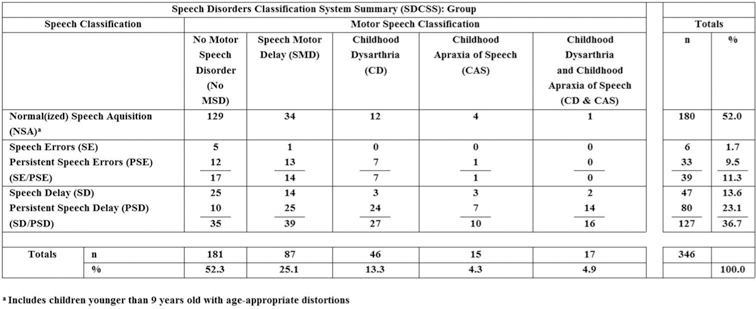
Cross-classification of the speech and motor speech status of each participant was completed using an analytic termed the Speech Disorders Classification System Summary (SDCSS; Mabie & Shriberg, 2017). Figure 3 includes sample SDCSS outputs from the computer software termed Programs to Examine Phonetic and Phonologic Evaluation Records (PEPPER, 2019).
Figure 3.
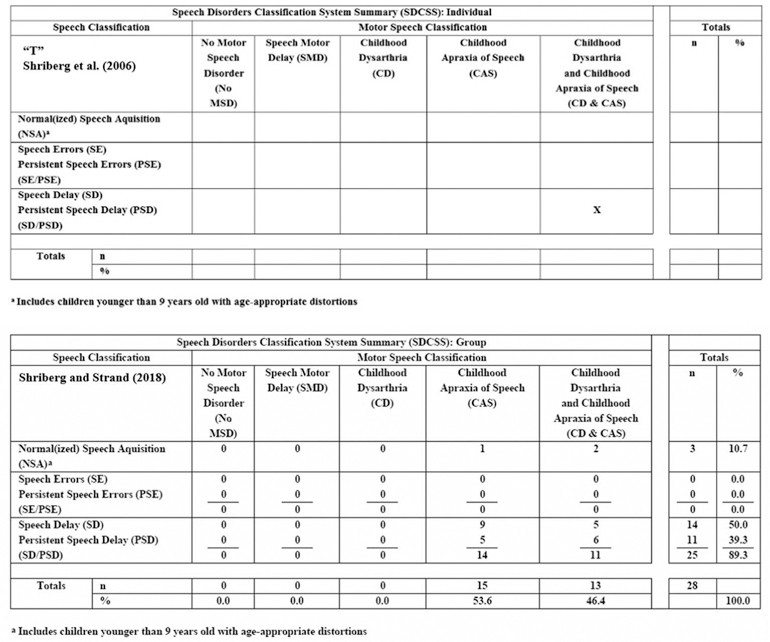
Sample outputs from the Speech Disorders Classification System Summary (SDCSS).
The SDCSS cross-classifies an individual speaker’s (upper panel) or a group of speakers’ (lower panel) speech and motor speech status using speech, prosody, and voice data obtained from a conversational speech sample and standardization reference data from 200 typically-developing speakers (Potter et al., 2012; Scheer-Cohen et al., 2013). SDCSS findings provided the primary prevalence information for the present research. It is efficient first to describe the principal elements of the SDCSS, followed by description of the measures used to identify each of the speech and motor speech classifications in Figure 3.
The rows in the SDCSS include the speech disorder classifications discussed previously, arranged vertically in order of increasing severity of involvement. The software classifies a speaker as having Normal (or Normalized) Speech Acquisition (NSA) if the speaker does not have in their conversational speech at assessment, any speech sound deletions, substitutions, or distortions (including additions) that are inappropriate for their age. SE, or PSE if the speaker is older than 9 years, is the classification assigned to speakers with age-inappropriate speech sound distortions. SD, or Persistent PSD if the speaker is older than 9 years, is the classification assigned to speakers with age-inappropriate speech sound deletions or substitutions. As described previously (Figure 1), a slash convention is used to aggregate speakers younger and older than 9 years of age with the same class of speech disorder (i.e., SE/PSE and SD/PSD).
The columns in Figure 3 include five motor speech classifications arranged left to right in presumed order of increasing severity of involvement: No Motor Speech Disorder (No MSD), SMD, CD, CAS and concurrent CD & CAS. The purpose of the concurrent classification, CD & CAS, is to acknowledge the genomic, neuropathological, and clinical correlates of deficits in both neuromotor planning/programming (apraxia) and neuromotor execution (dysarthria) phases of speech production. Examples and discussion of the neurogenetic implications of concurrent apraxia and dysarthria compared to apraxia alone are increasingly emergent in the FOXP2 and other speech-genetics literatures (e.g., Carrigg, Parry, Baker, Shriberg, & Ballard, 2016; Chilosi et al., 2015; Eising et al., 2018; Morgan, Fisher, Scheffer, & Hildebrand, 2016; Rice et al., 2012; Shriberg, Strand, & Mabie, 2016; Turner, Morgan, Perez, & Scheffer, 2015; Worthey et al., 2013). The ‘X’ in the upper sample SDCSS in Figure 3 cross-classifies a speaker’s speech and motor speech status – in the present example, the 18-year-old daughter (“T”) of a woman (“B”) in a case study of a family with persistent CAS associated with a mutation in FOXP2 (Shriberg et al., 2006). As shown, this participant is cross-classified as having PSD (speech axis) and CD & CAS (motor speech axis). In the lower sample SDCSS in Figure 3, the percentages in the cells and marginal totals are group-wise findings from 28 children with CAS, classified by consensus using two different diagnostic procedures for CAS (Shriberg & Strand, 2018). As shown, concurrent CD & CAS was approximately as prevalent as CAS alone in this sample of children recruited for CAS.
Classification conventions
The SDCSS is a phenotype analytic in which the five classifications within speech disorders and the five classifications within motor speech disorders are each mutually exclusive. Therefore, as shown in the example of grouped SDCSS data in Figure 3, the marginal values for each axis total 100%. The five mutually exclusive classifications are accomplished using two conventions.
First, in addition to identifying speakers with no speech errors, the NSA classification identifies speakers with age-appropriate deletions, substitutions, and/or distortions (speakers with such behaviours in conversational speech are coded NSA-in the PEPPER software; Shriberg, 1993, Appendix). Thus, NSA classifications include speakers with no speech errors, and is also the default classification for participants whose number and/or type of speech errors do not meet criteria for SE (or PSE) or for SD (or PSD).
Second, the SDCSS software classifies speakers who meet criteria for more than one of the speech disorders or the motor speech disorders as having the more severe disorder. Thus, a speaker who meets criteria for both SE and SD (or PSE and PSD if older than 9 years) is classified as SD or PSD (i.e., the more severe of the two types of speech disorders). Similarly, for speakers who meet criteria for both SMD and any of the other three motor speech disorders classifications (CD, CAS, or CD & CAS), the program classifies the speaker as having the other presumably more severe motor speech disorder.
Measures and classification procedures
The assessment protocols varied somewhat for each of the eight participant groups in Table 1, with participants in some of the groups receiving more extensive original assessments. As described, each of the eight study samples included a conversational sample using comparable interactional questions and responses to encourage participants to talk about their daily activities (Shriberg & Kwiatkowski, 1985). Appendix 2 includes descriptions of the five speech and motor speech classifications, and for participants meeting classification criteria for CD, the five dysarthria subtypes. SDCS classifications are completed by software that provides standardized speech, prosody, and voice measurement (z-scores) using two reference databases of typical speakers 3 to 80 years of age (Potter et al., 2012; Scheer-Cohen et al., 2013). The speech classifications were made using a program that has been used for previous classification research in speech disorders (Shriberg, 1993, Appendix Table A; Shriberg, Austin et al., 1997, Appendix A). The motor speech classifications in the present Appendix 2 were developed in research to identify genomic and phenotypic substrates of childhood speech sound disorders of known and unknown origin. The perceptual and acoustic signs of dysarthria and dysarthria subtypes were based on operationalized adaptations of Duffy’s (2013) diagnostic signs of neuro-genic motor speech disorders. A Supplement for this research series includes detailed information on classification methods [Supplementary Data]. Several reports provide information on the development and validation of the measures and normative reference data (Mabie & Shriberg, 2017; Shriberg, 2017; Shriberg et al., 2009; Shriberg & Mabie, 2017; Shriberg et al., 2017; Tilkens et al., 2017).
Data from some of the original participants had to be excluded from the present research due to missing information on one of the measures needed to classify their motor speech status. As shown in Table 1, the motor speech status of 4.4% of the original CND participants could not be classified (100% – 95.6% classifiable). The primary reason motor speech status could not be classified was because the conversational speech sample did not include the minimum of 40 pause opportunities needed to compute a score on the measure used to identify CAS (termed the Pause Marker; see Supplement). In clinical practice, such children are typically resampled on the same or another day to obtain a sufficient number of pause opportunities, but such information was not available for participants in the database. The other reason some samples could not be classified was that a participant had an indeterminate Pause Marker score that could not be resolved using the Supplementary Pause Marker Index (see Supplement). Resolution of indeterminate Pause Marker scores requires information from a nonword repetition task (Shriberg et al., 2009) that was not yet available for research at the time some of the participants in the eight CND groups were assessed.
Data reduction and reliability estimates
Four research specialists completed transcription, prosody-voice coding, and acoustic analyses of the conversational speech samples and transcription of the nonword repetition task. For estimates of intrajudge reliability, each specialist completed a second analysis of the samples she had originally reduced. For estimates of interjudge reliability, each specialist completed an approximately equal number of samples completed by one of the other specialists.
Estimates of the interjudge and intrajudge reliability for all data reduction tasks were based on approximately 20% samples of participants in the four CND groups with the highest prevalence of motor speech disorder (see Figure 6). A total of 34 randomly selected conversational speech samples included 10 samples from participants with Down syndrome, 4 samples from participants with 22q11.2 deletion syndrome, 10 samples from participants with Idiopathic Intellectual Disability, and 10 samples from participants with fragile X syndrome.
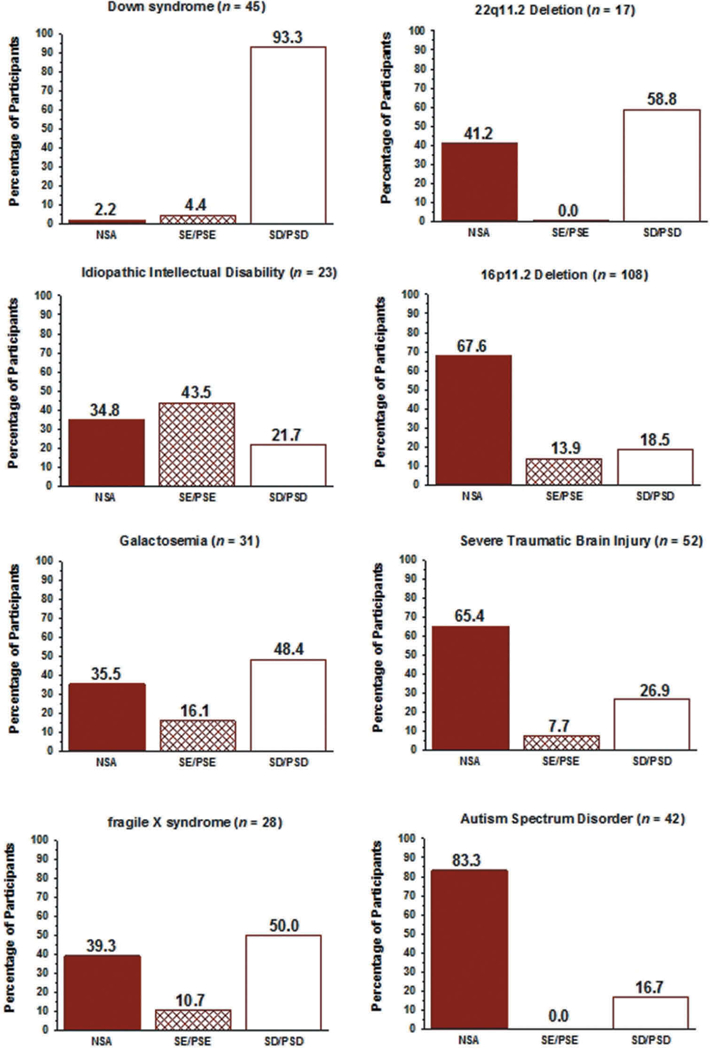
Figure 6.
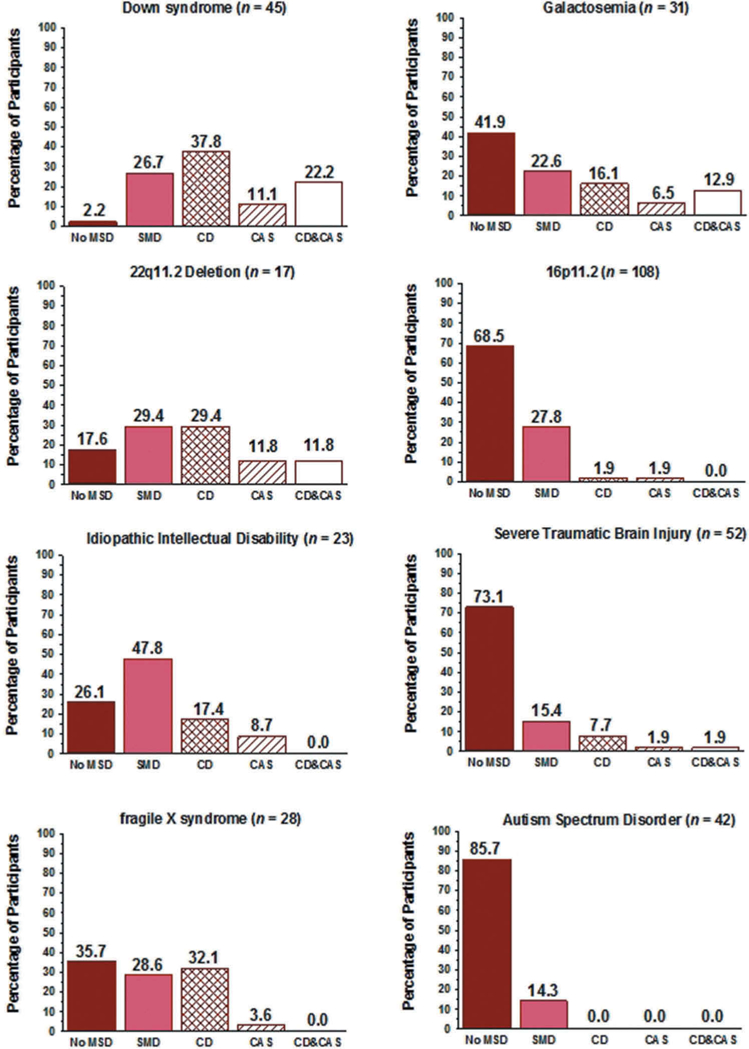
Percentage of participants in eight Complex Neurodevelopmental Disorders classified into one of five motor speech classifications.
Table 2 is a summary of point-to-point interjudge and intrajudge agreement percentages for the three types of data reduction. The findings for the four CND groups were group-averaged (i.e., the averaged percentage of agreement findings for each of the four groups were divided by four). As shown in the reliability estimates in Table 2, interjudge and intrajudge percentages of agreement were similar to the approximately mid-70% to mid-90% ranges reported in reviews of reliability findings in the speech sound disorders literature (McSweeny & Shriberg, 1995; Shriberg et al., 2010b; Shriberg & Lof, 1991). The average reliabilities in the mid-80% for variables assessed using transcription, prosody-voice coding, and acoustics systems within each of the four CND groups with significant motor speech disorders is viewed as particularly positive given the diverse perceptual and acoustic signs of deficits in speech, prosody, and voice assessed in the measures shown in the Supplement.
Table 2.
Reliability estimates for phonetic transcription, prosody-voice coding, and acoustic analyses.
| Data | Agreement Types |
No. of Tokens Analyzed | Variable | Percentage of Agreement | |
|---|---|---|---|---|---|
| Interjudge | Intrajudge | ||||
| Phonetic Transcription | X | Consonants | |||
| 2535 utterances | Broad | 93.3 | |||
| 7239 words | Narrow | 77.2 | |||
| Vowels | |||||
| Broad | 85.5 | ||||
| Narrow | 75 | ||||
| X | Consonants | ||||
| 2535 utterances | Broad | 95.6 | |||
| 7287 words | Narrow | 84.8 | |||
| Vowels | |||||
| Broad | 89.8 | ||||
| Narrow | 81.5 | ||||
| Prosody-Voice Coding | X | 801 utterances | Appropriate-Inappropriate | 87.3 | |
| X | Appropriate-Inappropriate | 91.3 | |||
| Acoustic Analyses | X | Phoneme | |||
| Duration | |||||
| 651 | Consonants | 81.9 | |||
| 2754 | Vowels | 81.9 | |||
| X | Phoneme | ||||
| Duration | |||||
| 710 | Consonants | 84.1 | |||
| 2760 | Vowels | 84.7 | |||
| X | Vowel Frequency | ||||
| 2616 | F0 | 97.4 | |||
| 450 | F1 | 90 | |||
| 442 | F2 | 90.3 | |||
| X | Vowel Frequency | ||||
| 2632 | F0 | 97.5 | |||
| 470 | F1 | 90.1 | |||
| 460 | F2 | 94.8 | |||
| X | Pause Variables | ||||
| 558 | Pause – | 88.1 | |||
| Non-Pause | |||||
| 487 | Appropriate – Not Appropriate | 71.9 | |||
| 60 | Type 1 – Type 2 | 82.7 | |||
| X | Pause Variability | ||||
| 558 | Pause – Non-Pause | 86.2 | |||
| 475 | Appropriate – Not Appropriate | 69.7 | |||
| 59 | Type 1 – Type 2 | 81.8 | |||
Statistical analyses
Statistical findings are primarily descriptive, with some inferential statistics completed to guide discussion and interpretation of findings. To minimize Type II errors in these initial prevalence comparisons, many based on relatively small cell sizes, the number of inferential statistical tests were minimized and treated family-wise (see Feise, 2002; Nakagawa, 2004; Perneger, 1998).
Results and discussion
Figure 4 includes the cross-classification findings for the prevalence of speech and motor speech disorders in the 346 participants in the eight CND groups. The summary cross-classification finding derived from the data in Figure 4 warrants comment before examining the individual data for each of the eight CND. As shown in the upper left data cell, 37.3% (129/346) of the participants were cross-classified as NSA and No MSD at assessment. Thus, by subtraction, a total of 62.7% (217/346) of participants in the eight CND – over 60% of participants – had a speech and/or a motor speech disorder at assessment. The following sections report prevalence findings and discuss implications of findings for each type of speech and motor speech classification (Figure 2) for participants in each of the eight CND.
Figure 4.
Speech Disorders Classification System Summary (SDCSS) findings for participants in eight Complex Neurodevelopmental Disorders.
Speech disorders in eight CND
High and low prevalence groups
Figure 5 includes the prevalence findings for speech classifications within each of the CND groups. Groups are ordered vertically in the two columns by the highest to the lowest total prevalence of the two classes of speech disorders, SE and SD. Using an arbitrary 50% criterion, at least half of the participants in the first five of the eight CND (Down syndrome [DS], Idiopathic Intellectual Disability [IID], Galactosemia [GAL], fragile X syndrome [FXS], and 22q11.2 Deletion syndrome [22q]) were classified as either SE/PSE or SD/PSD. Fewer than 50% of the participants in the other three CND (16p11.2 [16p]; Severe Traumatic Brain Injury [TBI], and Autism Spectrum Disorder [ASD]) met classification criteria for either of the two speech disorders classifications. The large range in the prevalence of the two classes of speech disorders across the eight CND in Figure 5, particularly for SD/PSD (16.7%−93.3%), is consistent with the heterogeneous neurocognitive and neuromotor deficits posited to underlie speech sound deletions, substitutions, and distortions, with implications for genetic and genomic correlates and clinical management.
Figure 5.
Percentage of participants in eight Complex Neurodevelopmental Disorders classified into one of three speech classifications.
Speech errors/persistent speech errors
Prevalence
The prevalence of SE or PSE as the only speech disorder in participants in the eight groups of speakers with CND averaged 11.4%, with prevalences in Figure 5 ranging from 0% (22q, ASD) to 43.5% (IID). Thus, SE/PSE as the only speech disorder was relatively infrequent in the present samples of speakers with CND.
Discussion
The high percentage of PSE (43.5%) in the IID group (M: 36.4 years; SD: 7 years) is of interest. Unlike participants in the other CND groups, the intellectual deficit in persons in this group was idiopathic, rather than associated with syndromic and other neurodevelopmental disorders with well-described phenotypic deficits in sensorimotor domains. A research question that cannot be addressed with the current database is whether PSE in persons with IID was a residual of earlier SE or whether it was a residual of earlier SD. That is, did these speakers always have SE/PSE, or were their common and/or uncommon speech sound distortions (Shriberg, 1993; Appendix) at assessment in their third decade of life the residual of prior SD/PSD with distortions? Tracking such longitudinal speech and motor speech phenotypes in appropriately selected and controlled CND groups with different types and severity of intellectual deficits could be informative for speech-genetics research. A number of instrumental methods (e.g., palatography, ultrasound, kinematics, motion capture tracking) are becoming increasingly available for detailed phenotypic description of SE/PSE (cf. Ludlow, Kent, & Gray, 2018). Such fine-grained data on SE/PSE in persons with selected CND should inform accounts of the pathobiological correlates of misarticulations, in turn leading to treatment targeting for the distortions that maximally contribute to speakers’ intelligibility, comprehensibility, and acceptability (e.g., McAllister Byun & Preston, 2015; Torrington Eaton, 2015; Yoder, Camarata, & Woynaroski, 2016).
Speech delay/persistent speech delay
Prevalence
The percentage of participants with SD/PSD in the eight CND, as shown in Figure 5, ranged from 16.7% (ASD) to 93.3% (DS), averaging 40.0%.
Discussion
A research implication of this wide prevalence range for SD/PSD across CND is the potential for comparative study of speech processing deficits in SD (Figure 2). As reviewed previously, early and persistent SD is posited to reflect deficits in representational processes, rather than in speech production deficits in transcoding (planning/programming) or in speech execution. Research that compares the deletion and substitution errors of SD/PSD in different CND to those in children with idiopathic SD could inform questions about the single and multiple neural and psycholinguistic loci of speech processing deficits in SD (Pennington, 2006).
The present cross-classification findings for SD/PSD in CND underscore an important clinical question. Findings in Figure 4 indicate that whereas 27.6% (35/127) of the participants with SD/PSD had No MSD, the remaining 72.4% (92/127) also had one of the four types of motor speech disorders discussed in the next section. A two-group test of proportions indicated that the latter group was significantly more prevalent in the present database (Fisher’s exact test; p-value = 0.000). For the transcoding deficits in CAS and the execution delays/deficits in SMD and CD (Figure 2), respectively, current trends are to base speech treatment wholly or substantially on principles of motor learning (e.g., Maas, Gildersleeve-Neumann, Jakielski, & Stoeckel, 2014; Maas et al., 2008). If speech sound deletions and substitutions in persons with idiopathic SD or PSD are proposed to reflect cognitive rather than motor speech neurodevelopmental constraints (Figure 2), a clinical question is whether treatment based wholly or substantially on the principles of motor-learning is appropriate for the nearly 3/4ths (72.4%) of the present speakers with CND, SD/PSD, and concurrent motor speech disorder (i.e., SMD, CD, CAS, or CD & CAS). Rather, treatment would seem to be more appropriately based on each individual speaker’s cross-classification findings, which include the type and severity of involvement in both cognitive and motor domains (Nijland, Terband, & Maassen, 2015; Shriberg et al., 2012).
Motor speech disorders in eight CND
High and low prevalence groups
Figure 6 includes findings for the prevalence of the five classifications of MSD (including No MSD) in the eight samples of participants with CND. Although not in the same order, the five CND with the highest prevalence of SD in Figure 5 (DS, IID, GAL, FXS, 22q) also had the highest prevalence of one of the four types of MSD in Figure 6 (DS, 22q, IID, FXS, GAL). The following sections review prevalence findings for each of the four MSD.
Speech motor delay
Prevalence
As shown in Figure 4, 25.1% of the participants in the eight groups of participants with CND met SDCS requirements for SMD. The prevalence of SMD in the adults with IID (47.8%; Figure 6) was nearly double the group-averaged mean of the prevalence of SMD in the other seven groups (23.5%), which ranged from 14.3% to 29.4%. In comparison, the per-participant prevalence of SMD in a sample of 415, 3-to 16-year-old participants with idiopathic SD from six cities in the U.S. was 12% (Shriberg, Kwiatkowski, & Mabie, 2019).
Discussion
The present high prevalence of SMD in participants with CND, together with the previous prevalence findings for SMD in children with SD (Shriberg, Kwiatkowski, & Mabie, 2019), supports SMD as a classification entity for speakers with imprecise and/or unstable speech, prosody, and/or voice that does not meet criteria for CD and/or CAS. In the present data, of the 61 participants who did meet criteria for CD and/or CAS, 52 (85.2%) also met criteria for SMD. As expected, because both SMD and CD are disorders of speech execution (Figure 2), 89.1% of the participants with CD also met criteria for SMD, whereas 73.3% of the participants with CAS also met criteria for SMD; a Fisher’s exact test was non-significant (p-value = 0.204).
In addition to the high prevalence of SMD in seven of the CND groups (total group average = 23.5%), the substantial prevalence of SMD in participants with IID (47.8%) discussed previously is of particular research and clinical interest. As described previously, nearly 80% of the adult participants with IID met criteria for either NSA (34.8%) or SE/PSE (43.5%), the latter of which was the highest percentage obtained among the eight groups of CND. Only approximately 20% of these participants had the persistent speech sound deletions or substitutions that define PSD. As described in the original study of these participants (Shriberg & Widder, 1990) and in item level-detail on their performance on the Precision-Stability Index (Shriberg & Mabie, 2017), their most prevalent perceptual and acoustic signs of SMD were in the domains of prosody and voice (i.e., not in the domain of speech production). Thus, SMD may be an especially appropriate phenotypic classification for speakers with intellectual disability whose speech perceptually suggests a motor component that does not meet criteria for the processing deficits in transcoding that define CAS or the processing deficits in execution that define CD (Figure 2).
Last, SMD may have an important role in epidemiological and other studies of the prevalence and phenotype of motor speech disorders in CND. Subsequent discussion speculates on the possibility first proposed in preliminary research in SMD (Shriberg, 2017) that SMD is the true-positive classification for the false-positive classifications of CAS in research and clinical speech pathology (American Speech-Language-Hearing Association, 2007; Royal College of Speech and Language Therapists, 2011).
Childhood dysarthria
Prevalence
The prevalence of CD in the eight samples of CND, as shown in Figure 4, was 13.3%, with an additional 4.9% of participants meeting criteria for concurrent CAS (CD & CAS) at assessment. Thus, a total of 18.2% of the present participants met criteria for either CD alone or concurrent with CAS, in comparison to the total percentage of participants with SMD (25.1%). The percentages of participants with CD or CD & CAS in the first five CND in Figure 6, (DS [60%], 22q [41.2%], IID [17.4%], FXS [32.1%], and GAL [29%]) were considerably higher than the percentages in the remaining three CND. Notably for neurogenetic research questions, the prevalence of CD alone was the same or higher than the prevalence of CD & CAS in each of the eight CND. In comparison to the above values, 3.4% of 415 children with idiopathic SD (Shriberg, Kwiatkowski, & Mabie, 2019) met criteria for CD and none met criteria for concurrent CD & CAS.
Subtypes of childhood dysarthria
Table 3 includes prevalence estimates for the five subtypes of dysarthria listed in the last five rows of Appendix 2. The dysarthria subtype indices are each comprised of 12–19 of the 34 signs in the Dysarthria Index. As shown in the Supplement, the SDCS signs of subtypes of dysarthria were operationalized and standardized using the Mayo Clinic classification system definitions and subscale item weightings (Duffy, 2013). Subtype signs are not mutually exclusive, with some signs proposed to be diagnostic of more than 1 of the 5 subtypes of dysarthria (Duffy, 2013). Details on how the percentile values in Table 3 were derived from a database of 442 participants at risk for childhood motor speech disorders are described in a technical report (Mabie & Shriberg, 2017; pp. 203–204). Values ≤ 10th percentile on each dysarthria subtype index were classified as positive for that subtype.
Table 3.
Percentage of participants with Childhood Dysarthria (CD) and Childhood Dysarthria & Childhood Apraxia of Speech (CD & CAS) with scores ≤ 10th percentile on subtypes of CD.a
| Complex Neurodevelopmental
Disorder |
Percentage of Participants
with CD Subtype Score ≤ 10th Percentile |
||||||||||||||||||
|---|---|---|---|---|---|---|---|---|---|---|---|---|---|---|---|---|---|---|---|
| Typeb |
n |
No. of Participants with
Dysarthria |
Ataxia |
Spastic |
Hyperkinetic |
Hypokinetic |
Flaccid |
||||||||||||
| CD | CD & CAS | Total | CD | CD & CAS | Total | CD | CD & CAS | Total | CD | CD & CAS | Total | CD | CD & CAS | Total | CD | CD & CAS | Total | ||
| DS | 45 | 17 | 10 | 27 | 82.4 | 70.0 | 77.8 | 29.4 | 30.0 | 29.6 | 41.2 | 50.0 | 44.4 | 17.6 | 30.0 | 22.2 | 29.4 | 20.0 | 25.9 |
| GAL | 31 | 5 | 4 | 9 | 20.0 | 25.0 | 22.2 | 40.0 | 50.0 | 44.4 | 60.0 | 50.0 | 55.6 | 20.0 | 25.0 | 22.2 | 0.0 | 75.0 | 33.3 |
| FXS | 28 | 9 | 0 | 9 | 55.6 | 0.0 | 55.6 | 44.4 | 0.0 | 44.4 | 22.2 | 0.0 | 22.2 | 66.7 | 0.0 | 66.7 | 44.4 | 0.0 | 44.4 |
| 22q | 17 | 5 | 2 | 7 | 20.0 | 50.0 | 28.6 | 20.0 | 50.0 | 28.6 | 60.0 | 50.0 | 57.1 | 60.0 | 0.0 | 42.9 | 60.0 | 50.0 | 57.1 |
| Severe TBI | 52 | 4 | 1 | 5 | 25.0 | 100.0 | 40.0 | 50.0 | 100.0 | 60.0 | 25.0 | 100.0 | 40.0 | 25.0 | 0.0 | 20.0 | 75.0 | 0.0 | 60.0 |
| IID | 23 | 4 | 0 | 4 | 0.0 | 0.0 | 0.0 | 0.0 | 0.0 | 0.0 | 0.0 | 0.0 | 0.0 | 100.0 | 0.0 | 100.0 | 50.0 | 0.0 | 50.0 |
| 16p | 108 | 2 | 0 | 2 | 0.0 | 0.0 | 0.0 | 0.0 | 0.0 | 0.0 | 0.0 | 0.0 | 0.0 | 50.0 | 0.0 | 50.0 | 100.0 | 0.0 | 100.0 |
| Total | 304 | 46 | 17 | 63 | |||||||||||||||
| Group-Averaged % | 29.0 | 35.0 | 32.0 | 26.3 | 32.9 | 29.6 | 29.8 | 35.7 | 31.3 | 48.5 | 7.9 | 46.3 | 51.3 | 20.7 | 53.0 | ||||
Bolded cells are those in which at least half (50%) of the participants with CD or CD & CAS had subscale scores ≤ 10th percentile.
DS = Down syndrome; GAL = Galactosemia; FXS = fragile X syndrome; 22q = 22q11.2 deletion syndrome; Severe TBI = Severe Traumatic Brain Injury; IID = Idiopathic Intellectual Disorder; 16p = 16p11.2 deletion and duplication syndrome. None of the 42 participants with Autism Spectrum Disorder were classified as CD or CD & CAS.
As shown in Table 3, the subtypes for which at least 50% of the participants in each of the eight CND were positive are bolded. For example, in the first data row in Table 3, 77.8% of the participants with DS who met criteria for CD alone or CD & CAS were positive for Ataxia. As is consistent with the childhood and adult literatures in developmental and acquired dysarthria, participants may be positive for one subtype of dysarthria (pure) or more than one subtype (mixed). Mixed dysarthrias may be in part due to the high collinearity among subtypes with some of the same clinical signs (e.g., slow rate is common to several subtypes of dysarthria).
With the exception of the findings for DS discussed next, the estimates in Table 3 are preliminary, due to the low number of participants with CD (63) that comprise the denominators for the percentage estimates across the 120 cells in Table 3 (i.e., 8 CND x 5 dysarthria subtypes x 3 classifications of CD [CD, CD & CAS, total]). Specifically, other than the total of 27 participants with DS (Table 3, fourth data column), the percentage of participants in each CND that met percentile criteria for dysarthria subtypes are based on from 2 to 9 participants with CD. Therefore, with the exception of the following discussion of findings for participants with DS, the dysarthria subtype findings for the remaining CND in Table 3 are provided only for their possible value to generate additional questions for CND-speech research in dysarthria.
Findings for participants with DS in Table 3 for the 60% (27/45) who met criteria for CD or CD & CAS are interpreted as strong support for Ataxia as the prevalent subtype of their CD. Ataxic dysarthria was prevalent in participants with DS with both CD alone (82%) and CD & CAS (70%). As shown in Table 3, the only other CD subtype meeting the 50% criteria for these participants was Hyperkinetic, which met the criteria of 50% of signs ≤ 10th percentile for 5 of the 10 participants with CD & CAS. As indicated in Table 3, ataxic dysarthria is associated with deficits in cerebellar processes (e.g., Kent & Vorperian, 2013; Nadel, 2003), with implications for genomic and speech treatment research for persons with DS (cf. Wilson, Abbeduto, Camarata, & Shriberg, 2019a, 2019b).
Childhood apraxia of speech
Prevalence
The previous findings (Figure 4) indicated that CD alone occurred somewhat more frequently (13.3%) than CAS alone (4.3%). As shown in Figure 6, CD was more prevalent than CAS in 6 of the eight CND, with the prevalence of participants with CAS alone ranging from 0% (ASD) to 11.8% (22q). In comparison to these values, 2.4% of 415 children with idiopathic SD (Shriberg, Kwiatkowski, & Mabie, 2019) met criteria for CAS and none met criteria for concurrent CD & CAS.
Discussion
The prevalence finding of 4.3% for CAS in CND (and an additional 4.9% CAS concurrent with CD [Figure 4] to be discussed), supports the efficiency of studying CAS in the context of CND. A recent population-based, point-prevalence estimate of CAS in children with idiopathic SD is 1 per 1,000 children at 4 to 8 years of age (Shriberg, Kwiatkowski, & Mabie, 2019). The diverse and well-studied neurogenomic substrates of many CND provide additional rationale for studying CAS in CND that have high rates of motor speech disorders (Shriberg, 2010b).
The present prevalence findings for CAS in the context of CND also have implications for continuing research and clinical findings indicating that CAS is overdiagnosed (Shriberg & McSweeny, 2002). As noted previously, reviews of clinical studies in several countries indicate false positive CAS rates ranging from approximately 50% to approximately 90% (American Speech-Language-Hearing Association, 2007; Royal College of Speech and Language Therapists, 2011), with SMD possibly accounting for a substantial percentage of the false positives (Shriberg, 2017). Item analyses of the speech, prosody, and voice signs most associated with false positives for CAS need to be completed to test the validity of this speculation (Shriberg, Campbell, et al., 2019).
A second question raised by the prevalence findings for CAS in the context of CND is the low prevalence of CAS in three of the eight CND compared to the other five CND (Figure 6). Because the measurement and classification procedures were similar for all groups, the implication is that participants in the latter groups do not have the neurogenetic substrates of CAS present in participants in the first five groups. Reviews of the neurogenetic literatures in each of the eight CND are beyond the scope of the present prevalence study, but associated questions could possibly be resolved by results from meta-analyses of genetic, genomic, neurologic, and behavioural findings in the respective literatures.
Childhood dysarthria & childhood apraxia of speech
Prevalence
The prevalence of concurrent CD & CAS (4.9%), as shown in Figure 4, was marginally higher than the prevalence of CAS alone (4.3%) within the 9.2% of the present speakers with CND meeting criteria for CAS. As indicated for the five CND with the highest prevalence of motor speech disorders in Figure 6, the percentage of participants with CD & CAS was higher than CAS alone in two CND groups (DS, GAL), the same as CAS alone in one group (22q) and lower than CAS alone in two groups (IID, FXS).
Discussion
The present findings for the prevalence of CD & CAS compared to CAS alone in CND support trends in the genetic and other literatures in CAS. Although the earliest phenotype of the British family with a disruption in FOXP2 described a disorder consistent with CAS (Vargha-Khadem et al., 1998), later descriptions of the family and increasingly other studies of CAS associated with FOXP2 and other genes have broadened the phenotype to include CD (e.g., Liégeois & Morgan, 2012; Liégeois, Morgan, Connelly, & Vargha-Khadem, 2011; Morgan & Liégeois, 2010; Peter et al., 2017; Rice et al., 2012; Shriberg et al., 2006; Shriberg, Jakielski, & El-Shanti, 2008; Turner et al., 2013; Vernes et al., 2011).
Conclusion
Methodological considerations
Three methodological considerations warrant comment. First, the three behavioural measures of SMD, CD, and CAS used in this research have only recently become available. Each measure warrants additional research by other research groups using additional and alternative measurement modalities (e.g., neurologic, physiologic, kinematic) to cross-validate the diagnostic classifications and provide more finely-grained phenotypic detail. Second, generalizations from the present findings are limited to participants with the eight types of CND that were available in an audio-recorded database of conversational speech samples. Moreover, generalizations are limited to persons with the cognitive, linguistic, and affective abilities and dispositions to complete a continuous speech task and other SDCS supplementary tasks. Future estimates of the prevalence of speech and motor speech disorders in CND should include CND selected specifically for their genomic, neurodevelopmental, and behavioural similarities and differences. Last, the descriptive and inferential statistical findings from the present participants and methods were limited by the available cell sizes within each CND group, and consequently, within each of the four types of motor speech disorders.
Conclusion
Pending cross-validation, the primary findings of this research support the hypothesis that speech disorders, and notably motor speech disorders are substantially prevalent in persons with some types of complex neurodevelopmental disorders. A corollary conclusion is that comparative study of motor speech disorders in the context of complex neurodevelopmental disorders has the potential to inform programmatic research in biobehavioural causal pathways, treatment efficacy, and in primary, secondary, and tertiary forms of prevention.
Supplementary Material
Acknowledgments
We thank each of the following colleagues for her or his contribution to this research: Leonard Abbeduto, Nancy Alarcon, Adriane Baylis, Raphael Bernier, Lois Black, Richard Boada, Roger Brown, Stephen Camarata, Thomas Campbell, Joseph Duffy, Marios Fourakis, Lisa Freebairn, Jordan Green, Sheryl Hall, Katherina Hauner, Heather Karlsson, Joan Kwiatkowski, Barbara Lewis, Jane McSweeny, Jennifer McGlothlin, Christopher Moore, Rhea Paul, Bruce Pennington, Nancy Potter, Heather Rusiewicz, Carmen Rasmussen, Alison Scheer-Cohen, Kristie Spencer, Christie Tilkens, Jan van Santen, Jennell Vick, Emily White, Carol Widder, David Wilson, and Erin Wilson.
Funding
This work was supported by grants from the National Institute on Deafness and Other Communication Disorders [DC000496] and a core grant to the Waisman Center from the National Institute of Child Health and Human Development [U54 HD090256].
Abbreviations:
- 16p
16p11.2 deletion and duplication syndrome
- 22q
22q11.2 deletion syndrome
- ASD
Autism Spectrum Disorder
- CAS
Childhood Apraxia of Speech
- CD
Childhood Dysarthria
- CND
Complex Neurodevelopmental Disorder
- DS
Down syndrome
- FXS
Fragile X syndrome
- GAL
Galactosemia
- IID
Idiopathic Intellectual Disability
- MSD
Motor Speech Disorder
- No MSD
No Motor Speech Disorder
- NSA
Normal(ized) Speech Acquisition
- PEPPER
Programs to Examine Phonetic and Phonologic Evaluation Records
- PSD
Persistent Speech Delay
- PSE
Persistent Speech Errors
- SD
Speech Delay
- SDCS
Speech Disorders Classification System
- SDCSS
Speech Disorders Classification System Summary
- SE
Speech Errors
- SMD
Speech Motor Delay
- SSD
Speech Sound Disorders
- TBI
Traumatic Brain Injury
Appendix 1. Participants and inclusionary criteria
Description and inclusionary criteria for participants in each of the eight Complex Neurodevelopmental Disorders groups (see text, Table 1). A technical report (Shriberg & Mabie, 2017) includes speech, prosody, and voice assessment data for participants in each of the eight groups.
| Eight Complex Neurodevelopmental Disorders | Abbreviation in Text | n Available Data | n Eligible for Classification | Brief Description of Participants | Sources of the Speech Samples |
|---|---|---|---|---|---|
| 16p11.2 Deletion and Duplication Syndrome | 16p | 111 | 108 | Audio recordings of the Autism Diagnostic Observations Schedule (ADOS; Lord, Rutter, DiLavore, & Risi, 1999) administrations from children and adults with 16p11.2 variants obtained from the Simons – Variation in Individuals Project (Simons VIP Consortium, 2012) were collected and analyzed. Participation in the Simons VIP requires the canonical deletion or duplication (~600 kb, chr16: 29,557,497–30,107,356; hg18), or a smaller CNV at the locus. Exclusion criteria include any other pathogenic CNVs or other neurogenetic or neurological diagnoses unrelated to 16p11.2 (e.g., tuberous sclerosis). Participant ages ranged from 3;2 to 62;0 (yrs;mos), with approximately equal numbers of males (56) and females (55). The overall percentage of 16p11.2 variants included 54.1% deletions and 45.9% duplications. A total of 23 of the 111 (20.7%) participants with 16p11.2 deletions and duplications met criteria for verbal participants with Autism Spectrum Disorder. | Simons Foundation. (2015). The Simons VIP Consortium (2012). |
| 22q11.2 Deletion Syndrome | 22q | 18 | 17 | Inclusionary criteria included: (a) diagnosis of 22q11.2 deletion syndrome by Fluorescence In Situ Hybridization (FISH) testing or microarray, (b) 6–18 years of age, (c) English as the participant’s primary language, and (d) no history of permanent bilateral hearing loss. | Baylis and Shriberg (2018) |
| Autism Spectrum Disorder | ASD | 42 | 42 | Inclusionary criteria included: (a) a previous diagnosis of autism, PDD-NOS, ASD, or Asperger syndrome from a qualified clinician; (b) full scale IQ ≥ 70; (c) mean length of utterance of at least 3.0, based on transcription of a 3–5 min conversational sample; (d) > 70% of words intelligible in the language sample; and (e) normal hearing and vision (or corrected with glasses) on standard screening. Exclusionary criteria included known craniofacial or neurological impairment or bilingual background. | Shriberg, Paul, Black, and van Santen (2011) |
| Down syndrome | DS | 50 | 45 | Three samples of participants: (1) 29 participants, 10–18 years of age with a confirmed diagnosis of Trisomy 21 and no diagnosis of autism spectrum disorders; (2) 17 participants, 8–18 years of age, with a confirmed diagnosis of Trisomy 21 and no diagnosis of autism spectrum disorders; (3) 4 male participants, ages 13–20 years, with a confirmed diagnosis of Trisomy 21. |
Wilson, Abbeduto, Camarata, and Shriberg (2019a;
2019b); Camarata, Yoder, and Camarata
(2006); Davis, Camarata, and Camarata (2016) |
| fragile X syndrome | FXS | 30 | 28 | Males ranging in age from 11–22
yrs. Inclusionary criteria: (a) DNA or cytogenetic confirmation of the syndrome; (b) speech as the primary means of communication; (c) no more than a mild hearing loss per Chapman, Schwartz, and Kay-Raining Bird (1991) criterion; (d) ability to complete all tests; (e) nonverbal IQs <70; (f) passed screening and follow-up psychologist assessment for ASD. |
Abbeduto, Murphy, Cawthon, Richmond, Weissman, Karadottir,
and O’Brien (2003); Abbeduto, Murphy, Kover, Giles, Karadottir, Amman, Bruno, Kim, Schroeder, Anderson, and Nollin (2008); Keller-Bell and Abbeduto (2007) |
| Galactosemia | GAL | 31 | 31 | Inclusionary criteria: (a) a diagnosis of classic (full expression) galactosemia; (b) prior or persistent Speech Delay, as documented by a history of treatment for Speech Delay; (c) 4–17 years of age; (d) residence in the United States; (e) English as the only or first language; and (f) no history of significant hearing loss or craniofacial disorder affecting speech. | Shriberg, Potter, and Strand (2011) |
| Idiopathic Intellectual Disability | IID | 26 | 23 | Audiotape speech samples from adults with IID living in the Madison, WI, area. Participants were non-institutionalized, and worked at settings ranging from work activity centers to independent jobs in the community. As reported in Shriberg and Widder (1990), audiotape samples from a parent study (Reynolds & Baker, 1988) were assessed for use and tapes were removed that (a) had unacceptable signal quality or excessive background noise; (b) were from persons who were nonambulatory; (c) were from persons who sounded frankly dysarthric (six tapes), using screening criteria in Darley, Aronson, and Brown (1975); (d) were from persons for whom records were not available on age, gender, race, or level of mental retardation; (e) were from persons outside the ages of 20 to 50 years (excepting one 53-year-old); and/or (f) were from persons outside the range of mild to moderate levels of retardation, that is, excluding borderline and severe or profound involvement as determined by AAMD classification (Grossman,1977) available in agency records. | Shriberg and Widder (1990) |
| Severe Traumatic Brain Injury | TBI | 54 | 52 | Subsample of 56 children who sustained severe pediatric traumatic brain injury (TBI) between age 1 month and 11 years. Inclusionary criteria: (a) severe TBI, defined as a Glasgow Coma Scale score ≤ 8 and a positive CT scan; (b) age at injury < 11 years; (c) injury not known or suspected to have resulted from abuse; and (d) monolingual English home environment and no previously diagnosed neurodevelopmental, speech, or language deficits according to parent report. |
Campbell and Dollaghan (1995); Campbell, Dollaghan, Janosky, Rusiewicz, Small, Dick, Vick, and Adelson (2013); Campbell, Dollaghan, and Shriberg (2019) |
| Total: | 362 | 346 |
Appendix 1. References
- Abbeduto L, Murphy MM, Cawthon SW, Richmond EK, Weissman MD, Karadottir S, O’Brien A (2003). Receptive language skills of adolescents and young adults with Down or fragile X syndrome. American Journal of Mental Retardation, 108, 149–160. [DOI] [PubMed] [Google Scholar]
- Abbeduto L, Murphy MM, Kover ST, Giles N, Karadottir S, Amman A, … Nollin KA (2008). Signaling noncomprehension of language: A comparison of fragile X syndrome and Down syndrome. American Journal of Mental Retardation, 113, 214–30. [DOI] [PMC free article] [PubMed] [Google Scholar]
- Baylis AL, & Shriberg LD (2018). Estimates of the prevalence of speech and motor speech disorders in youth with 22q11.2 Deletion syndrome. American Journal of Speech-Language Pathology Advance online publication. doi: 10.1044/2018_AJSLP-18-0037 [DOI] [PMC free article] [PubMed] [Google Scholar]
- Camarata S, Yoder P, & Camarata M (2006). Simultaneous treatment of grammatical and speech-comprehensibility deficits in children with Down syndrome. Down Syndrome Research and Practice, 11, 9–17. [DOI] [PubMed] [Google Scholar]
- Campbell TF, & Dollaghan CA (1995). Speaking rate, articulatory speed, and linguistic processing in children and adolescents with severe traumatic brain injury. Journal of Speech and Hearing Research, 38, 864–875. [DOI] [PubMed] [Google Scholar]
- Campbell TF, Dollaghan CA, Janosky J, Rusiewicz HL, Small SL, Dick F, … Adelson PD (2013). Consonant accuracy after severe pediatric traumatic brain injury: A prospective cohort study. Journal of Speech, Language, & Hearing Research, 56, 1023–1034. [DOI] [PubMed] [Google Scholar]
- Campbell TF, Dollaghan CA, & Shriberg LD (2019). Motor speech and speech outcomes in childhood traumatic brain injury (TBI) Manuscript in preparation.
- Chapman RS, Schwartz SE, & Kay-Raining Bird EK (1991). Language skills of children and adolescents with Down syndrome I. Comprehension. Journal of Speech and Hearing Research, 34, 1106–1120. [DOI] [PubMed] [Google Scholar]
- Darley FL, Aronson AE, & Brown JR (1975). Motor Speech Disorders Philadelphia: W. B. Saunders. [Google Scholar]
- Davis TN, Camarata S, & Camarata M (2016). Cross modal generalization of receptive and expressive vocabulary in children with Down syndrome. Journal of Down syndrome & Chromosome Abnormalities, 2, 105. [Google Scholar]
- Grossman H (1977). Manual on Terminology and Classification in Mental Retardation Washington, DC: American Association on Mental Deficiency. [Google Scholar]
- Keller-Bell YD, & Abbeduto L (2007). Narrative ability of adolescents with fragile X syndrome. American Journal of Mental Retardation, 112, 289–299. [DOI] [PubMed] [Google Scholar]
- Lord C, Rutter M, DiLavore P, & Risi S (1999). Autism Diagnostic Observation Schedule (ADOS) Los Angeles: Western Psychological Services. [Google Scholar]
- Reynolds WM, & Baker JA (1988). Assessment of depression in persons with mental retardation. American Journal of Mental Retardation, 93, 93–103. [PubMed] [Google Scholar]
- Shriberg LD, & Mabie HL (2017). Speech and motor speech assessment findings in eight complex neurodevelopmental disorders. (Technical Report No. 24). Phonology Project, Waisman Center, University of Wisconsin-Madison; Retrieved from Phonology Project website: http://www.waisman.wisc.edu/phonology/ [Google Scholar]
- Shriberg LD, Paul R, Black LM, & van Santen JP (2011). The hypothesis of apraxia of zspeech in children with Autism Spectrum Disorder. Journal of Autism and Developmental Disorders, 41, 405–426. [DOI] [PMC free article] [PubMed] [Google Scholar]
- Shriberg LD, Potter NL, & Strand EA (2011). Prevalence and phenotype of childhood apraxia of speech in youth with galactosemia. Journal of Speech, Language, and Hearing Research, 54, 487–519. [DOI] [PMC free article] [PubMed] [Google Scholar]
- Shriberg LD, & Widder CJ (1990). Speech and prosody characteristics of adults with mental retardation. Journal of Speech and Hearing Research, 33, 627–653. [DOI] [PubMed] [Google Scholar]
- Simons Foundation. (2015). Speech disorders in individuals with 16p11.2 deletion or duplication https://www.sfari.org/funded-project/speech-disorders-in-individuals-with-16p11-2-deletion-or-duplication/ Accessed 26 June 2018.
- The Simons VIP Consortium. (2012). Simons Variation in Individuals Project (Simons VIP): a genetics-first approach to studying autism spectrum and related neurodevelopmental disorders. Neuron, 73, 1063–1067. [DOI] [PubMed] [Google Scholar]
- Wilson EM, Abbeduto L, Camarata SM, & Shriberg LD (2019a). Estimates of the prevalence of speech and motor speech disorders in adolescents with Down syndrome. Clinical Linguistics & Phonetics doi: 10.1080/02699206.2019.1595735 [DOI] [PMC free article] [PubMed] [Google Scholar]
- Wilson EM, Abbeduto L, Camarata SM, & Shriberg LD (2019b). Speech and motor speech disorders and intelligibility in adolescents with Down syndrome. Clinical Linguistics & Phonetics doi: 10.1080/02699206.2019.1595736 [DOI] [PMC free article] [PubMed] [Google Scholar]
Appendix 2. Speech, motor speech, and dysarthria subtype classifications in the Speech Disorders Classification System (SDCS)
The five Speech classifications and five Motor Speech classifications in the SDCS are each mutually exclusive. The five dysarthria subtype classifications are not mutually exclusive. That is, a speaker can meet percentile criteria for more than one of the five listed dysarthria subtype classifications (i.e., mixed dysarthria). See Supplement for the procedures and measures used to classify each motor speech disorder.
| SDCS Classifications and Dysarthria Subtypes | Abbreviation | Age (yrs;mos) at Assessment | Description | Referencesa |
|---|---|---|---|---|
| Five Speech Classifications | ||||
| Normal(ized) Speech Acquisition | NSA | 3–80 | Does not meet criteria for any of the four Speech Disorder classifications | 2, 3, 4 |
| Speech Errors | SE | 6–8;11 | Age-inappropriate speech sound distortions | 3, 4 |
| Persistent Speech Errors | PSE | 9–80 | Age-inappropriate speech sound distortions that persist past 9 years of age | 4, 5 |
| Speech Delay | SD | 3–8;11 | Age-inappropriate speech sound deletions and/or substitutions | 3, 4 |
| Persistent Speech Delay | PSD | 9–80 | Age-inappropriate speech sound deletions and/or substitutions that persist past 9 years of age | 3, 4, 5 |
| Five Motor Speech Classifications | ||||
| No Motor Speech Disorder | No MSD | 3–80 | Does not meet criteria for any of the four Motor Speech Disorders classifications | 2, 6, 8 |
| Speech Motor Delay | SMD | 3–80 | Meets PSI criterion for SMD | 2, 6, 8 |
| Childhood Dysarthria | CD | 3–80 | Meets DI and DSI criteria for CD | 2, 6, 8 |
| Childhood Apraxia of Speech | CAS | 3–80 | Meets PM criterion for CAS | 6, 7, 8 |
| Childhood Dysarthria & Childhood Apraxia of Speech | CD & CAS | 3–80 | Meets SDCS criteria for CD & CAS | 2, 6, 8 |
| Five Dysarthria Subtypes | ||||
| Ataxic | 3–80 | Cerebellar disorder | 1, 2 | |
| Spastic | 3–80 | Upper motor neuron disorder | 1, 2 | |
| Hyperkinetic | 3–80 | Basal ganglia disorder; increased movement | 1, 2 | |
| Hypokinetic | 3–80 | Basal ganglia disorder; decreased movement | 1, 2 | |
| Flaccid | 3–80 | Lower motor neuron disorder | 1, 2 |
Notes: PSI = Precision-Stability Index; DI = Dysarthria Index; DSI = Dysarthria Subtype Index; PM = Pause Marker.
1. Duffy (2013); 2. Mabie and Shriberg (2017); 3. Shriberg (1993); 4. Shriberg, Austin, Lewis, McSweeny, and Wilson (1997); 5. Shriberg et al. (2010a); 6. Shriberg and Mabie (2017); 7. Shriberg et al. (2017a); 8. Tilkens et al. (2017).
Footnotes
Disclosure Statement
The authors report no declarations of interest.
References
- American Speech-Language-Hearing Association. (2007). Childhood apraxia of speech(Technical report) Retrieved from http://www.asha.org/public/speech/disorders/ChildhoodApraxia/ doi: 10.1094/PDIS-91-4-0467B [DOI] [Google Scholar]
- Beglinger LJ, & Smith TH (2001). A review of subtyping in autism and proposed dimensional classification model. Journal of Autism and Developmental Disorders, 31, 411–422. [DOI] [PubMed] [Google Scholar]
- Bernthal JE, Bankson NW, & Flipsen P Jr. (2017). Articulation and phonological disorders: Speech sound disorders in children (8th ed.). Boston, MA: Pearson Education. [Google Scholar]
- Bishop DV (2002). Motor immaturity and specific speech and language impairment: Evidence for a common genetic basis. American Journal of Medical Genetics, 114, 56–63. doi: 10.1002/ajmg.1630 [DOI] [PubMed] [Google Scholar]
- Bowen C (2015). Children’s speech sound disorders (2nd ed.). Chichester, England: Wiley-Blackwell. [Google Scholar]
- Bradford A, Murdoch B, Thompson E, & Stokes P (1997). Lip and tongue function in children with developmental speech disorders: A preliminary investigation. Clinical Linguistics & Phonetics, 11, 363–387. doi: 10.1080/02699209708985201 [DOI] [Google Scholar]
- Carrigg B, Parry L, Baker E, Shriberg LD, & Ballard KJ (2016). Cognitive, linguistic, and motor abilities in a multigenerational family with childhood apraxia of speech. Archives of Clinical Neuropsychology, 31, 1006–1025. [DOI] [PMC free article] [PubMed] [Google Scholar]
- Carrow-Woolfolk E (1995). Oral and Written Language Scales (OWLS) Bloomington, MN: Pearson Assessment. [Google Scholar]
- Chilosi AM, Lorenzini I, Fiori S, Graziosi V, Rossi G, Pasquariello R, … Cioni G (2015). Behavioral and neurobiological correlates of childhood apraxia of speech in Italian children. Brain & Language, 150, 177–185. doi: 10.1016/j.bandl.2015.10.002 [DOI] [PubMed] [Google Scholar]
- Duffy JR (2013). Motor speech disorders: Substrates, differential diagnosis, and management (3rd ed. ed.). St. Louis, MO: Mosby. [Google Scholar]
- Eadie P, Morgan A, Ukoumunne OC, Ttofari Eecen K, Wake M, & Reilly S (2015). Speech sound disorder at 4 years: Prevalence, co-occurring ities, and predictors in a community cohort of children. Developmental Medicine and Child Neurology, 57, 578–584. doi: 10.1111/dmcn.12635 [DOI] [PubMed] [Google Scholar]
- Eising E, Carrion-Castillo A, Vino A, Strand EA, Jakielski KJ, Scerri TS, … Fisher SE (2018). A set of regulatory genes co-expressed in embryonic human brain is implicated in disrupted speech development. Molecular Psychiatry Advance online publication. doi: 10.1038/s41380-018-0020-x. [DOI] [PMC free article] [PubMed] [Google Scholar]
- Feise RJ (2002). Do multiple outcome measures require p-value adjustment? BMC Medical Research Methodology, 2, 8. doi: 10.1186/1471-2288-2-8 [DOI] [PMC free article] [PubMed] [Google Scholar]
- Flipsen P Jr. (2015). Emergence and prevalence of persistent and residual speech errors. Seminars in Speech and Language, 36, 217–223. doi: 10.1055/s-0035-1562905 [DOI] [PubMed] [Google Scholar]
- Friederici AD (2012). Language development and the ontogeny of the dorsal pathway. Frontiers in Evolutionary Neuroscience, 4, 1–7. doi: 10.3389/fnevo.2012.00001 [DOI] [PMC free article] [PubMed] [Google Scholar]
- Gaines R, & Missiuna C (2007). Early identification: Are speech/language-impaired toddlers at increased risk for developmental coordination disorder? Child: Care, Health, and Development, 33, 325–332. [DOI] [PubMed] [Google Scholar]
- Goffman L (1999). Prosodic influences on speech production in children with Specific Language Impairment and speech deficits: Kinematic, acoustic, and transcription evidence. Journal of Speech, Language, and Hearing Research, 42, 1499–1517. doi: 10.1044/jslhr.4206.1499 [DOI] [PubMed] [Google Scholar]
- Guenther FH, & Vladusich T (2012). A neural theory of speech acquisition and production. Journal of Neurolinguistics, 25, 408–422. doi: 10.1016/j.jneuroling.2009.08.006 [DOI] [PMC free article] [PubMed] [Google Scholar]
- Hickok G, & Poeppel D (2004). Dorsal and ventral streams: A framework for understanding aspects of the functional anatomy of language. Cognition, 92, 67–99. doi: 10.1016/j.cognition.2003.10.011 [DOI] [PubMed] [Google Scholar]
- Hill EL (2001). Non-specific nature of specific language impairment: A review of the literature with regard to concomitant motor impairments. International Journal of Language and Communication Disorders, 36, 149–171. doi: 10.1080/13682820010019874 [DOI] [PubMed] [Google Scholar]
- Kaufman AS, & Kaufman NL (2004). Kaufman Brief Intelligence Test – Second Edition (KBIT-2) San Antonio, TX: Pearson Assessments. [Google Scholar]
- Kent R, & Vorperian H (2013). Speech Impairment in Down syndrome: A review. Journal of Speech, Language, and Hearing Research, 56, 178–210. doi: 10.1044/1092-4388(2012/12-0148) [DOI] [PMC free article] [PubMed] [Google Scholar]
- Liégeois F, Morgan AT, Connelly A, & Vargha-Khadem F (2011). Endophenotypes of FOXP2: Dysfunction within the human articulatory network. European Journal of Paediatric Neurology, 15, 283–288. doi: 10.1016/j.ejpn.2011.04.006 [DOI] [PubMed] [Google Scholar]
- Liégeois FJ, & Morgan AT (2012). Neural bases of childhood speech disorders: Lateralization and plasticity for speech functions during development. Neuroscience and Biobehavioral Reviews, 36, 439–458. doi: 10.1016/j.neubiorev.2011.07.011 [DOI] [PubMed] [Google Scholar]
- Ludlow CL, Kent RD, & Gray LC (2018). Measuring voice, speech, and swallowing in the clinic and laboratory San Diego, CA: Plural Publishing. [Google Scholar]
- Maas E, Gildersleeve-Neumann C, Jakielski KJ, & Stoeckel R (2014). Motor-based intervention protocols in treatment of Childhood Apraxia of Speech (CAS). Current Developmental Disorders Reports, 1, 197–206. doi: 10.1007/s40474-014-0016-4 [DOI] [PMC free article] [PubMed] [Google Scholar]
- Maas E, Robin DA, Austermann Hula SN, Freedman SE, Wulf G, Ballard KJ, & Schmidt RA (2008). Principles of motor learning in treatment of motor speech disorders. American Journal of Speech-Language Pathology, 17, 277–298. doi: 10.1044/1058-0360(2008/025) [DOI] [PubMed] [Google Scholar]
- Mabie HL, & Shriberg LD (2017). Speech and motor speech measures and reference data for the Speech Disorders Classification System (SDCS). (Technical Report No. 23). Phonology Project, Madison, WI: Waisman Center, University of Wisconsin–Madison; Retrieved from Phonology Project website: http://www.waisman.wisc.edu/phonology/ [Google Scholar]
- McAllister Byun T, & Preston JL (2015). Residual speech errors: Causes, Implications, treatment. Seminars in Speech and Language, 36, 215–216. [DOI] [PubMed] [Google Scholar]
- McLeod S, & Baker E (2017). Children’s speech: An evidence-based approach to assessment and intervention Boston, MA: Pearson Education. [Google Scholar]
- McSweeny JL,& Shriberg LD (1995). Segmental and suprasegmental transcription reliability (Technical Report No. 2). Phonology Project, Madison, WI: Waisman Center, University of Wisconsin–Madison; Retrieved from Phonology Project website: http://www.waisman.wisc.edu/phonology/ [Google Scholar]
- Morgan A, Fisher SE, Scheffer I, & Hildebrand M (2016). FOXP2-related speech and language disorders. In Pagon RA, Adam MP, Ardinger HH, Wallace SE, Amemiya A, Bean LJ, … Stephens K (Eds.), GeneReviews® [internet] Seattle: University of Washington, Seattle. [Google Scholar]
- Morgan AT, & Liégeois F (2010). Re-thinking diagnostic classification of the dysarthrias: A developmental perspective. Folia Phoniatrica Et Logopaedica, 62, 120–126. doi: 10.1159/000287210 [DOI] [PubMed] [Google Scholar]
- Nadel L (2003). Down’s syndrome: A genetic disorder in biobehavioral perspective. Genes, Brain and Behavior, 2, 156–166. doi: 10.1034/j.1601-183X.2003.00026.x [DOI] [PubMed] [Google Scholar]
- Nakagawa S (2004). A farewell to Bonferroni: The problems of low statistical power and publication bias. Behavioral Ecology, 15, 1044–1045. doi: 10.1093/beheco/arh107 [DOI] [Google Scholar]
- Newmeyer AJ, Grether S, Grasha C, White J, Akers R, Aylward C, … Degrauw T (2007). Fine motor function and oral-motor imitation skills in preschool-age children with speech-sound disorders. Clinical Pediatrics, 46, 604–611. doi: 10.1177/0009922807299545 [DOI] [PubMed] [Google Scholar]
- Nijland L, Maassen B, & van der Meulen S (2003). Evidence of motor programming deficits in children diagnosed with DAS. Journal of Speech, Language, & Hearing Research, 46, 437–450. doi: 10.1044/1092-4388(2003/036) [DOI] [PubMed] [Google Scholar]
- Nijland L, Terband H, & Maassen B (2015). Cognitive functions in childhood apraxia of speech. Journal of Speech, Language, and Hearing Research, 58, 550–565. doi: 10.1044/2015_JSLHR-S-14-0084 [DOI] [PubMed] [Google Scholar]
- Pennington BF (2006). From single to multiple deficit models of developmental disorders. Cognition, 101, 385–413. doi: 10.1016/j.cognition.2006.04.008 [DOI] [PubMed] [Google Scholar]
- Perkell JS (2012). Movement goals and feedback and feedforward control mechanisms in speech production. Journal of Neurolinguistics, 25, 382–407. doi: 10.1016/j.jneuroling.2010.02.011 [DOI] [PMC free article] [PubMed] [Google Scholar]
- Perneger TV (1998). What’s wrong with Bonferroni adjustments? British Medical Journal, 316, 1236. [DOI] [PMC free article] [PubMed] [Google Scholar]
- Peter B, Lancaster H, Vose C, Fares A, Schrauwen I, & Huentelman M (2017). Two unrelated children with overlapping 6q25.3 deletions, motor speech disorders, and language delays. American Journal of Medical Genetics: Part A, 173, 2659–2669. doi: 10.1002/ajmg.a.38385 [DOI] [PubMed] [Google Scholar]
- Peterson RL, Pennington BF, Shriberg LD, & Boada R (2009). What influences literacy outcome in children with speech sound disorder? Journal of Speech, Language, and Hearing Research, 52, 1175–1188. doi: 10.1044/1092-4388(2009/08-0024) [DOI] [PMC free article] [PubMed] [Google Scholar]
- Potter NL, Hall S, Karlsson HB, Fourakis M, Lohmeier HL, McSweeny JL, … Shriberg LD (2012). Reference data for the Madison Speech Assessment Protocol (MSAP): A Database of 150 Participants 3-to-18 years of age with typical speech. (Technical Report No. 18). Phonology Project, Madison, WI: Waisman Center, University of Wisconsin–Madison; Retrieved from Phonology Project website: http://www.waisman.wisc.edu/phonology/ [Google Scholar]
- Programs to Examine Phonetic and Phonologic Evaluation Records [PEPPER: Computer software] (2019). Madison, WI: Waisman Center, University of Wisconsin–Madison. [Google Scholar]
- Rechetnikov RP, & Maitra K (2009). Motor impairments in children associated with impairments of speech or language: A meta-analytic review of research literature. The American Journal of Occupational Therapy, 63, 255–263. [DOI] [PubMed] [Google Scholar]
- Redle E, Vannest J, Maloney T, Tsevat RK, Eikenberry S, Lewis B, … Holland SK (2015). Functional MRI evidence for fine motor praxis dysfunction in children with persistent speech disorders. Brain Research, 1597, 47–56. doi: 10.1016/j.brainres.2014.11.047 [DOI] [PMC free article] [PubMed] [Google Scholar]
- Rice GM, Raca G, Jakielski KJ, Laffin JJ, Iyama-Kurtycz C, Hartley SL, … Shriberg LD (2012). Phenotype of FOXP2 haploinsufficiency in a mother and son. American Journal of Medical Genetics: Part A, 158A, 174–181. doi: 10.1002/ajmg.a.34354 [DOI] [PMC free article] [PubMed] [Google Scholar]
- Royal College of Speech and Language Therapists. (2011). Developmental Verbal Dyspraxia London, England: Royal College of Speech and Language Therapists. [Google Scholar]
- Rvachew S (2015, August 21). What’s in a name? Does SSD smell sweeter than DPD? [Web log post]. Retrieved from https://developmentalphonologicaldisorders.wordpress.com/2015/08/21/whats-in-a-name-does-ssd-smell-sweeter-than-dpd/
- Rvachew S, & Brosseau-Lapré F (2012). Developmental phonological disorders: Foundations of clinical practice San Diego, CA: Plural Publishing. [Google Scholar]
- Scheer-Cohen AR, Holt AS, Karlsson HB, Mabie HL, McSweeny JL, Tilkens CM, & Shriberg LD (2013). Reference data for the Madison Speech Assessment Protocol (MSAP): A Database of Fifty 20-to-80 year old Participants with Typical Speech (Technical Report No. 20). Phonology Project, Madison, WI: Waisman Center, University of Wisconsin–Madison; Retrieved from Phonology Project website: http://www.waisman.wisc.edu/phonology/ [Google Scholar]
- Semel E, Wiig E, & Secord W (2003). Clinical Evaluation of Language Fundamentals-4 (CELF– 4). San Antonio, TX: Harcourt Assessment. [Google Scholar]
- Shriberg LD (1993). Four new speech and prosody-voice measures for genetics research and other studies in developmental phonological disorders. Journal of Speech and Hearing Research, 36, 105–140. doi: 10.1044/jshr.3601.105 [DOI] [PubMed] [Google Scholar]
- Shriberg LD (2010a). Childhood speech sound disorders: From post-behaviorism to the post-genomic era. In Paul R & Flipsen P (Eds.), Speech sound disorders in children (pp. 1–34). San Diego, CA: Plural Publishing. [Google Scholar]
- Shriberg LD (2010b). A neurodevelopmental framework for research in Childhood Apraxia of Speech. In Maassen B & van Lieshout P (Eds.), Speech motor control: New developments in basic and applied research (pp. 259–270). New York, NY: Oxford University Press. [Google Scholar]
- Shriberg LD (2017, July). Motor speech disorder-not otherwise specified: Prevalence and Phenotype. Paper presented at the 7th International Conference on Speech Motor Control, Groningen, the Netherlands. [Google Scholar]
- Shriberg LD, Austin D, Lewis BA, McSweeny JL, & Wilson DL (1997). The speech disorders classification system (SDCS): extensions and lifespan reference data. Journal of Speech, Language, and Hearing Research, 40, 723–740. doi: 10.1044/jslhr.4004.723 [DOI] [PubMed] [Google Scholar]
- Shriberg LD, Ballard KJ, Tomblin JB, Duffy JR, Odell KH, & Williams CA (2006). Speech, prosody, and voice characteristics of a mother and daughter with a 7;13 translocation affecting. FOXP2. Journal of Speech, Language, and Hearing Research, 49, 500–525. doi: 10.1044/1092-4388(2006/038) [DOI] [PubMed] [Google Scholar]
- Shriberg LD, Campbell TF, Mabie HL, & McGlothlin JH (2019). Initial studies of the phenotype and persistence of Speech Motor Delay (SMD). Clinical Linguistics & Phonetics [DOI] [PMC free article] [PubMed]
- Shriberg LD, Fourakis M, Hall S, Karlsson HB, Lohmeier HL, McSweeny JL, … Wilson DL (2010a). Extensions to the Speech Disorders Classification System (SDCS). Clinical Linguistics & Phonetics, 24, 795–824. doi: 10.3109/02699206.2010.503006 [DOI] [PMC free article] [PubMed] [Google Scholar]
- Shriberg LD, Fourakis M, Hall S, Karlsson HB, Lohmeier HL, McSweeny JL, … Wilson DL (2010b). Perceptual and acoustic reliability estimates for the Speech Disorders Classification System (SDCS). Clinical Linguistics & Phonetics, 24, 825–846. doi: 10.3109/02699206.2010.503007 [DOI] [PMC free article] [PubMed] [Google Scholar]
- Shriberg LD, Jakielski KJ, & El-Shanti H (2008). Breakpoint localization using array-CGH in three siblings with an unbalanced 4q:16q translocation and Childhood Apraxia of Speech (CAS). American Journal of Medical Genetics: Part A, 146A, 2227–2233. doi: 10.1002/ajmg.a.32363 [DOI] [PubMed] [Google Scholar]
- Shriberg LD, & Kwiatkowski J (1985). Continuous speech sampling for phonologic analyses of speech-delayed children. Journal of Speech and Hearing Disorders, 50, 323–334. [DOI] [PubMed] [Google Scholar]
- Shriberg LD, Kwiatkowski J, & Mabie HL (2019). Estimates of the prevalence of motor speech disorder in children with idiopathic speech delay. Clinical Linguistics & Phonetics doi: 10.1080/02699206.2019.1595733 [DOI] [PMC free article] [PubMed] [Google Scholar]
- Shriberg LD, & Lof GL (1991). Reliability studies in broad and narrow phonetic transcription. Clinical Linguistics & Phonetics, 5, 225–279. doi: 10.3109/02699209108986113 [DOI] [Google Scholar]
- Shriberg LD, Lohmeier HL, Campbell TF, Dollaghan CA, Green JR, & Moore CA (2009). A nonword repetition task for speakers with misarticulations: The Syllable Repetition Task (SRT). Journal of Speech, Language, and Hearing Research, 52, 1189–1212. doi: 10.1044/1092-4388(2009/08-0047) [DOI] [PMC free article] [PubMed] [Google Scholar]
- Shriberg LD, Lohmeier HL, Strand EA, & Jakielski KJ (2012). Encoding, memory, and transcoding deficits in childhood apraxia of speech. Clinical Linguistics & Phonetics, 26, 445–482. doi: 10.3109/02699206.2012.655841 [DOI] [PMC free article] [PubMed] [Google Scholar]
- Shriberg LD, & Mabie HL (2017). Speech and motor speech assessment findings in eight complex neurodevelopmental disorders (Technical Report No. 24). Phonology Project, Madison, WI: Waisman Center, University of Wisconsin–Madison; Retrieved from Phonology Project website: http://www.waisman.wisc.edu/phonology/ [Google Scholar]
- Shriberg LD, & McSweeny JL (2002, May). Classification and misclassification of childhood apraxia of speech. Paper presented at the Ninth Meeting of the International Clinical Linguistics and Phonetics Association, Hong Kong, China. [Google Scholar]
- Shriberg LD, & Strand EA (2018). Speech and motor speech characteristics of a consensus group of 28 children with Childhood Apraxia of Speech. (Technical Report No. 25). Phonology Project, Madison, WI: Waisman Center, University of Wisconsin–Madison; Retrieved from Phonology Project website: http://www.waisman.wisc.edu/phonology/ [Google Scholar]
- Shriberg LD, Strand EA, Fourakis M, Jakielski KJ, Hall SD, Karlsson HB, … Wilson DL (2017). A diagnostic marker to discriminate childhood apraxia of speech from speech delay: III. theoretical coherence of the pause marker with speech processing deficits in childhood apraxia of speech. Journal of Speech, Language, and Hearing Research, 60, S1135–S1152. [DOI] [PMC free article] [PubMed] [Google Scholar]
- Shriberg LD, Strand EA, & Mabie HL (2016, March). Prevalence estimates for three types of Motor Speech Disorders in Complex Neurodevelopmental Disorders (CND). Paper presented at the Eighteenth Biennial Conference on Motor Speech: Motor Speech Disorders & Speech Motor Control, Newport Beach, CA. [Google Scholar]
- Shriberg LD, Tomblin JB, & McSweeny JL (1999). Prevalence of speech delay in 6-year-old children and comorbidity with language impairment. Journal of Speech, Language, and Hearing Research, 42, 1461–1481. doi: 10.1044/jslhr.4206.1461 [DOI] [PubMed] [Google Scholar]
- Shriberg LD, & Widder CJ (1990). Speech and prosody characteristics of adults with mental retardation. Journal of Speech and Hearing Research, 33, 627–653. doi: 10.1044/jshr.3304.627 [DOI] [PubMed] [Google Scholar]
- Terband H, Maassen B, Guenther FH, & Brumberg J (2014). Auditory-motor interactions in pediatric motor speech disorders: Neurocomputational modeling of disordered development. Journal of Communication Disorders, 47, 17–33. doi: 10.1016/j.jcomdis.2014.01.001 [DOI] [PMC free article] [PubMed] [Google Scholar]
- Thorndike RL, Hagen EP, & Sattler JM (1986). Stanford-Binet Intelligence Scale (4th ed.). Chicago, IL: Riverside. [Google Scholar]
- Tilkens CM, Karlsson HB, Fourakis M, Hall SD, Mabie HL, McSweeny JL, & Shriberg LD (2017). A diagnostic marker to discriminate Childhood Apraxia of Speech (CAS) from Speech Delay (SD) (Technical Report No. 22). Phonology Project, Madison, WI: Waisman Center, University of Wisconsin–Madison; Retrieved from Phonology Project website: http://www.waisman.wisc.edu/phonology/ [Google Scholar]
- Torrington Eaton C (2015). Cognitive factors and residual speech errors: Basic science, translational research, and some clinical frameworks. Seminars in Speech and Language, 36, 247–256. [DOI] [PubMed] [Google Scholar]
- Truong DT, Shriberg LD, Smith SD, Chapman KL, Scheer-Cohen AR, DeMille MMC, … Gruen JR (2016). Multipoint genome-wide linkage scan for nonword repetition in a multigenerational family further supports chromosome 13q as a locus for verbal trait disorders. Human Genetics, 135, 1329–1341. doi: 10.1007/s00439-016-1717-z [DOI] [PMC free article] [PubMed] [Google Scholar]
- Turner SJ, Hildebrand MS, Block S, Damiano J, Fahey M, Reilly S, … Morgan AT (2013). Small intragenic deletion in FOXP2 associated with childhood apraxia of speech and dysarthria. American Journal of Medical Genetics: Part A, 161A, 2321–2326. doi: 10.1002/ajmg.a.36055 [DOI] [PubMed] [Google Scholar]
- Turner SJ, Morgan AT, Perez ER, & Scheffer IE (2015). New genes for focal epilepsies with speech and language disorders. Current Neurology and Neuroscience Reports, 15, 35. doi: 10.1007/s11910-015-0554-0 [DOI] [PubMed] [Google Scholar]
- van der Merwe A (2009). A theoretical framework for the characterization of pathological speech sensorimotor control. In McNeil MR (Ed.), Clinical management of sensorimotor speech disorders (2nd ed., pp. 3–18). New York, NY: Thieme Medical Publishers. [Google Scholar]
- Vargha-Khadem F, Watkins KE, Price CJ, Ashburner J, Alcock KJ, Connelly A, … Passingham RE (1998). Neural basis of an inherited speech and language disorders. Proceedings of the National Academy of Sciences of the United States of America, 95, 12695–12700. [DOI] [PMC free article] [PubMed] [Google Scholar]
- Vernes SC, Oliver PL, Spiteri E, Lockstone HE, Puliyadi R, Taylor JM, & Fisher SE (2011). Foxp2 regulates gene networks implicated in neurite outgrowth in the developing brain. PLoS Genetics, 7, e1002145. doi: 10.1371/journal.pgen.1002138 [DOI] [PMC free article] [PubMed] [Google Scholar]
- Vick JC, Campbell TC, Shriberg LD, Green JR, Truemper K, Rusiewicz HL,& Moore CA (2014). Data-driven subclassification of speech sound disorders in preschool children. Journal of Speech, Language, and Hearing Research, 57, 2033–2050. doi: 10.1044/2014_JSLHR-S-12-0193 [DOI] [PMC free article] [PubMed] [Google Scholar]
- Visscher C, Houwen S, Scherder EJA, Moolenaar B, & Hartman E (2007). Motor profile of children with developmental speech and language disorders. Pediatrics, 120, e158–e163. doi: 10.1542/peds.2007-2361 [DOI] [PubMed] [Google Scholar]
- Waring R, & Knight R (2013). How should children with speech sound disorders be classified? A review and critical evaluation of current classification. International Journal of Language & Communication Disorders, 48, 25–40. doi: 10.1111/j.1460-6984.2012.00195.x [DOI] [PubMed] [Google Scholar]
- Weismer G (2006). Philosophy of research in motor speech disorders. Clinical Linguistics & Phonetics, 20, 315–349. doi: 10.1080/02699200400024806 [DOI] [PubMed] [Google Scholar]
- Wilson EM, Abbeduto L, Camarata SM, & Shriberg LD (2019a). Estimates of the prevalence of speech and motor speech disorders in adolescents with Down syndrome. Clinical Linguistics & Phonetics doi: 10.1080/02699206.2019.1595735 [DOI] [PMC free article] [PubMed] [Google Scholar]
- Wilson EM, Abbeduto L, Camarata SM, & Shriberg LD (2019b). Speech and motor speech disorders and intelligibility in adolescents with Down syndrome. Clinical Linguistics & Phonetics doi: 10.1080/02699206.2019.1595736 [DOI] [PMC free article] [PubMed] [Google Scholar]
- Worthey EA, Raca G, Laffin JJ, Wilk BM, Harris JM, Jakielski KJ, … Shriberg LD (2013). Whole exome sequencing supports genetic heterogeneity in Childhood Apraxia of Speech. Journal of Neurodevelopmental Disorders, 5, 29. doi: 10.1186/1866-1955-5-29 [DOI] [PMC free article] [PubMed] [Google Scholar]
- Wren Y, Miller LL, Peters TJ, Emond A, & Roulstone S (2016). Prevalence and predictors of persistent speech sound disorder at eight years old: Findings from a population cohort study. Journal of Speech, Language, and Hearing Research, 59, 647–673. doi: 10.1044/2015_JSLHR-S-14-0282 [DOI] [PMC free article] [PubMed] [Google Scholar]
- Yoder PJ, Camarata S, & Woynaroski T (2016). Treating speech comprehensibility in students with Down syndrome. Journal of Speech, Language, & Hearing Research, 59, 446–459. doi: 10.1044/2015_JSLHR-S-15-0148 [DOI] [PMC free article] [PubMed] [Google Scholar]
- Ziegler W, & Ackermann H (2013). Neuromotor speech impairment: It’s all in the talking. Folia Phoniatrica Et Logopaedica, 65, 55–67. doi: 10.1159/000353855 [DOI] [PubMed] [Google Scholar]
- Ziegler W, Aichert I, & Staiger A (2012). Apraxia of speech: Concepts and controversies. Journal of Speech, Language, & Hearing Research, 55, S1485–S1501. doi: 10.1044/1092-4388(2012/12-0128) [DOI] [PubMed] [Google Scholar]
- Zwicker JG, Missiuna C, & Boyd LA (2009). Neural correlates of developmental coordination disorder: A review of hypotheses. Journal of Child Neurology, 24, 1273–1281. doi: 10.1177/0883073809333537 [DOI] [PubMed] [Google Scholar]
Associated Data
This section collects any data citations, data availability statements, or supplementary materials included in this article.