. 2019 Jun 24;8:e43191. doi: 10.7554/eLife.43191

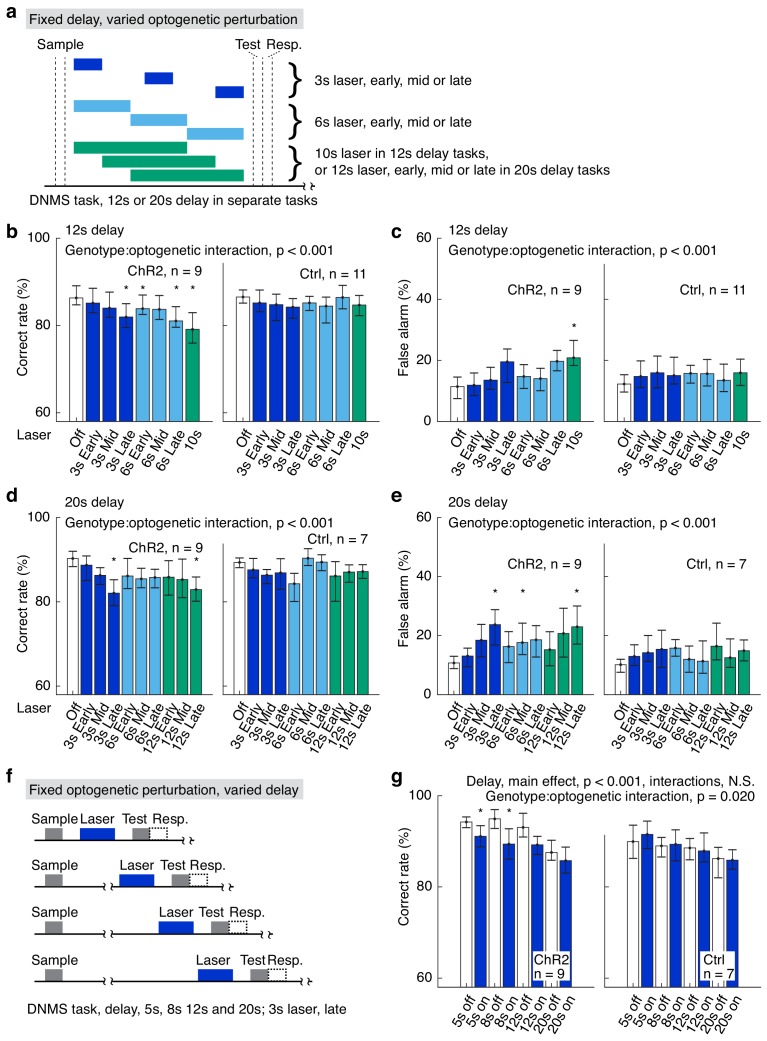
Figure 2. Varied delay and optogenetic suppression effects.

(a) Designs of the fixed delay, varied optogenetic suppression task. (b, c) Correct rates (b) and false alarm rates (c) in the fixed delay, varied optogenetic suppression task with 12 s delay. (d, e) As in (b) and (c), but for tasks with 20 s delay duration. (f) Design of the fixed optogenetic suppression, varied delay task. (g) Correct rates in the fixed optogenetic suppression, varied delay task; interactions for delay include delay:genotype, delay:laser-on/off, and delay:genotype:laser-on/off, all of which are statistically not significant (N.S.). Statistics at the top of each panel were generated by mixed-between-within-ANOVA. *, p<0.05 in a post-hoc paired permutation test of 10,000 repeats comparing to laser-off control, adjusted for multiple comparison with the Bonferroni method. For complete statistics, see Figure 2—source data 1,3. For more details of the optogenetic task performance and effect size, see Figure 2—figure supplements 12.

Figure 2—source data 1. Fixed delay, varied optogenetic suppression.
DOI: 10.7554/eLife.43191.016
Figure 2—source data 2. Fixed optogenetic suppression, varied delay duration.
DOI: 10.7554/eLife.43191.017
Figure 2—source data 3. Effect size and ANOVA statistics for optogenetics.
DOI: 10.7554/eLife.43191.018

Figure 2.

Figure 2—figure supplement 1. Varied delay and optogenetic suppression effects.

Figure 2—figure supplement 1.

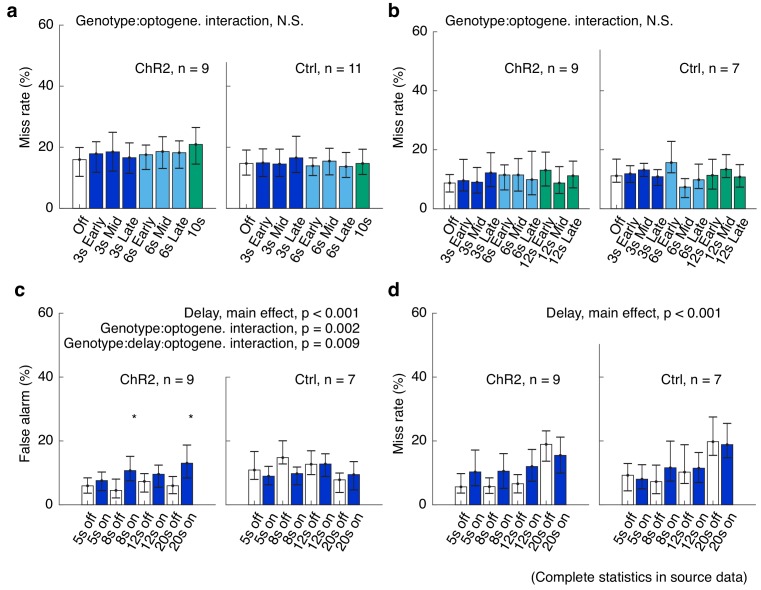
(a, b) Miss rates in the fixed delay, varied optogenetic suppression task with 12 s delay (a) and 20 s delay duration (b). (c, d) False alarm rate (c) and miss rate (d) in the fixed optogenetic suppression, varied delay task. Statistics at the top of each panel were generated by mixed-between-within-ANOVA. *, p<0.05 in a post-hoc paired permutation test of 10,000 repeats comparing to laser-off control, adjusted for multiple comparison with the Bonferroni method. For complete statistics, see Figure 2—source data 1,3.
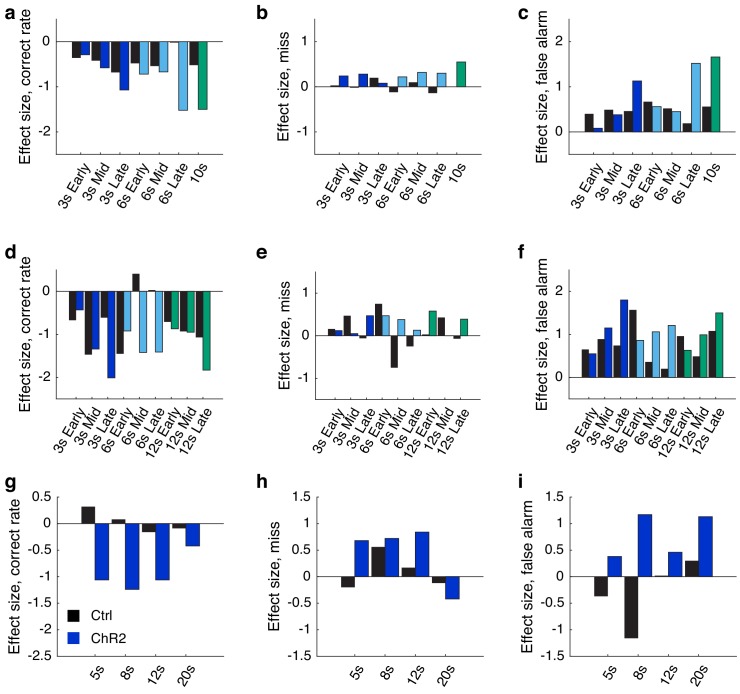
Figure 2—figure supplement 2. Optogenetic suppression effect size.

Figure 2—figure supplement 2.

(a–c) Optogenetic effect size, as measured by Cohen’s d, for the correct rate (a), miss rate (b), false alarm rate (c), for the fixed 12s-delay varied optogenetic stimulation task. (d–f) As (a–c), but for the fixed 20s-delay varied optogenetic stimulation task. (g–i) As a–c), but for the fixed 3 s late delay optogenetic stimulation varied delay task.