Abstract
Neural stem and progenitor cells (NSPCs) are an extremely important group of cells that form the central nervous system during development and have the potential to repair damage in conditions such as stroke impairment, spinal cord injury and Parkinson’s disease degradation. Current schemes for separation of NSPCs are inadequate due to the complexity and diversity of cells in the population and lack sufficient markers to distinguish diverse cell types. This study presents an unbiased high-resolution separation and characterization of NSPC subpopulations using direct current insulator-based dielectrophoresis (DC-iDEP). The properties of the cells were identified by the ratio of electrokinetic (EK) to dielectrophoretic (DEP) mobilities. The ratio factor of NSPCs showed more heterogeneity variance (SD = 3.4 – 3.9) than the controlled more homogeneous human embryonic kidney cells (SD = 1.1), supporting the presence of distinct subpopulations of cells in NSPC cultures. This measure reflected NSPC fate potential since the ratio factor distribution of more neurogenic populations of NSPCs was distinct from the distribution of astrogenic NSPC populations (confidence level >99.9%). The abundance of NSPCs captured with different ranges of ratio of EK to DEP mobilities also exhibit final fate trends consistent with established final fates of the chosen samples. DC-iDEP is a novel, label-free and non-destructive method for differentiating and characterizing, and potentially separating, neural stem cell subpopulations that differ in fate.
Graphical Abstract
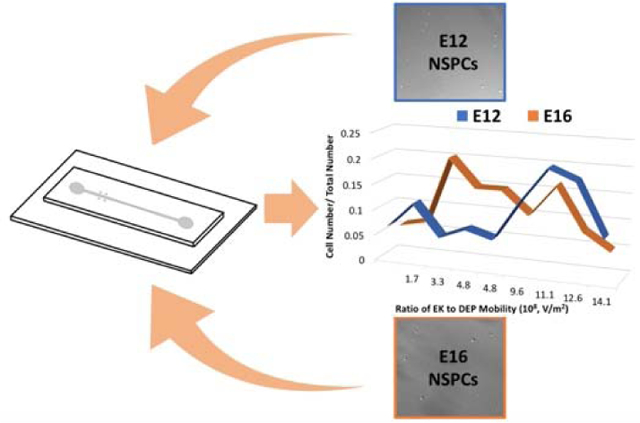
This study presents an unbiased high-resolution separation and characterization of NSPC subpopulations using direct current insulator-based dielectrophoresis.
Introduction
The cell is the most fundamental functional element for living organisms. Natural sources of cells, as opposed to cell lines, are heterogeneous mixtures. Often only a subset of cells in this mixture are useful for any given research purpose or therapeutic application. In other cases, all the sub-populations in the mixture need to be individually fully identified and characterized. In any case, there are numerous circumstances where high-resolution isolation and concentration of similar cell types is needed. Stem cells are a good example, as they are heterogenous populations that have potential for use in clinical therapies and basic science. Unfortunately, it currently is not clear how each cell type in stem cell populations contribute to repair or to normal function. Understanding the functional capability of the different cell types in stem cell populations is a necessary first step towards improving the use of these cells in transplantation.1–4 New capabilities in high-resolution cell separations provided by direct current insulator based dielectrophoresis (DC-iDEP) provides a novel method to characterize cells according to their native biophysical properties, which can be related to their cell identity and function, and ultimately their final fate.
A main driving force for scientists and physicians who study stem cells is their desire to understand and exploit the potential of the cells to regenerate and renew damaged tissues. Neural stem and progenitor cells (NSPCs) give rise to the central nervous system (brain and spinal cord). They are capable of self-renewing and differentiating into neurons, astrocytes and oligodendrocytes. The intermediate immature cells generated during differentiation are progenitor cells. These cells may be used as the basis of treatments for CNS injuries such as stroke damage, traumatic brain and spinal cord injury, and degenerative brain conditions (including Alzheimer’s disease and Parkinson’s disease).5–8 However, a major unsolved problem in the stem cell field is low reproducibility of transplants due to the heterogeneity of NSPC cultures expanded for transplant. Cellular heterogeneity in NSPC cultures is currently not well described qualitatively, much less quantitatively. This was recently highlighted by the inability of scaled-up cultures of NSPCs used for clinical trials to match the effectiveness of research-grade NSPC cultures in animal models of spinal cord injury and Alzheimer’s disease.9–11
Cultures of NSPCs contain undifferentiated stem cells as well as progenitors tied to differentiated cell fates. The ratios of progenitors in NSPC cultures can vary across different NSPC batches, be affected by external cues such as culture conditions, and change over time in culture.1, 12–15 Differing ratios of progenitors generate heterogeneity in the types of differentiated cells that form after transplantation. Further, differing ratios of undifferentiated stem cells, progenitors and differentiated cells produce variation in secretion of growth factors, exosomes, cytokines, etc., affecting survival and function of both host and transplanted cells.16,17 All these factors will contribute to variability in cell survival, migration, and differentiation after transplantation into pre-clinical or therapeutic models, making it imperative to address heterogeneity of NSPC transplants. To achieve an effective and stable long-term therapy using NSPCs by transplantation, predicting the final fates of progenitor cells are of great importance. Other benefits of full accounting of stem cell populations are that sorted cells could also be used to reduce the risks of introducing tumor cells into transplanted patients and the identification and isolation of the NSPCs with distinguished final cell types could increase the efficiency of basic research studies.18
Dielectrophoresis has proven to be a valuable tool to assess heterogeneity of cells without the need for cell-type specific labels. Analysis of cells with AC-based dielectrophoresis (AC-DEP) systems can depict the heterogeneity of stem cell populations.1 Neuron-biased and astrocyte-biased populations can be enriched in AC-DEP by adjusting the applied frequency.19, 20 These studies showed that distinct progenitors could be defined and isolated by electrophysiological properties that serve as a metric of their fate potential. While AC-DEP can be used to enrich distinct cell types from NSPCs, we hypothesize that higher resolution separations are possible using a different type of DEP that allows several cell types to be characterized simultaneously.
Direct current insulator-based dielectrophoresis (DC-iDEP) is capable of introducing large field gradients using a low voltage and separating several cell types with high-resolution. The technique juxtaposes electrophoretic and dielectrophoretic forces induced on individual cells such that very subtle physical differences can be discerned. This juxtaposition is the reason such high-resolution separation can be achieved and is based on gradient steady state separation techniques. Electrophoretic forces generally reflect surface charge of the cell and dielectrophoretic forces probe both internal and surface features. The DC-iDEP devices are easy to fabricate and robust. The technique has been applied to a wide variety of cells and bioparticles including blood cells, bacteria, viruses, and nanoparticles.21–23 As an extreme example of very high-resolution cell separation, Jones et al. separated gentamicin resistant and susceptible strains of Staphylococcus epidermidis using DC-iDEP.23
We present a high-resolution analysis of NSPCs populations in a DC-iDEP device. A cell population used as control, human embryonic kidney (HEK) 293 cells, showed relatively homogeneous dielectrophoretic properties. Three populations of NSPCs that differed in fate potential were tested that were chosen because there should be subtle but identifiable differences in the sub-populations. The three populations were 1) neuron-biased NSPCs from early in cerebral cortical development, 2) the same population of NSPCs treated with N-acetylglucosamine (GlcNAc) to induce an astrocyte-biased population,24 and 3) astrocyte-biased NSPCs from a later stage in cerebral cortical development.
Theory
The dielectrophoresis technique used here captures particles in a microfluidic channel based on electrokinetic and dielectrophoretic forces and provides a deterministic biophysical characterization of those particles.25–27 The electrokinetic force is a combination of electrophoretic force and electroosmotic flow effect. The electrophoretic force can be expressed as:
| (1) |
where εm is dielectric constant of the solution, is electric field intensity, is electrokinetic (zeta) potential of the particle, r is the radius of the particle. The electroosmotic flow effect is the motion of the liquid in a microfluidic channel caused by Debye layer. This effect is related with the viscosity, the permittivity, of the electrokinetic potential of the medium.
Dielectrophoretic force is caused by the interaction between a non-uniform electric field and a dielectric particle:
| (2) |
where r is the radius of the particle, εm is the permittivity of the suspending solution, ∇ | | is the gradient of the electric field and fCM is the Clausius-Mossotti factor. These two forces exerted on a single cell were used to determine the properties of the particles by trapping them at different positions in a DEP device.
The particles are captured when velocity along the field line is zero such that EK velocity is equal to DEP velocity. The capture condition is described as following 26,28:
| (3) |
| (4) |
where is particle flow. μEK and μDEP are the EK and DEP mobilities. Theoretical estimate and previous study suggest extremely high-resolution separation using DC-iDEP.23,27 The ratio of the electrokinetic mobility over the dielectrophoretic mobility (, electrokinetic mobility ratio, EKMr) can be used to quantify subtle differences of particles.
Experimental
Cell culture and sample preparation
HEK 293 (ATCC CRL-1573, passage 60) cells were cultured and passaged in Dulbecco’s Modified Eagle Medium (DMEM) with 10% fetal bovine serum (FBS). Trypsin-EDTA (0.25% (w/v) was used to lift the cells off the culture plate, following which they were centrifuged at 253 g for 5 min and washed with DEP buffer solution (8.5% (w/v) sucrose (Mallinckrodt Baker, Inc., Paris, Kentucky, USA), 0.3% (w/v) dextrose (HiMedia Laboratories, Pvt. Ltd., Dindori, Nashik, India), 0.75% (v/v) Roswell Park Memorial Institute 1640 medium (HyClone, Logan, Utah, USA)), then centrifuged and washed again. The concentration was adjusted to about 105 cells/mL prior to use. All reagents were obtained from Life Technologies, Grand Island, NY, USA unless otherwise specified.
NSPCs were dissected from cerebral cortical regions of wild-type CD1 mice on embryonic days 12 and 16 (E12 and E16). The culture media for E12, E12 GlcNAc treated and E16 cells was DMEM, B27, N2, 1 mM sodium pyruvate, 2 mM L-glutamine, 1 mM N-acetylcysteine, 10 ng/mL FGF, 20 ng/mL EGF, and 2 μg/mL heparin, as described in previous works.2 E12 cells were treated with 80 mM GlcNAc (Sigma-Aldrich, St. Louis, MO, USA) for 3 days to obtain E12 GlcNAc treated cells. The cells were incubated at 37° C in 5% CO2. NSPCs were cultured as neurospheres then dissociated once spheres reached approximately 150 μm in diameter. NeuroCult Chemical Dissociation Kit (Stem cell Technologies, Vancouver, BC, Canada) was used to dissociate neurospheres into single cells. Dispersed cells were centrifuged at 253 g for 5 min and washed with DEP buffer solution, then centrifuged and washed again. The concentration was adjusted to about 105 cells/mL prior to use.
Microdevices design, simulation and fabrication
A standard DC-iDEP device was used for measurement of NSPCs properties (Figure 1).21 The length of the channel was 4.2 cm from the inlet to the outlet with a depth of approximately 20 μm. The channel was designed with successively smaller sawtooth triangles. Every 3 pairs of 27 triangles have the identical geometrical structures. The distance between two paired triangle tips (gates) decreases from 73 μm to 25 μm. The electric field ( ) and the electric field gradient values increase as the gate pitches decrease from the inlet to the outlet, which provided increasing capture thresholds for cells with different EKMr.
Fig. 1.
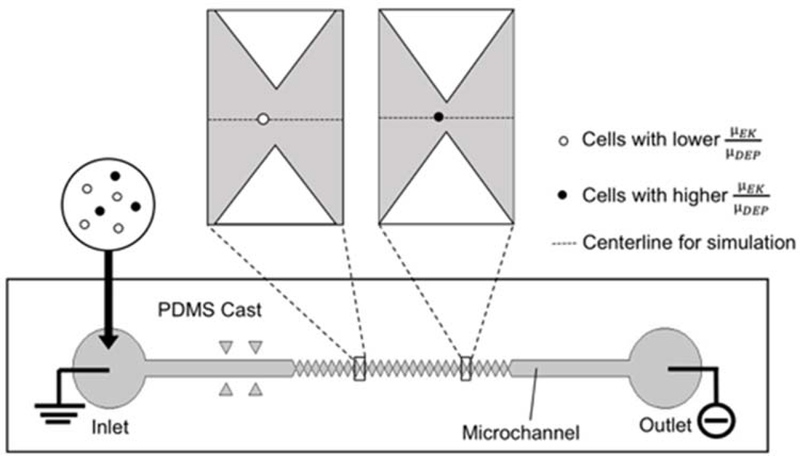
Schematic of DC-iDEP device and capture behavior of NSPCs. The channel (grey) was constricted by an increasing size of paired triangular (gate) insulator material (white), creating decreasing pitch width ranging from 73 μm to 25 μm. Cell samples were introduced from the inlet and a direct current potential was applied between the inlet and outlet of the channel. Cells with lower EKMr (white circle) are captured with larger width gates and cells with higher EKMr (black circle) are captured with smaller gates. Dotted lines in the upper illustration represent centerline for computational simulations.
All the simulations of the device were calculated with finite element multiphysics software (COMSOL, Inc., Burlington, MA). Simulations were focused on the longitudinal centerline (horizonal in Figure 1) values.
Standard soft lithographic techniques were used to fabricate DC-iDEP devices according to previous reports.21 Briefly, the Si wafer was coated with AZ P4620 positive photor- esist (AZ Electronic Materials, Branchburg, NJ) and contrast enhancement material 388SS (Shin-Etsu MicroSi, Inc., Phoenix, AZ) was used. The design of the channel photomask was created by AutoCAD (Autodesk, Inc., San Rafael, CA). The photoresist was exposed through contact photolithography with the use of the photomask. The completed silicon wafer made by dry etching technique was used as a channel template. PDMS (Sylgard 184, Dow/Corning, Midland, MI) was poured on the template wafer, which was then incubated in the oven for 1 hour at 80° C. Punched holes with a diameter of 2.5 mm at the inlet and outlet were created to introduce solutions and electrodes. The PDMS membrane was sonicated in isopropanol and water for three min each and dried by air prior to use. The PDMS surface on the side with the channel was oxidized using a handheld corona discharge emitter (Electro-Technic Products, Inc., Chicago, IL) with a voltage of 50 kV, then adhered to a glass slide.
Experimental procedure
The device was flushed with 5% (w/v) BSA (bovine serum album) in PBS (10 mM phosphate-buffered saline) (pH 7.6) solution and then DEP buffer solution before introducing cell samples. Dielectrophoresis tests were monitored with an Olympus IX70 inverted microscope with a ×4 or ×10 objective. Images and videos were recorded by QICAM cooled CCD camera (QImaging, Inc., Surrey, BC) and Streampix III image capture software (Norpix, Inc., Montreal, QC). A voltage of 70 V was applied to platinum electrodes (0.404-mm external diameter, 99.9% purity, Alfa Aesar, Ward Hill, MA) connected to the inlet (+) and outlet (ground) to capture HEK cells. 90 V global voltage were used for the capture of NSPCs.
Results and discussion
Determination of biophysical properties using DC-iDEP
High-resolution unbiased determinations of sub-populations from complex cell mixtures has not been attempted, even though several needs have been identified for highly refined stratification of these cells. The relatively new technique of DC-iDEP promises extremely high-resolution separations based on small differences in the native, unlabeled biophysical properties of cells. The high-resolution capability is the result of applying the principles of gradient steady state separations exploiting large fields and gradients induced on the microdevice. The deterministic biophysical property of the cells which is measured by DC-iDEP is EKMr and is defined by the location of capture for a specific device design and applied voltage.27,29,30 The decreasing gate pitches of the device create larger (=ec) values at successive gates and provide unique conditions for the c apture of cells.23 According to classic theory, the EKMr reflects the conductivity, the radius and the zeta potential of the particles (among other physical factors).29,31
The value of ec is determined by numerical models describing the electric field within the device and these values were used to quantify the EKMr. Specifically, the value of ec was simulated along the centerline of the DC-iDEP channel (Figures 1 and 2). The increasingly large positive-negative deviation pairs of ec value occur near the gates along the channel, with the positive values immediately before the gate and negative values immediately after the gate. The positive and negative values are influenced by vector (see reference 26). The single cells were all captured before the gates and was recorded as positive values. The ec peak values (the value of the positive peaks) increased with decreased pitch width from the inlet toward the outlet (Figure 2B). With the applied voltage of the simulation at 90 V, the ec peak values ranged from 1.66×10⁸ to 1.41×10⁹ V/m2. Each cell will pass a ‘last gate’ prior to being captured. This allows of the values of the ec to be bracketed between the two values. According to the capture condition mentioned in theory section:
| (5) |
as the cell properties define the capture location established by the electric field structure, cells with an EKMr value higher than ec value of the last gate it passes through and is smaller or equal to the ec value of the gate of capture. The width of each capture zone is defined by the value of ec at the two closest gates. For the device used in these studies, at 90 V (for NSPC studies) applied global voltage, bin widths are ~1.5 × 10⁸ V/m2 and are spaced somewhat evenly across the range. The values generated from the cells were binned together and histograms created.
Fig. 2.
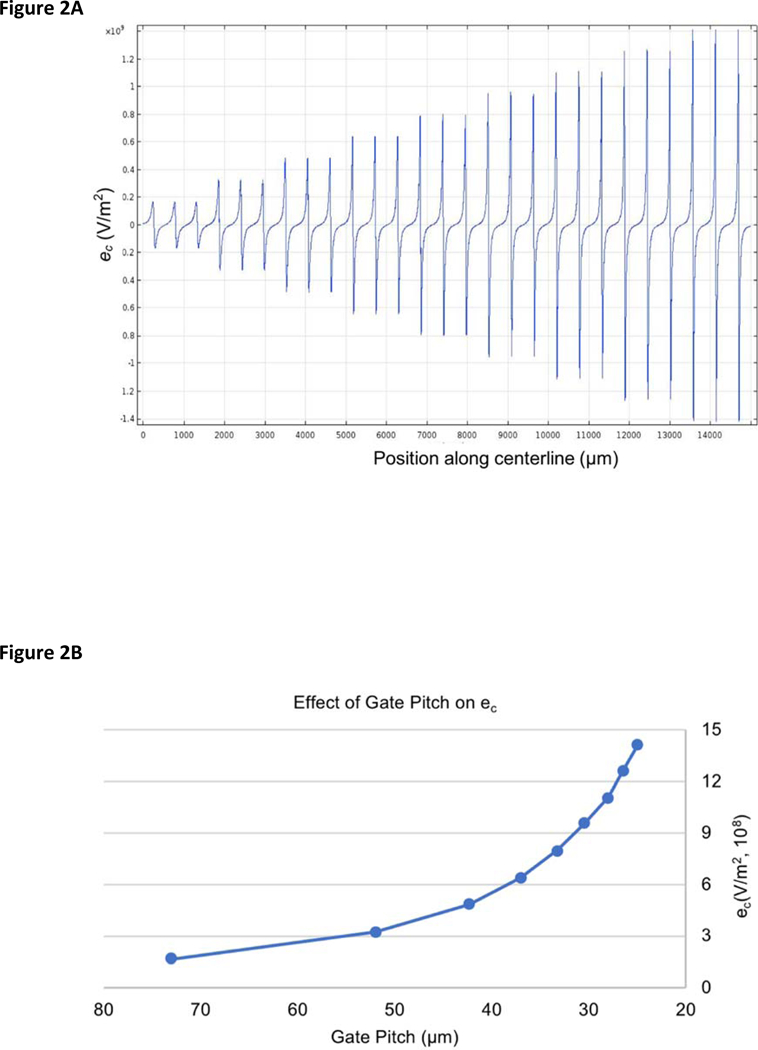
Calculated (ec) values in the DC-iDEP device. (A) ec intensity along centerline (see Figure 1) in the microchannel. Position along centerline started from the beginning of the sawtooth design to the end of the last (narrowest) gate. Peak-valley pairs correspond to ec value distributions about each gate. The ec value was positive on the left side of the gate tip and negative on the right side of the gate tip. (B) Effect of gate pitch on ec. Values increase as gate pitch size decreases from the inlet to the outlet in the microchannel. The voltage is modeled at 90 V applied global voltage.
Dielectrophoretic capture of HEK 293 cells
The system was calibrated using the biophysical behavior of a well-established cell population, the human embryonic kidney cell line HEK 293.32 Previous separations based on frequency-based trapping efficiency using this cell line indicate that it is more homogeneous than primary cultures of neurons and NSPCs.1 The biophysical behavior of HEK 293 cells were examined and single HEK cells reacted to the system in a fashion consistent with previous work, demonstrating stable, reproducible and interpretable results (n = 33). They were captured in the microchannel with values from 1.3 × 10⁸ to 6.2 × 10⁸ V/m2 (Figure 3) with a distribution centered around the average value. The weighed mean (± standard deviation, SD) of the cell ratio mobilities is 4.2 ± 1.1 × 10⁸ V/m2.
Fig. 3.
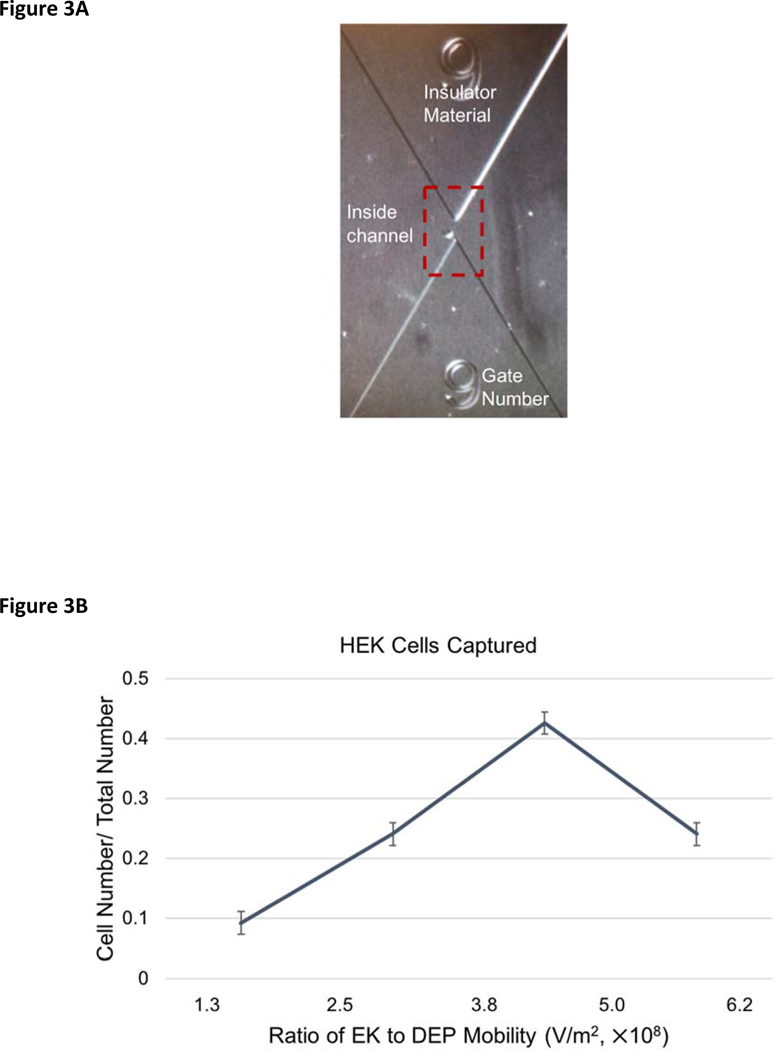
DC-iDEP behavior of HEK 293 cells. (A) Image of an HEK cell captured at gate 9. (B) HEK cell abundance within each EKMr bin. HEK cells were captured with an EKMr range of 1.3 × 10⁸ – 6.2 × 10⁸ V/m2 with an average of 4.2 × 10⁸ V/m2. The voltage applied was 70 V. All error bars represent SEM.
High-resolution separation of complex mixtures of NSPCs
Three unique sets of NSPCs were introduced to the DC-DEP microchannel individually for EKMr identification. NSPCs isolated from earlier (E12) and later (E16) embryonic stages of cerebral cortex development have different fate biases. E12 NSPCs are more neurogenic and form more neurons than the more astrogenic E16 NSPCs.14 High-resolution determinations have been carried out on these complex cell populations (Figure 4A), generating a distributed pattern of values ranging from 1.3 × 10⁸ to 1.3 × 10⁹ V/m2 that appeared to be unique to each population. Recent studies showed that the treatment of E12 NSPCs with GlcNAc influences the fate potential of E12 cells by the formation of branched N-glycans.24 The treatment gives rise to the generation of more astrocytes at the cost of neurons upon differentiation. In order to control for the fact that E12 and E16 cells are from different developmental stages, E12 control and E12 GlcNAc treated cells were assessed (Figure 4B). These cells from same developmental stage but differ in fate bias because GlcNAc treatment increases cell surface highly branched N-glycans and promotes astrocyte fate.
Fig. 4.
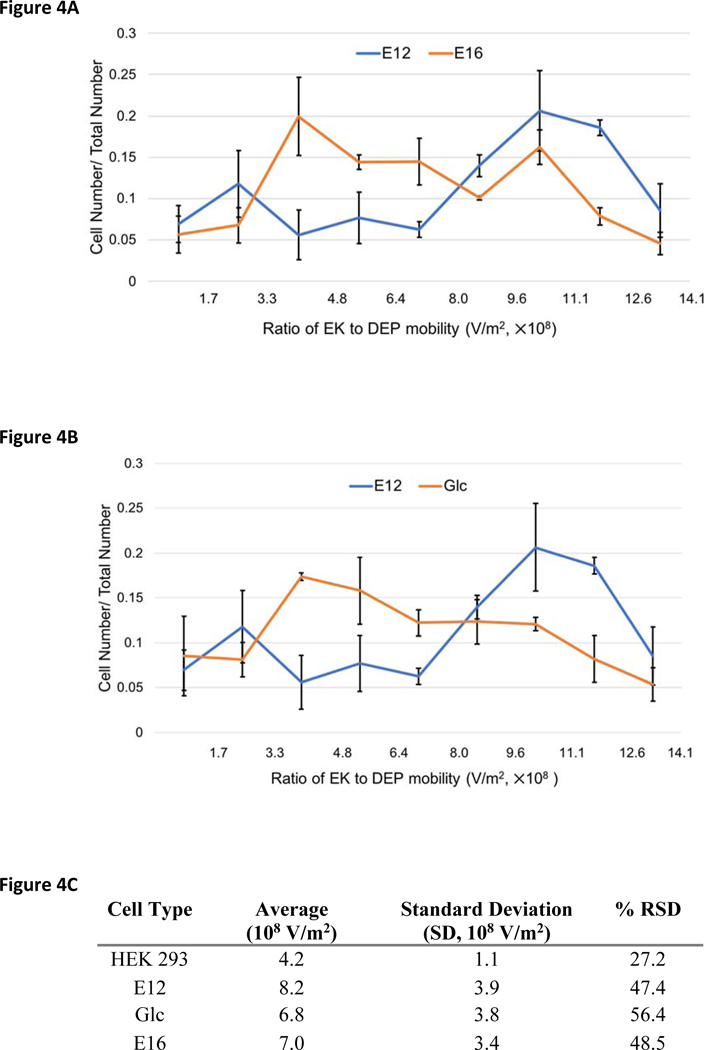
DC-DEP behavior of E12, GlcNAc treated E12, and E16 NSPCs. (A) EKMr distribution comparison between E12 and E16 NSPCs detected by DC-DEP. (B) EKMr distribution comparison between E12 and GlcNAc treated E12 NSPCs. (C) Statistical analysis of EKMr distribution of HEK 293 cells, E12, GlcNAc treated E12, E16 NSPCs. All error bars represent SEM. %RSD represents percent relative standard deviation.
Compared with measurements of the HEK 293 cell line, all three NSPC populations demonstrated higher EKMr and exhibited significantly greater heterogeneity. Higher EKMr value indicates that either μEK increased or μDEP decreased. Increased electrokinetic effects are caused by an increase in surface charge density (changing the zeta potential), a decreased surface viscosity (also described as ‘surface softness’, see references 31, 33) and, much more subtly, a change in the overall multipole moment of the cell. A decrease in dielectrophoretic effects is caused by (according to classic theory) an increase in particle conductivity for the negative dielectrophoresis force present here. The change in conductivity is caused by a change in zeta potential, an altered conductivity of any of the cell membranes or a change in the overall multipole moment of the cell.31 The percent relative standard deviation (%RSD) increased from 27% (1.1 V/m2 SD) for the HEK 293 measurements to values of 47% (3.9 V/m2 SD), 56% (3.8 V/m2 SD), and 48% (3.4 V/m2 SD) for the NSPCs. These values indicated a 3.1- to 3.5-fold increase compared to the control population. These results are consistent with the existence of heterogenous subpopulations in NSPCs, supporting previous studies revealing NSPCs contain multipotent stem cells and more committed progenitor cells.20
Visual inspection of the various cell population histograms of EKMr suggests the pattern for the three NSPC values are, to varying degrees, different. To help understand precisely how different the cell populations varied from each other, the two-sample Cramer-Von Mises criterion were applied to compare the distributions between paired NSPC samples.34 The variance of the NSPC distributions were statistically analyzed. Briefly,
and are the empirical distribution functions of the samples to be compared. and are the observed values in each sample.
The E12 and GlcNAc treated E12 samples are shown to be very different by this assessment. The T value between E12 and GlcNAc treated E12 is 1.53 – thus there is 99.98% chance that these two samples come from the same distribution can be rejected. This rather unnatural phrase is result of the construct of the statistical approach based on the null hypothesis which presumes no significant difference exists between populations. In more natural, but less exacting terms, this approximately means that there is nearly an 100% chance that these populations differ. The other comparison was between the E12 and E16 populations. They are also significantly different to the 99.92% confidence level based on T value of 1.21, and similarly they are very likely different.
Significantly and in contrast, there is only 23.0% confidence level (T= 0.067) that the distributions of GlcNAc treated E12 and E16 cells, which are both rich in astrogenic progenitor cells, differ. In other words, from a statistical point of view these two populations are the same. This analytical assessment of the patterns generated by high-resolution biophysical cell determinations is consistent with known properties of these various cell populations. Significant differences were observed in populations known to differ and similar populations gave results suggesting a high probability of sameness. The three populations were not separated from each other, but were distinguishable by the resulting histograms.
Identifying the fate potential of cells with specific EKMr values would be ideal. However, limitations in cell transport and single cell bioanalytical methods prevent this approach. Fortunately, there exists a good deal of knowledge about the distribution of the ultimate fate of these cell populations and these data can be compared to the biophysical data generated here. One of the reasons that these cell populations where chosen was for this very reason, E12, E12 GlcNAc-treated and E16 NSPCs are all relatively well characterized.14,24 E12 and E16 are ideal populations to study neurogenic progenitors and astrogenic progenitors because of the existence of few oligodendrocyte progenitors in these stages in the cerebral cortex. Oligodendrocytes are primarily generated in the ganglionic eminence and migrate to the cortex at later embryonic stages, E18.24
The patterns for the various NSPCs appeared to vary more so before or after 8.0 × 10⁸ V/m2. Noting this observation, we defined for both the paired populations (Figures 4A and 4B) EKMr values greater than 8.0 × 10⁸ V/m2 as the higher band and less than 8.0 × 10⁸ V/m2 as the lower band. Compared to E12 cells, a larger number of cells captured in both GlcNAc treated E12 and E16 populations were in the higher EKMr band.
We compared the percentages of neurons or astrocytes formed upon differentiation determined in previous studies with the abundance of the cells in the higher or lower EKMr bands in each set of NSPCs (Figure 5).14,24 A larger percentage of GlcNAc treated E12 or E16 cells with lower EKMr were captured than E12 cells. This is demonstrating the same trend of increasing astrocytes upon differentiation for E12 after treatment or with further embryonic development. The percentage of the cells captured with higher EKMr in GlcNAc treated E12 and E16 were smaller than E12 cells, which is consistent with the percentage reduction of neurogenic progenitors in these two populations. The different differentiated percentages of E12 for each comparison is due to small changes in the differentiation protocol across the different sets of experiments. Each comparison needs to be matched to be compared (especially for E12 and GlcNAc treated E12). The abundance of cells captured at high or low EKMr are reflective of the neurogenic or astrogenic fate potential of NSPCs.
Fig. 5.
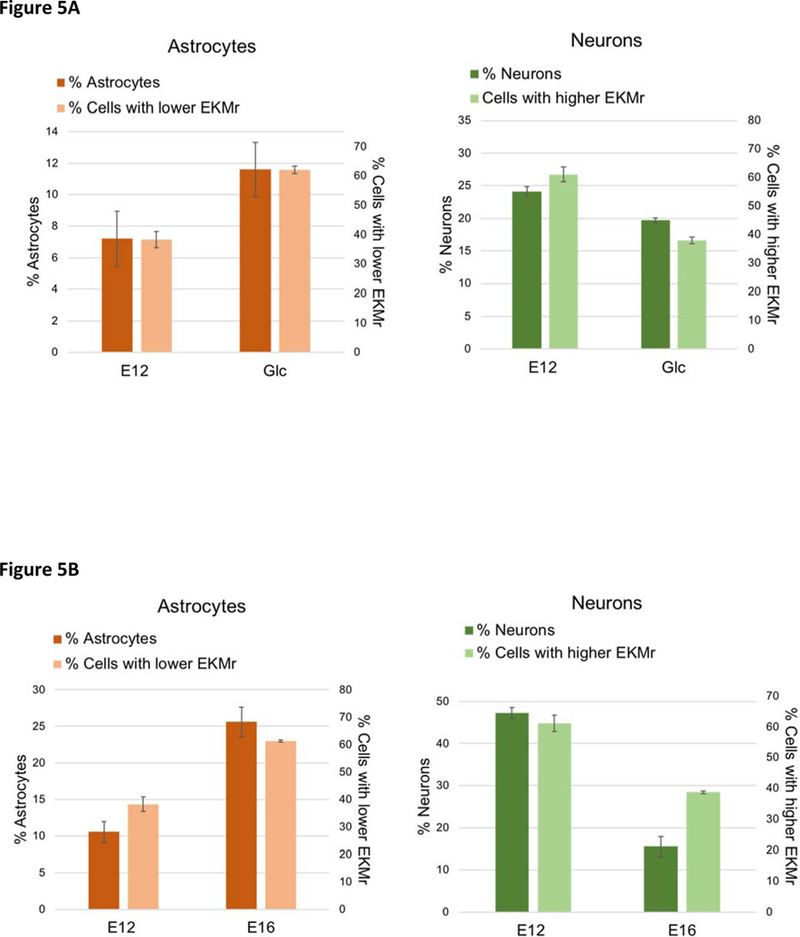
EKMr values correlate with neurogenic or astrogenic potential. (A) The abundance of the cells captured with lower EKMr (less than 8.0 108 V/m2) and higher EKMr (higher than 8.0 108 V/m2) are correlated with the percentages of differentiated astrocytes and neurons in E12 and GlcNAc treated E12 cells.24 The neurons are assessed via MAP2+/TuJ1+ cells; astrocytes assessed after 3 days of differentiation. (B) The abundances of the cells captured with EKMr (less than 8.0 108 V/m2) and higher EKMr (higher than 8.0 108 V/m2) are correlated with the percentages of differentiated astrocytes and neurons in E12 and E16 cells.14 Neurons assessed via MAP2+ cells; astrocytes counted after 5 days of differentiation.
Unbiased high-resolution separation and characterization have been demonstrated for complex NSPC populations. Compared with the control cell population (HEK 293 cells), the NSPC populations all showed greater EKMr heterogeneity. It is currently impossible to assign biological significance to each given binned value represented within the histograms. However, all currently available assessments support the hypothesis that cells differ significantly for various values of EKMr. Functionally reducing the resolution by grouping the EKMr values results in distributions consistent with known ultimate fate assessments for each sample type. As single cell characterizations improve and on-chip/off-chip cell transport is addressed the open question of the significance of the ability to separate these cells can be answered. That being said, these data support that these are complex mixtures and significant changes in the patterns of separation are consistent with known properties of those mixtures.
Conclusions
In summary, NSPCs were successfully distinguished and characterized in the DC-iDEP device. The presence of complex subpopulations of NSPCs with distinct final fates could be identified and differentiated by dielectrophoretic properties in the microdevice. The final fates of the populations are consistent with the distribution of EKMr of the cells detected. These results are promising toward clinical improvements for transplant safety and efficacy and the identified NSPCs are meaningful to the basic stem cell differentiation studies.
Acknowledegements
This work was supported by the National Institutes of Health grant 1R03AI111361–01.
Footnotes
Conflicts of interest
The authors have declared no conflict of interest.
Notes and references
- 1.Flanagan LA, Lu J, Wang L, Marchenko SA, Jeon NL, Lee AP and Monuki ES, Stem Cells, 2008, 26, 656–665. [DOI] [PubMed] [Google Scholar]
- 2.Kang Y, Li D, Kalams SA and Eid JE, Biomedical Microdevices, 2008, 10, 243–249. [DOI] [PubMed] [Google Scholar]
- 3.Stringari C, Nourse JL, Flanagan LA and Gratton E, PloS One, 2012, 7, e48014. [DOI] [PMC free article] [PubMed] [Google Scholar]
- 4.Vrtovec B, Poglajen G, Lezaic L, Sever M, Domanovic D, Cernelc P, Socan A, Schrepfer S, Torre-Aminone G, Haddad F and Wu JC, Circulation Research, 2013, 112, 165–173. [DOI] [PubMed] [Google Scholar]
- 5.Thomson JA, Itskovitz-Eldor J, Shapiro SS, Waknitz MA, Swiergiel JJ, Marshall VS and Jones JM, Science, 1998, 282, 1145–1147. [DOI] [PubMed] [Google Scholar]
- 6.Gage FH, Science, 2000, 287, 1433–1438. [DOI] [PubMed] [Google Scholar]
- 7.Temple S, Nature, 2001, 414, 112. [DOI] [PubMed] [Google Scholar]
- 8.Arulmoli J, Pathak MM, McDonnell LP, Nourse JL, Tombola F, Earthman JC and Flanagan LA, Scientific Reports, 2015, 5, 8499. [DOI] [PMC free article] [PubMed] [Google Scholar]
- 9.Anderson AJ, Piltti KM, Hooshmand MJ, Nishi RA and Cummings BJ, Stem Cell Reports, 2017, 8, 249–263. [DOI] [PMC free article] [PubMed] [Google Scholar]
- 10.Marsh SE, Yeung ST, Torres M, Lau L, Davis JL, Monuki ES, Poon WW and Blurton-Jones M, Stem Cell Reports, 2017, 8, 235–248. [DOI] [PMC free article] [PubMed] [Google Scholar]
- 11.Temple S, and Studer L, Stem Cell Reports, 2017, 8, 191–193. [DOI] [PMC free article] [PubMed] [Google Scholar]
- 12.Gage FH and Temple S, Neuron, 2013, 80, 588–601. [DOI] [PubMed] [Google Scholar]
- 13.Groszer M, Erickson R, Scripture-Adams DD, Dougherty JD, Belle JL, Zack JA, Geschwind DH, Liu X, Kornblum HI and Wu H, Proceedings of the National Academy of Sciences, 2006, 103, 111–116. [DOI] [PMC free article] [PubMed] [Google Scholar]
- 14.Labeed FH, Lu J, Mulhall HJ, Marchenko SA, Hoettges KF, Estrada LC, Lee AP, Hughes MP and Flanagan LA, PloS One, 2011, 6, e25458. [DOI] [PMC free article] [PubMed] [Google Scholar]
- 15.Qian X, Shen Q, Goderie SK, He W, Capela A, Davis AA and Temple S, Neuron, 2000, 28, 69–80. [DOI] [PubMed] [Google Scholar]
- 16.Blurton-Jones M, Kitazawa M, Martinez-Coria H, Castello NA, Müller F, Loring JF, Yamasaki TR, Poon WW, Green KN and LaFerla FM, Proceedings of the National Academy of Sciences, 2009, 106, 13594–13599. [DOI] [PMC free article] [PubMed] [Google Scholar]
- 17.Drago D, Cossetti C, Iraci N, Gaude E, Musco G, Bachi A and Pluchino S, Biochimie, 2013, 95, 2271–2285. [DOI] [PMC free article] [PubMed] [Google Scholar]
- 18.Simon MG, Li Y, Arulmoli J, McDonnell LP, Akil A, Nourse JL, Lee AP and Flanagan LA, Biomicrofluidics, 2014, 8, 064106. [DOI] [PMC free article] [PubMed] [Google Scholar]
- 19.Adams TNG, Jiang AYL, Vyas PD and Flanagan LA, Methods, 2018, 133, 91–103. [DOI] [PMC free article] [PubMed] [Google Scholar]
- 20.Nourse JL, Prieto JL, Dickson AR, Lu J, Pathak MM, Tombola F, Demetriou M, Lee AP and Lisa A Flanagan, Stem Cells, 2014, 32, 706–716. [DOI] [PMC free article] [PubMed] [Google Scholar]
- 21.Staton SJR, Chen KP, Taylor TJ, Pacheco JR and Hayes Mark A., Electrophoresis, 2010, 31, 3634–3641. [DOI] [PubMed] [Google Scholar]
- 22.Ding J, Lawrence RM, Jones PV, Hogue BG and Hayes MA, Analyst, 2016, 141, 1997–2008. [DOI] [PMC free article] [PubMed] [Google Scholar]
- 23.Jones PV, Huey S, Davis P, McLemore R, McLaren A and Hayes MA, Analyst, 2015, 140, 5152–5161. [DOI] [PMC free article] [PubMed] [Google Scholar]
- 24.Yale AR, Nourse JL, Lee KR, Ahmed SN, Arulmoli J, Jiang AYL, McDonnell LP, Botten GA, Lee AP, Monuki ES, Demetriou M and Flanagan LA, Stem Cell Reports, 2018, 11, 869–882. [DOI] [PMC free article] [PubMed] [Google Scholar]
- 25.Weiss NG, Jones PV, Mahanti P, Chen KP, Taylor TJ and Hayes MA, Electrophoresis, 2011, 32, 2292–2297. [DOI] [PMC free article] [PubMed] [Google Scholar]
- 26.Crowther CV and Hayes MA, Analyst, 2017, 142, 1608–1618. [DOI] [PMC free article] [PubMed] [Google Scholar]
- 27.Jones PV and Mark A Hayes, Electrophoresis, 2015, 36, 1098–1106. [DOI] [PMC free article] [PubMed] [Google Scholar]
- 28.LaLonde A, Gencoglu A, Romero-Creel MF, Koppula KS and Lapizco-Encinas BH, Journal of Chromatography A, 2014, 1344, 99–108. [DOI] [PubMed] [Google Scholar]
- 29.Jorgenson JW and Lukacs KD, Journal of Chromatography A, 1981, 218, 209–216. [Google Scholar]
- 30.Jones PV, Staton SJR and Hayes MA, Analytical and Bioanalytical Chemistry, 2011, 401, 2103. [DOI] [PubMed] [Google Scholar]
- 31.Hilton SH and Hayes MA, Analytical and Bioanalytical Chemistry, DOI: 10.1007/s00216-019-01659-8. [DOI] [PMC free article] [PubMed] [Google Scholar]
- 32.Shaw G, Morse S, Ararat M and Graham FL, The FASEB Journal, 2002, 16, 869–871. [DOI] [PubMed] [Google Scholar]
- 33.Daly E and Saunders BR, Physical Chemistry Chemical Physics, 2000, 2, 3187–3193. [Google Scholar]
- 34.Anderson TW, The Annals of Mathematical Statistics, 1962, 1148–1159. [Google Scholar]


