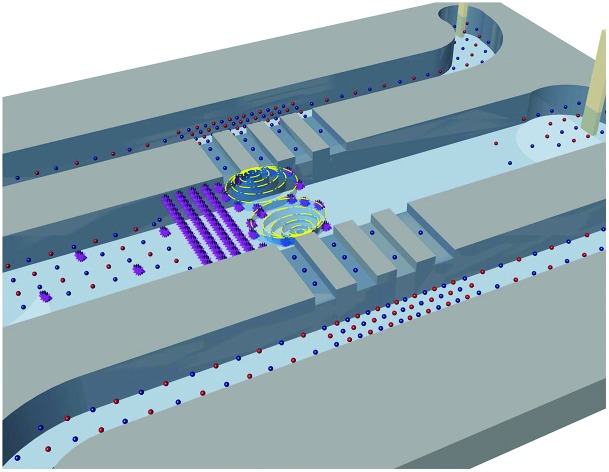
 Elucidating the mechanism of electrokinetic molecular concentration in terms of theoretical limits for the concentration factor and their scaling laws.
Abstract
The electrokinetic molecular concentration (EMC) effect at the micro–nanofluidic interface, which enables million-fold preconcentration of biomolecules, is one of the most compelling yet least understood nanofluidic phenomena. Despite the tremendous interests in EMC and the substantial efforts devoted, the detailed mechanism of EMC remains an enigma so far owing to its high complexity, which gives rise to the significant scientific controversies outstanding for over a decade and leaves the precise engineering of EMC devices infeasible. We report a series of experimental and theoretical new findings that decipher the mechanism of EMC. We demonstrate the first elucidation of two separate operating regimes of EMC, and establish the first theoretical model that analytically yet concisely describes the system. We further unveil the dramatically different scaling behaviors of EMC in the two regimes, thereby clarifying the long-lasting controversies. We believe this work represents important progress towards the scientific understanding of EMC and related nano-electrokinetic systems, and would enable the rational design and optimization of EMC devices for a variety of applications.
Introduction
Over the past two decades, nano-electrokinetics in micro–nanofluidic systems has been unprecedentedly actively studied with the aid of the recent advancements in nanotechnology.1 One of the most compelling nano-electrokinetic phenomena is the electrokinetic molecular concentration (EMC) effect at the micro–nanofluidic interface induced by the coupling of ion concentration polarization (ICP) and tangential electroosmotic flow (EOF), which enables over million-fold preconcentration of biomolecules for various biomedical applications.2–11 Despite the tremendous interest in ICP-based EMC,12,13 researchers have been constantly reporting controversially different behaviors of ICP-based EMC ever since the conception of the system,14–20 such as the maximum concentration capacity and its dependence on system parameters, which remains an enigma so far owing to the minimal scientific understanding of the system. This is mainly hampered by the high complexity of the system, which involves coupled nonlinear fluid flow, charged species transport, and dynamic evolution of electric field in multi-scale space spanning from sub-nanometers to centimeters. Although considerable progresses have been made towards the understanding of componential problems, such as ICP,21–26 nonlinear electrokinetic flow,27–30 micro–nanofluidic ion transport,1,31 the fully coupled mechanism of ICP-based EMC is still rarely known. Shen et al.18 and Jia et al.19,20 demonstrated numerical simulation as a viable approach for the studying of ICP-based EMC, which yet only provided numerical descriptions of the system under specific conditions with limited implications in the comprehensive fundamental mechanism of the system.
In this paper, we report a series of experimental and theoretical new findings that decipher the mechanism of ICP-based EMC. We demonstrate the first elucidation of two separate operating regimes of ICP-based EMC, which provided the key for us to establishing the first theoretical model that analytically yet concisely describes this highly complicated nonlinear system. We further unveil the dramatically different scaling behaviors of ICP-based EMC in the two regimes both experimentally and theoretically, thereby clarifying the scientific controversies revolving around ICP-based EMC. These insightful findings significantly advance the scientific understanding of ICP-based EMC, while setting solid foundations for the rational design and optimization of ICP-based EMC devices for various applications.
Results and discussion
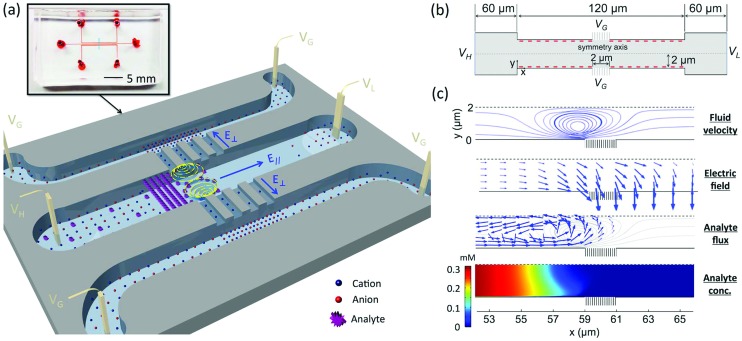
Fig. 1(a) shows the photo and schematic of the device. The device consists of a central microchannel in parallel with two side microchannels (all 2 cm long, 100 μm wide and 15 μm deep), which are interconnected by two nanochannel arrays (250 μm long and 400 μm wide). The microchannels were fabricated by polydimethylsiloxane (PDMS) soft lithography, and the nanochannel arrays were patterned on a glass slide using Nafion resin (equivalent nanochannel size: ∼4 nm),32 after which the PDMS and glass slide were bonded by plasma treatment.16 All the channel walls are negatively charged. The channels are filled with buffer solutions (potassium chloride (KCl) in this study), and the analyte (negatively charged) sample is loaded into the inlet (left reservoir) of the central microchannel. The inlet and outlet of the central microchannel are biased to electric potentials of VH and VL (VH > VL), respectively, while the four reservoirs of the side microchannels are grounded (VG = 0 V). The cross-nanochannel voltage Vcn, defined as Vcn = (VH + VL)/2 – VG, is set to be positive. Under this configuration, cations are selectively transported through the cation-selective nanochannels driven by the normal electric field E⊥, leading to the formation of ion depletion in the central microchannel and ion enrichment in the side microchannels, i.e. the ICP phenomenon. Meanwhile, the tangential electric field E‖ generated by VH and VL induces a tangential electroosmotic flow (EOF) from the inlet towards the outlet of the microchannel, which carries the analyte into the microchannel. The negatively charged analyte is subsequently trapped at the front of the ion depletion zone, the detailed mechanism of which is revealed by numerical simulation using the two-dimensional model shown in Fig. 1(b) (see Experimental section for details). As indicated by Fig. 1(c), significantly accelerated non-equilibrium EOFs are generated in the vicinity of the nanochannels due to the non-equilibrium space charge layers induced by ion depletion,27,28,33 which gives rise to the strong vortical flows in the ion depletion zone as a result of the incompressibility of fluid. At the same time, the electric field is significantly amplified near the nanochannels (plotted in natural logarithm-scale) due to the low ion concentration thereof. Consequently, instead of following the streamlines into downstream, the analyte (negatively charged) is retarded by the strong tangential electric force in the ion depletion zone, and pushed towards the backflow of the vortices by the strong normal electric force in the vicinity of the nanochannels, which act jointly to prevent the analyte from moving downstream, resulting in the continuous trapping and concentration of the analyte, i.e. the EMC effect.
Fig. 1. (a) The photo and schematic of the ICP-based EMC device. The blue box in the photo indicates the location of the nanochannel arrays (Nafion membrane). (b) Schematic of the simulation model. (c) Simulated profiles of fluid velocity, electric field, analyte flux, and analyte concentration at the steady state. In the simulation, VHL = (VH – VL) = 20VT (VT = 25.6 mV, the thermal voltage), and Vcn was set to 30VT. The initial concentration of the analyte is 0.1 nM. 1 mM KCl is used as the buffer. Given the symmetry of the system, only the lower half of the channel is plotted.
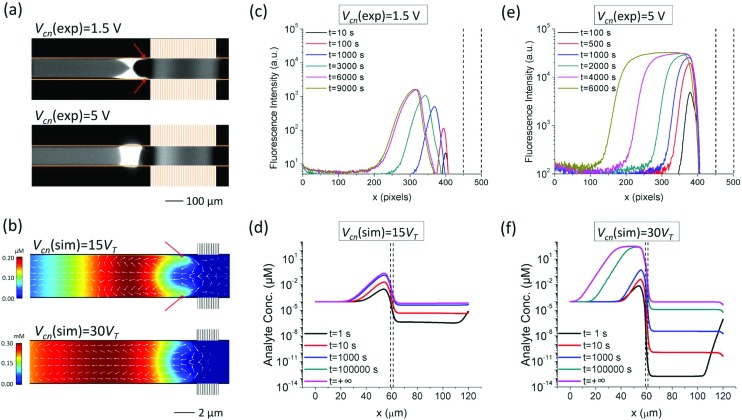
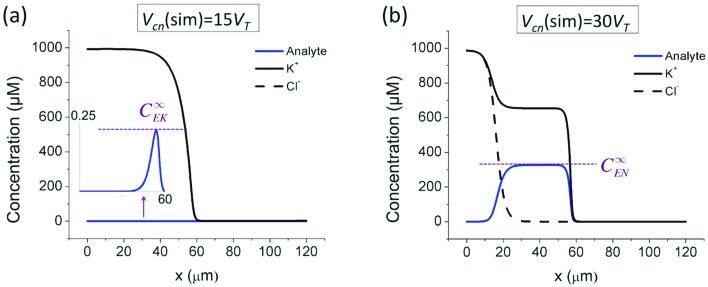
The trapping of the analyte is directly induced by the vortical flows and amplified electric field in the ion depletion zone, which is strongly dependent on Vcn. The higher Vcn is, the stronger the ion depletion effect is. To investigate the concentration behaviors, we experimentally measured the temporal evolution of the concentration of a fluorescent 21mer single-stranded DNA (ssDNA) under different Vcn's, and simulated the process with an analyte particle of similar electrophoretic mobility. As indicated by Fig. 2(a and b), at relatively low Vcn's, due to the relatively weak electric force, the analyte “protrudes” (annotated with red arrows) into the depletion zone near the channel walls following the fast non-equilibrium EOFs, leading to the non-negligible fluxes of the analyte (shown in white arrows) that “leak” into downstream.34 On the other hand, at relatively high Vcn's, the analyte is almost completely trapped at the front of the ion depletion zone, without “protrusions” into the depletion zone formed and with negligible “leakage” into the downstream. Depending on the trapping efficiency, the concentration behaviors of the analyte are distinct. As shown in Fig. 2(c and d), at relatively low Vcn's, the analyte concentration increases with a bell-shaped profile until the steady state is reached. In contrast, at relatively high Vcn's, the peak concentration increases much faster than that at low Vcn's and reaches a maximum concentration, after which the peak starts to broaden to upstream until a wide plateau is formed at the steady state (Fig. 2(e and f)). From the simulated steady-state concentration profiles of the buffer ions and analyte at different Vcn's shown in Fig. 3, we can identify two separate limits for the maximum concentration of the analyte achievable by EMC. When the analyte is not effectively trapped (Fig. 3(a)), the maximum concentration of the analyte is significantly smaller than those of the buffer ions, which is determined by the balancing between the convective, electrophoretic, and diffusive fluxes of the analyte. Therefore, this limiting concentration is named the electrokinetic (EK) limit (C∞EK). On the other hand, when the analyte is effectively trapped (Fig. 3(b)), the negatively charged analyte will eventually become one of the majority charge carriers as it continuously concentrates, while the anion concentration correspondingly decreases to maintain electroneutrality. When the anion concentration decreases to zero and the cations are neutralized by the analyte solely, the analyte concentration can no longer increase. Afterwards, the concentration process can only proceed by forming a widening plateau with a fixed concentration. In this sense, this limiting concentration is named the electroneutrality (EN) limit (C∞EN).
Fig. 2. Elucidation of the two separate operating regimes of ICP-based EMC. (a) Fluorescent images showing the concentration behaviors of 21mer single-stranded DNA (ssDNA) at Vcn = 1.5 V (t = 100 s) and Vcn = 5 V (t = 10 s). In the experiments, the initial analyte concentration is 1 μM, and the buffer is 10 mM KCl. VHL was set to 10 V. (b) Simulation results showing the concentration behaviors of the default analyte particle (see Methods for details) at Vcn = 15VT and Vcn = 30VT (VT = 25.6 mV, the thermal voltage). The arrows show the flux densities of the analyte, the lengths of which are plotted in natural logarithm-scale. In the simulation, the initial analyte concentration is 0.1 nM, and the buffer is 1 mM KCl. VHL was set to 20VT. (c) Experimental temporal evolution of the fluorescence intensity of the ssDNA at Vcn = 1.5 V. (d) Simulated temporal evolution of the concentration of the analyte at Vcn = 15VT. (e) Experimental temporal evolution of the fluorescence intensity of the ssDNA at Vcn = 5 V. (f) Simulated temporal evolution of the concentration of the analyte at Vcn = 30VT. The double dash lines indicate the x-coordinates of the nanochannel arrays.
Fig. 3. Simulated steady-state concentrations of the buffer ions and the analyte at (a) Vcn = 15VT and (b) Vcn = 30VT. VHL was set to 20VT (VT = 25.6 mV, the thermal voltage).
We next theoretically formulate the EK and EN limits. The governing equations of the system are the Navier–Stokes, Nernst–Planck, and Poisson equations that describes the incompressible fluid flow, charged species transport, and electric potential,35,36 respectively:
| ρ(∂U/∂t + (U·∇)U) = –∇P + η∇·∇U – ρe∇Φ, | 1 |
| ∇·U = 0, | 2 |
| ∂Ci/∂t = –∇·Ji, | 3 |
| Ji = –Di∇Ci – Di(Zie0/kT)Ci∇Φ + UCi, | 4 |
| –∇·(ε∇Φ) = ρe, | 5 |
where U, P, and Φ are the velocity of the fluid, the pressure, and the electric potential, respectively; E = –∇Φ is the electric field; ρ, η, and ε are the mass density, dynamic viscosity, and the permittivity of the solution, respectively; k, T, and e0 are the Boltzmann constant, the absolute temperature, and the elementary charge, respectively; Ci and Ji are the concentration and flux density of species i, respectively. For convenience, we use i = 1 for the cation, i = 2 for the anion, and i = 3 for the analyte. Di and Zi are the diffusion coefficient and valence of species i, based on which the electrophoretic mobility μi can be calculated using the Einstein relation (μi = (e0/kT)|ZiDi|).37 The space charge density is given by 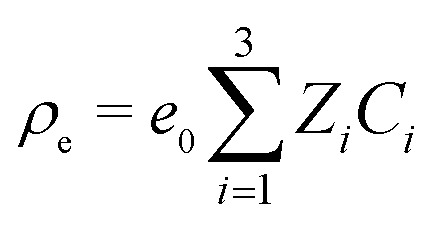 . We further define a = D2/D3, b = Z3/Z2, and b/a = μ3/μ2 for the forthcoming analyses. We will use the superscript “0” to denote the initial value, and “∞” to denote the steady state.
While this nonlinear equation set is notoriously challenging to solve, elucidation of the two separate operating regimes enables us to establish the approximate one-dimensional analytical solutions. At the EK limit where C∞1 ≈ C∞2 ≫ C∞3, the concentrating of the analyte does not alter the properties of the system. This fact permits us to approximately solve the parameters of the system first without involving the analyte, based on which the distribution of the analyte can be determined. More specifically, we formulated the EK limit in a four-stepwise procedure (see Section 1 of the ESI†): (a) the distribution of buffer ions (C∞1(x) and C∞2(x)) can be solved for symmetric binary electrolytes (D1 = D2, Z1 = –Z2, C01 = C02, e.g. KCl) by combining eqn (4) for i = 1 and i = 2, with the approximation of J∞2 ≈ 0 (considering J∞1 ≫ J∞2); (b) With C∞2(x) known, the electric field is solved from eqn (4) for i = 2; (c) with the electric field known, the distribution of the analyte (C∞3(x) is solved from eqn (4) for i = 3; (d) with C∞3(x) known, the peak concentration (C∞EK = max(C∞3(x)) can be obtained by finding the peak position with dC∞3(x)/dx = 0. Accordingly, the system at the EK limit is solved as follows,
 |
6 |
 |
7 |
| C∞EK≈ a–abb(a – b)(a–b)·e(a–b)·Pe·C03, | 8 |
where 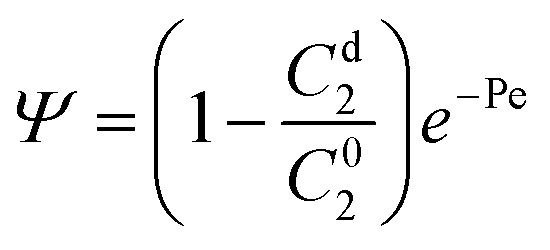 and
and 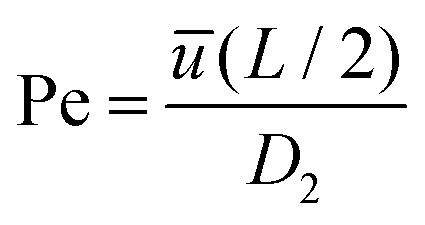 , with Cd2 being the downstream anion concentration after ion depletion (Cd2 ≪ C02), Pe being the Péclet number of the system, ū being the average x-directional fluid velocity, and L being the length of the central microchannel (nanochannel arrays are at x = L/2).
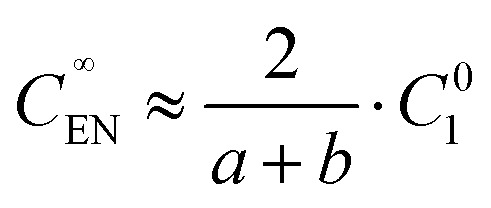
At the EN limit, the key constraint is the electroneutrality condition (Z1C∞1 + Z3C∞3 ≈ 0, C∞2 ≈ 0) at the concentration plateau of the analyte. Based on the electroneutrality condition and J∞i(inlet) = J∞i(plateau), dC∞i(x)/dx = 0 at the inlet and concentration plateau, we obtained the EN limit for symmetric binary electrolytes as the following (see Section 2 of the ESI†),
 |
9 |
Eqn (8) and (9) clearly illustrate the different natures of the two regimes: the EK limit is determined by electrokinetics of the system (represented by the Péclet number Pe), while the EN limit is bound by the concentration of the counter-ion (C01) that allows the sustaining of the electroneutrality.
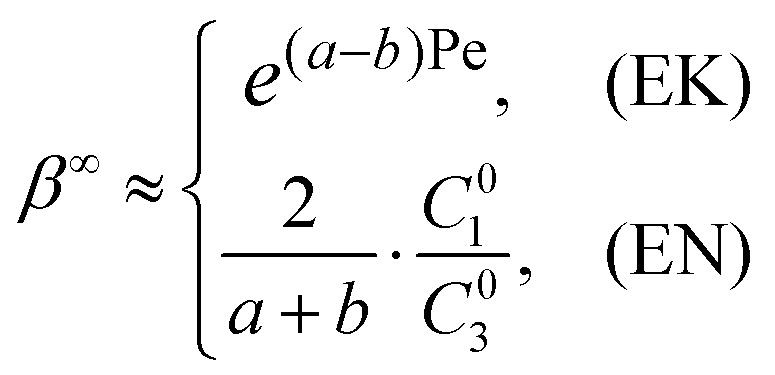
The central metric of ICP-based EMC is the concentration factor (CF) of the analyte β∞, which is defined as the ratio of the peak concentration to the initial concentration, i.e. β∞ = max(C∞3(x))/C03. According to eqn (8) and (9), the CF can be expressed as,
 |
10 |
in which the EK limit was simplified by leaving out the term a–abb(a–b)(a–b), because the order of magnitude of β∞EK is mainly determined by the latter term e(a–b)Pe(see Section 1 of ESI† for values of this term in simulation). According to eqn (10), the theoretical EN limit is only determined by the net charges, diffusion coefficients, and concentrations of the buffer ions and analyte, which allows one to predict the CFs of actual experimental systems in the EN-limited regime without knowing the dimension, surface charge densities, and other physical parameters. On the other hand, the derivation of the theoretical EK limit is much more complicated, which assumes perfect cation-selectivity of the nanochannels and adopts other simplifications (see Section 1 of the ESI†). Therefore, the value of the theoretical EK limit does not directly correspond to that in actual experimental systems, but it enables one to extract the key scaling laws obeyed in actual experimental systems. The CFs of ICP-based EMC devices range sparsely from O(1) to O(107) in the literature,12 which has not been explainable due to the poor understanding of the system. With the two separate operating regimes elucidated and the analytical model established, we further unveil the dramatically different scaling relations between the CF and system parameters in the two regimes both experimentally and theoretically, thereby enabling the rational interpretation and prediction of the performance of ICP-based EMC devices.
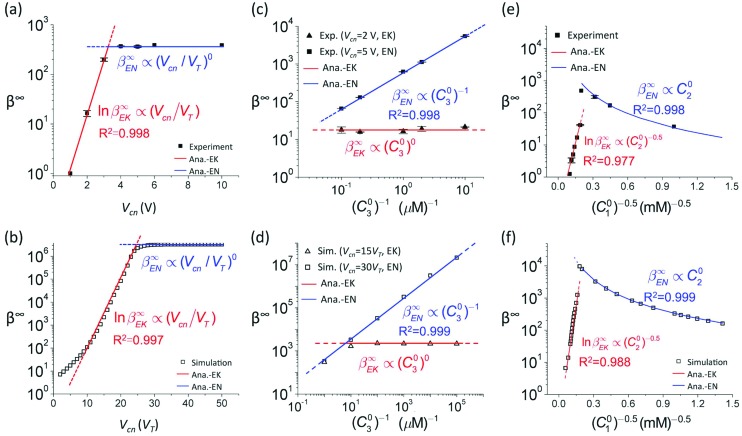
The CF has been reported to increase with Vcn in the literature,5,14,16,19,20 though no explicit scaling relation between the CF and Vcn could be determined. However, we find that the previous reports only represented one side of the coin. Fig. 4(a) shows the experimental dependence of the CF on Vcn with 1 μM ssDNA in 10 mM KCl being the analyte. The CF initially increased exponentially with Vcn and then reached a constant maximum value regardless of Vcn. Similarly, such two-phase behavior was also observed in numerical simulation (Fig. 4(b)), where we used an initial analyte concentration of 0.1 nM. The experimental and simulation results are clearly predicted by our analytical model. The exponential phase at relatively low Vcn's corresponds to the EK-limited regime, in which the CF (β∞EK) grows exponentially with Pe (eqn (10)). Because Pe is proportional to the average fluid velocity ū, and ū increases linearly with Vcn (see Section 3 of the ESI†), an exponential relation between the CF and Vcn must hold. As the analyte concentration increases with Vcn, the system will eventually enter the EN-limited regime, in which the CF (β∞EN) is determined by the electroneutrality condition and hence independent of Vcn (eqn (10)).
Fig. 4. Scaling relations between the CF and system parameters revealed by combining experiment, simulation, and theory. The red and blue lines are the fitting lines between the experimental/simulation results and the scaling laws revealed by the theoretical EK and EN limits, respectively. (a) Scaling relation between the CF and Vcn by experiment. 1 μM fluorescent ssDNA in 10 mM KCl was used as the analyte. VHL was set to 10 V. (b) Scaling relation between the CF and Vcn by simulation. 0.1 nM default particle in 1 mM KCl was used as the analyte. VHL was set to 20VT. (c) Scaling relation between the CF and the initial analyte concentration by experiment. Fluorescent ssDNA with varied initial concentrations in 10 mM KCl was used as the analyte. VHL was set to 10 V. (d) Scaling relation between the CF and the initial analyte concentration by simulation. Default particle with varied initial concentrations in 1 mM KCl was used as the analyte. VHL was set to 20VT. (e) Scaling relation between the CF and the buffer concentration by experiment. 1 μM fluorescent ssDNA in KCl solutions of varied concentrations was used as the analyte. VHL was set to 10 V, and Vcn was set to 5 V. (f) Scaling relation between the CF and the buffer concentration by simulation. 0.1 nM default particle in KCl solutions of varied concentrations was used as the analyte. VHL was set to 20VT, and Vcn was set to 30VT.
The dependence of the CF on the initial concentration of the analyte (C03) has been controversial among different researchers. Wang et al.,2 Anand et al.,5 Hlushkou et al.15 and Song et al.38 reported that higher CFs were achieved for samples with lower initial concentrations, while Hong et al.39 found the CF to be independent of the initial concentration. Elucidation of the two separate operating regimes clearly concludes this controversy. In the EK-limited regime where the analyte concentration is much lower than buffer ions, the CF is determined by the electrokinetics of the system, which is not altered by the concentrating of the analyte. Therefore, the CF is theoretically independent of C03 in the EK-limited regime (eqn (10)), as confirmed by the experimental result in Fig. 4(c) and simulation result in Fig. 4(d). In contrast, in the EN-limited regime where the maximum analyte concentration (C∞EN) is a constant determined by the electroneutrality condition, the CF (β∞EN = C∞EN/C03) is thus inversely proportional to C03 (eqn (10)), as supported by Fig. 4(c and d). Therefore, the aforementioned discrepancy can be attributed to the different operating regimes: researchers reporting higher CFs at lower initial concentrations likely operated the devices in the EN-limited regime, while those reporting constant CFs regardless of initial concentrations likely operated the devices in the EK-limited regime.
Controversy also persists on the effect of the buffer concentration (C01): Anand et al.14 and Ko et al.16 reported higher CFs in higher buffer concentrations, while it is also commonly observed that the EMC effect vanishes in sufficiently high buffer concentrations due to the collapse of the ion depletion zone. Our study unveils the scaling relations between the CF and buffer concentration that capture both scenarios. At relatively low buffer concentrations, the ion depletion zone can be sufficiently developed due to the strong overlapping of electrical double layers in the nanochannels (i.e. strong cation-selectivity), which facilitates the effective trapping of the analyte. With the analyte almost completely trapped, the system enters in the EN-limited regime. In this case, the CF (β∞EN) increases proportionally with C01 (eqn (10)), which directly determines the upper limit of the analyte concentration. This is confirmed by the experimental result in Fig. 4(e) and simulation result in Fig. 4(f). Further increase of C01 compromises the ion depletion effect and brings the system from the “non-leaking” regime to the “leaking” regime, causing an abrupt drop of the CF (by nearly one order of magnitude), as shown in Fig. 4(e and f). The system subsequently enters the EK-limited regime at higher buffer concentrations, where the CF scales exponentially with ū (eqn (10)). Because of the compromised ion depletion effect in this regime, the non-equilibrium EOF in the vicinity of the nanochannels is weakly developed. ū is consequently dominated by the equilibrium EOF in the bulk channel, which is proportional to (C01)–0.5.40 Therefore, as confirmed by Fig. 4(e and f), the CF decreases exponentially with (C01)–0.5at higher buffer concentrations in the EK-limited regime, i.e. ln β∞EK ∝ (C01)–0.5.
Finally, it is critical to understand how the properties of the analyte molecule and the composition of the buffer affect the CF for practical applications. However, this has been rarely known, mainly due to the lack of analyte molecules and ions with wide ranges of electrophoretic mobility for reliable parametric studies in experiments. Enabled by numerical simulation, we unveil the scaling relations between the CF and the electrophoretic mobility of the analyte and buffer ions, which are also well predicted by our analytical model. Firstly, according to eqn (10), the CF is greater than 1 only when a > b, i.e. μ2 > μ3. This is clearly supported by the simulation result in Fig. 5(a), where the CF is greater than 1 only in the region above the partition line a = b. This is because the anion is almost stationary in the upstream channel (i.e. ū ≈ μ2E, which causes J2 ≈ 0, see Section 1 of the ESI†), and the analyte can only enter the central microchannel and be concentrated when ū > μ3E, which requires μ2 > μ3. Therefore, the first rule of thumb for an analyte to be concentrated is that, the electrophoretic mobility of the analyte must be smaller than that of the anion. As μi ∝ |ZiDi|, we will discuss the scaling relations between the CF and the electrophoretic mobility by varying Di with fixed Zi for brevity (the result vice versa would be similar). Eqn (10) predicts that, the CF in the EK-limited regime obeys  , while that in the EN-limited regime obeys
 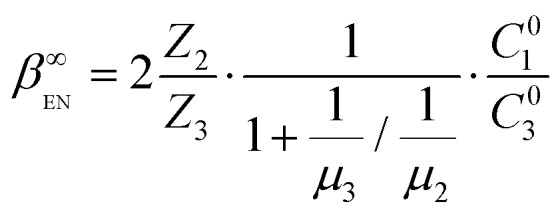 . This is confirmed by the simulation result in Fig. 5(b), in which the CF increases proportionally with –1/μ2 in the EK-limited regime for a specific analyte, while relatively insensitive to –1/μ2 in the EN-limited regime. In other words, the CF is significantly enhanced in buffers with high ion mobility, because stronger electric field and vortical flows are generated in the ion depletion zone with ions of higher mobility (see Section 4 of the ESI†), which enhances the trapping of the analyte. On the other hand, as confirmed by the simulation result in Fig. 5(c), for a specific buffer, the CF increases proportionally with 1/μ3 in the EK-limited regime, while relatively insensitive to 1/μ3 in the EN-limited regime. In other words, the CF is significantly decreased for analyte molecules with very high electrophoretic mobility, because stronger electrophoretic velocity (leftward) prevents the analyte from entering the microchannel. It is worth noting that the analytical model (assuming J∞2 ≈ 0) does not apply to the case of J∞2 ≫ 0, which occurs when the electrophoretic mobility of the analyte is too small to facilitate the electrical trapping, as shown in Fig. 5(c).
Fig. 5. Dependence of the CF on the electrophoretic mobility of buffer ions and the analyte. VHL was set to 20VT, and Vcn was set to 30VT in the simulation. (a) Condition for the analyte to be concentrated. The plot was computed by simulation. (b) Scaling relation between the CF and the electrophoretic mobility of buffer ions. (c) Scaling relation between the CF and the electrophoretic mobility of the analyte. The red and blue lines are the fitting lines between the experimental/simulation results and the scaling laws revealed by the theoretical EK and EN limits, respectively.
Conclusions
In this paper, we theoretically and experimentally elucidate the two separate operating regimes of ICP-based EMC and unveil the dramatically different scaling behaviors of the CF in the two regimes. These experimental and theoretical findings decipher the mechanism of ICP-based EMC, providing clear explanations to the controversies outstanding for over a decade. We believe that this work represents an important progress towards the scientific understanding of ICP-based EMC, and makes a stride towards the precise design and optimization of ICP-based EMC devices on demand of various applications.
Experimental
Numerical simulation
In the simulation model, the central microchannel is 120 μm long and 4 μm wide, connecting two reservoirs of 60 μm long and 60 μm wide. The microchannel walls are negatively charged with a surface charge density of –5 mC m–2. The nanochannel arrays are assumed to permit the passage of cations only, which is numerically implemented by setting a boundary condition of constant cation concentration and zero anion flux.36,41–43 The default electrolyte is 1 mM KCl (diffusion coefficients: D1 = D2 = 2 × 10⁻⁹ m2 s–1) with 0.1 nM analyte. The default analyte is a divalently negatively charged particle with a diffusion coefficient 1/4 of that of Cl–, i.e. a = 4, b = 2. The corresponding electrophoretic mobility of the default analyte is 3.87 × 10⁻⁸ m2 V–1 s–1, which is the typical value for short DNAs.44
The governing equations are eqn (1)–(5), which are solved using COMSOL® (v5.2a). Transport of charged species and electric fields are implemented using the Transport of Diluted Species and Electrostatics Modules. The Poisson–Nernst–Planck (PNP) equations are solved using quadratic Lagrange interpolation functions for space discretization. Navier–Stokes (NS) and continuity equations are implemented in Creeping Flow Module. Quadratic Lagrange shape functions are used for NS equations whereas linear functions are used for the continuity equation. The boundary conditions are as follows. At the nanochannel array surfaces, it is assumed that: (1) fluxes of the anion and analyte across the nanochannels are zero; (2) the concentration of cations at the nanochannel array surfaces is 2 mM;36,41–43 (3) the electric potential at the nanochannel array surfaces is zero; (4) the nanochannel array surfaces are impermeable and no-slip to fluid (zero fluid velocity). At the microchannel walls, the boundary conditions are: (1) constant surface charge density of –5 mC m–2; (2) no-slip condition for fluid velocity; (3) zero fluxes of ions and analyte. It is noted that the ICP effect changes the pH and ion concentration of the solution in the downstream channel, which in turn could affect the surface charge density. The modeling of this effect is a non-trivial task.45 For the purpose of scaling analysis, we will simply assume a constant surface charge density, which has proved to provide good approximation of actual experimental systems by previous works.19,20 At the inlet boundary, the boundary conditions are: (1) the concentrations of the ions and analyte are the same as those in the inlet reservoir. (2) The electric potential is VH; (3) the pressure is zero. At outlet boundary, the boundary conditions are: (1) free boundary conditions are applied for fluid flow; (2) the electric potential is VL. At the reservoirs walls, the boundary conditions are: (1) no-slip condition for fluid velocity; (2) zero charge. The computational domain is meshed using quadrilateral elements. Finer grids are adopted near the charged walls, nanochannel array surfaces, inlet and outlet boundaries of the channel (see Section 5 of the ESI†).
Experimental details
In the experiments, we used 10 mM KCl solution as the default buffer. The analyte molecule is Alexa Fluor 488-labeled 21-base ssDNA (5′-AGTCAGTCAGTCAGTCAGTCA-3′) (Integrated DNA Technologies, IA). An inverted fluorescent microscope (IX71, Olympus) and a CCD camera (Sensicam qe, Cook Corp.) were used for imaging. A mechanical shutter was used to reduce the photo-bleaching effect. Micro-manager (http://www.micromanager.org) was used to synchronize the CCD camera and the mechanical shutter. ImageJ (National Institutes of Health, USA) was used for image analysis. A DC power supply (Stanford Research Systems, Sunnyvale, CA) was used to apply the voltages. A multi-meter (Fluke 189) was used to measure the voltages. Ag/AgCl electrodes (A-M Systems Inc.) were used as electrodes.
Conflicts of interest
There are no conflicts to declare.
Supplementary Material
Acknowledgments
This work is supported by the National Institutes of Health of the United States (Grant No. U19AI109755) and the National Natural Science Foundation of China (Grant No. 11372229, 21576130, 21490584).
Footnotes
†Electronic supplementary information (ESI) available. See DOI: 10.1039/c8nr02170h
References
- Schoch R. B., Han J., Renaud P. Rev. Mod. Phys. 2008;80(3):839. [Google Scholar]
- Wang Y.-C., Stevens A. L., Han J. Anal. Chem. 2005;77(14):4293–4299. doi: 10.1021/ac050321z. [DOI] [PubMed] [Google Scholar]
- Huang K. D., Yang R. J. Electrophoresis. 2008;29(24):4862–4870. doi: 10.1002/elps.200800392. [DOI] [PubMed] [Google Scholar]
- Kim P., Kim S. J., Han J., Suh K. Y. Nano Lett. 2009;10(1):16–23. doi: 10.1021/nl9023319. [DOI] [PMC free article] [PubMed] [Google Scholar]
- Anand R. K., Sheridan E., Knust K. N., Crooks R. M. Anal. Chem. 2011;83(6):2351–2358. doi: 10.1021/ac103302j. [DOI] [PubMed] [Google Scholar]
- Kwak R., Kim S. J., Han J. Anal. Chem. 2011;83(19):7348–7355. doi: 10.1021/ac2012619. [DOI] [PubMed] [Google Scholar]
- Kim B., Heo J., Kwon H. J., Cho S. J., Han J., Kim S. J., Lim G. ACS Nano. 2012;7(1):740–747. doi: 10.1021/nn3050424. [DOI] [PubMed] [Google Scholar]
- Stein D., Deurvorst Z., van der Heyden F. H. J., Koopmans W. J. A., Gabel A., Dekker C. Nano Lett. 2010;10(3):765–772. doi: 10.1021/nl902228p. [DOI] [PubMed] [Google Scholar]
- Ouyang W., Ko S. H., Wu D., Wang A. Y., Barone P. W., Hancock W. S., Han J. Anal. Chem. 2016;88(19):9669–9677. doi: 10.1021/acs.analchem.6b02517. [DOI] [PubMed] [Google Scholar]
- Ouyang W., Han J., Wang W. Lab Chip. 2017;17(22):3772–3784. doi: 10.1039/c7lc00722a. [DOI] [PMC free article] [PubMed] [Google Scholar]
- Gong L., Ouyang W., Li Z., Han J. J. Membr. Sci. 2018;556:34–41. doi: 10.1016/j.memsci.2018.03.078. [DOI] [PMC free article] [PubMed] [Google Scholar]
- Fu L. M., Hou H. H., Chiu P. H., Yang R. J. Electrophoresis. 2018;39(2):289–310. doi: 10.1002/elps.201700340. [DOI] [PubMed] [Google Scholar]
- Kim S. J., Song Y.-A., Han J. Chem. Soc. Rev. 2010;39(3):912–922. doi: 10.1039/b822556g. [DOI] [PMC free article] [PubMed] [Google Scholar]
- Anand R. K., Sheridan E., Hlushkou D., Tallarek U., Crooks R. M. Lab Chip. 2011;11(3):518–527. doi: 10.1039/c0lc00351d. [DOI] [PubMed] [Google Scholar]
- Hlushkou D., Perdue R. K., Dhopeshwarkar R., Crooks R. M., Tallarek U. Lab Chip. 2009;9(13):1903–1913. doi: 10.1039/b822404h. [DOI] [PubMed] [Google Scholar]
- Ko S. H., Song Y.-A., Kim S. J., Kim M., Han J., Kang K. H. Lab Chip. 2012;12(21):4472–4482. doi: 10.1039/c2lc21238b. [DOI] [PubMed] [Google Scholar]
- Kim M., Jia M., Kim T. Analyst. 2013;138(5):1370–1378. doi: 10.1039/c2an36346a. [DOI] [PubMed] [Google Scholar]
- Shen M., Yang H., Sivagnanam V., Gijs M. A. M. Anal. Chem. 2010;82(24):9989–9997. doi: 10.1021/ac102149f. [DOI] [PubMed] [Google Scholar]
- Jia M., Kim T. Anal. Chem. 2014;86(15):7360–7367. doi: 10.1021/ac500536w. [DOI] [PubMed] [Google Scholar]
- Jia M., Kim T. Anal. Chem. 2014;86(20):10365–10372. doi: 10.1021/ac502726u. [DOI] [PubMed] [Google Scholar]
- Probstein R. F., Physicochemical hydrodynamics: an introduction, Wiley-Interscience, New York, 1994. [Google Scholar]
- Zangle T. A., Mani A., Santiago J. G. Chem. Soc. Rev. 2010;39(3):1014–1035. doi: 10.1039/b902074h. [DOI] [PubMed] [Google Scholar]
- Cho I., Kim W., Kim J., Kim H.-Y., Lee H., Kim S. J. Phys. Rev. Lett. 2016;116(25):254501. doi: 10.1103/PhysRevLett.116.254501. [DOI] [PubMed] [Google Scholar]
- Green Y., Eshel R., Park S., Yossifon G. Nano Lett. 2016;16(4):2744–2748. doi: 10.1021/acs.nanolett.6b00429. [DOI] [PubMed] [Google Scholar]
- Rubinstein I., Staude E., Kedem O. Desalination. 1988;69(2):101–114. [Google Scholar]
- Plecis A., Nanteuil C. m., Haghiri-Gosnet A.-M., Chen Y. Anal. Chem. 2008;80(24):9542–9550. doi: 10.1021/ac8017907. [DOI] [PubMed] [Google Scholar]
- Kim S. J., Wang Y.-C., Lee J. H., Jang H., Han J. Phys. Rev. Lett. 2007;99(4):044501. doi: 10.1103/PhysRevLett.99.044501. [DOI] [PMC free article] [PubMed] [Google Scholar]
- Rubinstein S. M., Manukyan G., Staicu A., Rubinstein I., Zaltzman B., Lammertink R. G. H., Mugele F., Wessling M. Phys. Rev. Lett. 2008;101(23):236101. doi: 10.1103/PhysRevLett.101.236101. [DOI] [PubMed] [Google Scholar]
- Dydek E. V., Zaltzman B., Rubinstein I., Deng D. S., Mani A., Bazant M. Z. Phys. Rev. Lett. 2011;107(11):118301. doi: 10.1103/PhysRevLett.107.118301. [DOI] [PubMed] [Google Scholar]
- Nam S., Cho I., Heo J., Lim G., Bazant M. Z., Moon D. J., Sung G. Y., Kim S. J. Phys. Rev. Lett. 2015;114(11):114501. doi: 10.1103/PhysRevLett.114.114501. [DOI] [PubMed] [Google Scholar]
- Kirby B. J., Micro-and nanoscale fluid mechanics: transport in microfluidic devices, Cambridge University Press, 2010. [Google Scholar]
- Van Der Stegen J. H. G., Görtzen J., Kuipers J. A. M., Hogendoorn J. A., Versteeg G. F. J. Membr. Sci. 2001;183(1):61–74. [Google Scholar]
- Leinweber F. C., Tallarek U. Langmuir. 2004;20(26):11637–11648. doi: 10.1021/la048408n. [DOI] [PubMed] [Google Scholar]
- Gong L., Ouyang W., Li Z., Han J. AIP Adv. 2017;7(12):125020. doi: 10.1063/1.5008365. [DOI] [PMC free article] [PubMed] [Google Scholar]
- Rubinstein I., Zaltzman B. Phys. Rev. E: Stat. Phys., Plasmas, Fluids, Relat. Interdiscip. Top. 2000;62(2):2238. doi: 10.1103/physreve.62.2238. [DOI] [PubMed] [Google Scholar]
- Li Z., Liu W., Gong L., Zhu Y., Gu Y., Han J. Int. J. Appl. Mech. 2017;9(8):1750107. [Google Scholar]
- Edward J. T. J. Chem. Educ. 1970;47(4):261. [Google Scholar]
- Wei X., Panindre P., Zhang Q., Song Y.-A. ACS Sens. 2016;1(7):862–865. [Google Scholar]
- Hong S. A., Kim Y.-J., Kim S. J., Yang S. Biosens. Bioelectron. 2018;107:103–110. doi: 10.1016/j.bios.2018.01.067. [DOI] [PubMed] [Google Scholar]
- Thormann W., Zhang C.-X., Caslavska J., Gebauer P., Mosher R. A. Anal. Chem. 1998;70(3):549–562. doi: 10.1021/ac970513x. [DOI] [PubMed] [Google Scholar]
- Khair A. S., Squires T. M. Phys. Fluids. 2008;20(8):087102. [Google Scholar]
- Druzgalski C. L., Andersen M. B., Mani A. Phys. Fluids. 2013;25(11):110804. [Google Scholar]
- Demekhin E. A., Nikitin N. V., Shelistov V. S. Phys. Fluids. 2013;25(12):122001. [Google Scholar]
- Stellwagen N. C., Stellwagen E. J. Chromatogr., A. 2009;1216(10):1917–1929. doi: 10.1016/j.chroma.2008.11.090. [DOI] [PMC free article] [PubMed] [Google Scholar]
- Behrens S. H., Grier D. G. J. Chem. Phys. 2001;115(14):6716–6721. [Google Scholar]
Associated Data
This section collects any data citations, data availability statements, or supplementary materials included in this article.


