

Abstract
In many physical networks, from neurons in the brain [1, 2] to 3D integrated circuits [3] or underground hyphal networks [4], the nodes and links are physical objects unable to cross each other. These non-crossing conditions constrain their layout geometry and affect how these networks form, evolve and function, limitations ignored by the theoretical framework currently used to characterize real networks [5, 6, 7, 8, 9, 10]. Indeed, most current network layout tools are variants of the Force-Directed Layout (FDL) algorithm [11, 12], which assumes dimensionless nodes and links, hence are unable to reveal the geometry of densely packed physical networks. Here, we develop a modeling framework that accounts for the physical reality of nodes and links, allowing us to explore how the non-crossing conditions affect the geometry of the network layout. For small link thicknesses, rL, we observe a weakly interacting regime where link crossings are avoided via local link rearrangements, without altering the overall layout geometry. Once rL exceeds a threshold, a strongly interacting regime emerges, where multiple geometric quantities, from the total link length to the link curvature, scale with rL. We show that the crossover between the two regimes is driven by excluded volume interactions, allowing us to analytically derive the transition point, and show that large networks eventually end up in the strongly interacting regime. We also find that networks in the weakly interacting regime display a solid-like response to stress, whereas they behave in a gel-like fashion in the strongly interacting regime. Finally, we show that the weakly interacting regime offers avenues to 3D print networks, while the strongly interacting regime offers insight on the scaling of densely packed mammalian brains.
To lay out physical networks, we must arrange the links and the nodes in such a way to avoid crossing each other, while minimizing the total link length. In other words, we must find the shortest path for each link, even when the straight path is obstructed by other nodes and links, a problem equivalent to stretching a rubber band between flexible obstacles (See Fig. 1, also SI 3.1 for proof [13]). To achieve this, we propose a model in which the forces governing the motion of the nodes and links is determined by the gradient of the total potential energy,
| (1) |
where Vel is the total elastic potential of all links l = 1, ..., L. Each link is modeled as an elastic cylinder with radius rL, experiencing both internal elastic forces and short-range external repulsive forces from other links and nodes. VNL captures the node-link interactions at link endpoints; the non-crossing condition is ensured by a short-range repulsive force in VNN (node-node interaction) and VLL (link-link interaction) modeled as short-range Gaussian potentials whose strength is set by AN and AL. In (1) sl is the length parameter of link l and represents the position of a point along the center of the link at time t; is the position of node i; rN is the range of the node-node repulsive force; k is the elastic constant of the links. The potential energy (1) is inspired by models employed in self-avoiding polymer chains [14] and manifold dynamics [15], but given the constraints induced by the network structure, (1) has different terms and displays behavior unique to networks. With VLL = 0 and replacing Vel with the elastic energy of a spring, (1) reduces to the potential energy of FDL with short-range node repulsion. The lowest energy solution of (1) can lead to sharp bending of some links, which we avoid using a Gay-Berne potential [16] employed in polymer physics (SI 4). Finally, we embed the network in a high viscosity medium, allowing it to relax to a low energy state without oscillations. Therefore, the node and link positions follow the first order gradient descent equations of motion,
| (2) |
| (3) |
where λN and λL are the node and link friction constants (SI 3.6). We use FDL to set the initial node positions and explore two versions of the model with different constraints: (i) In the Elastic Link Model (ELI), which corresponds to the node positions are kept fixed and only the links are allowed to reorganize themselves; (ii) In the Fully Elastic Model (FUEL) we assume hence both nodes and links are free to move.
Figure 1. Modeling Framework for Avoiding Link Crossings:
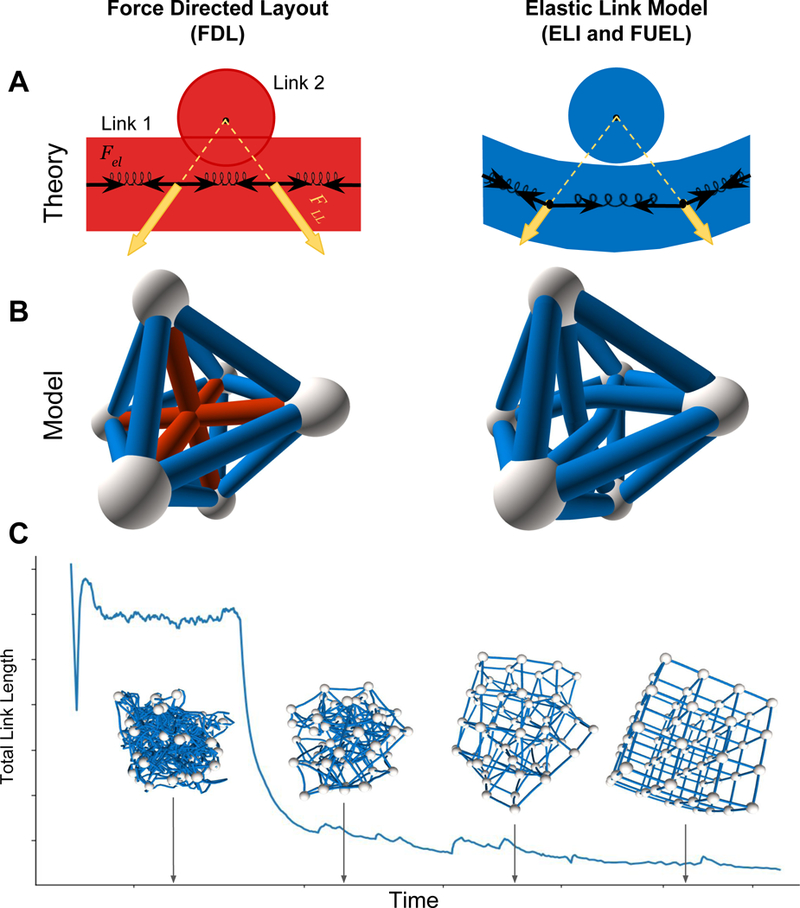
(A) We model each link as a stretched, flexible rubber band, corresponding to many short springs connected to each other, pulled apart by elastic forces Fel. The links exert a repulsive force FLL on each other that falls sharply at radii larger than rL. While in FDL the links cross each other (left figure), in ELI and FUEL such crossings are prohibited (right figure). (B) A small network with N = 6 nodes laid out with FDL (left), resulting in multiple link crossings (red links). The right plot shows how the network laid out by ELI that resolves the crossings. (C) Finding the final layout of a lattice with also showing the evolution of the total link length over time during the simulation. We started from a random layout and used simulated annealing to find the final layout. The thermal noise helps links pass through each other and resolve crossings.
The network defined by (1)–(3) has an uneven potential energy landscape [17] with a very large number of local minima, hence identifying the globally optimal configuration is NP hard (SI 3.7). We therefore use simulated annealing [18] to approach an energetically favorable local minimum (SI 3.7). The computational complexity of the model is discussed in SI 8.3. Figure 1C shows how FUEL finds the correct 3D configuration of a lattice, helped by the noise to tunnel through the finite potential walls and escape local minima.
As FDL ignores the physical dimensions of the nodes and links, it suffers from multiple link and node crossings (SI 2). The number of such conflicts increases linearly with rL (Fig. 2A), a behavior analytically predicted by a geometric model (SI 2). To avoid these conflicts, we applied ELI and FUEL to several networks with different topologies (regular lattice, random, scale-free), spanning a range of sizes and link densities. We find that the obtained layouts undergo a geometrical layout transition as we increase the link thicknesses (Fig. 2E, F, G, H).
Figure 2. Crossover in Network Layouts:
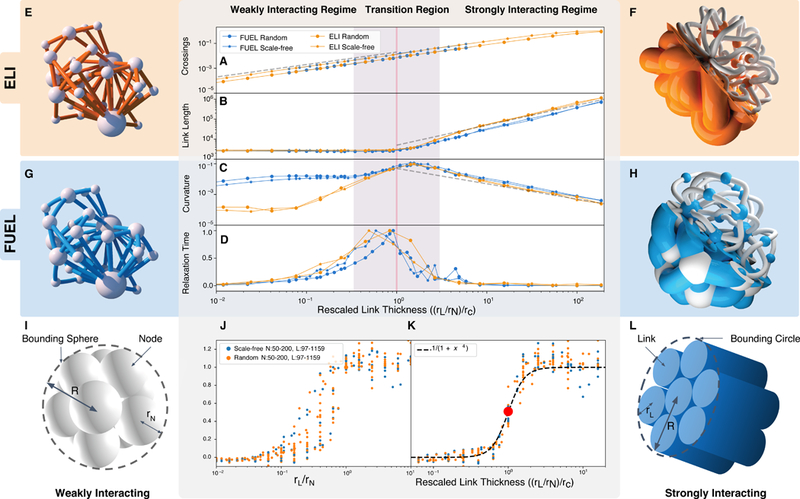
(A) The number of link crossings in FDL grows linearly with rL, saturating at very high rL. A proper layout must resolve this increasing number of conflicts. (B) The average link length remains largely constant in the weakly interacting regime, but grows linearly (dashed gray line) in the strongly interacting regime. (C) The average link curvature rises slowly in the weakly interacting regime, then falling linearly in the strongly interacting regime. (D) The relaxation time grows significantly near the transition point. The transition occurs over a finite range of rL/rN (Shaded area A–D), regardless of the system size, offering evidence of a crossover. ELI and FUEL geometries: ELI (E, F, orange) and FUEL (G, H, blue) layout for a BA network [29] with N = 20, m = 2. When both ELI (E) and FUEL (G) layouts are similar to FDL. At larger rL links bend to avoid each other. (F) In ELI at large rL, links don’t fit inside the region containing the nodes and make outward arcs. (H) As nodes are free to move in FUEL, at large rL the layout behaves more gently than ELI (link skeletons shown in white in (F) and (H)). (I) In the weakly interacting regime the links are thin and the layout radius is approximately the radius R of the bounding sphere surrounding N balls of radius rN. (L) At larger rL/rN, thick links exclude each other and their volume dominates the volume of the layout. (J) The order parameter (scaling exponent of versus rL/rN for networks with different N and L and geometries (random, scale-free). (K) Rescaling the ratio of rL/rN using (4) collapses the transition point.
Weakly Interacting Regime: For small link thicknesses, rL, the ELI and FUEL layouts are largely indistinguishable from the initial FDL layout. Indeed, at low rL, the average link length is independent of rL even as the link thickness increases by orders of magnitude (Fig. 2B). This is unexpected, given that there is a tenfold increase in the number of conflicts (potential link crossings) in this regime (Fig. 2A). The unchanged indicates that ELI and FUEL avoid the increasing number of conflicts by small local bending of the links, without the need to noticeably alter A similar behavior is seen for the average curvature of the links, finding that it shows modest changes throughout the weakly interacting regime (Fig. 2C), indicating that despite multiple local bending necessary to avoid conflicts the links remain largely straight. Note that the behavior of in this regime is model dependent, as the movement of nodes in FUEL offers avenues to avoid crossings, requiring less curving. Altogether, we find that in the weakly interacting regime local link rearrangements are sufficient to solve the multiple conflicts FDL suffers from.
Strongly Interacting Regime: Once rL exceeds a critical value, we observe a dramatic change in the layout geometry (Fig. 2F, H). In ELI, with fixed node positions, the links must take long convoluted routes outside the network to reach their end-nodes, as they are unable to find sufficient empty space between the nodes. This change in the link structure is particularly visible on the skeleton of the layout (white links in Fig. 2F, H). In FUEL, with flexible node positions, the links reach their destination by pushing the nodes away from each other. These changes alter the behavior of which in the strongly interacting regime increases linearly with rL, and induce rapid changes in the average curvature, at After the transition, the curvature decreases as 1/rL. It is remarkable, however, that despite the different mechanisms the two models employ, the scaling of and in the strongly interacting regime in ELI and FUEL is universal, independent of the network topology. The observed linear increase in and the decrease in is consistent with isometric scaling, indicating that the layouts in the strongly interacting regime are structurally similar to each other if we rescale them by rL (SI 5.1).
We can reveal the origin of the observed transition in the layout geometry by estimating the transition point When the links are much thinner than the node repulsion range rN, the layout is dominated by the repulsive forces between the nodes, that together occupy the volume (SI 10). When the volume occupied by the links becomes comparable to VN the layout must change to accommodate the links, inducing a transition from the weakly interacting regime to the strongly interacting regime. To calculate the transition point, the volume of all nodes and links need to be taken into account (Sec. SI 10), obtaining
| (4) |
where and and the average is taken over the degree distribution. In scale-free and random networks, in the limit we obtain (SI 10), Using that in many real and model networks we have we obtain implying that in the limit i.e. the weakly interacting regime is absent in the thermodynamic limit. In other words, for large networks the crossings are so numerous that they cannot be ignored. Consequently, FDL and all currently used layout tools that ignore link crossings are expected to fail for large networks, as their layout is dominated by conflicts.
While networks with different N and L transition at different rL/rN ratios, if we scale rL/rN with the layout transition occurs near one for all networks. Using the scaling exponent of the average link length as the order parameter, the data collapse of Fig. 2K confirms the validity of (4). The fact that networks of rather different topologies (Scale-free, random, lattices and random geometric graphs (Sec. SI 11)) show similar dependence of the transition point on rL, suggests that the transition of Fig. 2 independent of the network topology and the degree distribution. After rescaling of the transition point, networks of various sizes collapse on the same curve with the same width (Fig. 2K, see SI 10 and SI 11).
Finite-size scaling indicates that the layout transition occurs over a finite range of rL/rN, regardless of the network size (Sec. SI 11), indicating that we are observing a crossover [19, 20] from a mean-field behavior (exponent ) to a scaling behavior Indeed, the weakly interacting regime of both ELI and FUEL is well described by FDL, which ignores the interactions between the links and the possible link crossings are resolved as local perturbations. Yet, this weakly interacting regime disappears in the thermodynamic limit. For only the strongly interacting regime survives that, dominated by strong link-link interactions, displays universal scaling.
The observed crossover also alters the network’s physical properties. For example, a network’s response to external forces is captured by the Cauchy stress tensor [21] (SI 6), which depends on the physical and material properties of nodes and links. In the weakly interacting regime, the links are largely straight, hence the node terms VNN and VNL dominate the total stress. As the nodes are surrounded by a varying number of nodes, the stress does not spread uniformly in all directions, but has shear (off-diagonal) stress components, a common feature of solids. In the strongly interacting regime, the links fill up the space, hence the link contributions dominate resulting in a diagonal total stress tensor (SI 6). In other words, we predict that networks in the strongly interacting regime display a fluid or gel-like response to external stress. To test the validity of the predicted solid-gel transition, we compress the networks generated by FUEL in the y direction and measure the tensile forces (Fig. 3A, SI 6). We again, observe a crossover at predicted by (4) from a roughly constant stress in the weakly interacting regime to a monotonically increasing stress in the strongly interacting regime (Fig. 3B). Furthermore, as we rotate the network, we find that the total stress ratio displays large fluctuations in the weakly interacting regime, a common behavior in anisotropic solids. The fluctuations vanish at the transition point reaching the hydrostatic ratio (Fig. 3C), as expected for gels under pressure.
Figure 3. Stressed Networks and 3D Printing Networks:
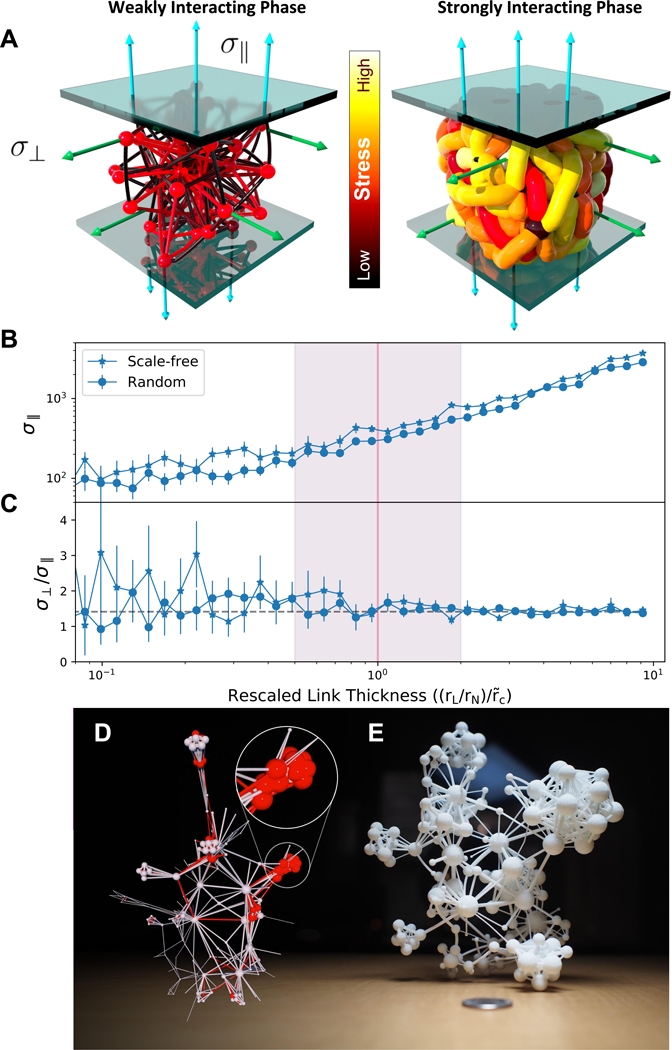
(A) The tensile stress build-up in nodes and links as a result of compressing the network between two walls. Arrows indicate tensile stress (cyan indicates parallel to to the direction of compression, and green is perpendicular to it). The networks are colored based on the total amount of stress. In the weakly interacting regime (left) the stress is concentrated in the nodes and in the strongly interacting regime (right), almost all the stress is in the links. (B) The parallel stress of scale-free and random network topologies as a function of link thickness. Since the definition of x,y,z is frame-dependent, we measure the forces for 50 random network orientations. (C) The ratio of parallel and transverse tensile stress error bars correspond to one standard deviation around the mean, calculated over the 50 random orientations. In the weakly interacting regime the ratio depends on layout orientation, a solid-like feature. In the strongly interacting regime, the fluctuations of decay to zero. 3D Printing Networks: The Flavor Network [23] with N = 184, L = 716, represents a network of ingredients sharing flavor compounds. (D) An FDL layout applied to this network results in multiple conflicts (red). The inset highlights a densely connected region containing dairy products, so highly overlapping that it is impossible to discern the underlying network. (E) Laying out the flavor network using FUEL, the conflicts disappear, unveiling the inner structure of network communities. We 3D printed the resulting flavor network using a commercial 3D printer, allowing us to inspect the full internal structure of the network.
In summary, the layout geometry of physical networks is characterized by two distinct regimes: a weakly interacting regime, where the overlap between the nodes and links is avoided via local link rearrangements, and a strongly interacting regime, whose layout is shaped by excluded link volume interactions. Networks in the weakly interacting regime are solid-like, while those in the strongly interacting regime behave like a gel. The observed transition between the two regimes is unique to three dimensions. Indeed, as links are one dimensional objects, the non-crossing condition results in knot-like constraints in 3D, preventing the links from passing through each other. In D ≥ 4, knots of one dimensional objects can be untied [22], so the non-crossing conditions will not constraint the embedding. Therefore, D = 3 is the lowest dimension where links can avoid each other by bending, and also the highest dimension where they cannot pass by each other without breaking or tunneling.
Both phases have potentially important applications. The weakly interacting regime is the one traditionally used in network visualizations, and can help us 3D print networks, offering novel ways to explore the inner structure of a complex system. We illustrate this in Fig. 3D, where we applied FDL to the Flavor Network [23]. Given the high link density, 2D visualizations suffer from visual cluttering, making only a fraction of the links visible [23]. A 3D layout offers more clarity, but given the dense communities, FDL leads to excessive node and link overlaps (inset, Fig. 3D), obstructing the true wiring of the network. Applying FUEL, and choosing rL so that the layout stays in the weakly interacting regime, the obtained layout geometry reveals the underlying communities present in the network. This layout is amenable to 3D printing, as shown in Fig. 3E, offering unprecedented opportunities to interact with the network and to directly inspect its inner structure. Note that the finding that for large N the weakly interacting regime disappears, indicates that the toolset introduced here, capable of resolving crossings, is inevitable as we aim to visualize large networks, when link crossings dominate the layout.
The strongly interacting regime has direct relevance to the brain, a three dimensional physical network where the close-packing of the axons is critical to their ability to form synapses [24, 25]. Isometric scaling laws observed in rodent brains [26] indicate that volume Vw and the area Aw of the white matter relate to each other as [26]. This implies that in these networks the average neuron length scales as with the axon thickness, a behavior accurately predicted by the strongly interacting regime (Fig. 2B). Indeed, if we adapt the conventional approach and describe anatomical regions as nodes, and axon bundles connecting these regions as links, the thickness of the axon bundles (rL) is comparable to the size of the anatomical regions, supporting the prediction of the empirical scaling that these brain networks are in the strongly interacting regime. Thus, (1)–(3) offers an appropriate modeling framework to capture the layout geometry of dense neuronal networks, generating an economic spatial layout [27, 28] while respecting the non-crossing conditions each axon must obey [1].
Supplementary Material
Acknowledgements
The authors wish to thank A. Grishchenko for 3D visualizations and photography, and K. Albrecht, M. Martino and H. Sayama for useful discussions, and Formlabs and Shapeways for 3D printing. The authors were supported by grants from Templeton (Award # 61066), NSF (Award # 1735505), NIH (Award # P01HL132825) and AHA (Awatd # 151708).
Footnotes
Reviewer Information Nature thanks [Referee Name], and [Referee Name] for their contribution to the peer review of this work.
Data Availability Statement All data used in the figures were generated using the simulation code available at https://github.com/nimadehmamy/3D-ELI-FUEL. The data that support the findings of this study are available from the corresponding author upon reasonable request.
Supplementary Information is available in the online version of the paper.
References
- [1].Kasthuri N, Lichtman J et al. Saturated reconstruction of a volume of neocortex. Cell 162, 648–661 (2015). [DOI] [PubMed] [Google Scholar]
- [2].Oh SW et al. A mesoscale connectome of the mouse brain. Nature 508, 207–214 (2014). [DOI] [PMC free article] [PubMed] [Google Scholar]
- [3].Wong S et al. Monolithic 3d integrated circuits In VLSI Technology, Systems and Applications, 2007. VLSI-TSA 2007. International Symposium on, 1–4 (IEEE, 2007). [Google Scholar]
- [4].Friese CF & Allen MF The spread of va mycorrhizal fungal hyphae in the soil: inoculum types and external hyphal architecture. Mycologia 409–418 (1991). [Google Scholar]
- [5].Barrat A, Barthelemy M & Vespignani A Dynamical processes on complex networks (Cambridge University Press, 2008). [Google Scholar]
- [6].Caldarelli G & Catanzaro M Networks: A very short introduction, vol. 335 (Oxford University Press, 2012). [Google Scholar]
- [7].Cohen R & Havlin S Complex networks: structure, robustness and function (Cambridge University Press, 2010). [Google Scholar]
- [8].Dorogovtsev SN & Mendes JF Evolution of networks: From biological nets to the Internet and WWW (Oxford University Press, 2013). [Google Scholar]
- [9].Barabási A-L Network Science (Cambridge University Press, 2016). [Google Scholar]
- [10].Albert R & Barabási A-L Statistical mechanics of complex networks. Reviews of modern physics 74, 47 (2002). [Google Scholar]
- [11].Kamada T & Kawai S An algorithm for drawing general undirected graphs. Information Processing Letters 31, 7–15 (1989). [Google Scholar]
- [12].Fruchterman TM & Reingold EM Graph drawing by force-directed placement. Software: Practice and Experience 21, 1129–1164 (1991). [Google Scholar]
- [13].Dubrovin B, Fomenko A & Novikov S Modern geometry methods and applications Part 1: The geometry and topology of manifolds (translated by RG Burns) (Springer-Verlag, Graduate Texts in Mathematics; 104, 1984). [Google Scholar]
- [14].Des Cloizeaux J Lagrangian theory for a self-avoiding random chain. Physical Review A 10, 1665 (1974). [Google Scholar]
- [15].Mézard M & Parisi G Replica field theory for random manifolds. Journal de Physique I 1, 809–836 (1991). [Google Scholar]
- [16].Gay J & Berne B Modification of the overlap potential to mimic a linear site–site potential. The Journal of Chemical Physics 74, 3316–3319 (1981). [Google Scholar]
- [17].Bouchaud J-P, Cugliandolo LF, Kurchan J & Mezard M Out of equilibrium dynamics in spin-glasses and other glassy systems. Spin glasses and random fields 161–223 (1998). [Google Scholar]
- [18].Kirkpatrick S, Gelatt CD Jr & Vecchi MP Optimization by simulated annealing In Spin Glass Theory and Beyond: An Introduction to the Replica Method and Its Applications, 339–348 (World Scientific, 1987). [Google Scholar]
- [19].Chaikin PM & Lubensky TC Principles of condensed matter physics (Cambridge University Press, 2000). [Google Scholar]
- [20].Cardy J Scaling and renormalization in statistical physics, vol. 5 (Cambridge university press, 1996). [Google Scholar]
- [21].Irgens F Continuum mechanics (Springer Science & Business Media, 2008). [Google Scholar]
- [22].Zeeman EC Unknotting combinatorial balls. Annals of Mathematics 501–526 (1963). [Google Scholar]
- [23].Ahn Y-Y, Ahnert SE, Bagrow JP & Barabási A-L Flavor network and the principles of food pairing. Scientific Reports 1 (2011). [DOI] [PMC free article] [PubMed] [Google Scholar]
- [24].Stepanyants A, Hof PR & Chklovskii DB Geometry and structural plasticity of synaptic connectivity. Neuron 34, 275–288 (2002). [DOI] [PubMed] [Google Scholar]
- [25].Rivera-Alba M et al. Wiring economy and volume exclusion determine neuronal placement in the drosophila brain. Current Biology 21, 2000–2005 (2011). [DOI] [PMC free article] [PubMed] [Google Scholar]
- [26].Ventura-Antunes L, Mota B & Herculano-Houzel S Different scaling of white matter volume, cortical connectivity, and gyrification across rodent and primate brains. Frontiers in neuroanatomy 7, 3 (2013). [DOI] [PMC free article] [PubMed] [Google Scholar]
- [27].Bullmore E & Sporns O The economy of brain network organization. Nature Reviews Neuroscience 13, 336–349 (2012). [DOI] [PubMed] [Google Scholar]
- [28].Sporns O, Chialvo DR, Kaiser M & Hilgetag CC Organization, development and function of complex brain networks. Trends in Cognitive Sciences 8, 418–425 (2004). [DOI] [PubMed] [Google Scholar]
- [29].Barabási A-L & Albert R Emergence of scaling in random networks. Science 286, 509–512 (1999). [DOI] [PubMed] [Google Scholar]
Associated Data
This section collects any data citations, data availability statements, or supplementary materials included in this article.