

Summary
Phytophthora infestans is a devastating pathogen in agricultural systems. Recently, an RNA silencing suppressor (PSR2, ‘Phytophthora suppressor of RNA silencing 2’) has been described in P. infestans. PSR2 has been shown to increase the virulence of Phytophthora pathogens on their hosts. This gene is one of the few effectors present in many economically important Phytophthora species. In this study, we investigated: (i) the evolutionary history of PSR2 within and between species of Phytophthora; and (ii) the interaction between sequence variation, gene expression and virulence. In P. infestans, the highest PiPSR2 expression was correlated with decreased symptom expression. The highest gene expression was observed in the biotrophic phase of the pathogen, suggesting that PSR2 is important during early infection. Protein sequence conservation was negatively correlated with host range, suggesting host range as a driver of PSR2 evolution. Within species, we detected elevated amino acid variation, as observed for other effectors; however, the frequency spectrum of the mutations was inconsistent with strong balancing selection. This evolutionary pattern may be related to the conservation of the host target(s) of PSR2 and the absence of known corresponding R genes. In summary, our study indicates that PSR2 is a conserved effector that acts as a master switch to modify plant gene regulation early during infection for the pathogen's benefit. The conservation of PSR2 and its important role in virulence make it a promising target for pathogen management.
Keywords: effectors, evolution, oomycetes, small RNA silencing, tomato
Introduction
Phytophthora infestans is one of the most devastating plant pathogens and infects many crop species of the Solanaceae, including potato (Solanum tuberosum) and tomato (Solanum lycopersicum). Phytophthora species are hemibiotrophic pathogens, having a biotrophic, followed by a necrotrophic phase. During the biotrophic stage, the hyphae never invade the plant's cells, but acquire nutrients from their host using haustoria (Allen and Friend, 1983; Blackwell, 1953; Voegele et al., 2001). In the necrotrophic phase, the pathogens grow intracellularly and lyse the host cells to live on degraded compounds (van Kan, 2006). During the infection cycle, Phytophthora spp. employ different strategies to circumvent plant defence. In the first phase, Phytophthora spp. modulate the host immune system to suppress host‐induced cell death (Kelley et al., 2010). In the second phase, host cell death is promoted by the pathogen (Vleeshouwers and Oliver, 2014).
As with other plant pathogens, pathogenicity and virulence are determined by effector genes (Lo Presti et al., 2015; Oh et al., 2009). Effector proteins are secreted into the host cytoplasm and may transit to the host nucleus, where they modulate plant signalling and the plant's immune responses (Dou et al., 2008; Schornack et al., 2010; Whisson et al., 2007). Genome sequencing of several Phytophthora species has uncovered two major types of effector proteins in this pathogen lineage: the RxLR effectors, identified by the amino acid motif RxLR in the N‐terminus of the protein sequences (Rehmany et al., 2005), and the Crinkler effectors (CRN) (Torto et al., 2003). Genome‐wide comparison of many Phytophthora species has shown large expansions of RxLRs and CRNs within these species (Haas et al., 2009; Jiang et al., 2008; Stam et al., 2013; Tyler et al., 2006). Therefore, RxLRs and CRNs show high rates of gains and losses between species (Haas et al., 2009).
In addition to presence/absence variation, effectors typically show high rates of nucleotide substitution (Allen et al., 2004, 2008; Raffaele et al., 2010; Rehmany et al., 2005). Indeed, at some genes, the rates of non‐synonymous substitutions (changes that lead to amino acid differences) are even higher than the rates of synonymous substitutions (changes that do not lead to amino acid differences), suggesting that effectors are subjected to balancing selection (Allen et al., 2004; Oliva et al., 2015; Rehmany et al., 2005). In addition to harbouring sequence variation at functionally important effector loci, some pathogens show differential expression. Cooke et al. (2012) found that the highly aggressive P. infestans isolate 06_3928A expresses 1013 more genes than the weak isolate T30‐4 during infections on potato. Likewise, Qutob et al. (2013) showed transgenerational silencing of effector genes to avoid host detection. Taken together, the presence of copy number variation, high substitution rates, signatures of balancing selection and differential expression of effectors reveals the dynamic nature of pathogen adaptation.
The need to constantly avoid host detection and defence results in little overlap of the effector repertoire between species or even strains. In a comparison of three oomycete genomes, only four universal effector genes were found (Win et al., 2007). This represents 0.6%–2.7% of the effectors known in these species. The conservation of this small number of effectors probably reflects their essential role in virulence. One such effector, ‘Phytophthora suppressor of RNA silencing 2’ (PSR2), has been characterized recently (Qiao et al., 2013). PSR2 homologues have been detected in different Phytophthora species and even in Hyaloperonospora arabidopsidis (Xiong et al., 2014). As revealed by its name, PSR2 suppresses RNA silencing in the different hosts of Phytophthora spp. (Qiao et al., 2013; Xiong et al., 2014).
Small RNAs (sRNAs) are essential for the development and defence of plants (Bocarra et al., 2014; Carlsbecker et al., 2010); therefore, the manipulation of sRNA production can negatively affect a plant host. Mutants of the sRNA biogenesis machinery display severe developmental phenotypes (including lethality) or impairment in disease resistance against several pathogens (Hendelman et al., 2013; Kravchik et al., 2014; Pumplin and Voinnet, 2013). In addition, microRNAs (miRNAs) involved in resistance regulation have been identified as potential contributors to host adaptation (de Vries et al., 2015). Targeting this machinery may therefore be a means to undermine host resistance.
sRNAs can be formed in two related processes. In the primary step, double‐stranded RNA (dsRNA) is processed by Dicer‐like proteins (DCLs) into double‐stranded small interfering RNAs (siRNAs), or primary miRNA (pri‐miRNA) transcripts are processed into double‐stranded miRNAs (Kurihara and Watanabe, 2004; Rogers and Chen, 2013). siRNAs and miRNAs are incorporated into Argonaute proteins (AGOs) (Rogers and Chen, 2013). The loaded AGOs direct the sRNAs to complementary sequences of mRNA, where they form small stretches of dsRNA, which initiate mRNA degradation by AGOs (Rogers and Chen, 2013). In the secondary biogenesis step, the mRNA is not fully degraded by AGOs, but is cut into a specific pattern: RNA‐dependent RNA polymerase 6 (RDR6) recreates a dsRNA from the mRNA target, which is further processed by DCL4 again into siRNAs (Axtell et al., 2006; Chen et al., 2010; Cuperus et al., 2010). These siRNAs are usually generated in a 21‐nucleotide phased pattern, and are hence called phased siRNAs (phasiRNAs) (Allen et al., 2005; Yoshikawa et al., 2005; Zhai et al., 2011).
The expression of PSR2 in Arabidopsis thaliana led to a specific reduction in phasiRNAs (Qiao et al., 2013). Both Qiao et al. (2013) and Xiong et al. (2014) showed that overexpression of PSR2 enhances Phytophthora infection in several hosts and is therefore important for the virulence of oomycete pathogens. Although the exact mechanism by which PSR2 down‐regulates phasiRNAs remains unclear, these findings suggest that PSR2 targets an essential ubiquitous protein of the plant RNA silencing machinery; a target shared across many potential host species may explain the widespread conservation of PSR2 across species of Phytophthora.
To better understand the evolutionary history of PSR2, we investigated this gene in the late blight pathogen P. infestans using well‐established population genetic methods. We also evaluated the expression of the P. infestans PSR2 gene (PiPSR2) across different isolates during infection of S. lycopersicum and its closely related sister species Solanum pimpinellifolium. Although the presence of PSR2 is conserved at the species and isolate level, the PSR2 protein has evolved in a lineage‐specific manner. We found that PiPSR2 shows a significantly elevated rate of amino acid polymorphism in P. infestans relative to PSR2 in Phytophthora sojae (PsPSR2). Nevertheless, PiPSR2 still shows signatures of purifying selection, in agreement with a conserved host target. Furthermore, we found that PiPSR2 is expressed during the biotrophic phase, suggesting a role in the establishment of infection. Further, symptom development was negatively correlated with the expression of PiPSR2. We hypothesize that PSR2 acts as a master modulator of plant signalling to disrupt plant physiology at the site of infection.
Results
PSR2 is widespread across species of Phytophthora
PSR2 is a rare example of an effector gene that is present in many plant pathogens of the peronosporalien oomycete lineage (Win et al., 2007; Xiong et al., 2014). However, this does not preclude the possibility of presence/absence variation within species. To determine whether the presence of this gene was also conserved below the species level, we surveyed 19 isolates of P. infestans from Europe, the Americas and Africa, combining traditional molecular methods and genomic analyses. We detected the PiPSR2 gene in all isolates. Furthermore, all detected PiPSR2 sequences were full length compared with the reference sequence and no premature stop codons were found. In addition, we evaluated four P. sojae isolates (Wang et al., 2011) for the presence of PsPSR2, and found that all tested isolates possessed the full‐length gene. In our analysis of five well‐characterized datasets of Phytophthora parasitica isolates, we detected a recent duplication of the P. parasitica PSR2 gene (PpPSR2) after the split between P. parasitica and P. infestans (Fig. S1, see Supporting Information). All P. parasitica isolates possessed at least one PSR2 duplicate.
Differences in protein variation across species
Given that P. parasitica showed recent gene duplication of PSR2, we hypothesized that PSR2 may have evolved in a lineage‐specific manner. Therefore, we evaluated the sequence diversity of alleles within three Phytophthora species. Alleles of PSR2 from different isolates of P. sojae were 100% identical at the protein level. Alleles of P. infestans were 99.4% identical at the protein level, whereas the alleles of P. parasitica were 95.3% identical for copy A and 92.8% identical for copy B proteins.
Despite maintenance of the PSR2 gene, amino acid polymorphism is elevated within species
We evaluated the sequence variation within PiPSR2 in 16 of the 19 isolates of P. infestans. The N‐terminus encoding the signal peptide and the translocation motif had a higher average pairwise nucleotide diversity (π) than the full‐length gene or the C‐terminus alone (Table 1). To determine whether the patterns of sequence variation at PSR2 were typical for these isolates, we analysed the sequence variation in a subset of six to eight isolates at three reference genes: elongation factor 1α (PiElf1α), ATP synthase subunit δ (PiATP5D) and Argonaut1 (PiAGO1). PiAGO1 had the lowest overall π of the three genes, whereas PiAT5D had the lowest non‐synonymous variation (πa = 0.00; Table 1). Relative to these reference genes, πa was elevated for PiPSR2 in both the 16‐ and eight‐isolate set. Furthermore, PiPSR2 had the highest number of segregating sites and a high ratio of πa to πs. Although the ratio of πa/πs across the entire gene was not greater than unity, πa/πs was higher at PiPSR2 than at PiATP5D and PiElf1α. Furthermore, although the ratio of πa/πs for PiAGO1 was similar to that of PiPSR2, PiAGO1 had few segregating sites (four) compared with PiPSR2 (27).
Table 1.
Population genetic analyses of the Phytophthora infestans PSR2 gene (PiPSR2) and reference genes.
| Gene | Dataset | No. of individuals | Analysed region | π total* (sites)† | πs * (sites)† | πa * (sites)† | πa/πs | S ‡ (nonsyn, syn) | Haplotype diversity | McDonald–Kreitman G value (P) |
|---|---|---|---|---|---|---|---|---|---|---|
| PiPSR2 | Full‐length | 1–2322 | 2.27 (2283) | 3.54 (526.9) | 1.90 (1753.1) | 0.535 | 27 (20, 7) | 0.983 | 4.427 (0.04) | |
| N‐terminus | 16 | 1–186 | 4.84 (186) | 11.47 (49.0) | 2.30 (137.0) | 0.200 | 5 (3, 2) | 0.650 | 0.028 (0.87) | |
| C‐terminus | 187–2322 | 2.05 (2097) | 2.81 (478.0) | 1.83 (1616.0) | 0.650 | 22 (17, 5) | 0.967 | 5.274 (0.02) | ||
| PiPSR2 | Full‐length | 8¶ | 1–2322 | 1.64 (2283) | 3.73 (526.9) | 1.02 (1753.1) | 0.273 | 10 (6, 4) | 0.929 | 0.358 (0.55) |
| ATP synthase subunit δ | Full‐length | 6¶ | 1–510 | 2.00 | 8.83 | 0.00 | 0.000 | 2 (0, 2) | 0.533 | Nd |
| AGO1 | Full‐length | 8¶ | 1–2784 | 0.55 | 1.00 | 0.41 | 0.407 | 4 (2, 2) | 0.821 | Nd |
| Elf1α | Partial | 7¶ | 304–1173 | 6.68 | 24.60 | 0.87 | 0.035 | 12 (1, 11) | 1.000 | Nd |
Nd, not determined.
*All π values times 10−3.
†Total number of sites analysed excluding gaps.
‡Number of segregating sites.
¶Isolates from the Yoshida et al. (2013) dataset.
Bold values indicate tests with a P < 0.05.
An elevated πa/πs ratio can be an indication of either relaxed selective constraint or balancing selection maintaining distinct protein variants. Therefore, we conducted a McDonald–Kreitman test (McDonald and Kreitman, 1991) to determine whether the nucleotide patterns differed from the expectations under neutrality (Tables 1 and S1, see Supporting Information). According to this test, the variation at PiPSR2 deviated from neutral expectations. Replacement polymorphisms within P. infestans at PiPSR2 were significantly elevated relative to the expectation under neutrality (Tables 1 and S1). To better visualize the evolution of this gene within P. infestans, we mapped the amino acid changes of PiPSR2 onto the phylogeny of nine isolates for which the complete mitochondrial genome was available (Fig. S2, see Supporting Information). Nearly all protein substitutions mapped to the tips of the mtDNA tree and the accumulation of amino acid differences in PSR2 did not correlate with the branch lengths of the mtDNA tree (Fig. S2).
Amino acid variation across PiPSR2 secondary structure
To better understand how the protein variation was distributed across both the PiPSR2 protein and individuals of this species, we evaluated the location of the amino acid polymorphisms on the predicted secondary structure of PiPSR2. The overall secondary structure was conserved across the PiPSR2 alleles of P. infestans; all alleles were predicted to contain an N‐terminal signal peptide and 40 consecutive α‐helices (Fig. 1). Of the amino acid polymorphisms, 45% were found within predicted α‐helices (Fig. 1). Among the 20 observed amino acid polymorphisms, 14 encoded radical changes, involving differences in polarity, charge or amino acid structure. Of these 14 radical changes, five involved proline residues, which can have a strong effect on protein structure. As PSR2 has been suggested to affect a step in sRNA biogenesis that takes place in the cytosol (Bologna and Voinnet 2014; Qiao et al., 2013) and hydrophobic residues generally reduce protein solubility in water, we investigated the distribution of hydrophobic residues in PiPSR2. Approximately 42% of the residues in the T30‐4 reference allele were hydrophobic. Of the 20 polymorphic positions, 12 involved a hydrophobic residue (35%, Fig. 1). Seven of these polymorphisms were radical changes. With the exception of L283S, each of these radical changes was a singleton polymorphism in our sample (i.e. the substitution was only found in one individual).
Figure 1.
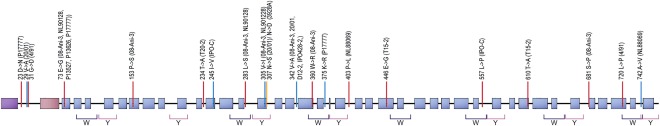
Secondary structure of the Phytophthora infestans RNA silencing suppressor PSR2 (PiPSR2). The consensus sequence of PiPSR2 has a predicted signal peptide (purple box) and 40 α‐helices (blue boxes). The RxLR‐dEER motif (light pink box) lies within amino acids 47–62. Polymorphic residues with similar chemical properties (blue lines); radical changes (red lines); isolates carrying the minor allele are given in parentheses above the residues. Predicted W and Y motifs are shown below the structure.
We identified several mutations that were radical and were assumed to have an influence on protein structure. Yet, the overall protein structure was predicted to be conserved across all isolates. Effectors of oomycetes often have W and Y motifs in their protein sequence (Boutemy et al., 2011; Jiang et al., 2008). These motifs confer a certain robustness to the protein structure, allowing for adaptive mutations to occur within them without compromising protein functionality (Boutemy et al., 2011; Jiang et al., 2008). Ye and Ma (2016) identified that PSR2 homologues possess several W and Y motifs. Here, we manually searched for these motifs and predicted motifs using MAST. We found 16 W‐like sequences and 17 Y‐like sequences in PiPSR2. However, only seven sequences per motif contained 50% or more of the residues previously described in Jiang et al. (2008) and Boutemy et al. (2011) (Fig. 1). The seven W‐like motifs were also identified by three MAST motifs (Fig. S3, see Supporting Information), suggesting a total of three W‐motif types. The remaining W‐like sequences were distributed over two to three MAST motifs. Six of seven Y‐like motifs were located within a few amino acid positions following the W‐like motifs or partially overlapped with the W‐like motifs, in agreement with the observations of Boutemy et al. (2011). All Y‐like motif types were either distributed over two MAST motifs or present nearly completely in one MAST motif (Fig. S3). We only considered the conservative W and Y motifs for further analyses. Six amino acid polymorphisms mapped to four W motifs and three amino acid polymorphisms mapped to two Y motifs. One polymorphism was shared between a W‐ and Y‐like motif. In total, 40% of the amino acid polymorphisms mapped to either a W or Y motif.
Relationship between symptom strength and PiPSR2 sequence
To test whether allelic variation of the PiPSR2 protein was associated with the strength of symptoms caused by P. infestans on cultivated tomato, we conducted inoculations of seven P. infestans isolates on S. lycopersicum cv. Moneymaker and evaluated the symptom strength at 3 days post‐inoculation (dpi). Symptom strength was quantified by calculating the relative leaflet area covered in necrotic lesions following inoculation. The ranking of the isolates based on symptom strength was as follows: NL10001/NL88069 < T20‐2 < NL90128 < IPO‐C/T15‐2/D12‐2 (Fig. 2a). No correlation between symptom strength and allelic sequence of PiPSR2 was detected (Fig. 2b).
Figure 2.
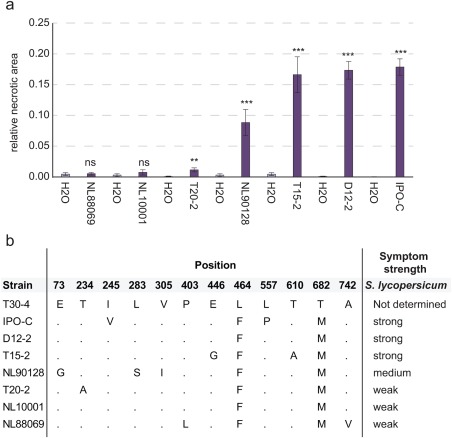
Correlation of symptom strength with PSR2 sequence variation. (a) Relative necrotic area of seven Phytophthora infestans isolates on Solanum lycopersicum cv. Moneymaker (dark purple); mock control (light purple). Significance was determined using a two‐tailed t‐test (ns, not significant; *P < 0.05; **P < 0.01; ***P < 0.001; n leaflets = 33–162). (b) Polymorphic amino acid positions at PSR2 in the investigated isolates. ‘•’ indicates where the allele matches the reference allele T30‐4. Symptom strength is given to the right of the alignment.
Relationship between symptom development and PiPSR2 expression
Although multiple protein variants of PiPSR2 segregated in P. infestans and isolates varied in their ability to produce symptoms on tomato, protein variation alone could not explain the variation in virulence. In addition to the primary sequence, differences in gene expression may also contribute to pathogen virulence. To determine whether PiPSR2 gene expression affected virulence, we performed inoculations on two closely related host species (S. lycopersicum and S. pimpinellifolium) with weak and strong isolates of P. infestans. Based on our previous experiment, T20‐2 was chosen as a weak isolate, and IPO‐C and D12‐2 as strong isolates (Fig. 2b). Pathogen abundance (evaluated by molecular markers) and the extent of the relative necrotic area were determined at multiple time points. In general, all isolates showed an increase in the relative necrotic area over time in both hosts, and this correlated with pathogen abundance, as assayed by quantitative reverse transcription‐polymerase chain reaction (qRT‐PCR) (Figs 3, S4 and S5, see Supporting Information). We also noticed that IPO‐C caused slightly more symptoms than D12‐2. However, the hosts differed in their specific responses to these pathogens. The patterns of necrotic lesions were dispersed around the veins in S. lycopersicum, whereas the lesions were concentric around the point of inoculation in S. pimpinellifolium (Figs 3a and S4). In addition, S. lycopersicum showed a larger relative necrotic area than S. pimpinellifolium in infections with strong isolates, whereas S. lycopersicum showed a smaller necrotic area than S. pimpinellifolium in infections with weak isolates (Figs 3a,b and S5).
Figure 3.
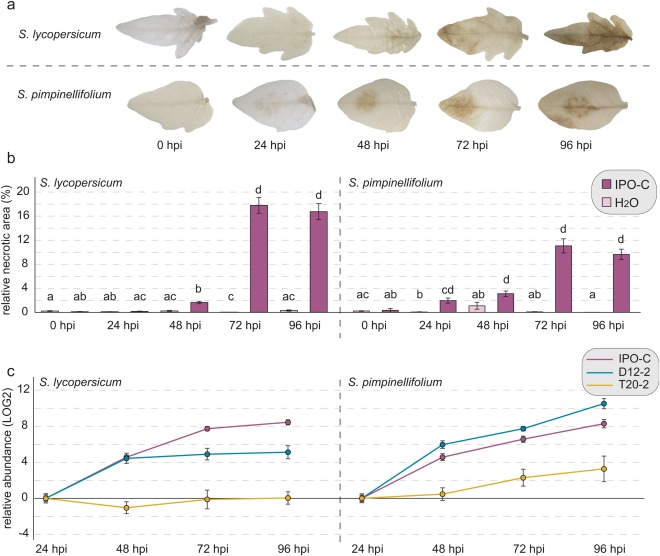
Progression of infection by Phytophthora infestans isolate IPO‐C. (a) Representative leaflets of the infection by P. infestans IPO‐C from 0 to 96 h post‐inoculation (hpi) on Solanum lycopersicum and S. pimpinellifolium. (b) Relative necrotic area of IPO‐C infection in S. lycopersicum and S. pimpinellifolium from 0 to 96 hpi. Letters correspond to the different statistical groups (P < 0.05) based on a Kruskal‐Wallis test with a Tukey post‐hoc test [n leaflets = 56–119 (S. lycopersicum); n leaflets = 77–127 (S. pimpinellifolium)] within species. (c) Relative abundance of P. infestans isolates IPO‐C (purple), D12‐2 (blue) and T20‐2 (yellow) over time in both hosts, determined via quantitative reverse transcription‐polymerase chain reaction (qRT‐PCR) as the average relative expression of the genes PiH2a and PiElf1α normalized to the plant host gene TIF3H. Error bars correspond to the standard error of the mean (SEM).
To determine whether a smaller necrotic area at a given time point corresponded to a delay in the transition of the pathogen from biotrophy to necrotrophy, we analysed the presence of important anatomical structures, such as haustoria and sporangia, across samples (Fig. 4a–f). Haustoria were present early in infections and continued to increase as the pathogen spread. Nevertheless, at 96 h post‐inoculation (hpi), a reduction in haustoria was visible for some infections (Figs 4g and S6a, see Supporting Information). Sporangia appeared later in the infection and indicated the transition to necrotrophy. In infections with the strong isolate, IPO‐C, on both hosts, haustoria were detected at all time points. By 72 hpi, each assayed leaflet had at least one haustorium (Fig. 4g). Sporangia occurred first at 72 hpi in all infections (Figs 4g and S6). We therefore inferred that the transition of IPO‐C from biotrophy to necrotrophy occurred between 48 and 72 hpi. Semi‐quantitative RT‐PCR analyses of marker genes specific for the biotrophic and necrotrophic phases were consistent with this time of transition (Fig. 4h,i). The other strong isolate, D12‐2, showed a pattern similar to IPO‐C, although fewer leaflets contained haustoria in both hosts at each time point and fewer leaflets of S. pimpinellifolium showed sporangia at 72 and 96 hpi (Fig. S6a), indicating a delay in transition in some leaflets of S. pimpinellifolium. For the weak isolate, T20‐2, there were fewer haustoria at 48 hpi compared with the strong isolates (Fig. S6b). These haustoria were also immature, whereas the strong isolates produced many more mature haustoria from 48 hpi onwards. In addition, only few sporangia were detected at 72 and 96 hpi. This indicates that the weak isolate, T20‐2, shows a delayed development and transition from the biotrophic to the necrotrophic phase in both hosts.
Figure 4.
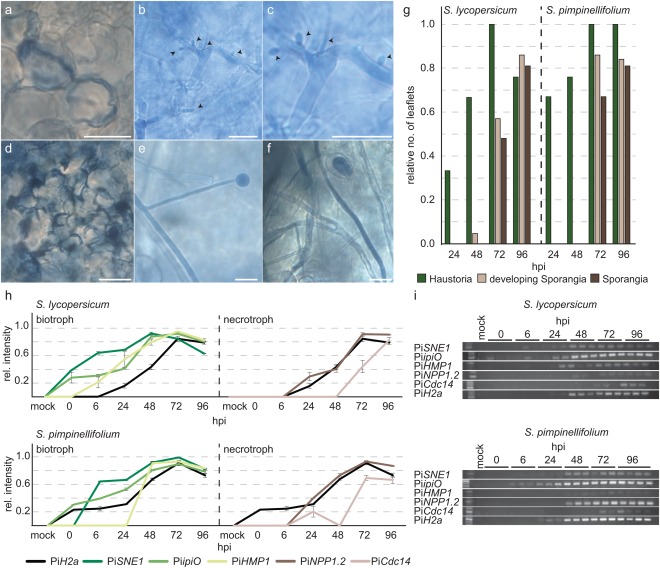
Phytophthora infestans infection and life cycle. Trypan blue staining of leaflets with P. infestans shows an encysted zoospore infecting Solanum pimpinellifolium cells (a), P. infestans hyphae with haustoria (b, c), necrotic cells in S. lycopersicum (d), developing sporangia (e) and hyphae and mature sporangia (f). Scale bars, 0.02 mm. (g) The relative number of leaflets with haustoria (green), developing sporangia (beige) and mature sporangia (brown) in S. lycopersicum and S. pimpinellifolium infected with P. infestans IPO‐C at 24–96 h post‐inoculation (hpi) (n leaflets = 21–31). (h, i) Relative intensity of marker genes for the biotrophic and necrotrophic phase from 24 to 96 hpi in S. lycopersicum and S. pimpinellifolium infected with P. infestans IPO‐C. Error bars show the standard error of the mean (SEM).
The earliest detection of PiPSR2 expression was from 24 hpi onwards, i.e. when the infection was fully established. The average CT values over time for PiPSR2 were 34.32 ± 1.65 for the weak isolate (T20‐2) and 30.69 ± 2.23 for IPO‐C and 31.56 ± 2.62 for D12‐2 (the strong isolates). These values indicate that PiPSR2 shows moderately low expression during infection and suggest that the weakest isolate has the lowest PiPSR2 expression. However, as the biomass of the three isolates varied, the expression of PiPSR2 was normalized to the expression of the biomass markers, PiH2a (histone 2a) and PiElf1α. Following appropriate normalization against the biomass markers, we found that, at most time points, D12‐2 and T20‐2 showed significantly higher relative expression levels relative to IPO‐C in both hosts (Fig. 5). In addition, T20‐2 often showed significantly higher expression levels than D12‐2 (Fig. 5). This negatively correlates with the extent of symptoms caused by the isolates, suggesting that higher PiPSR2 expression is associated with reduced virulence (Figs 3, 5 and S5).
Figure 5.
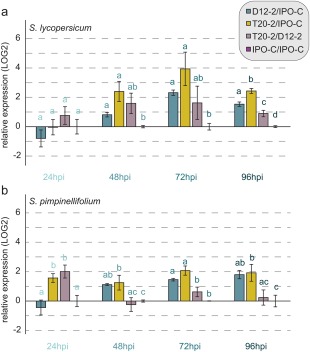
Expression differences of the Phytophthora infestans PSR2 gene (PiPSR2) in the different isolates. Pairwise relative expression of PiPSR2 on Solanum lycopersicum (a) and S. pimpinellifolium (b) at 24, 48, 72 and 96 h post‐inoculation (hpi). Expression was measured using quantitative reverse transcription‐polymerase chain reaction (qRT‐PCR). For normalization, the reference genes PiH2a and PiElf1α were used. Error bars indicate the standard error of the mean (SEM). Significance classes are given as letters above the bar graph. Significance was calculated within one time point.
To test whether a correlation between expression and symptom strength was present for other effectors, we analysed the expression of a CRN effector gene, PITG12646, in these isolates (Fig. S7, see Supporting Information). At nearly all time points, PITG12646 showed the highest expression in the strong isolate D12‐2, whereas the expression of PITG12646 was lower and similar in the other two isolates. Therefore, the correlation between symptom strength and expression is specific to the effector assayed.
PiPSR2 is expressed during biotrophy
Effectors can be expressed constitutively throughout infection or in a life stage‐dependent manner (Judelson et al., 2008; Jupe et al., 2013). Therefore, we hypothesized that PiPSR2 expression might differ between isolates that showed different transition times and symptom development. The patterns of PiPSR2 expression were dependent on both the pathogen isolate and host genotype (Fig. 6). For each pathogen strain, differences in PiPSR2 expression across time points were not detected, indicating more or less constant expression from 24 hpi onwards (Table S2, see Supporting Information). The only exception was IPO‐C, for which PiPSR2 expression was significantly down‐regulated in both hosts at 72 hpi relative to 24 hpi (Table S2). This indicates that PiPSR2 expression is highest in the biotrophic phase of IPO‐C and decreases as the pathogen transitions into necrotrophy, whereas, in the other pathogen strains, PiPSR2 expression stays constant during infection. For IPO‐C and T20‐2, the relative expression of PiPSR2 over time was negatively correlated with biomass (IPO‐C–S. lycopersicum: ρ = −0.68, P = 4.341 × 10⁻⁶; IPO‐C–S. pimpinellifolium: ρ = −0.67, P = 6.986 × 10⁻⁶; T20‐2–S. lycopersicum: ρ = −0.87, P = 3.009 × 10⁻¹¹; T20‐2–S. pimpinellifolium: ρ = −0.78, P = 1.450 × 10⁻⁸).
Figure 6.
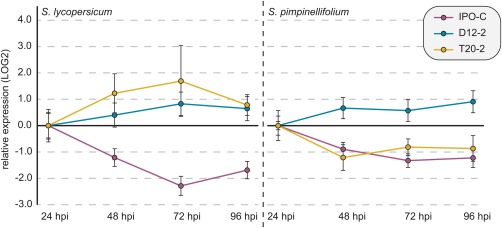
Relative expression of Phytophthora infestans PSR2 gene (PiPSR2). Relative expression of PiPSR2 from IPO‐C (purple), D12‐2 (blue) and T20‐2 (yellow) from 24 to 96 h post‐inoculation (hpi) in Solanum lycopersicum and S. pimpinellifolium determined via quantitative reverse transcription‐polymerase chain reaction (qRT‐PCR). PiPSR2 expression was normalized using the reference genes PiH2a and PiElf1α. Error bars indicate the standard error of the mean (SEM).
Isolate‐specific and host‐specific effects on PiPSR2 expression
In S. lycopersicum, PiPSR2 expression was significantly different between IPO‐C and either D12‐2 or T20‐2 (Fig. 6a, Table S2). However, in S. pimpinellifolium, PiPSR2 expression was significantly different between D12‐2 and either IPO‐C or T20‐2 (Fig. 6b, Table S2). In summary, depending on the pathogen and host combination, PiPSR2 expression is either elevated in the biotrophic phase or constant over time, but never elevated during the transition from biotrophy to necrotrophy or during the necrotrophic phase.
Discussion
PiPSR2 has evolved under purifying selection
PSR2 is one of two recently identified oomycete RNA silencing suppressors (Qiao et al., 2013). The presence and function of PSR2 are conserved across many species of Phytophthora (Xiong et al., 2014). Overexpression of PSR2 enhances the virulence of Phytophthora spp. independent of the pathogen–host system (Xiong et al., 2014). These observations, together with our detection of full‐length alleles within all P. infestans isolates analysed, underscore the probable biological importance of PSR2 as a virulence factor in Phytophthora. Therefore, the observed elevated rate of amino acid evolution within P. infestans is at odds with the strong functional conservation at higher taxonomic levels. Elevated protein polymorphism relative to divergence (as observed for PiPSR2) can be observed under two contrasting evolutionary scenarios: either the protein has evolved under a relaxed selective constraint or natural selection has maintained alternative protein variants (Li, 1997). Under the latter scenario of balancing selection, polymorphisms are typically maintained at intermediate frequency in the population. The presence of many singleton mutations observed at PiPSR2 is therefore inconsistent with predictions of balancing selection. However, the fact that πa/πs is still less than unity indicates that the gene has not evolved completely devoid of selective constraint. Furthermore, all alleles, despite their amino acid differences, are predicted to encode a common secondary structure made up of consecutive α helices, and PiPSR2 was expressed in every isolate tested. These observations point towards the presence of continued functional constraint on the gene, despite the high rate of amino acid evolution. One possible explanation is that certain structurally conserved features of PiPSR2 compensate for the accumulation of additional amino acid changes. For example, PiPSR2 contains multiple W and Y motifs, also present in other effector molecules (Boutemy et al., 2011; Jiang et al., 2008). The W and Y motifs provide structural integrity to an effector protein (Boutemy et al., 2011). Hence, the presence of these motifs in PiPSR2 could provide robustness and thus release the selective constraint at other positions in the molecule. In agreement with this, Jiang et al. (2008) showed that the W and Y motifs are enriched for adaptive mutations. As P. infestans has a broad host range, these alternative protein variants may contribute to virulence on different hosts. However, based on our analysis of two closely related tomato species, no relationship between symptom strength and PiPSR2 sequence was detected. Based on these observations, we conclude that purifying selection has probably dominated the evolution of PiPSR2 and that the elevated protein polymorphism within P. infestans could be related to specific features of this pathogen, such as its wide host range and nearly world‐wide distribution. The within‐species protein variation of PsPSR2, PpPSR2 and PiPSR2 further supports the role of host range in PSR2 evolution. All PsPSR2 sequences were identical and P. sojae showed the smallest host range, with only soybean as its host (Crawford et al., 1996; Kuan and Erwin, 1980; Pratt, 1981). PiPSR2 showed more variation than PsPSR2 and P. infestans can infect many Solanaceae (Adler et al., 2002; Flier et al., 2003; Garry et al., 2005). Phytophthora parasitica has the broadest host range of these three species (72 plant species from different families; Hickman, 1958). PpPSR2 had not only the highest variation within the protein, but also showed a recent duplication after the split of P. parasitica and P. infestans. Hence, it is possible that host range is a driver of PSR2 evolution.
Variation in expression of PiPSR2 is correlated with virulence
Although sequence variation in P. infestans at the PiPSR2 gene did not correlate with virulence in the cultivar S. lycopersicum cv. Moneymaker, expression variation was correlated with symptom development. We found that PiPSR2 peaked early during the biotrophic phase and decreased as P. infestans biomass increased. Down‐regulation of PiPSR2 was greatest in the most aggressive strains. This is in contrast with the findings of Xiong et al. (2014). In that study, transient overexpression of PSR2 in planta increased the virulence of several Phytophthora species on their hosts. One possible explanation for these contrasting observations could be that, although high expression is advantageous in planta, it may not be advantageous within the pathogen itself. It is possible that high expression of PiPSR2 could lead to off‐targeting within the pathogen. In a different study, Wang et al. (2011) reported that aberrant expression of effector genes (either too high or too low) by the pathogen decreased pathogen virulence.
The change in expression over time was not only correlated with virulence, but was also pathogen and host dependent. In P. sojae, PsPSR2 showed its highest expression when P. sojae entered the transition phase (Xiong et al., 2014), whereas PiPSR2 showed either constant expression over time or elevated expression in the early biotrophic phase. However, we did not observe an up‐regulation of the effector in the necrotrophic phase. Isolate‐specific differences in effector gene regulation could be caused by self‐regulation by pathogens (Åsman et al., 2016; Fahlgren et al., 2013; Vetukuri et al., 2012). Silencing of effector genes to avoid specific recognition and resistance has been observed for the PsAvr3a locus (Qutob et al., 2013). Hence, pathogens may also show differential effector regulation depending on the host to avoid recognition. This may be of particular importance for a conserved effector gene, such as PSR2.
PSR2 may act as a master regulator of host cell signalling
The PSR2 protein is known to suppress phasiRNA production (Qiao et al., 2013). However, Qiao et al. (2013) demonstrated that only specific types of phasiRNA were affected. These phasiRNAs are produced via the one‐hit model, which means that they only require one miRNA to bind to a target as a trigger for phasiRNA production (Chen et al., 2010; Cuperus et al., 2010; Fei et al., 2013). This requires a different subset of the phasiRNA machinery than when two miRNAs are required to initiate phasiRNA production (Adenot et al., 2006; Axtell et al., 2006; Fei et al., 2013). The machinery specific for one‐hit phasiRNA production is also responsible for phasiRNA production from R genes, which can act in cis and trans (Zhai et al., 2011), suggesting that these phasiRNAs could be affected by PSR2 expression. An up‐regulation of PSR2 in the biotrophic phase would result in a down‐regulation of phasiRNA production early in infection, together with a corresponding up‐regulation of R genes. A pathogen expressing PSR2 would therefore release the negative regulation on R genes, which seems selectively disadvantageous and inconsistent with the observed virulence benefit demonstrated for this protein. However, in addition to targeting R genes, targets of phasiRNAs are essential for cellular processes, including auxin signalling, nutrient signalling, flower and leaf development (Adenot et al., 2006; Allen et al., 2005; Hsieh et al., 2009; Zhai et al., 2015; Zheng et al., 2015). As such, down‐regulation of phasiRNA production should have profound effects on development and nutrient signalling, and these changes may be advantageous to the pathogen.
There may also be another advantage of PSR2, especially for broad‐host‐range pathogens. Although hosts may differ in which genes are specifically regulated by phasiRNAs (Zheng et al., 2015), the pathogen short circuits this form of negative regulation by targeting the biogenesis machinery, rather than specific phasiRNAs. This sudden release of multiple genes simultaneously from their negative regulation is likely to have a substantial effect on the host cell, probably to the pathogen's advantage, and may explain the widespread presence and functional conservation across many oomycetes (Xiong et al., 2014). We therefore hypothesize that up‐regulation of PiPSR2 in the early phase functions to massively deregulate many otherwise repressed genes in the plant cell. Genes typically under repression would include genes controlling plant functions which require rapid transcriptional responses, for instance to an unpredictable stimulus (such as pathogens), and/or genes associated with tissue‐specific expression, such as many developmental processes (Carlsbecker et al., 2010; Shivaprasad et al., 2012; Zhai et al., 2015). The advantages of targeting the entire population of phasiRNAs simultaneously through a master regulator probably outweigh the cost of potentially releasing some R genes from negative regulation.
Experimental Procedures
Plant and pathogen material
Seeds of S. lycopersicum cv. Moneymaker and S. pimpinellifolium LA0114 were surface sterilized (3 s in 70% ethanol; 30 s in ∼5% NaOCl; three times for 3 min in sterile water). Seeds were placed on 1.2% H2O–agar, incubated in the dark for 3 days [day/night temperature cycle of 18°C/15°C (16 h/8 h)] and transferred to a cycle of 16 h (166 ± 17 µmol quanta/m2/s) light and 8 h dark with equal temperature conditions. At 9 days post‐planting (dpp), the seedlings were transferred to vessels (three to four seedlings per vessel) with 0.5% Murashige and Skoog (MS) medium (Murashige and Skoog, 1962) containing 1% sucrose.
Thirteen isolates of P. infestans (NL10001, NL88069, NL90128, IPO‐C, IPO428‐2, 3928A, D12‐2, T15‐2, T20‐2, T30‐4, 4/91, 20/01 and 08‐ANI‐3) were grown on rye–sucrose agar with 100 µg/mL ampicillin, 10 µg/mL amphotericin B and 20 µg/mL vancomycin (Caten and Jinks, 1968). The plates were incubated at 18°C in the dark, with the exception of T20‐2, which was incubated at 12°C in the dark.
Cloning and sequencing of PiPSR2
Phytophthora infestans mycelium was sampled directly from the plate, shock frozen in liquid nitrogen, ground using metal beads and DNA was extracted according to Edwards et al. (1991). PiPSR2 genes were amplified using 1 U Platinum® Taq DNA polymerase High Fidelity (Thermo Scientific, Invitrogen, Carlsbad, CA, USA.), 0.1 mm deoxynucleoside triphosphate (dNTPs), 2 mm MgSO4, 0.5 μm primers (Table S3, see Supporting Information) and 100–200 ng template DNA. The PCR included 3 min at 94°C, 35 cycles of 30 s at 94°C, 30 s at 58°C, and 3 min at 68°C followed by 5 min at 68°C. Primers were designed manually to match the flanking regions of the PiPSR2 open reading frame. PCR products were purified using the peqGOLD Cycle‐Pure Kit (Peqlab, Erlangen, Germany) and cloned into a pCRTM4‐TOPO® plasmid using the TOPO® TA Cloning® Kit for Sequencing (Invitrogen, Carlsbad, CA, USA).
Plasmid DNA was extracted using a QIAprep Spin Miniprep Kit (Qiagen, Hilden, Germany) or the NucleoSpin Plasmid Kit (Macherey‐Nagel, Dueren, Germany). PiPSR2 genes were sequenced at Eurofins MWG Operon (Ebersberg, Germany). Primers to close the gaps in the sequences were designed manually (Table S3).
Quality control of PiPSR2 sequences
To verify the cloned sequences, we performed a blastn search (Camacho et al., 2009) against the P. infestans reference genome (Haas et al., 2009) at the National Center for Biotechnology Information (NCBI). Only sequences which resulted in PiPSR2 as the best hit and showed full‐length coverage and an e‐value of 0 were used for further analyses. In addition, we confirmed that the cloned PiPSR2 sequences were predicted to encode a full‐length amino acid sequence using the ‘translate’ function of ExPASy (Gasteiger et al., 2003) or the Sequence Manipulation Suite (Stothard, 2000). NCBI accessions are given in Table S4 (see Supporting Information).
Extraction of PSR2 and reference gene sequences
We downloaded raw sequence data of six P. infestans genomes (DDR7602, P13626, P13527, P17777, NL07434 and LBUS5; Yoshida et al., 2013) from NCBI (Table S5, see Supporting Information) and used Trinity v. 2.0.6 (Grabherr et al., 2011) to de novo assemble the genomes. We conducted blastn using blast v. 2.2.30+ with the PiPSR2 nucleotide sequence (PITG15152) from the P. infestans reference genome against the de novo assemblies. The putative PiPSR2 hits were aligned with the PiPSR2 reference sequence to identify the correct genes (File S1, see Supporting Information).
We retrieved P. sojae sequences from Wang et al. (2011) and P. parasitica sequences using blastp with the T30‐4 PSR2 protein sequence at NCBI using the following cut‐off: query coverage of >90%, identity of >90% and e‐value of zero (Table S5).
Reference gene sequences were extracted from the Yoshida et al. (2013) dataset, also including 06_3928A, corresponding to isolate 3928A in our laboratory cultures. The reference genes were PiATP5D, PiElf1α (partial) and PiAGO1.
PSR2 amino acid identity
We calculated pairwise amino acid identity using the ‘ident’ function from the Sequence Manipulation Suite. Alignments were created with MAFFT v. 7.127b (Katoh and Standley, 2013) using local pairwise alignment setting L‐INS‐I. PpPSR2 from P. parasitica P10297 was excluded because the sequence was partial.
Population genetic analyses
The PSR2 and reference sequence datasets were aligned using the clustal‐w function in mega v. 5.2.2 (Tamura et al., 2011; Figs S8–S11, see Supporting Information) with PsPSR2 as the outgroup. Basic summary statistics and tests of neutrality were conducted using DnaSP v. 5.10 (Librado and Rozas, 2009). D12‐2, T15‐2 and T20‐2 were excluded from the analyses, because they belong to the same breeding population as T30‐4 (Drenth et al., 1995).
Phylogenetic analysis
We downloaded available mitochondrial sequences from the supplemental data of Martin et al. (2016). Sequences were aligned with MAFFT v. 7.127b using the L‐INS‐I settings. We built a maximum likelihood phylogeny (Tamura–Nei model, 1000 bootstraps, uniform rates and partial deletion with a cut‐off of 99%) using mega v. 5.2.2.
Protein structure prediction
PiPSR2 secondary structure was predicted via PREDISI (Hiller et al., 2004) and PSIPRED (Jones, 1999) in the Quick2D bioinformatics toolkit (Biegert et al., 2006). The consensus structure was calculated from the average confidence value of an amino acid in the α‐helix, considering only residues with average confidence values >5. W and Y motifs were identified by combining manual (using motif variants from Jiang et al. (2008) and Boutemy et al. (2011) as references) and MAST v. 4.11.2 (Bailey and Gribskov, 1998) searches; settings were as follows: normal mode, zero‐order model of sequences, searching the given strand and returning up to 20 motifs with any given number of repetitions.
Plant inoculations
We used seedlings of S. lycopersicum cv. Moneymaker to compare the pathogen strengths of seven different P. infestans isolates (NL10001, NL88069, NL90128, IPO‐C, D12‐2, T15‐2 and T20‐2). Zoospores were isolated from 3–4‐week‐old P. infestans mycelium by incubating the mycelium with 10 mL H2O (4°C) for at least 2 h. Spore concentrations were determined using a Neubauer improved chamber and 5 × 10⁴ spores/mL were used. For NL10001 and NL90128, a spore concentration of 2 × 10⁴ was used, because they yielded fewer zoospores. Seedlings were inoculated at 28–30 dpp with 10 µL of 4°C zoospore solution (i) or H2O (mock control) (ii) per leaflet. All solutions were kept on ice during the procedure. We sampled three replicates at 72 hpi.
Solanum lycopersicum cv. Moneymaker and S. pimpinellifolium LA 0114 were inoculated with P. infestans IPO‐C, D12‐2 and T20‐2 at 28–30 dpp as described above using 5 × 10⁴ spores/mL. We sampled three replicates per time point (0, 24, 48, 72 and 96 hpi). Solanum pimpinellifolium–IPO‐C at 96 hpi had four replicates.
Evaluation of necrotic area
Host symptoms and P. infestans spread were evaluated by measuring the relative necrotic area. We assessed bleached (100% ethanol) leaflets with a SteREO Discovery V8 binocular (AxioCam ICc 5 camera; Zeiss, Goettingen, Germany). The areas of the leaflets and the necrotic lesions were measured with ZEN lite 2012 (blue edition) software (Zeiss, Goettingen, Germany). To calculate the relative necrotic area, we divided the total area of necrotic lesions by the total area of the leaflet. Differences in the test inoculations relative to the respective mock controls were calculated with a two‐tailed t‐test in Excel 2013. Differences within the time series datasets were evaluated using a Kruskal–Wallis test with a post‐hoc Tukey test using the R CRAN package PMCMR. P values were adjusted using a Bonferroni correction.
Trypan blue staining
The bleached leaflets were stained with trypan blue–lactophenol (modified from Jones and Deverall, 1977). In brief, leaflets were covered with trypan blue–lactophenol solution, cooked at 99°C until boiling, exchanged with chloral hydrate solution (0.5 g/mL) and stored in fresh chloral hydrate solution. Leaflets were evaluated using an Axiophot microscope (AxioCam ICc 5 camera; Zeiss).
RNA extraction and cDNA synthesis
RNA was extracted from each replicate and time point (pooling three to four leaflets per replicate) using the Universal RNA/miRNA Purification Kit (Roboklon, Berlin, Germany). To check RNA quality, 5 µL of RNA were treated with 6 µL of deionized formamide, incubated at 65°C for 5 min, followed by 5 min incubation on ice, and the RNA quality was evaluated on a 2% agarose gel.
cDNA was synthesized using the RevertAid First Strand cDNA Synthesis Kit (Thermo Fisher Scientific, Vilnius, Lithuania) using 1000 ng total RNA as input. The cDNA was diluted 1 : 1 with RNase‐free H2O. We performed a –RT control to test for DNA contamination using Solanum Elf1α primers (Table S3). The PCR (20 µL) included 1 × Green GoTaq® Flexi Buffer, 2 mm MgCl2, 0.1 mm dNTPs, 0.5 µm per primer, 1 U GoTaq® Polymerase (Promega, Madison, WI, USA) and 3 µL template cDNA and used the following protocol: 5 min at 94°C, 35 cycles of 30 s at 94°C, 30 s at 56°C and 1.30 min at 72°C, followed by 7 min at 72°C.
Presence of P. infestans
The presence of P. infestans in our inoculations and its absence from mock controls were validated using Phytophthora‐specific cytochrome oxidase subunit 2 (COX2) primers (Hudspeth et al., 2000; Table S3). The PCR was performed as described above.
Expression of biotrophic and necrotrophic marker genes of P. infestans
We analysed the P. infestans life cycles in the two different host species using the following marker genes: in planta‐induced O (PiipiO), Haustorial membrane protein 1 (PiHMP1), Suppressor of necrosis 1 (PiSNE1), Phytophthora infestans necrosis Phytophthora protein 1 (PiNPP1.2) and Cell division cycle 14 (PiCdc14) (Ah Fong and Judelson, 2003; Avrova et al., 2008; Kanneganti et al., 2006; Kelley et al., 2010; van West et al., 1998). PiH2a was used as a biomass marker gene. Primers were designed using NCBI primer blast (Ye et al., 2012). PCRs (20 µL) consisted of 1 × Green GoTaq® Flexi Buffer, 1.25 mm MgCl2, 0.1 mm dNTPs, 0.2 μm per primer, 3 μL cDNA template and 2 U GoTaq® Flexi DNA Polymerase (Promega). The reaction conditions were as follows: 4 min at 94°C, several cycles of 30 s at 94°C, annealing for 30 s, 1.30 min at 72°C, followed by 7 min at 72°C (primer sequences, annealing temperatures and number of cycles shown in Table S3). The band intensity was evaluated using ImageJ (Abramoff et al., 2004) and the relative abundance was calculated according to Zuluaga et al. (2016).
Expression analyses in P. infestans infections
We performed qRT‐PCR with PiPSR2 with time points of 24–96 hpi. Primers were designed manually or using NCBI primer blast (Table S3). qRT‐PCR was performed in a CFX Connect™ Real‐Time System (Bio‐Rad, Hercules, CA, USA) using the SsoAdvancedTM Universal SYBR® Green Supermix (Bio‐Rad). The settings were as follows: 3 min at 95°C, 45 cycles of 10 s at 95°C and 30 s at 60°C. In addition, a melting curve analysis was performed. As P. infestans reference genes, we used PiH2a and PiElf1α, and, as a host reference gene, we used the Translation Initiation Factor 3 subunit H (TIF3H). The relative expression was evaluated according to Pfaffl (2001). Significant differences between isolates, hosts or time points were calculated using a Mann–Whitney U‐test (Mann and Whitney, 1947). To estimate P. infestans growth in planta, we calculated the relative expression of PiH2a and PiElf1α using TIF3H as the reference gene. To correlate P. infestans growth with PiPSR2 expression, we used a Spearman correlation to calculate the correlation of relative PiH2a and relative PiPSR2 expression. To test for isolate‐specific expression, CT values of PiPSR2 and PITG12646 of the three isolates were normalized with PiH2a and PiElf1α, and compared with each other. Significant differences were calculated using a Mann–Whitney U‐test.
Data deposition
This project has been deposited at NCBI under the accessions KX129856–KX129868.
Supporting information
Additional Supporting Information may be found in the online version of this article at the publisher‘s website:
Fig. S1 Cladogram of the Phytophthora parasitica RNA silencing suppressor PSR2 (PpPSR2). The cladogram of the PpPSR2 proteins shows that PpPSR2 forms two distinct groups within P. parasitica (paralogue 1 in the purple box and paralogue 2 in the green box). Phytophthora infestans PSR2 (PiPSR2) was used as an outgroup. Bootstrap values < 50 are not shown.
Fig. S2 Distribution of amino acid changes across isolates. (a) Maximum likelihood phylogeny of the mitochondrial sequences of nine Phytophthora infestans isolates. Phytophthora ipomoeae was used as an outgroup. Bootstrap values > 70 are given at the nodes. (b) Cladogram of the phylogeny. Amino acid changes in the PiPSR2 proteins in the different isolates are indicated on the branches. (c) Amino acid changes of PiPSR2 in all isolates compared with the reference isolate T30‐4 at the polymorphic positions.
Fig. S3 MAST motifs in Phytophthora infestans RNA silencing suppressor PSR2 (PiPSR2). MAST output for the PiPSR2 amino acid alignment. Blue and purple boxes indicate the W and Y motifs found in the MAST output. Red boxes indicate that this motif is similar to another motif detected earlier in this search.
Fig. S4 Phytophthora infestans infection of cultivated and wild tomatoes. Leaflets of Solanum lycopersicum and S. pimpinellifolium were inoculated with P. infestans isolates D12‐2 (blue) and T20‐2 (yellow). T20‐2 showed variable infection progress indicated by T20‐2 s (dark yellow) for an infection that caused strong symptoms and T20‐2 w (light yellow) for an infection that caused mild symptoms. Representative bleached leaflets are shown for 0, 24, 48, 72 and 96 h post‐inoculation (hpi).
Fig. S5 Relative necrotic area in Phytophthora infestans infection. The average relative necrotic areas of infected and mock control (H2O) leaflets from Solanum lycopersicum and S. pimpinellifolium infections are shown. Leaflets were infected with P. infestans isolate D12‐2 (a) or T20‐2 (b). Error bars indicate the standard error. Letters above the bars indicate significance groups between time points and infection and mock control within a host plant. Samples were taken at 0, 24, 48, 72 and 96 h post‐inoculation (hpi).
Fig. S6 Progression of the Phytophthora infestans life cycle. Infections of P. infestans isolate D12‐2 (a) and T20‐2 (b) in Solanum lycopersicum and S. pimpinellifolium were screened for the presence of haustoria (green), developing sporangia (beige) and mature sporangia (dark brown). Infections were analysed at 24, 48, 72 and 96 h post‐inoculation (hpi). We calculated the relative number of leaflets with at least one haustorium, developing sporangium or sporangium present (n = 21–28 per time point and infection).
Fig. S7 Expression differences of CRN PITG12646 in the different isolates. Pairwise relative expression of CRN PITG12646 on Solanum lycopersicum (a) and S. pimpinellifolium (b) at 24, 48, 72 and 96 h post‐inoculation (hpi). Expression was measured using quantitative reverse transcription‐polymerase chain reaction (qRT‐PCR). For normalization, the reference genes PiH2a and PiElf1a were used. Error bars indicate the standard error of the mean (SEM). Significance classes are given as letters above the bar graph. Significance was calculated within one time point.
Fig. S8 Alignment of PSR2. Alignment of the PiPSR2 sequences from 19 P. infestans isolates used for the population genetic analyses. The names of the isolates are indicated on the left. Phytophthora sojae was used as an outgroup. The consensus sequence and the conservation level from 0% to 100% are given below the alignment.
Fig. S9 Alignment of PiATP5D. Alignment of the PiATP5D sequences from six Phytophthora infestans isolates used for the population genetic analyses. Sequences were obtained from a de novo assembly of the raw data from Yoshida et al. (2013). The names of the isolates are indicated on the left. The consensus sequence and the conservation level from 0% to 100% are given below the alignment.
Fig. S10 Alignment of PiElf1a. Alignment of the partial PiElf1a sequences from seven Phytophthora infestans isolates used for the population genetic analyses. Sequences were obtained from a de novo assembly of the raw data from Yoshida et al. (2013). The names of the isolates are indicated on the left. The consensus sequence and the conservation level from 0% to 100% are given below the alignment.
Fig. S11 Alignment of PiAGO1. Alignment of the PiAGO1 sequences from seven Phytophthora infestans isolates used for the population genetic analyses. Sequences were obtained from a de novo assembly of the raw data from Yoshida et al. (2013). The names of the isolates are indicated on the left. The consensus sequence and the conservation level from 0% to 100% are given below the alignment.
File S1 Protein and nucleotide sequences of Phytophthora infestans RNA silencing suppressor PSR2 (PiPSR2) (de novo assembly).
Table S1 McDonald–Kreitman table.
Table S2 Statistical differences between PSR2 expression data. The P value was calculated with a Mann–Whitney U‐test. Values in bold indicate significant differences.
Table S3 Primer sequences.
Table S4 Origin of Phytophthora infestans strains and accessions.
Table S5 Gene accession numbers.
Acknowledgements
We thank Francine Govers and Klaas Bouwmeester (Wageningen University, Wageningen, the Netherlands) for growth protocols and P. infestans isolates NL10001, NL88069, NL90128, IPO‐C, IPO428‐2, 3928A, D12‐2, T15‐2 and T20‐2; Sophien Kamoun (The Sainsbury Laboratory, Norwich, Norfolk, UK) for isolate T30‐4; and Thilo Hamann (Julius‐Kühne Institute, Gross Luesewitz, Sanitz, Germany) for isolates 4/91, 20/01 and 08‐ANI‐3. Seeds of S. lycopersicum cv. Moneymaker were purchased from www.exotic-samen.de (Wolfgang Meier, Fuerstenwalde, Germany). Seeds of S. pimpinellifolium LA0114 were obtained from the Tomato Genetics Resource Center (TGRC) (tgrc.ucdavis.edu). This work was funded by the Deutsche Forschungsgemeinschaft (DFG) (Grants Ro 2491/5‐2, Ro 2491/6‐1 and Research Training Group GRK1525).
References
- Abramoff, M.D. , Magalhães, P.J. and Ram, S.J. (2004) Image processing with ImageJ. Biophoton. Int. 11, 36–42. [Google Scholar]
- Adenot, X. , Elmayan, T. , Lauressergues, D. , Boutet, S. , Bouché, N. , Gasciolli, V. and Vaucheret, H. (2006) DRB4‐dependent TAS3 trans‐acting siRNAs control leaf morphology through AGO7. Curr. Biol. 16, 927–932. [DOI] [PubMed] [Google Scholar]
- Adler, N.E. , Chacón, G. , Flier, W.G. and Forbes, G.A. (2002) The Andean fruit crop, pear melon (Solanum muricatum) is a common host for A1 and A2 strains of Phytophthora infestans in Ecuador. Plant Pathol. 51, 802. [Google Scholar]
- Ah Fong, A.M.V. and Judelson, H.S. (2003) Cell cycle regulator Cdc14 is expressed during sporulation but not hyphal growth in the fungus‐like oomycete Phytophthora infestans . Mol. Microbiol. 50, 487–494. [DOI] [PubMed] [Google Scholar]
- Allen, E. , Xie, Z. , Gustafson, A.M. and Carrington, J.C. (2005) microRNA‐directed phasing during trans‐acting siRNA biogenesis in plants. Cell, 121, 207–221. [DOI] [PubMed] [Google Scholar]
- Allen, F.H.E. and Friend, J. (1983) Resistance of potato tubers to infection by Phytophthora infestans: a structural study of haustorial encasement. Physiol. Plant Pathol. 22, 285. [Google Scholar]
- Allen, R.L. , Bittner‐Eddy, P.D. , Grenville‐Briggs, L.J. , Meitz, J.C. , Rehmany, A.P. , Rose, L.E. and Beynon, J.L. (2004) Host–parasite co‐evolutionary conflict between Arabidopsis and downy mildew. Science, 306, 1957–1960. [DOI] [PubMed] [Google Scholar]
- Allen, R.L. , Meitz, J.C. , Baumber, R.E. , Hall, S.A. , Rose, L.E. and Beynon, J.L. (2008) Natural variation reveals key amino acids for recognition specificity between downy mildew effector and an Arabidopsis resistance gene. Mol. Plant Pathol. 9, 511–523. [DOI] [PMC free article] [PubMed] [Google Scholar]
- Åsman, A.K.M. , Fogelqvist, J. , Vetukuri, R.R. and Dixelius, C. (2016) Phytophthora infestans Argonaute 1 binds microRNA and small RNAs from effector genes and transposable elements. New Phytol. 211, 993–1007. [DOI] [PubMed] [Google Scholar]
- Avrova, A.O. , Boevink, P.C. , Young, V. , Grenville‐Briggs, L.J. , van West, P. , Birch, P.R.J. and Whisson, S.C. (2008) A novel Phytophthora infestans haustorium‐specific membrane protein is required for infection of potato. Cell Microbiol. 10, 2271–2284. [DOI] [PubMed] [Google Scholar]
- Axtell, M.J. , Jan, C. , Rajagopalan, R. and Bartel, D.P. (2006) A two‐hit trigger for siRNA biogenesis in plants. Cell, 127, 565–577. [DOI] [PubMed] [Google Scholar]
- Bailey, T.L. and Gribskov, M. (1998) Methods and statistics for combining motif match scores. J. Comput. Biol. 5, 211–221. [DOI] [PubMed] [Google Scholar]
- Biegert, A. , Mayer, C. , Remmert, M. , Soding, J. and Lupas, A.N. (2006) The MPI bioinformatics toolkit for protein sequence analysis. Nucleic Acids Res. 34, W335–W339. [DOI] [PMC free article] [PubMed] [Google Scholar]
- Blackwell, E.M. (1953) Haustoria of Phytophthora infestans and some other species. Trans. Br. Mycol. Soc. 36, 138. [Google Scholar]
- Boccara, M. , Sarazin, A. , Thiébauld, O. , Jay, F. , Voinnet, O. , Navarro, L. , and Colot, V. (2014) The Arabidopsis miR472‐RDR6 silencing pathway modulates PAMP‐ and effector‐triggered immunity through the post‐transcriptional control of disease resistance genes. Plos Pathog. 10, e1003883. [DOI] [PMC free article] [PubMed]
- Bologna, N.G. and Voinnet, O. (2014) The diversity, biogenesis, and activities of endogenous silencing small RNAs in Arabidopsis . Annu. Rev. Plant Biol. 65, 473–503. [DOI] [PubMed] [Google Scholar]
- Boutemy, L.S. , King, S.R.F. , Win, J. , Hughes, R.K. , Clarke, T.A. , Blumenschein, T.M.A. , Kamoun, S. and Banfield, M.J. (2011) Structures of Phytophthora RXLR effector proteins: a conserved but adaptable fold underpins functional diversity. J. Biol. Chem. 286, 35 834–35 842. [DOI] [PMC free article] [PubMed] [Google Scholar]
- Camacho, C. , Coulouris, G. , Avagyan, V. , Ma, N. , Papadopoulos, J. , Bealer, K. and Madden, T.L. (2009) BLAST+: architecture and applications. BMC Bioinformatics, 10, 421. [DOI] [PMC free article] [PubMed] [Google Scholar]
- Carlsbecker, A. , Lee, J.Y. , Roberts, C.J. , Dettmer, J. , Lehesranta, S. , Zhou, J. , Lindgren, O. , Moreno‐Risueno, M.A. , Vatén, A. , Thitamadee, S. , Campilho, A. , Sebastian, J. , Bowman, J.L. , Helariutta, Y. and Benfey, P.N. (2010) Cell signalling by microRNA165/6 directs gene dose‐dependent root cell fate. Nature, 465, 316–321. [DOI] [PMC free article] [PubMed] [Google Scholar]
- Caten, C.E. and Jinks, J.L. (1968) Spontaneous variability of single isolates of Phytophthora infestans. I. Cultural variation. Can. J. Bot. 46, 329–348. [Google Scholar]
- Chen, H.M. , Chen, L.T. , Patel, K. , Li, Y.H. , Baulcombe, D.C. and Wu, S.H. (2010) 22‐Nucleotide RNAs trigger secondary siRNA biogenesis in plants. Proc. Natl. Acad. Sci. USA, 107, 15 269–15 274. [DOI] [PMC free article] [PubMed] [Google Scholar]
- Cooke, D.E.L. , Cano, L.M. , Raffaele, S. , Bain, R.A. , Cooke, L.R. , Etherington, G.J. , Deahl, K.L. , Farrer, R.A. , Gilroy, E.M. , Goss, E.M. , Grümwald, N.J. , Hein, I. , MacLean, D. , McNicol, J.W. , Randall, E. , Oliva, R.F. , Pel, M.A. , Shaw, D.S. , Squires, J.N. , Taylor, M.C. , Vleeshouwers, V.G.A.A. , Birch, P.R.J. , Lees, A.K. and Kamoun, S. (2012) Genome analyses of an aggressive and invasive lineage of the Irish Potato Famine pathogen. PLoS Pathog. 8, e1002940. [DOI] [PMC free article] [PubMed] [Google Scholar]
- Crawford, A.R. , Bassam, B.J. , Drenth, A. , Maclean, D.J. and Irwin, J.A.G. (1996) Evolutionary relationships among Phytophthora species deduced from rDNA sequence analysis. Mycol. Res. 100, 437–443. [Google Scholar]
- Cuperus, J.T. , Carbonell, A. , Fahlgren, N. , Garcia‐Ruiz, H. , Burke, R.T. , Takeda, A. , Sullivan, C.M. , Gilbert, S.D. , Montgomery, T.A. and Carrington, J.C. (2010) Unique functionality of 22‐nt miRNAs in triggering RDR6‐dependent siRNA biogenesis from target transcripts in Arabidopsis . Nat. Struct. Mol. Biol. 17, 997–1003. [DOI] [PMC free article] [PubMed] [Google Scholar]
- Dou, D. , Kale, S.D. , Wang, X. , Jiang, R.H.Y. , Bruce, N.A. , Arredondo, F.D. , Zhang, X. and Tyler, B.M. (2008) RXLR‐mediated entry of Phytophthora sojae effector Avr1b into soybean cells does not require pathogen‐encoded machinery. Plant Cell, 20, 1930–1947. [DOI] [PMC free article] [PubMed] [Google Scholar]
- Drenth, A. , Janssen, E.M. and Govers, F. (1995) Formation and survival of oospores of Phytophthora infestans under natural conditions. Plant Pathol. 44, 86–94. [Google Scholar]
- Edwards, K. , Johnstone, C. and Thompson, C. (1991) A simple and rapid method for the preparation of plant genomic DNA for PCR analysis. Nucleic Acids Res. 19, 1349. [DOI] [PMC free article] [PubMed] [Google Scholar]
- Fahlgren, N. , Bollmann, S.R. , Kasschau, K.D. , Cuperus, J.T. , Press, C.M. , Sullivan, C.M. , Chapman, E.J. , Hoyer, J.S. , Gilbert, K.B. , Grünwald, N.J. and Carrington, J.C. (2013) Phytophthora have distinct endogenous small RNA populations that include short interfering and microRNAs. PLoS One, 8, e77181. [DOI] [PMC free article] [PubMed] [Google Scholar]
- Fei, Q. , Xia, R. and Meyers, B.C. (2013) Phased, secondary, small interfering RNAs in posttranscriptional regulatory networks. Plant Cell, 25, 2400–2415. [DOI] [PMC free article] [PubMed] [Google Scholar]
- Flier, W.G. , van den Bosch, G.B.M. and Turkensteen, L.J. (2003) Epidemiological importance of Solanum sisymbriifolium, S. nigrum and S. dulcamara as alternative hosts for Phytophthora infestans . Plant Pathol. 52, 595–603. [Google Scholar]
- Garry, G. , Forbes, G.A. , Salas, A. , Santa Cruz, M. , Perez, W.G. and Nelson, R.J. (2005) Genetic diversity and host differentiation among isolates of Phytophthora infestans from cultivated potato and wild solanaceous hosts in Peru. Plant Pathol. 54, 740–748. [Google Scholar]
- Gasteiger, E. , Gattiker, A. , Hoogland, C. , Ivanyi, I. , Appel, R.D. and Bairoch, A. (2003) ExPASy: the proteomics server for in‐depth protein knowledge and analysis. Nucleic Acids Res. 31, 3784–3788. [DOI] [PMC free article] [PubMed] [Google Scholar]
- Grabherr, M.G. , Haas, B.J. , Yassour, M. , Levin, J.Z. , Thompson, D.A. , Amit, I. , Adiconis, X. , Fan, L. , Raychowdhury, R. , Zeng, Q. , Chen, Z. , Mauceli, E. , Hacohen, N. , Gnirke, A. , Rhind, N. , di Palma, F. , Birren, B.W. , Nusbaum, C. , Lindblad‐Toh, K. , Friedman, N. and Regev, A. (2011) Full‐length transcriptome assembly from RNA‐Seq data without a reference genome. Nat. Biotechnol. 29, 644–652. [DOI] [PMC free article] [PubMed] [Google Scholar]
- Haas, B.J. , Kamoun, S. , Zody, M.C. , Jiang, R.H.Y. , Handsaker, R.E. , Cano, L.M. , Grabherr, M. , Kodira, C.D. , Raffaele, S. , Torto‐Alalibo, T. , Bozkurt, T.O. , Ah‐Fong, A.M.V. , Alvarado, L. , Andreson, V.L. , Armstrong, M.R. , Avrova, A. , Baxter, L. , Beynon, J. , Boevink, P.C. , Bollmann, S.R. , Bos, J.I.B. , Bulone, V. , Cai, G. , Cakir, C. , Carrington, J.C. , Chawner, M. , Conti, L. , Costanzo, S. , Erwan, R. , Fahlgren, N. , Fischbach, M.A. , Fugelstad, J. , Gilroy, E.M. , Gnerre, S. , Green, P.J. , Grenville‐Briggs, L.J. , Griffith, J. , Grünwald, N.J. , Horn, K. , Horner, N.R. , Hu, C.H. , Huitema, E. , Jeong, D.H. , Jones, A.M.E. , Jones, R.W. , Karlsson, E.K. , Kunjeti, S.G. , Lamour, K. , Liu, Z. , Ma, L. , MacLean, D. , Chibucos, M.C. , McDonald, H. , McWalters, J. , Meijer, H.J.G. , Morgan, W. , Morris, P.F. , Munro, C.A. , O'Neill, K. , Ospina‐Giraldo, M. , Pinzón, A. , Pritchard, L. , Ramsahoye, B. , Ren, Q. , Restrepo, S. , Roy, S. , Sadanandom, A. , Savidor, A. , Schornack, S. , Schwartz, D.C. , Schumann, U.D. , Schwessinger, B. , Seyer, L. , Sharpe, T. , Silvar, C. , Song, J. , Studholm, D.J. , Sykes, S. , Thines, M. , van de Vondervoort, P.J.I. , Phuntumart, V. , Wawra, S. , Weide, R. , Win, J. , Young, C. , Zhou, S. , Fry, W. , Meyers, B.C. , van West, P. , Ristaino, J. , Govers, F. , Birch, P.R.J. , Whisson, S.C. , Judelson, H.S. and Nusbaum, C. (2009) Genome sequence and analysis of the Irish potato famine pathogen Phytophthora infestans . Nature, 461, 393–398. [DOI] [PubMed] [Google Scholar]
- Hendelman, A. , Kravchik, M. , Stav, R. , Zik, M. , Lugassi, N. and Arazi, T. (2013) The developmental outcomes of P0‐mediated Argonaute destabilization in tomato. Planta, 237, 363–377. [DOI] [PubMed] [Google Scholar]
- Hickman, C.J. (1958) Phytophthora – plant destroyer. Trans. Br. Mycol. Soc. 41, 13. [Google Scholar]
- Hiller, K. , Grote, A. , Scheer, M. , Münch R. and Jahn, D. (2004) PrediSi: prediction of signal peptides and their cleavage positions. Nucleic Acids Res. 32, W375–W379. [DOI] [PMC free article] [PubMed] [Google Scholar]
- Hsieh, L.C. , Lin, S.I. , Shih, A.C.C. , Chen, J.W. , Lin, W.Y. , Tseng, C.Y. , Li, W.H. and Chiou, T.J. (2009) Uncovering small RNA‐mediated responses to phosphate deficiency in Arabidopsis by deep sequencing. Plant Physiol. 151, 2120–2132. [DOI] [PMC free article] [PubMed] [Google Scholar]
- Hudspeth, D.S.S. , Nadler, S.A. and Hudspeth, M.E.S. (2000) A COX2 molecular phylogeny of the Peronosporomycetes. Mycologia, 92, 674–684. [Google Scholar]
- Jiang, R.H.Y. , Tripathy, S. , Govers, F. and Tyler, B.M. (2008) RXLR effector reservoir in two Phytophthora species is dominated by a single rapidly evolving superfamily with more than 700 members. Proc. Natl. Acad. Sci. USA, 105, 4874–4879. [DOI] [PMC free article] [PubMed] [Google Scholar]
- Jones, D.R. and Deverall, B.J. (1977) The effect of the Lr20 resistance gene in wheat on the development of leaf rust, Puccinia recondifa . Physiol. Plant Pathol. 10, 275–287. [Google Scholar]
- Jones, D.T. (1999) Protein secondary structure prediction based on position‐specific scoring matrices. J. Mol. Biol. 292, 195–202. [DOI] [PubMed] [Google Scholar]
- Judelson, H.S. , Ah‐Fong, A.M.V. , Aux, G. , Avrova, A.O. , Bruce, C. , Cakir, C. , da Cunha, L. , Grenville‐Briggs, L. , Latijnhouwers, M. , Ligterink, W. , Meijer, H.J. , Roberts, S. , Thurber, C.S. , Whisson, S.C. , Birch, P.R. , Govers, F. , Kamoun, S. , van West, P. and Windass, J. (2008) Gene expression profiling during asexual development of the late blight pathogen Phytophthora infestans reveals a highly dynamic transcriptome. Mol. Plant–Microbe Interact. 21, 433–447. [DOI] [PubMed] [Google Scholar]
- Jupe, J. , Stam, R. , Howden, A.J. , Morris, J.A. , Zhang, R. , Hedley, P.E. and Huitema, E. (2013) Phytophthora capsici–tomato interaction features dramatic shifts in gene expression associated with a hemi‐biotrophic lifestyle. Genome Biol. 14, R63. [DOI] [PMC free article] [PubMed] [Google Scholar]
- van Kan, J.A.L. (2006) Licensed to kill: the lifestyle of a necrotrophic plant pathogen. Trends Plant Sci. 11, 247–253. [DOI] [PubMed] [Google Scholar]
- Kanneganti, T.‐D. , Huitema, E. , Cakir, C. and Kamoun, S. (2006) Synergistic interactions of the plant cell death pathways induced by Phytophthora infestans Nep1‐like protein PiNPP1.1 and INF1 elicitin. Mol. Plant–Microbe Interact. 19, 854–863. [DOI] [PubMed] [Google Scholar]
- Katoh, K. and Standley, D.M. (2013) MAFFT multiple sequence alignment software version 7: improvements in performance and usability. Mol. Biol. Evol. 30, 772–780. [DOI] [PMC free article] [PubMed] [Google Scholar]
- Kelley, B.S. , Lee, S.J. , Damasceno, C.M.B. , Chakravarthy, S. , Kim, B.D. , Martin, G.B. and Rose, J.K.C. (2010) A secreted effector protein (SNE1) from Phytophthora infestans is a broadly acting suppressor of programmed cell death: an oomycete suppressor of programmed cell death. Plant J. 62, 357–366. [DOI] [PubMed] [Google Scholar]
- Kravchik, M. , Sunkar, R. , Damodharan, S. , Stav, R. , Zohar, M. , Isaacson, T. and Arazi, T. (2014) Global and local perturbation of the tomato microRNA pathway by a trans‐activated dicer‐like 1 mutant. J. Exp. Bot. 65, 725–739. [DOI] [PMC free article] [PubMed] [Google Scholar]
- Kuan, T.L. and Erwin, D.C. (1980) Formae speciales differentiation of Phytophthora megasperma isolates from soybean and alfalfa. Phytopathology, 70, 333–338. [Google Scholar]
- Kurihara, Y. and Watanabe, Y. (2004) Arabidopsis micro‐RNA biogenesis through Dicer‐like 1 protein functions. Proc. Natl. Acad. Sci. USA, 101, 12 753–12 758. [DOI] [PMC free article] [PubMed] [Google Scholar]
- Li, W.H. (1997) Dynamics of genes in populations In: Molecular Evolution, p. 40 Sunderland, MA: Sinauer Associates, Inc. [Google Scholar]
- Librado, P. and Rozas, J. (2009) DnaSP v5: a software for comprehensive analysis of DNA polymorphism data. Bioinformatics, 25, 1451–1452. [DOI] [PubMed] [Google Scholar]
- Lo Presti, L. , Lanver, D. , Schweizer, G. , Tanaka, S. , Liang, L. , Tollot, M. , Zuccaro, A. , Reissmann, S. and Kahmann, R. (2015) Fungal effectors and plant susceptibility. Annu. Rev. Plant Biol. 66, 513–545. [DOI] [PubMed] [Google Scholar]
- Mann, H.B. and Whitney, D.R. (1947) On a test of whether one of two random variables is stochastically larger than the other. Ann. Math. Stat. 18, 50–60. [Google Scholar]
- Martin, M.D. , Vieira, F.G. , Ho, S.Y.W. , Wales, N. , Schubert, M. , Seguin‐Orlando, A. , Ristaino, J.B. , and Gilbert, M.T.P. (2016) Genomic characterization of a South American Phytophthora hybrid mandates reassessment of the geographic origins of Phytophthora infestans. Mol. Biol. Evol. 33, 478–491. [DOI] [PMC free article] [PubMed] [Google Scholar]
- McDonald, H.J. and Kreitman, M. (1991) Adaptive protein evolution at the Adh locus in Drosophila . Nature, 351, 652–654. [DOI] [PubMed] [Google Scholar]
- Murashige, T. and Skoog, F. (1962) A revised medium for rapid growth and bio assays with tobacco tissue cultures. Physiol. Plant. 15, 473–497. [Google Scholar]
- Oh, S.K. , Young, C. , Lee, M. , Oliva, R. , Bozkurt, T.O. , Cano, L.M. , Win, J. , Bos, J.I.B. , Liu, H.Y. , van Damme, M. , Morgan, W. , Choi, D. , Van der Vossen, E.A.G. , Vleeshouwers, V.G.A.A. and Kamoun, S. (2009) In planta expression screens of Phytophthora infestans RXLR effectors reveal diverse phenotypes, including activation of the Solanum bulbocastanum disease resistance protein Rpi‐blb2. Plant Cell, 21, 2928–2947. [DOI] [PMC free article] [PubMed] [Google Scholar]
- Oliva, R.F. , Cano, L.M. , Raffaele, S. , Win, J. , Bozkurt, T.O. , Belhaj, K. , Oh, S.K. , Thines, M. and Kamoun, S. (2015) A recent expansion of the RXLR effector gene Avrblb2 is maintained in global populations of Phytophthora infestans indicating different contributions to virulence. Mol. Plant–Microbe Interact. 28, 901–912. [DOI] [PubMed] [Google Scholar]
- Pfaffl, M.W. (2001) A new mathematical model for relative quantification in real‐time RT‐PCR. Nucleic Acids Res. 29, e45. [DOI] [PMC free article] [PubMed] [Google Scholar]
- Pratt, R.G. (1981) Morphology, pathogenicity, and host range of Phytophthora megasperma, P. erythroseptica, and P. parasitica from arrow leaf clover. Phytopathology, 71, 276–282. [Google Scholar]
- Pumplin, N. and Voinnet, O. (2013) RNA silencing suppression by plant pathogens: defence, counter‐defence and counter‐counter‐defence. Nat. Rev. Microbiol. 11, 745–760. [DOI] [PubMed] [Google Scholar]
- Qiao, Y. , Liu, L. , Xiong, Q. , Flores, C. , Wong, J. , Shi, J. , Wang, X. , Liu, X. , Xiang, Q. , Jiang, S. , Zhang, F. , Wang, Y. , Judelson, H.S. and Ma, W. (2013) Oomycete pathogens encode RNA silencing suppressors. Nat. Genet. 45, 330–333. [DOI] [PMC free article] [PubMed] [Google Scholar]
- Qutob, D. , Patrick Chapman, B. and Gijzen, M. (2013) Transgenerational gene silencing causes gain of virulence in a plant pathogen. Nat. Commun. 4, 1349. [DOI] [PMC free article] [PubMed] [Google Scholar]
- Raffaele, S. , Farrer, R.A. , Cano, L.M. , Studholme, D.J. , MacLean, D. , Thines, M. , Jiang, R.H.Y. , Zody, M.C. , Kunjeti, S.G. , Donofrio, N.M. , Meyers, B.C. , Nusbaum, C. and Kamoun, S. (2010) Genome evolution following host jumps in the Irish potato famine pathogen lineage. Science, 330, 1540–1543. [DOI] [PubMed] [Google Scholar]
- Rehmany, A.P. , Gordon, A. , Rose, L.E. , Allen, R.L. , Armstrong, M.R. , Whisson, S.C. , Kamoun, S. , Tyler, B.M. , Birch, P.R.J. and Beynon, J.L. (2005) Differential recognition of highly divergent downy mildew avirulence gene alleles by RPP1 resistance genes from two Arabidopsis lines. Plant Cell, 17, 1839–1850. [DOI] [PMC free article] [PubMed] [Google Scholar]
- Rogers, K. and Chen, X. (2013) Biogenesis, turnover, and mode of action of plant microRNAs. Plant Cell, 25, 2383–2399. [DOI] [PMC free article] [PubMed] [Google Scholar]
- Schornack, S. , van Damme, M. , Bozkurt, T.O. , Cano, L.M. , Smoker, M. , Thines, M. , Gaulin, E. , Kamoun, S. and Huitema, E. (2010) Ancient class of translocated oomycete effectors targets the host nucleus. Proc. Natl. Acad. Sci. USA, 107, 17 421–17 426. [DOI] [PMC free article] [PubMed] [Google Scholar]
- Shivaprasad, P.V. , Chen, H.M. , Patel, K. , Bond, D.M. , Santos, B.A.C.M. and Baulcombe, D.C. (2012) A microRNA superfamily regulates nucleotide binding site‐leucine‐rich repeats and other mRNAs. Plant Cell, 24, 859–874. [DOI] [PMC free article] [PubMed] [Google Scholar]
- Stam, R. , Jupe, J. , Howden, A.J.M. , Morris, J.A. , Boevink, P.C. , Hedley, P.E. and Huitema, E. (2013) Identification and characterisation of CRN effectors in Phytophthora capsici shows modularity and functional diversity. PLoS One, 8, e59517. [DOI] [PMC free article] [PubMed] [Google Scholar]
- Stothard, P. (2000) The Sequence Manipulation Suite: JavaScript programs for analyzing and formatting protein and DNA sequences. Biotechniques, 28, 1102–1104. [DOI] [PubMed] [Google Scholar]
- Tamura, K. , Peterson, D. , Peterson, N. , Stecher, G. , Nei, M. and Kumar, S. (2011) MEGA5: molecular evolutionary genetics analysis using maximum likelihood, evolutionary distance, and maximum parsimony methods. Mol . Biol. Evol. 28, 2731–2739. [DOI] [PMC free article] [PubMed] [Google Scholar]
- Torto, T.A. , Li, S. , Styer, A. , Huitema, E. , Testa, A. , Gow, A.R. , van West, P. and Kamoun, S. (2003) EST mining and functional expression assays identify extracellular effector proteins from the plant pathogen Phytophthora . Genome Res. 13, 1675–1685. [DOI] [PMC free article] [PubMed] [Google Scholar]
- Tyler, B.M. , Tripathy, S. , Zhang, X. , Dehal, P. , Jiang, R.H.Y. , Aerts, A. , Arredondo, F.D. , Baxter, L. , Bensasson, D. , Beynon, J.L. , Chapman, J. , Damasceno, M.B. , Dorrance, A.E. , Dou, D. , Dickerman, A.W. , Dubchak, I.L. , Garbelotto, M. , Gijzen, M. , Gordon, S.G. , Govers, F. , Grünwald, N.J. , Huang, W. , Ivors, K.L. , Jones, R.W. , Kamoun, S. , Krampis, K. , Lamour, K.H. , Lee, M.K. , McDonald, W.H. , Medina, M. , Meijer, H.J.G. , Nordberg, E.K. , MacIean, D.J. , Ospina‐Giraldo, M.D. , Morris, P.F. , Phuntumart, V. , Putnam, N.H. , Rash, S. , Rose, J.K.C. , Sakihama, Y. , Salamov, A.A. , Savidor, A. , Scheuring, C.F. , Smith, B.M. , Sobral, B.W.S. , Terry, A. , Torto‐Alalibo, T.A. , Win, J. , Xu, Z. , Zhang, H. , Grigoriev, I.V. , Rokhsar, D.S. and Boore, J.L. (2006) Phytophthora genome sequences uncover evolutionary origins and mechanisms of pathogenesis. Science, 313, 1261–1266. [DOI] [PubMed] [Google Scholar]
- Vetukuri, R.R. , Åsman, A.K.M. , Tellgren‐Roth, C. , Jahan, S.N. , Reimegård, J. , Fogelqvist, J. , Savenkov, E. , Söderbom, F. , Avrova, A.O. , Whisson, S.C. and Dixelius, C. (2012) Evidence for small RNAs homologous to effector‐encoding genes and transposable elements in the oomycete Phytophthora infestans . Plos One, 7, e51399. [DOI] [PMC free article] [PubMed] [Google Scholar]
- Vleeshouwers, V.G.A.A. and Oliver, R.P. (2014) Effectors as tools in disease resistance breeding against biotrophic, hemibiotrophic and necrotrophic plant pathogens. Mol. Plant Microbe Interact. 27, 196–206. [DOI] [PubMed] [Google Scholar]
- Voegele, R.T. , Struck, C. , Hahn, M. and Mendgen, K. (2001) The role of haustoria in sugar supply during infection of broad bean by the rust fungus Uromyces fabae . Proc. Natl. Acad. Sci. USA, 98, 8133–8138. [DOI] [PMC free article] [PubMed] [Google Scholar]
- de Vries, S. , Kloesges, T. and Rose, L.E. (2015) Evolutionarily dynamic, but robust, targeting of resistance genes by the miR482/2118 gene family in the Solanaceae. Genome Biol. Evol. 7, 3307–3321. [DOI] [PMC free article] [PubMed] [Google Scholar]
- Wang, Q. , Han, C. , Ferreira, A.O. , Yu, X. , Ye, W. , Tripathy, S. , Kale, S.D. , Gu, B. , Sheng, Y. , Sui, Y. , Wang, X. , Zhang, Z. , Cheng, B. , Dong, S. , Shan, W. , Zheng, X. , Dou, D. , Tyler, B.M. and Wang, Y. (2011) Transcriptional programming and functional interactions within the Phytophthora sojae RXLR effector repertoire. Plant Cell, 23, 2064–2086. [DOI] [PMC free article] [PubMed] [Google Scholar]
- van West, P. , de Jong, A.J. , Judelson, H.S. , Emons, A.M. and Govers, F. (1998) The ipiO gene of Phytophthora infestans is highly expressed in invading hyphae during infection. Fungal Genet. Biol. 23, 126–138. [DOI] [PubMed] [Google Scholar]
- Whisson, S.C. , Boevink, P.C. , Moleleki, L. , Avrova, A.O. , Morales, J.G. , Gilroy, E.M. , Armstrong, M.R. , Grouffaud, S. , van West, P. , Chapman, S. , Hein, I. , Toth, I.K. , Pritchard, L. and Birch, P.R.J. (2007) A translocation signal for delivery of oomycete effector proteins into host plant cells. Nature, 450, 115–118. [DOI] [PubMed] [Google Scholar]
- Win, J. , Morgan, W. , Bos, J. , Krasileva, K.V. , Cano, L.M. , Chaparro‐Garcia, A. , Ammar, R. , Staskawicz, B.J. and Kamoun, S. (2007) Adaptive evolution has targeted the C‐terminal domain of the RXLR effectors of plant pathogenic oomycetes. Plant Cell, 19, 2349–2369. [DOI] [PMC free article] [PubMed] [Google Scholar]
- Xiong, Q. , Ye, W. , Choi, D. , Wong, J. , Qiao, Y. , Tao, K. , Wang, Y. and Ma, W. (2014) Phytophthora suppressor of RNA silencing 2 is a conserved RxLR effector that promotes infection in soybean and Arabidopsis thaliana . Mol. Plant–Microbe Interact. 27, 1379–1389. [DOI] [PubMed] [Google Scholar]
- Ye, J. , Coulouris, G. , Zaretskaya, I. , Cutcutache, I. , Rozen, S. and Madden, T. (2012) Primer‐BLAST: a tool to design target‐specific primers for polymerase chain reaction. BMC Bioinformatics, 13, 134. [DOI] [PMC free article] [PubMed] [Google Scholar]
- Ye, W. and Ma, W. (2016) Filamentous pathogen effectors interfering with small RNA silencing in plant hosts. Curr. Opin. Microbiol. 32, 1–6. [DOI] [PubMed] [Google Scholar]
- Yoshida, K. , Schuenemann, V.J. , Cano, L.M. , Pais, M. , Mishra, B. , Sharma, R. , Lanz, C. , Martin, F.N. , Kamoun, S. , Krause, J. , Thines, M. , Weigel, D. and Burbano, H.A. (2013) The rise and fall of the Phytophthora infestans lineage that triggered the Irish potato famine. eLife, 2, e00731. [DOI] [PMC free article] [PubMed] [Google Scholar]
- Yoshikawa, M. , Peragine, A. , Park, M.Y. and Poethig, R.S. (2005) A pathway for the biogenesis of trans‐acting siRNAs in Arabidopsis . Gene. Dev. 19, 2164–2175. [DOI] [PMC free article] [PubMed] [Google Scholar]
- Zhai, J. , Jeong, D.H. , De Paoli, E. , Park, S. , Rosen, B.D. , Li, Y. , González, A.J. , Yan, Z. , Kitto, S.L. , Grusak, M.A. , Jackson, S.A. , Stacey, G. , Cooke, D.R. , Green, P.J. , Sherrier, D.J. and Meyers, B.C. (2011) MicroRNAs as master regulators of the plant NB‐LRR defense gene family via the production of phased, trans‐acting siRNAs. Gene. Dev. 25, 2540–2553. [DOI] [PMC free article] [PubMed] [Google Scholar]
- Zhai, J. , Zhang, H. , Arikit, S. , Huang, K. , Nan, G.L. , Walbot, V. and Meyers, B.C. (2015) Spatiotemporally dynamic, cell‐type‐dependent premeiotic and meiotic phasiRNAs in maize anthers. Proc. Natl. Acad. Sci. USA, 112, 3146–3151. [DOI] [PMC free article] [PubMed] [Google Scholar]
- Zheng, Y. , Wang, Y. , Wu, J. , Ding, B. and Fei, Z. (2015) A dynamic evolutionary and functional landscape of plant phased small interfering RNAs. BMC Biol. 13, 32. [DOI] [PMC free article] [PubMed] [Google Scholar]
- Zuluaga, A.P. , Vega‐Arreguín, J.C. , Fei, Z. , Ponnala, L. , Lee, S.J. , Matas, A.J. , Patev, S. , Fry, W.E. and Rose, J.K.C. (2016) Transcriptional dynamics of Phytophthora infestans during sequential stages of hemibiotrophic infection of tomato: transcriptome of P. infestans in tomato. Mol. Plant Pathol. 17, 29–41. [DOI] [PMC free article] [PubMed] [Google Scholar]
Associated Data
This section collects any data citations, data availability statements, or supplementary materials included in this article.
Supplementary Materials
Additional Supporting Information may be found in the online version of this article at the publisher‘s website:
Fig. S1 Cladogram of the Phytophthora parasitica RNA silencing suppressor PSR2 (PpPSR2). The cladogram of the PpPSR2 proteins shows that PpPSR2 forms two distinct groups within P. parasitica (paralogue 1 in the purple box and paralogue 2 in the green box). Phytophthora infestans PSR2 (PiPSR2) was used as an outgroup. Bootstrap values < 50 are not shown.
Fig. S2 Distribution of amino acid changes across isolates. (a) Maximum likelihood phylogeny of the mitochondrial sequences of nine Phytophthora infestans isolates. Phytophthora ipomoeae was used as an outgroup. Bootstrap values > 70 are given at the nodes. (b) Cladogram of the phylogeny. Amino acid changes in the PiPSR2 proteins in the different isolates are indicated on the branches. (c) Amino acid changes of PiPSR2 in all isolates compared with the reference isolate T30‐4 at the polymorphic positions.
Fig. S3 MAST motifs in Phytophthora infestans RNA silencing suppressor PSR2 (PiPSR2). MAST output for the PiPSR2 amino acid alignment. Blue and purple boxes indicate the W and Y motifs found in the MAST output. Red boxes indicate that this motif is similar to another motif detected earlier in this search.
Fig. S4 Phytophthora infestans infection of cultivated and wild tomatoes. Leaflets of Solanum lycopersicum and S. pimpinellifolium were inoculated with P. infestans isolates D12‐2 (blue) and T20‐2 (yellow). T20‐2 showed variable infection progress indicated by T20‐2 s (dark yellow) for an infection that caused strong symptoms and T20‐2 w (light yellow) for an infection that caused mild symptoms. Representative bleached leaflets are shown for 0, 24, 48, 72 and 96 h post‐inoculation (hpi).
Fig. S5 Relative necrotic area in Phytophthora infestans infection. The average relative necrotic areas of infected and mock control (H2O) leaflets from Solanum lycopersicum and S. pimpinellifolium infections are shown. Leaflets were infected with P. infestans isolate D12‐2 (a) or T20‐2 (b). Error bars indicate the standard error. Letters above the bars indicate significance groups between time points and infection and mock control within a host plant. Samples were taken at 0, 24, 48, 72 and 96 h post‐inoculation (hpi).
Fig. S6 Progression of the Phytophthora infestans life cycle. Infections of P. infestans isolate D12‐2 (a) and T20‐2 (b) in Solanum lycopersicum and S. pimpinellifolium were screened for the presence of haustoria (green), developing sporangia (beige) and mature sporangia (dark brown). Infections were analysed at 24, 48, 72 and 96 h post‐inoculation (hpi). We calculated the relative number of leaflets with at least one haustorium, developing sporangium or sporangium present (n = 21–28 per time point and infection).
Fig. S7 Expression differences of CRN PITG12646 in the different isolates. Pairwise relative expression of CRN PITG12646 on Solanum lycopersicum (a) and S. pimpinellifolium (b) at 24, 48, 72 and 96 h post‐inoculation (hpi). Expression was measured using quantitative reverse transcription‐polymerase chain reaction (qRT‐PCR). For normalization, the reference genes PiH2a and PiElf1a were used. Error bars indicate the standard error of the mean (SEM). Significance classes are given as letters above the bar graph. Significance was calculated within one time point.
Fig. S8 Alignment of PSR2. Alignment of the PiPSR2 sequences from 19 P. infestans isolates used for the population genetic analyses. The names of the isolates are indicated on the left. Phytophthora sojae was used as an outgroup. The consensus sequence and the conservation level from 0% to 100% are given below the alignment.
Fig. S9 Alignment of PiATP5D. Alignment of the PiATP5D sequences from six Phytophthora infestans isolates used for the population genetic analyses. Sequences were obtained from a de novo assembly of the raw data from Yoshida et al. (2013). The names of the isolates are indicated on the left. The consensus sequence and the conservation level from 0% to 100% are given below the alignment.
Fig. S10 Alignment of PiElf1a. Alignment of the partial PiElf1a sequences from seven Phytophthora infestans isolates used for the population genetic analyses. Sequences were obtained from a de novo assembly of the raw data from Yoshida et al. (2013). The names of the isolates are indicated on the left. The consensus sequence and the conservation level from 0% to 100% are given below the alignment.
Fig. S11 Alignment of PiAGO1. Alignment of the PiAGO1 sequences from seven Phytophthora infestans isolates used for the population genetic analyses. Sequences were obtained from a de novo assembly of the raw data from Yoshida et al. (2013). The names of the isolates are indicated on the left. The consensus sequence and the conservation level from 0% to 100% are given below the alignment.
File S1 Protein and nucleotide sequences of Phytophthora infestans RNA silencing suppressor PSR2 (PiPSR2) (de novo assembly).
Table S1 McDonald–Kreitman table.
Table S2 Statistical differences between PSR2 expression data. The P value was calculated with a Mann–Whitney U‐test. Values in bold indicate significant differences.
Table S3 Primer sequences.
Table S4 Origin of Phytophthora infestans strains and accessions.
Table S5 Gene accession numbers.