

SUMMARY
Viroids are small (246–401 nucleotides), single‐stranded, circular RNA molecules that infect several crop plants and can cause diseases of economic importance. Citrus are the hosts in which the largest number of viroids have been identified. Citrus exocortis viroid (CEVd), the causal agent of citrus exocortis disease, induces considerable losses in citrus crops. Changes in the gene expression profile during the early (pre‐symptomatic) and late (post‐symptomatic) stages of Etrog citron infected with CEVd were investigated using a citrus cDNA microarray. MaSigPro analysis was performed and, on the basis of gene expression profiles as a function of the time after infection, the differentially expressed genes were classified into five clusters. FatiScan analysis revealed significant enrichment of functional categories for each cluster, indicating that viroid infection triggers important changes in chloroplast, cell wall, peroxidase and symporter activities.
INTRODUCTION
Viroids are small, single‐stranded, covalently closed, circular RNAs that do not encode proteins. Viroids are obligate parasites of the transcriptional machinery of their host plants in which they may elicit disease symptoms. Even though viroids are considered as plant pathogens, they may infect and replicate as latent infections in a wide range of tolerant hosts (Duran‐Vila and Semancik, 2003). The unusual molecular properties of viroids (small size, circularity, high G + C content in members of the family Pospiviroidae and the presence of hammerhead ribozymes in members of the family Avsunviroidae) (Ding, 2009; Flores et al., 2005; Tsagris et al., 2008) support the notion that viroid‐like RNA molecules emerged in the RNA World that has been postulated to have preceded the living organisms known today (Diener, 1989). Viroids, as known, now rely on a tight relationship with their hosts in which they replicate and move. Even though tolerant hosts offer the best strategy for the survival of viroids, their recognition/identification is generally associated with characteristic symptoms induced in sensitive species of commercial value.
The symptoms resulting from viroid infection can affect the whole plant (stunting), stems (shortening, thickening), bark (scaling, pitting, gumming), leaves (epinasty, rugosity, mosaic, chlorosis, mottling, browning), flowers (variegation), fruits (size, colour, deformation) and tubers (malformation). Morphological and cytological symptoms have also been well documented (Semancik and Conejero‐Tomas, 1987) as distortions of cell wall and plasma membrane (Momma and Takahashi, 1982; Semancik and Wanderwoude 1976), chloroplasts (Da Graça and Martin, 1981; Hari, 1980; Momma and Takahashi, 1982) and mitochondria (Paliwal and Singh, 1981).
In spite of the existence of many symptomless hosts, the questions of why and how viroids induce disease symptoms in certain hosts remain far from understood. Studies aimed at the identification of segment(s) of the viroid molecule associated with symptom modulation have provided relevant information, indicating that the pathogenicity and variable domains of the rod‐like secondary structure play a key role as molecular determinants of pathogenicity in members of the family Pospiviroidae (Chaffai et al., 2007; Góra et al., 1996; Murcia et al., 2011; Reanwarakorn and Semancik, 1998; Serra et al., 2008; Visvader and Symons, 1986). In some members of the Avsunviroidae family with branched secondary structures, the pathogenicity determinants have been mapped in a U‐rich tetraloop (De la Peña et al., 1999; Malfitano et al., 2003). However, the specific mechanisms triggering the onset of symptoms still remain hypothetical and may involve interference with the host regulation machinery, resulting in modifications of host gene expression (Itaya et al., 2002; Tessitori et al., 2007).
Citrus exocortis viroid (CEVd) is a member of the genus Pospiviroid[type member, Potato spindle tuber viroid (PSTVd)] within the family Pospiviroidae. CEVd is the causal agent of exocortis disease of citrus, a bark scaling disorder that affects, among other hosts, trifoliate orange [Poncirus trifoliata (L.) Raf.] and its hybrids (Troyer and Carrizo citranges), as well as Rangpur lime (Citrus limonia Osb.), all of which are widely used as rootstocks in commercial orchards. CEVd has a large experimental host range, including woody and herbaceous species, with Etrog citron (Citrus medica L.) being used as an indicator species for biological indexing purposes. Following infection, Etrog citron displays a characteristic syndrome that includes severe stunting, leaf epinasty and midvein necrosis. Even though exocortis disease has been known for many decades (Fawcett and Klotz, 1948) and its causal agent, CEVd, has been well characterized, molecular aspects related to symptom expression remain unknown. Furthermore, research on citrus gene expression is scarce and studies on host–viroid interactions and their role in the modulation of gene expression in host plants are limited to studies on Citrus dwarfing viroid (CDVd, formerly CVd‐III) infecting Etrog citron, Troyer citrange, sour orange and alemow (Rizza et al., 2010; Tessitori et al., 2007), and on PSTVd infecting tomato plants (Wang et al., 2011). In all instances, comparisons have only been made between healthy tissues and tissues in the late (post‐symptomatic) stage of infection. This approach does not allow the evaluation of whether the changes in gene expression are indeed involved in symptom development or simply reflect the abnormal behaviour of diseased/symptomatic plants. Therefore, in the present work, the effects of a severe isolate of CEVd on the gene expression of Etrog citron were examined not only in late (post‐symptomatic) stages of infection, but also in early (pre‐symptomatic) stages, using the genome‐wide 20‐K cDNA microarray developed under the Citrus Functional Genomic Project (CFGP; http://www.ibmcp.upv.es/genomics/cfgpDB/), which includes 21 081 putative unigenes of citrus (Martinez‐Godoy et al., 2008).
RESULTS
Infection, symptom development and experimental design
Graft‐propagated Etrog citron plants were inoculated with the well‐characterized severe CEVd isolate (CEVd‐117) (Gandía et al., 2005). Assessment of infection by Northern hybridization showed that CEVd could be detected in the apical tissues at 30 days post‐inoculation (dpi), indicating that, during this period, the viroid replicated and spread systemically throughout the plant before any symptoms could be observed (Fig. 1). At this 30‐dpi symptomless stage, leaf samples were collected for microarray analysis (time point 1). Approximately 2 months later (90 dpi), when the infected plants showed the characteristic symptoms of epinasty and leaf curling (Fig. 1), additional leaf samples were collected (time point 2).
Figure 1.
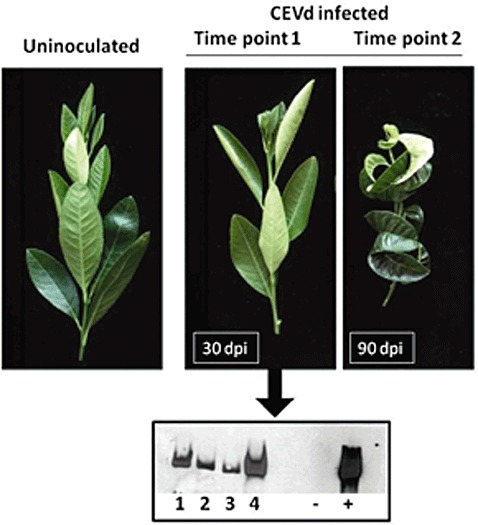
Symptoms of Citrus exocortis viroid (CEVd) infection on Etrog citron (Citrus medica L.) at 30 and 90 days post‐inoculation (dpi), and accumulation of the viroid in four independent plants at 30 dpi revealed by Northern blot. Symbols ‘–’ and ‘+’ refer to the controls from healthy and CEVd‐infected plants, respectively.
In all cases, noninoculated controls and CEVd‐infected plants were analysed as follows: (i) time point 0, healthy plants vs. reference; (ii) time point 1, infected plants at the symptomless stage vs. reference; (iii) time point 2, infected plants at the symptomatic stage vs. reference. The common reference consisted of a pool of all the samples included in the experiments.
Differential gene expression revealed by microarray analysis
A cDNA microarray containing 21 081 putative unigenes was used to analyse the effect of CEVd infection on the gene expression profile of CEVd‐infected Etrog citron plants. Total RNA was extracted from healthy and infected plants, amplified, labelled and hybridized to the microarray. Four biological replicates were analysed for each time point using a global reference experimental design.
Expression levels were analysed by the clustering methods UPGMA (unweighted pair group method with arithmetic mean) and SOTA (self‐organizing tree algorithm) (Herrero et al., 2001), but no clear clusters were identified with this approach. Further analysis using the model‐based univariate method maSigPro, designed to identify differentially expressed genes in time series microarray data (Conesa et al., 2006), revealed that 132 genes (Tables S1 and S2, see Supporting Information) changed their expression with time when the nominal P value (<0.05) was considered. None of these genes maintained significance after multiple testing adjustment by FDR (false discovery rate), presumably because of the strong correction imposed by the array size and the moderate change in gene expression measured. However, these genes showed good regression models (high R 2) and were selected, representing biologically meaningful transcriptional changes induced by viroid infection that could be used in a function‐based analysis approach. Hence, these 132 selected genes were classified into five clusters, each representing a distinct pattern of transcriptional response (Fig. 2).
Figure 2.
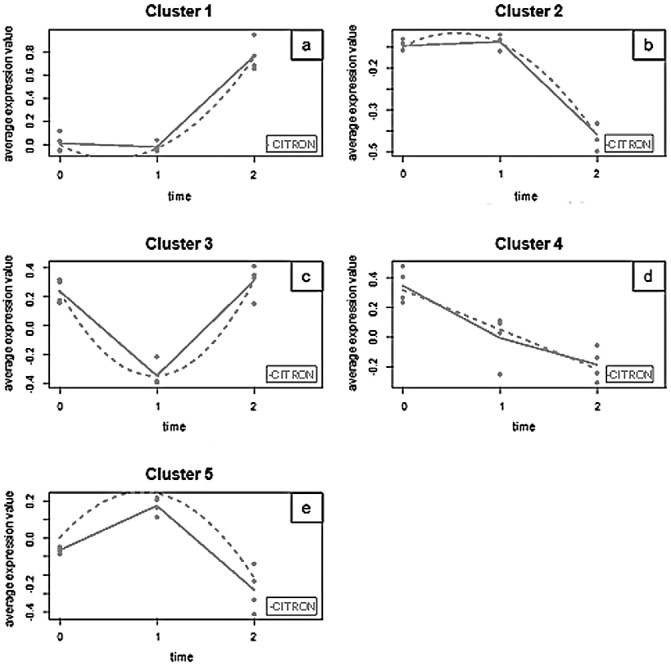
Gene expression profiles obtained by maSigPro analysis. For each cluster, a trajectory plot is generated that summarizes gene expression at each time point for the genes belonging to that group. Dots show the measured expression values. Full lines have been drawn joining the average value of gene expression at each time point for each experimental group. Fitted curves (regression models) are displayed as broken lines. Expression values are calculated with the formula: M value= log2(treatment intensity/reference intensity).
Genes in Cluster 1 (Fig. 2a) showed low expression levels at time points 0 and 1, and high expression levels at time point 2. Conversely, genes in Cluster 2 (Fig. 2b) showed high expression levels at time points 0 and 1, and low expression levels at time point 2. The expression of Cluster 3 genes (Fig. 2c) was high at time point 0, low at time point 1 and high again at time point 2. In Cluster 4 (Fig. 2d), genes showed high expression at time point 0, low expression at time point 2 and an intermediate expression at time point 1. Finally, genes in Cluster 5 (Fig. 2e), in contrast with those in Cluster 3, presented low expression at time point 0, high expression at time point 1 and low expression again at time point 2.
Functional analysis during the infection course
In order to understand how cellular functions were activated or deactivated during the infection course, the microarray gene list was ordered according to the correlation of each gene expression profile to the median profile of the expression of each cluster obtained by maSigPro analysis. This ranking was subjected to gene set enrichment analysis with the partitioning method FatiScan (Al‐Shahrour et al., 2005) to identify functional categories associated with the specific time patterns. The FatiScan analysis revealed a number of significant enriched functional terms as described below (Fig. 3 and Table 1).
Figure 3.
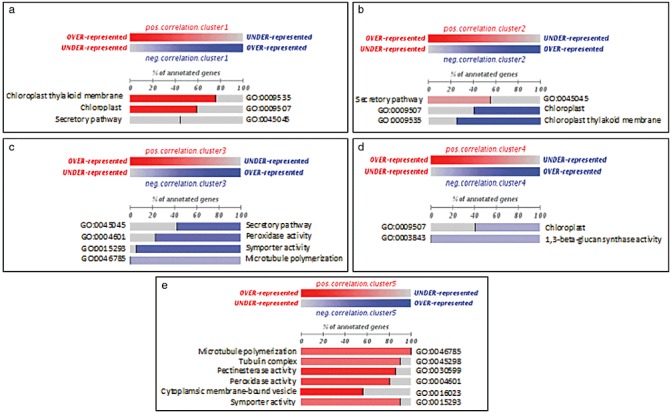
Fatiscan gene set enrichment results. Significant gene ontology (GO) terms obtained on application of the FatiScan tool to study the asymmetrical distributions of functional terms in different partitions of the list of genes ranked by their correlation to each of the transcriptional profiles (Clusters 1–5). The normalized percentage of genes annotated with a specific term is indicated for each group. Red indicates a positive correlation with the cluster expression profile and blue a negative correlation. The colour intensity denotes how strongly the term is correlated.
Table 1.
Significant functional classes and over‐represented genes associated with each functional term revealed by FatiScan analysis in Clusters 3, 4 and 5. Genes annotated to the functional terms and detected as coordinated functional blocks by FatiScan are shown.
| (1)* | (2)* | (3)* | ||||
|---|---|---|---|---|---|---|
| Cluster 3 | Symporter activity | KN0AAK3DE01 | Inorganic phosphate transporter | −0.699 | 0.14 | −0.52 |
| IC0AAA86CC03 | Hexose carrier protein HEX6 | −1.000 | 0.23 | −0.23 | ||
| C31504B10 | Hexose transporter | −0.824 | 0.05 | −0.02 | ||
| IC0AAA18CD01 | Putative auxin influx carrier protein | −0.898 | 0.04 | −0.07 | ||
| C05057H12 | Auxin transporter protein 1 | −0.992 | 0.24 | −0.20 | ||
| IC0AAA10AE12 | Putative AUX1‐like permease | −0.789 | 0.09 | −0.22 | ||
| IC0AAA59AE04 | Inorganic phosphate transporter 1–7 (AtPht1−7) (H(+)/Pi cotransporter) | −0.686 | 0.06 | −0.25 | ||
| C32107H03 | Sugar carrier protein A | −0.983 | 0.09 | −0.07 | ||
| C31704H12 | Inorganic phosphate transporter 1–5 (AtPht1−5) (H(+)/Pi cotransporter) | −0.857 | 0.06 | −0.13 | ||
| Microtubule polymerization | IC0AAA12CB05 | Tubulin β‐2/β‐3 chain | −0.569 | 0.04 | −0.44 | |
| C02010C12 | Tubulin β‐2 chain | −0.767 | 0.37 | −1.04 | ||
| IC0AAA54CG03 | Tubulin β‐2/β‐3 chain | −0.536 | 0.01 | −0.21 | ||
| C31804C06 | Tubulin β‐2 chain | −0.997 | 0.69 | −0.62 | ||
| C34009C09 | Tubulin β‐2/ β‐3 chain | −0.305 | −0.02 | −0.09 | ||
| C32107F01 | Tubulin β‐1 chain | −0.999 | 0.59 | −0.62 | ||
| C08018C08 | α Tubulin | −0.855 | 0.09 | −0.19 | ||
| C02015H07 | Tubulin α‐1 chain | −0.862 | 0.71 | −0.35 | ||
| C32005G08 | Tubulin α‐2 chain | −0.972 | 0.27 | −0.20 | ||
| C31002F02 | Plastid division protein FtsZ | −0.564 | 0.02 | −0.17 | ||
| IC0AAA41BB06 | Tubulin α‐13 chain | −0.662 | 0.05 | −0.23 | ||
| C32003A11 | Tubulin α‐2 chain | −0.951 | 0.39 | −0.57 | ||
| C02001A04 | Tubulin α‐2 chain | −0.822 | 0.33 | −0.14 | ||
| C02026E01 | Cell division protein ftsZ homologue—chloroplast precursor | −0.414 | −0.03 | −0.27 | ||
| Cluster 4 | 1,3‐Glucanase callose synthase | KN0AAH2CH11 | Putative callose synthase 1 catalytic subunit | −0.995 | 0.20 | 0.09 |
| C18005G07 | Callose synthase catalytic subunit‐like protein | −0.742 | −0.01 | 0.14 | ||
| KN0AAP12YI04 | Putative callose synthase catalytic subunit | −0.530 | −0.25 | 0.68 | ||
| C02015B04 | Putative callose synthase 1 catalytic subunit | −0.745 | 0.17 | −0.06 | ||
| C01011B08 | Callose synthase 1 catalytic subunit | −0.967 | 0.31 | 0.06 | ||
| KN0AAP12YI02 | Putative callose synthase catalytic subunit | −0.990 | 0.13 | 0.14 | ||
| C08018F03 | F3F20.1 protein | −0.982 | 0.35 | 0.45 | ||
| IC0AAA47AH11 | RH49985p | −0.648 | −0.04 | 0.16 | ||
| IC0AAA59BH03 | Putative glucan synthase component | −0.885 | 0.07 | −0.01 | ||
| Cluster 5 | Microtubule polymerization | IC0AAA12CB05 | Tubulin β‐2/β‐3 chain | 0.856 | 0.04 | −0.44 |
| C02010C12 | Tubulin β‐2 chain | 0.962 | 0.37 | −1.04 | ||
| IC0AAA54CG03 | Tubulin β‐2/β‐3 chain | 0.835 | 0.01 | −0.21 | ||
| C31804C06 | Tubulin β‐2 chain | 0.876 | 0.69 | −0.62 | ||
| C34009C09 | Tubulin β‐2/ β‐3 chain | 0.668 | −0.02 | −0.09 | ||
| C32107F01 | Tubulin β‐1 chain | 0.930 | 0.59 | −0.62 | ||
| C08018C08 | α Tubulin | 0.992 | 0.09 | −0.19 | ||
| C02015H07 | Tubulin α‐1 chain | 0.579 | 0.71 | −0.35 | ||
| C32005G08 | Tubulin α‐2 chain | 0.790 | 0.27 | −0.20 | ||
| C31002F02 | Plastid division protein FtsZ | 0.853 | 0.02 | −0.17 | ||
| IC0AAA41BB06 | Tubulin α‐13 chain | 0.911 | 0.05 | −0.23 | ||
| C32003A11 | Tubulin α‐2 chain | 0.994 | 0.39 | −0.57 | ||
| C02001A04 | Tubulin α‐2 chain | 0.516 | 0.33 | −0.14 | ||
| C02026E01 | Cell division protein ftsZ homologue—chloroplast precursor | 0.751 | −0.03 | −0.27 | ||
| Tubulin complex | C31804C06 | Tubulin β‐2 chain | 0.876 | 0.69 | −0.62 | |
| C34009C09 | Tubulin β‐2/β‐3 chain | 0.668 | −0.02 | −0.09 | ||
| C32107F01 | Tubulin β‐1 chain | 0.930 | 0.59 | −0.62 | ||
| C08018C08 | α Tubulin | 0.992 | 0.09 | −0.19 | ||
| C02015H07 | Tubulin α‐1 chain | 0.579 | 0.71 | −0.35 | ||
| C32005G08 | Tubulin α‐2 chain | 0.790 | 0.27 | −0.20 | ||
| C31002F02 | Plastid division protein FtsZ | 0.853 | 0.02 | −0.17 | ||
| IC0AAA41BB06 | Tubulin α‐13 chain | 0.911 | 0.05 | −0.23 | ||
| Cluster 5 | Peroxidase activity | C34105F01 | Peroxidase | 0.959 | 0.19 | −0.55 |
| IC0AAA46CH01 | LvsC‐like | 0.917 | 0.07 | −0.32 | ||
| C31707A07 | Peroxidase precursor | 0.994 | 0.22 | −0.32 | ||
| IC0AAA58DA01 | Putative peroxidase 48 | 0.780 | −0.01 | −0.22 | ||
| C32013F11 | Chloroplast Cu/ZnSOD | 0.948 | 0.04 | −0.13 | ||
| KN0AAK1CE04 | Apoplastic anionic guaiacol peroxidase | 0.924 | 0.08 | −0.09 | ||
| C31109C09 | Class III peroxidase | 0.991 | 0.14 | −0.29 | ||
| C31401B08 | Glutathione S‐transferase/peroxidase | 0.621 | 0.33 | −0.18 | ||
| C34103G06 | Peroxidase | 0.848 | 0.02 | −0.19 | ||
| C20004A02 | Peroxidase 10 precursor | 0.955 | 0.34 | −0.39 | ||
| IC0AAA67AG12 | Peroxidase ATP17a‐like protein | 0.937 | 0.12 | −0.13 | ||
| C20007E04 | Peroxiredoxin | 0.724 | −0.02 | −0.13 | ||
| C08034A06 | Peroxidase precursor | 0.936 | 0.20 | −0.21 | ||
| IC0AAA77DF02 | Peroxidase 41 precursor | 0.933 | 0.21 | −0.22 | ||
| C31109A01 | Peroxidase | 0.744 | 0.02 | −0.02 | ||
| C31010D03 | Peroxidase precursor | 0.991 | 0.38 | −0.81 | ||
| KN0AAL2CF07 | Peroxidase 10 precursor | 0.941 | 0.31 | −0.33 | ||
| C18018D07 | Peroxidase | 0.993 | 0.10 | −0.15 | ||
| C02016E06 | SAC1‐like protein AtSAC1b | 0.872 | 0.12 | −0.96 | ||
| C32004B11 | Peroxidase | 0.928 | 0.06 | −0.22 | ||
| C06052F04 | Peroxisomal membrane protein | 0.604 | 0.49 | −0.26 | ||
| C34108C02 | Anx1 | 0.977 | 0.53 | −0.67 | ||
| C31701H09 | Putative annexin | 0.999 | 0.30 | −0.46 | ||
| C31503H10 | Class III peroxidase | 0.870 | 0.03 | −0.23 | ||
| C02013A01 | Subtilisin‐like protease | 0.660 | −0.10 | −0.34 | ||
| KN0AAL2DA11 | Peroxidase | 0.913 | 0.06 | −0.27 | ||
| C03007E08 | Annexin‐like protein | 0.852 | 0.02 | −0.27 | ||
| C01010E07 | No annotation available | 0.954 | 0.13 | −0.15 | ||
| C08032B11 | Peroxidase precursor | 0.995 | 0.51 | −0.75 | ||
| IC0AAA49BC01 | Peroxidase 65 precursor | 0.773 | 0.00 | −0.04 | ||
| C16018A09 | Cationic peroxidase isozyme 40‐K precursor | 0.481 | −0.50 | −0.67 | ||
| IC0AAA11BB06 | F22C12.18 | 0.442 | −0.14 | −0.16 | ||
| IC0AAA42DG07 | Peroxidase 9 precursor | 0.373 | −0.10 | −0.08 | ||
| Pectinesterase activity | C31002C11 | Putative pectinesterase | 0.988 | 0.15 | −0.32 | |
| C34003B03 | Pectinesterase‐1 precursor | 0.848 | 0.05 | −0.65 | ||
| IC0AAA40DF03 | Pectin methylesterase‐like protein | 0.959 | 0.02 | −0.03 | ||
| IC0AAA15CB04 | AT5g47500/MNJ7_9 | 0.779 | −0.03 | −0.51 | ||
| KN0AAP8YH13 | Putative pectinesterase | 0.816 | 0.01 | −0.75 | ||
| C05070B02 | Pectinesterase—putative | 0.964 | 0.46 | −1.29 | ||
| C31707D04 | Pectinesterase | 0.901 | 0.28 | −0.27 | ||
| IC0AAA22CD03 | Putative thermostable pectinesterase | 0.814 | 0.00 | −0.39 | ||
| C32008C04 | Pectinesterase‐like protein | 0.810 | 0.67 | −0.52 | ||
| C01011H09 | Pectin methylesterase | 0.985 | 0.42 | −0.95 | ||
| C32106D11 | AT5g47500/MNJ7_9 | 0.947 | 0.10 | −0.32 | ||
| IC0AAA58CF11 | Pectinesterase PPE8B precursor | 0.782 | −0.01 | −0.15 | ||
| C08034E01 | Pectinesterase‐2 precursor | 0.944 | 0.06 | −0.22 | ||
| C08001C06 | Pectinesterase—putative | 0.764 | 0.23 | −0.17 | ||
| C02016C05 | Pectinesterase—putative | 0.948 | 0.53 | −1.70 | ||
| C16000A09 | Pectinesterase‐2 precursor | 0.861 | 0.08 | −0.78 | ||
| C08033H07 | Pectin methylesterase precursor | 0.991 | 0.19 | −0.26 | ||
| C02004B01 | Putative pectinesterase | 0.965 | 0.40 | −1.10 | ||
| C05807A09 | Pectin methylesterase PME1 | 0.551 | −0.14 | −0.26 | ||
| IC0AAA5AF04 | Protein At5g20860 | 0.720 | −0.05 | −0.31 | ||
| C05131B05 | Pectinesterase‐3 precursor | 0.427 | −0.14 | −0.15 |
(1) Correlation with cluster; (2) fold change time point 1–time point 2; (3) fold change time point 2–time point 1.
Functional analysis of Cluster 1 (Fig 3a). Over‐represented gene ontology (GO) functional terms positively correlating with the Cluster 1 expression profile were chloroplast thylakoid membrane (GO:0009535), chloroplast (GO:0009507) and secretory pathway (GO:0045045).
Functional analysis of Cluster 2 (Fig. 3b). Over‐represented GO functional terms negatively correlating with the Cluster 2 expression profile were the same GO terms as for Cluster 1. As the expression profile of Cluster 2 is opposite to that of Cluster 1, the negative correlation of the same GO terms was expected.
Functional analysis of Cluster 3 (Fig. 3c). Over‐represented GO functional groups included symporter activity (GO:0015293), microtubule polymerization (GO:0046785), peroxidase activity (GO:0004601) and secretory pathway (GO:0045045). The symporter activity functional category could, in turn, be subdivided into phosphate transporter (GO:0006817), carbohydrate transporter (GO:0008643) and auxin (GO:0009672). All GO functional groups showed coordinated expression to the expression profile of the cluster. Genes annotated at each functional term displaying positive correlation with the mean profile of Cluster 3 are shown in Table 1.
Functional analysis of Cluster 4 (Fig. 3d). Only two significant enriched GO terms were found: 1,3‐β‐glucan biosynthetic process (GO:0003843) and chloroplast (GO:0009507). Genes activated in this category correlated negatively with the median profile of expression of Cluster 4, indicating that the expression of this functional block actually increased after infection. The gene list is shown in Table 1.
Functional analysis of Cluster 5 (Fig. 3e). Over‐represented GO functional groups included pectinesterase activity (GO:0030599), microtubule polymerization (GO:0046785), tubulin complex (GO:0045298), peroxidase activity (GO:0004601), symporter activity (GO:0015293) and cytoplasmic membrane‐bound vesicle (GO:0030599). The block of genes detected by FatiScan belonging to these functional categories showed a positive correlation with the expression profile of the cluster. As expression profiles from Clusters 3 and 5 are opposite to each other, some GO terms were expected to be present in both clusters (symporter activity, microtubule polymerization and peroxidase activity).
Validation of induced gene functions
Six genes (pyruvate phosphate dikinase chloroplast precursor, putative callose synthase 1 catalytic subunit, auxin transporter protein 1, cell division protein FtsH isologue, peroxidase precursor and xyloglucan transferase) were selected on the basis of their involvement in some of the enriched functional categories to validate the microarray results. It should be noted that these genes, as others in Table 1, were reported for their annotation to functionally enriched terms and for participation in a significant block of functionally related genes, but were not necessarily considered as significant by the univariate maSigPro method. However, we postulated that these genes might be transcriptionally regulated and, indeed, their differential expression was confirmed by quantitative real‐time reverse transcription‐polymerase chain reaction (RT‐PCR) using the same RNA preparations as analysed in the hybridization microarray assays (Table 2). However, the changes detected by both procedures were not identical, as commonly observed in validation attempts of microarray results by RT‐PCR (Allen and Nuss, 2004; López et al., 2005).
Table 2.
Changes in gene expression estimated by microarray hybridization and by quantitative real‐time reverse transcription‐polymerase chain reaction (RT‐PCR).
| Citrus EST Accession No. | Cluster* | Best blast hit | Primers | Fold change average in microarray† | Fold change average in RT‐PCR† | ||
|---|---|---|---|---|---|---|---|
| Tp 1‡ | Tp 2 | Tp 1 | Tp 2 | ||||
| C16015E06 | (+) 1 | Pyruvate phosphate dikinase chloroplast precursor | 5′‐CAAAGTGACCCATTCGAGGT‐3′ | 0.95 | 2.40 | 1.03 | 2.76 |
| 5′‐CCCATGCTCTCCACATATCC‐3′ | |||||||
| KN0AAH2CH11 | (−) 4 | Putative callose synthase 1 catalytic subunit | 5′‐TGCACTTCCACACATGACAG‐3′ | 1.24 | 2.30 | 1.45 | 2.87 |
| 5′‐TCCAGCTCGGTGAATAACAG ‐3′ | |||||||
| C05057H12 | (−) 3 | Auxin transporter protein 1 | 5′‐ACCGTCTACATCATCCCA‐3′ | 3.14 | 1.08 | 4.30 | 2.28 |
| 5′‐CCACAAATACCCACACAA‐3′ | |||||||
| C02009G01 | (+) 4 | Cell division protein FtsH isologue | 5′‐TCTCCATTCCTGCCTCTC −3′ | 2.33 | 1.13 | 2.69 | 1.07 |
| 5′‐CATTGTCCTTGGCCTCCT‐3′ | |||||||
| C31010D03 | (+) 5 | Peroxidase precursor | 5′‐GAGCTTTGGTATGAGGAACT‐3′ | 2.69 | 1.25 | 3.21 | 2.03 |
| 5′‐ATTGTGATCTGGGAGATAGTG‐3′ | |||||||
| C05133B06 | (+) 5 | Xyloglucan transferase | 5′‐ACCTCTGGTTTGACCCCTCT‐3′ | 2.78 | 1.18 | 3.18 | 2.30 |
| 5′‐GGTCTTTGGGGAAGGAACTC‐3′ | |||||||
(+) or (−) means positive or negative correlation with the indicated gene cluster.
Fold change refers to time point 0.
Tp means time point.
Comparison of chlorophyll contents by confocal laser scanning microscopy (CLSM) showed that chlorophyll fluorescence in the leaves of infected plants was lower than that in the leaves of healthy controls (Fig. 4a). CLSM and soil plant analysis development (SPAD) measurements, used to estimate leaf chlorophyll concentration, revealed significant differences between healthy and infected plants, with leaves from infected samples showing a lower chlorophyll concentration than leaves from healthy controls (56.9 ± 2.6, 41.02 ± 3.8 and 39.91 ± 8.5 SPAD units for time points 0, 1 and 2, respectively; P < 0.003).
Figure 4.
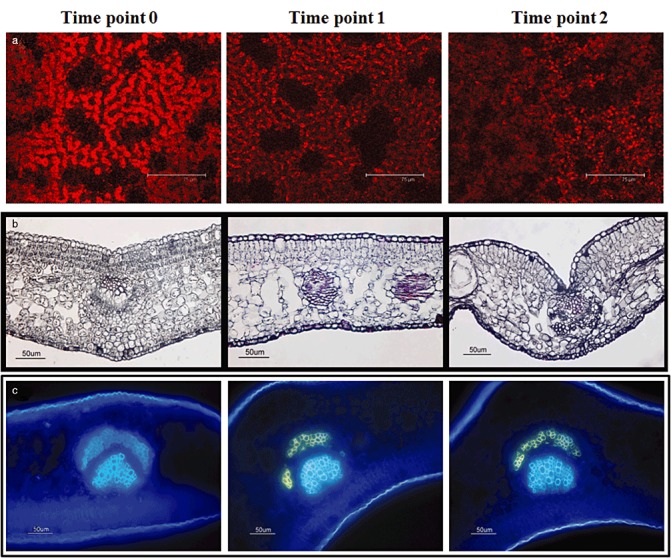
Confocal and optical microscopy of healthy and Citrus exocortis viroid (CEVd)‐infected Etrog citron plants at the different time points. The first column refers to healthy tissue, and the second and third to CEVd‐infected tissue at 30 and 90 days post‐inoculation (dpi), respectively. (a) Leaf pieces of control and infected plants. (b) Transverse section of leaves stained with ruthenium red. (c) Transverse section of leaves stained with aniline blue.
To obtain more detailed information on the differences in cell wall components that might be altered in response to CEVd infection, ruthenium red and aniline blue were used to stain leaf sections. When leaf sections of healthy and infected plants were stained for pectin with ruthenium red (Hanke and Northcote, 1975), differences in cell wall thickness of the epidermal cells became evident in the symptomless stages (Fig. 4b). Moreover, spongy and palisade mesophyll appeared to be more disorganized in leaves of infected plants from the pre‐symptomatic stage. In addition, the use of aniline blue to reveal changes in callose content showed that callose deposits occurred in the phloem fibres of leaves of pre‐symptomatic and symptomatic viroid‐infected plants, but not in those of healthy controls (Fig. 4c).
DISCUSSION
Viroid infection triggers numerous changes in host plants. Early studies revealed aberrations in cell wall structure and chloroplast organization as possible primary sites of viroid‐induced lesions (Semancik and Conejero‐Tomas, 1987). Since then, significant advances have highlighted a complex series of host responses that are triggered by viroids (Ding, 2009; Flores et al., 2005; Owens and Hammond, 2009). However, to date, only three studies have reported the effects of viroid infection at the transcriptional level. Itaya et al. (2002), using a PCR‐based cDNA library subtraction approach, compared the changes in gene expression caused by PSTVd, and Tessitori et al. (2007) and Rizza et al. (2010) applied differential display RT‐PCR and quantitative real‐time RT‐PCR analysis to the study of the transcriptional response of Etrog citron, Troyer citrange, sour orange and alemow infected with CDVd. Transcriptional changes, detected in 18 genes (13 up‐ and five down‐regulated), in response to viroid infection, involved defence/stress responses, cell wall structure, chloroplast function and protein metabolism. However, these studies were performed by comparing healthy with infected/symptomatic plants. Consequently, the temporal response of gene expression could not be evaluated and the changes associated with symptom expression could not be discriminated from those resulting from the abnormal behaviour of declining plants.
In the present study, we set out to understand the transcriptional and physiological changes induced by viroid infection of Etrog citron plants at early (pre‐symptomatic) and late (post‐symptomatic) stages. To this end, we performed a time course experiment in which gene expression was measured on a genome‐wide citrus microarray, and adopted a systems biology analysis strategy: we first identified patterns of transcriptional response (Fig. 2) and then searched for cellular functions that would associate with these patterns (Table 1). This approach was proposed by Nueda et al. (2009) for the functional analysis of time series data, and successfully applied by Prado‐Lopez et al. (2010) to study hypoxia‐induced transcriptional changes in embryonic stem cells. Moreover, physiological assays were conducted to validate the results of the bioinformatics analysis.
We identified five distinctive profiles of gene expression. Genes from Clusters 1 and 2 showed no differential expression in the pre‐symptomatic stage, but were found to be altered in the post‐symptomatic stage, probably as a consequence of the abnormal growth habit of symptomatic plants. Enriched functional categories linked to these clusters were mainly chloroplast, chloroplast thylakoid membrane and secretory pathway. As the objective of this study was to identify changes that might be related to symptom development, the numerous genes included in these categories (343, 33 and 294, respectively) were not studied further. Nevertheless, it should be pointed out that effects on chloroplast metabolism are one common consequence of viroid infection (Owens and Hammond, 2009), with photosynthesis being suppressed by distinct pathogens (Bonfig et al., 2006; Scharte et al., 2005). Indeed, the estimation of relative chlorophyll contents in healthy and CEVd‐infected plants by CLSM and SPAD showed that chlorophyll fluorescence decreased strongly in infected plants, most probably accounting for leaf chlorosis in the later stages of disease development. These results are in line with those of Berger et al. (2007), who observed a decrease in chlorophyll fluorescence associated with a decrease in photosynthetic activity in Arabidopsis plants after infection with Pseudomonas syringae.
The regulation of photosynthesis is known to be mediated by sugars (Scharte et al., 2005; Sinha and Roitsch, 2001). The sink strength of the plant usually increases when assimilates are mobilized for defence reactions (Roitsch et al., 2003; Roitsch and Gonzalez, 2004). Defence, sink metabolism and photosynthesis have been reported to be coordinately regulated (Ehness et al., 1997; Herbers et al., 1996). Symporter activity, which enables the active transport of several solutes across a membrane in a tightly coupled process, was found to be negatively correlated with Cluster 3 and positively with Cluster 5, indicating that it increases in early stages and decreases in post‐symptomatic stages. As shown in Table 1, symporter activity includes genes involved in carbohydrate, auxin and phosphate transport. It has been demonstrated that the mobilization of local carbohydrate metabolites and long‐distance sugar transport support defence responses in plants. Imported carbon is used to support secondary metabolism (Rico et al., 2008) and, without it, defence responses, such as the production of tannins or phenolic compounds, are inhibited (Arnold et al., 2004; Arnold and Schultz, 2002). Viruses and viroids exploit the assimilate transport system for their long‐distance transport. In addition, carbohydrate source–sink interactions can be modified as a result of infection to enable the successful colonization of host plants by pathogens (reviewed by Biemelt and Sonnewald, 2006). In the case of viroid–host interactions, only limited information is available, but long‐term studies performed with citrus trees revealed that viroid‐infected trees presented a smaller root–shoot system. These plants presented only a small number of parenchyma cells containing stored carbohydrates relative to noninfected control plants (Bani Hashemian et al., 2009). This effect is caused by a reduced source–sink transport, resulting in an unbalanced root–canopy system and, consequently, in the dwarfing associated with viroid infection.
The auxin transport GO term correlated negatively with the profile of Cluster 3 and positively with the profile of Cluster 5. The relation of auxin to viroid infection was reported by Duran‐Vila and Semancik (1981), who showed the inability of tomato tissue infected with CEVd to respond to exogenous auxins. This inability might be involved in the development of the pathogenic syndrome caused by CEVd, not only in tomato, but also in Carrizo citrange (Bani Hashemian et al., 2009).
Recent studies (for a review, see Spoel and Dong 2008) have highlighted that the perturbation of auxin homeostasis is a common virulence mechanism, as many pathogens can synthesize auxin‐like molecules. This situation may impact directly on auxin biosynthesis, accumulation and metabolism, and alter auxin transport (Mathesius, 2010), eventually acting by suppressing the host defence responses that are mediated by salicylic acid (SA) (Wang et al., 2007). Although our results show the involvement of auxin in the response of the plant to viroid infection, none of the mechanisms suggested by Spoel and Dong (2008) seem to be involved in CEVd or other viroids. Indeed, viroid pathogens do not feed on living host cells and do not need carbon or nitrogen sources. The involvement of R genes is unlikely to operate in viroid infection because they do not code for proteins. However, viroid infection has been reported to induce genes of the systemic acquired resistance (SAR) pathway, such as those coding for PR‐1 and β‐1,3‐glucanase (Itaya et al., 2002). The viroid‐activated pathway linked with SAR to activate these genes remains to be elucidated, but the involvement of auxins cannot be ruled out.
An important part of the transcriptional changes found to be affected in response to CEVd infection deals with genes for proteins involved in cell wall remodelling (mainly pectin and callose components). Callose has been reported to be deposited at plasmodesmata and sieve plates to limit intercellular transport in response to pathogen attack or other environmental signals (Kauss, 1996; Stone and Clarke, 1992). Deposits of callose reinforce the cell wall at the local infection point and limit the spread of fungal infection in resistant plants (Trillas et al., 2000), and also limit or prevent the spread of viruses (Iglesias and Meins, 2000). Callose deposits are tightly linked to two other GO‐enriched functions found to change in response to CEVd infection: microtubule polymerization and tubulin complex. Hirai et al. (1998) found that, in the presence of taxol (which stabilizes microtubules), callose deposits are found in oriented microfibrils, whereas, in the presence of propyzamide (which disrupts microtubules), they are diffusely distributed in masses, suggesting that microtubules control callose deposits. Further studies have shown the link between deposits of callose and the depolymerization of microtubules (Yasuhara, 2005), and the co‐migration of tubulin and callose synthase as part of the same plasma membrane protein complex (Aidemark et al., 2009).
Another GO term, related to the cell wall, which was significantly enriched following viroid infection is pectinesterase activity. This activity is positively correlated with the Cluster 5 expression profile. The pectinesterase multigene family is involved in cell wall turnover, having a role in plant growth and development. Pectinesterase activity modulates pH and ion balance, affects cell wall porosity (Narin et al., 1998) and catalyses the de‐esterification of pectin, producing blocks of unesterified carboxyl groups that interact with calcium ions forming a pectate gel that contributes to cell wall reinforcement (Markovič and Jörnvall, 1986). Staining of leaf sections with ruthenium red further revealed that the cell walls of CEVd‐infected tissues were thicker than those of healthy controls, mainly in epidermal cells. Pectinesterase has been reported to play a role in the plant defence response (Markovič and Jörnvall, 1986; Rexová‐Benková and Markovič, 1976; Rhee et al., 2000). A cell wall‐associated pectinesterase of Nicotiana tabacum has been shown to be involved in the host cell receptor recognition of the movement protein of Tobacco mosaic virus (TMV) and in mediating the cell‐to‐cell spread of TMV through plasmodesmata (Rhee et al., 2000). The putative cellular factors which facilitate viroid trafficking and their similarity to virus movement proteins remain to be established (Ding, 2009). Some authors (Gomez and Pallas, 2001; Owens et al., 2001) have shown that PP2 (a phloem lectin protein) interacts with a variety of viroid RNAs, and have suggested its involvement in their long‐distance movement. An increase in the expression level of extensins, a class of cell wall proteins, has been revealed in CDVd‐infected citron leaves (Tessitori et al., 2007). However, at present, the possibility that viroids use mechanisms similar to those of viruses to move through the plasmodesmata into neighbouring cells is uncertain, and therefore whether pectinesterase is involved in viroid spread or simply affects the mechanical properties of the cell wall has yet to be elucidated.
The changes in cell wall structure found here are in agreement with the results of early studies reporting that alterations in the cell wall composition of CEVd‐infected cell cultures resulted in reduced cell expansibility observed in cross‐sections of leaf tissues (Wang et al., 1986), as well as in the limited release of protoplasts after digestion with cell wall‐degrading enzymes (Marton et al., 1982). Such observations support the phenotypic characteristics of the exocortis syndrome (stunted plants with small rugose leaves) as a probable consequence of the limited cell expansion.
Our results also indicate an increase in peroxidase activity at the early (pre‐symptomatic) stage, whereas the activity decreases at the post‐symptomatic stage. Peroxidases play a key role in several metabolic responses involved in auxin metabolism, lignin and suberin formation, cross‐linking of cell wall components, phytoalexin synthesis and the metabolism of reactive oxygen species (ROS) and reactive nitrogen species (RNS) (Almagro et al., 2009). These proteins belong to the structurally diverse group of pathogenesis‐related (PR) proteins (Van Loon et al., 2006) and are induced in host plant tissues by a wide range of plant pathogens: fungi (Sasaki et al., 2004), bacteria (Lavania et al., 2006; Young et al., 1995), viruses (Díaz‐Vivancos et al., 2006; Hiraga et al., 2000; Lagrimini and Rothstein, 1987) and viroids (Vera et al., 1993). They limit the cellular spread of the pathogen through the establishment of structural barriers or the generation of highly toxic environments by the mass production of ROS and RNS (Passardi et al., 2005). An increase in the expression level of peroxidase was also observed in symptomatic citron leaves and in the bark of Troyer citrange and sour orange infected with CDVd, whereas alemow (Citrus macrophylla) showed a significant reduction (Rizza et al., 2010; Tessitori et al., 2007).
Although CEVd and CDVd induce quite different phenotypic reactions in Etrog citron, the results of these studies reveal certain potential similarities in the pathogenic effect, such as auxin metabolism, lignifications, suberization and amino acid transport, which are probably responsible for chlorophyll changes.
In summary, the results shown here indicate that, when a citron plant is infected with CEVd, chloroplast, chlorophyll, auxin transport, callose and pectin deposits, peroxidase activity and other defence genes are altered. These changes might allow the plants to survive the infection and delay its disease‐associated decline.
EXPERIMENTAL PROCEDURES
Plant material
In this study, the well‐characterized severe CEVd isolate (CEVd‐117) (Gandía et al., 2005) from the viroid collection kept at the Instituto Valenciano de Investigaciones Agrarias (Moncada, Valencia, Spain) was used. Eight plants of the sensitive selection 861‐S1 of Etrog citron (C. medica L.) grafted on Rough lemon (C. jambhiri Lush.) rootstock were graft inoculated on the rootstock, each with two bark pieces from a CEVd‐infected Etrog citron plant, and eight additional plants were left as noninoculated controls. Plants were maintained in a temperature‐controlled glasshouse (28/32 °C, night/day) and symptom expression was recorded at weekly intervals.
Viroid infection was assessed by Northern hybridization analysis (Murcia et al., 2009). Briefly, leaf samples (5 g) were powdered in liquid nitrogen and homogenized in 5 mL of extraction medium [0.4 m Tris‐HCl, pH 8.9; 1% (w/v) sodium dodecylsulphate (SDS); 5 mm ethylenediaminetetraacetic acid (EDTA), pH 7.0; 4% (v/v) β‐mercaptoethanol] and 15 mL of water‐saturated phenol, and partitioned in 2 m LiCl (Semancik et al., 1975). Aliquots of these preparations were subjected to 5% nondenaturing polyacrylamide gel electrophoresis (PAGE), electroblotted to positively charged nylon membranes (Roche Applied Science, Mannheim, Germany) using TBE buffer (90 mm Tris, 90 mm boric acid and 2 mm EDTA), immobilized by UV cross‐linking and hybridized with viroid‐specific digoxigenin‐labelled probes (Palacio‐Bielsa et al., 2000).
RNA extraction and microarray hybridization
In all instances, leaf samples (4–5 g) were harvested as follows: (i) before inoculation (time point 0); (ii) infected, but still symptomless (30 dpi) (time point 1); and (iii) infected, but symptomatic (90 dpi) (time point 2). Common reference consisted of a pool of all the samples included in the experiments. Four biological replicates for each time point were analysed.
Total RNA was extracted according to the protocol described by Ancillo et al. (2007). RNA was labelled following an indirect method (Randolph and Waggoner, 1997). Reverse transcription, cDNA purification, dye coupling and fluorescent cDNA purification were accomplished as described by Forment et al. (2005), except that total RNA (40 µg) was used instead of poly(A)+ RNA. RNA from the common reference (consisting of a pool of equal amounts of RNA of all the samples included in the analysis) was labelled with cyanine 3 (Cy3), and RNA from control and inoculated plants was labelled with Cy5.
A genome‐wide 20‐K cDNA microarray, developed under the CFGP (http://bioinfo.ibmcp.upv.es/genomics/cfgpDB/), which includes 21 081 putative unigenes of citrus (Martinez‐Godoy et al., 2008), was used. Microarray hybridization and washing were performed as described by Martinez‐Godoy et al. (2008). Subsequently, slides were scanned at 532 nm for Cy3 and 635 nm for Cy5 with a GenePix 4000B scanner (Axon Molecular Devices), Union City, CA, USA at a laser power of 100% and a resolution of 10 nm. Before quantifying the spot intensities using GenePix Pro 6.0 (Axon Molecular Devices), photomultiplier tube voltages were adjusted to equalize the overall signal intensity for each channel, in order to reduce the number of spots with saturated pixels and to increase the signal‐to‐noise ratio.
Microarray data analysis
Median global intensity and LOWESS correction were applied to normalize microarray data analysis (Yang et al., 2002) using Acuity 4.0 software (Axon Molecular Devices).
Genes were grouped into clusters using SOTA, a hierarchical unsupervised growing neural network, which adopts the topology of a binary tree and offers a statistical criterion for cluster division (Herrero et al., 2001). SOTA is included in the GEPAS suite (Vaquerizas et al., 2005).
Significant differential expression changes over time were assessed using the maSigPro package, a model‐based univariate method in which temporal series are modelled by binary variables. The method identifies significant differences in gene expression profiles in a time series through the significance of the estimated model parameters (Conesa et al., 2006). Significant genes were clustered using the UPGMA method implemented in the maSigPro package.
To identify biological functions associated with temporal gene expression changes, a modification of the approach proposed by Nueda et al. (2009) was used. Briefly, the mean gene profile of each cluster obtained by maSigPro analysis was calculated and the Pearson correlation of each gene in the array to each mean profile was computed. For every cluster, genes were ordered according to these correlation values to obtain lists of genes ranked by their similarity to the cluster distinctive mean profiles. These lists were subjected to gene set enrichment analysis using the FatiScan tool (2005, 2006, 2007) included in the Babelomics platform (http://babelomics.bioinfo.cipf.es/cgi‐bin/tools.cgi). FatiScan finds blocks of functionally related genes that show a significant asymmetric distribution towards the extremes of genome‐wide lists of genes measured in a microchip and ordered according to an experimental condition, in this case, the time‐dependent expression profiles detected by maSigPro.
Quantitative real‐time RT‐PCR
The genes selected for validation were tested by quantitative real‐time RT‐PCR using the SYBR Green assay and the Light‐Cycler System (Roche Applied Science). Primer pairs for each gene were designed based on the sequences available in the database of the CFGP (http://bioinfo.ibmcp.upv.es/genomics/cfgpDB), which are shown in Table 2. Total RNA preparations were cleaned up with the RNeasy Plant Mini Kit (Qiagen, Hilden, Germany), treated with DNase I (RNase‐free DNase Set, Qiagen) and adjusted to 20 ng RNA per microlitre using the Quant‐iT RiboGreen RNA assay kit (Invitrogen), according to the manufacturer's instructions. cDNA was synthesized in a reaction volume of 10 µL containing 20 ng of DNase‐treated RNA, 2.5 pmol each of forward and reverse primers, 1 U of RNase inhibitor (Applied Biosystems), 2 µL of LC FastStart DNA MasterPLUS SYBR Green I (Roche Applied Science) and 2.5 U of MuLV reverse transcriptase (Applied Biosystems, Foster City, CA, USA). The PCR thermal profile consisted of 48 °C for 30 min and 95 °C for 10 min, 45 cycles of 95 °C for 2 s, 60 °C for 10 s and 72 °C for 15 s, followed by a step of 60 °C for 60 s. To transform fluorescence intensity measurements into relative mRNA levels, a 10‐fold dilution series of an RNA sample was used as the standard curve. All the experiments were performed in triplicate and the means were calculated.
Chlorophyll analysis
The concentration of chlorophyll per area in attached mature leaves with a homogeneous green colour was estimated using a SPAD portable apparatus (Minolta Co., Osaka, Japan). The data obtained correspond to the mean of six leaves from four healthy and infected independent plants. Means were statistically compared using Student's t‐test.
Microscopy and cell wall staining
CLSM was performed using a Leica DM IRE2 microscope with an excitation wavelength of 488 nm. For staining, leaf pieces were placed in a solution of 0.01% (w/v) ruthenium red and shaken for 10 min (Hanke and Northcote, 1975). Samples were also examined using a Nikon Eclipse E800 epifluorescence microscope (Nikon, Tokyo, Japan) with a mounted Nikon FDX‐35 camera. For aniline blue staining, leaf pieces were treated in 96% ethanol and stained with 0.05% aniline blue in 0.1 m phosphate buffer (pH 8.5) for 15 min. Samples were observed in the same microscope, employing UV light excitation and a 420‐nm filter. In all cases, for each time point, two leaves of three different plants were examined.
Supporting information
Table S1 List of significant genes statistically significant at the nominal P value. Mean Mvalues, R‐squared, nominal and adjusted P values and cluster that correlate with, are indicated in the columns.
Table S2 Correlation values of each gene in the array to the mean profile represented in each of the five clusters revealed by maSigPro analysis.
Supporting info item
ACKNOWLEDGEMENTS
This work was supported by grants AGL2008‐01491 and Prometeo 2008/12 from the Ministerio de Ciencia e Innovación (Spain). GA is a recipient of a contract from Conselleria de Agricultura, Pesca y Alimentación (Generalitat Valenciana, Spain) under Proy_IVIA09/03 and SR of a fellowship from the University of Catania (Italy). The authors would like to thank S. M. Bani Hashemian for preparing the viroid‐inoculated plants.
REFERENCES
- Aidemark, M. , Andersson, C.J. , Rasmusson, A.G. and Widell, S. (2009) Regulation of callose synthase activity in situ in alamethicin‐permeabilized Arabidopsis and tobacco suspension cells. BMC Plant Biol. 9, 27–39. [DOI] [PMC free article] [PubMed] [Google Scholar]
- Allen, T.D. and Nuss, D.L. (2004) Specific and common alterations in host gene transcript accumulation following infection of the chestnut blight fungus by mild and severe hypoviruses. J. Virol. 78, 4145–4155. [DOI] [PMC free article] [PubMed] [Google Scholar]
- Almagro, L. , Gómez Ros, L.V. , Belchi‐Navarro, S. , Bru, R. , Ros Barceló, A. and Pedreño, M.A. (2009) Class III peroxidases in plant defence reactions. J. Exp. Bot. 60, 377–390. [DOI] [PubMed] [Google Scholar]
- Al‐Shahrour, F. , Diaz‐Uriarte, R. and Dopazo, J. (2005) Discovering molecular functions significantly related to phenotypes by combining gene expression data and biological information. Bioinformatics, 21, 2988–2993. [DOI] [PubMed] [Google Scholar]
- Al‐Shahrour, F. , Minguez, P. , Tarraga, J. , Montaner, D. , Alloza, E. , Vaquerizas, J.M. , Conde, L. , Blaschke, C. , Vera, J. and Dopazo, J. (2006) BABELOMICS: a systems biology perspective in the functional annotation of genome‐scale experiments. Nucleic Acids Res. 34, W472–W476. [DOI] [PMC free article] [PubMed] [Google Scholar]
- Al‐Shahrour, F. , Arbiza, L. , Dopazo, H. , Huerta‐Cepas, J. , Minguez, P. , Montaner, D. and Dopazo, J. (2007) From genes to functional classes in the study of biological systems. BMC Bioinformatics, 8, 114. [DOI] [PMC free article] [PubMed] [Google Scholar]
- Ancillo, G. , Gadea, J. , Forment, J. , Guerri, J. and Navarro, L. (2007) Class prediction of closely related plant varieties using gene expression profiling. J. Exp. Bot. 58, 1927–1933. [DOI] [PubMed] [Google Scholar]
- Arnold, T.M. and Schultz, J.C. (2002) Induced sink strength as a prerequisite for tannin biosynthesis in Populus . Oecologia, 130, 585–593. [DOI] [PubMed] [Google Scholar]
- Arnold, T.M. , Appel, H. , Patel, V. , Stocum, E. , Kavalier, A. and Schultz, J.C. (2004) Carbohydrate translocation determines the phenolic content of Populus foliage: a test of the sink–source model of plant defense. New Phytol. 164, 157–164. [DOI] [PubMed] [Google Scholar]
- Bani Hashemian, S.M. , Serra, P. , Barbosa, C.J. , Juárez, J. , Aleza, P. , Corvera, J.M. , Lluch, A. , Pina, J.A. and Duran‐Vila, N. (2009) The effect of a field‐source mixture of citrus viroids on the performance of ‘Nules’ clementine and ‘Navelina’ sweet orange trees grafted on Carrizo citrange. Plant Dis. 93, 699–707. [DOI] [PubMed] [Google Scholar]
- Berger, S. , Benediktyová, Z. , Matouš, K. , Bonfig, K. , Mueller, M.J. , Nedbal, L. and Roitsch, T. (2007) Visualization of dynamics of plant–pathogen interaction by novel combination of chlorophyll fluorescence imaging and statistical analysis: differential effects of virulent and avirulent strains of P. syringae and of oxylipins on A. thaliana . J. Exp. Bot. 58, 797–806. [DOI] [PubMed] [Google Scholar]
- Biemelt, S. and Sonnewald, U. (2006) Plant–microbe interactions to probe regulation of plant carbon metabolism. J. Plant Physiol. 163, 307–318. [DOI] [PubMed] [Google Scholar]
- Bonfig, K. , Schreiber, U. , Gabler, A. , Roitsch, T. and Berger, S. (2006) Infection with virulent and avirulent P. syringae strains differentially affects photosynthesis and sink metabolism in Arabidopsis leaves. Planta, 225, 1–12. [DOI] [PubMed] [Google Scholar]
- Chaffai, M. , Serra, P. , Gandía, M. , Hernández, C. and Duran‐Vila, N. (2007) Molecular characterization of CEVd strains that induce different phenotypes in Gynura aurantiaca: structure–pathogenicity relationships. Arch. Virol. 152, 1283–1294. [DOI] [PubMed] [Google Scholar]
- Conesa, A. , Nueda, M.J. , Ferrer, A. and Talón, M. (2006) MaSigPro: a method to identify significantly differential expression profiles in time‐course microarray experiments. Bioinformatics, 22, 1096–1102. [DOI] [PubMed] [Google Scholar]
- Da Graça, J.V. and Martin, M.M. (1981) Ultrastructural changes in avocado leaf tissue infected with avocado sunblotch. J. Phytopathol. 102, 185–194. [Google Scholar]
- De la Peña, M. , Gago, S. and Flores, R. (1999) Mapping the molecular determinant of pathogenicity in a hammerhead viroid: a tetraloop within the in vitro branched RNA conformation. Proc. Natl. Acad. Sci. USA, 96, 9960–9965. [DOI] [PMC free article] [PubMed] [Google Scholar]
- Díaz‐Vivancos, P. , Rubio, M. , Mesonero, V. , Periago, P.M. , Ros Barceló, A. , Martínez‐Gómez, P. and Hernández, J.A. (2006) The apoplastic antioxidant system in Prunus: response to long‐term plum pox virus infection. J. Exp. Bot. 57, 3813–3824. [DOI] [PubMed] [Google Scholar]
- Diener, T.O. (1989) Circular RNAs: relics of precellular evolution? Proc. Natl. Acad. Sci. USA, 86, 9370–9374. [DOI] [PMC free article] [PubMed] [Google Scholar]
- Ding, B. (2009) The biology of viroid–host interactions. Annu. Rev. Phytopathol. 47, 105–131. [DOI] [PubMed] [Google Scholar]
- Duran‐Vila, N. and Semancik, J.S. (1981) Effects of exogenous auxins on tomato tissue infected with the Citrus exocortis viroid . Phytopathology, 72, 777–781. [Google Scholar]
- Duran‐Vila, N. and Semancik, J.S. (2003) Citrus viroids In: Viroids (Hadidi A., Flores R., Randles J.W. and Semancik J.S., eds), pp. 178–194. Dickson: CSIRO Publishing. [Google Scholar]
- Ehness, R. , Ecker, M. , Godt, D.E. and Roitsch, T. (1997) Glucose and stress independently regulate source and sink metabolism and defense mechanisms via signal transduction pathways involving protein phosphorylation. Plant Cell, 9, 1825–1841. [DOI] [PMC free article] [PubMed] [Google Scholar]
- Fawcett, H.S. and Klotz, L.J. (1948) Exocortis on trifoliate orange. Citrus Leaves, 28, 8. [Google Scholar]
- Flores, R. , Hernández, C. , Martinez de Alba, A.E. , Daròs, J.A. and Di Serio, F. (2005) Viroids and viroid host interactions. Annu. Rev. Phytopathol. 43, 4.1–4.23. [DOI] [PubMed] [Google Scholar]
- Forment, J. , Gadea, J. , Huerta, L. , Abizanda, L. , Agusti, J. , Alamar, S. , Alos, E. , Andres, F. , Arribas, R. , Beltran, J.P. , Berbel, A , Blazquez, M.A. , Brumos, J. , Canas, L.A. , Cercos M., Colmenero‐Flores, J.M. , Conesa, A. , Estables, B. , Gandia M., Garcia‐Martinez J.L., Gimeno J., Gisbert, A. , Gomez G., Gonzalez‐Candelas, L. , Granell A., Guerri, J. , Lafuente M.T., Madueno, F. , Marcos, J.F. , Marques, M.C. , Martinez, F. , Martinez‐Godoy, M.A. , Miralles, S. , Moreno, P. , Navarro, L. , Pallas, V. , Perez‐Amador, M.A. , Perez‐Valle J, Pons C , Rodrigo, I. , Rodriguez, P.L. , Royo, C. , Serrano, R. , Soler, G. , Tadeo, F. , Talon, M. , Terol, J. , Trenor, M. , Vaello, L. , Vicente, O. , Vidal, Ch. , Zacarias, L. and Conejero, V. (2005) Development of a citrus genome‐wide EST collection and cDNA microarray as resources for genomic studies. Plant Mol. Biol. 57, 75–91. [DOI] [PubMed] [Google Scholar]
- Gandía, M. , Rubio, L. , Palacio, A. and Duran‐Vila, N. (2005) Genetic variation and population structure of a Citrus exocortis viroid (CEVd) isolate and the progenies of infectious haplotypes. Arch. Virol. 150, 1945–1957. [DOI] [PubMed] [Google Scholar]
- Gomez, G. and Pallas, V. (2001) Identification of an in vitro ribonucleoprotein complex between a viroid RNA and a phloem protein from cucumber plants. Mol. Plant–Microbe Interact. 14, 910–913. [DOI] [PubMed] [Google Scholar]
- Góra, A. , Candresse, T. and Zagórski, W. (1996) Use of intramolecular chimeras to map molecular determinants of symptom severity of potato spindle tuber viroid (PSTVd). Arch. Virol. 141, 2045–2055. [DOI] [PubMed] [Google Scholar]
- Hanke, D.E. and Northcote, D.H. (1975) Molecular visualization of pectin and DNA by ruthenium red. Biopolymers, 14, 1–17. [DOI] [PubMed] [Google Scholar]
- Hari, V. (1980) Ultrastructure of potato spindle viroid‐infected tomato leaf tissue. Phytopathology, 70, 385–387. [Google Scholar]
- Herbers, K. , Meuwly, P. , Frommer, W.B. , Metraux, J.P. and Sonnewald, U. (1996) Systemic acquired resistance mediated by the ectopic expression of invertase: possible hexose sensing in the secretory pathway. Plant Cell, 8, 793–803. [DOI] [PMC free article] [PubMed] [Google Scholar]
- Herrero, J. , Valencia, A. and Dopazo, J. (2001) A hierarchical unsupervised growing neural network for clustering gene expression patterns. Bioinformatics, 17, 126–136. [DOI] [PubMed] [Google Scholar]
- Hiraga, S. , Ito, H. , Yamakawa, H. , Ohtsubo, N. , Seo, S. , Mitsuhara, I. , Matsui, H. , Honma, M. and Ohashi, Y. (2000) An HR‐induced tobacco peroxidase gene is responsive to spermine, but not to salicylate, methyl jasmonate, and ethephon. Mol. Plant–Microbe Interact. 13, 210–216. [DOI] [PubMed] [Google Scholar]
- Hirai, N. , Sonobe, S. and Hayashi, T. (1998) In situ synthesis of β‐glucan microfibrils on tobacco plasma membrane sheets. Proc. Natl. Acad. Sci. USA, 95, 15 102–15 106. [DOI] [PMC free article] [PubMed] [Google Scholar]
- Iglesias, V.A. and Meins, F. (2000) Movement of plant viruses is delayed in a beta‐1,3,‐glucanase‐deficient mutant showing a reduced plasmodesmatal size exclusion limit and enhanced callose deposition. Plant J. 21, 157–166. [DOI] [PubMed] [Google Scholar]
- Itaya, A. , Matsuda, Y. , Gonzales, R.A. , Nelson, R.S. and Ding, B. (2002) Potato spindle tuber viroid strains of different pathogenicity induce and suppress expression of common and unique genes in infected tomato. Mol. Plant–Microbe Interact. 15, 990–999. [DOI] [PubMed] [Google Scholar]
- Kauss, H. (1996) Callose synthesis In: Membranes: Specialized Functions in Plants (Smallwood M., Knox J.P. and Bowles D.J., eds), pp. 77–92. Oxford: Bios. Scientific Publishers. [Google Scholar]
- Lagrimini, L.M. and Rothstein, S. (1987) Tissue specificity of tobacco peroxidase isozymes and their induction by wounding and tobacco mosaic virus infection. Plant Physiol. 84, 438–442. [DOI] [PMC free article] [PubMed] [Google Scholar]
- Lavania, M. , Chauhan, P.S. , Chauhan, S.V.S. , Singh, H.B. and Nautiyal, C.S. (2006) Induction of plant defence enzymes and phenolics by treatment with plant growth‐promoting rhizobacteria Serratia marcescens NBRI1213. Curr. Microbiol. 52, 363–368. [DOI] [PubMed] [Google Scholar]
- López, C. , Soto, M. , Restrepo, S. , Piégu, B. , Cooke, R. , Delseny, M. , Tohme, J. and Verdier, V. (2005) Gene expression profile in response to Xanthomonas axonopodis pv. manihotis infection in cassava using a cDNA microarray. Plant Mol. Biol. 57, 393–410. [DOI] [PubMed] [Google Scholar]
- Malfitano, M. , Di Serio, F. , Covelli, L. , Ragozzino, A. , Hernáncdez, C. and Flores, R. (2003) Peach latent mosaic viroid variants inducing peach calico (extreme chlorosis) contain a characteristic insertion that is responsible for this symptomatology. Virology, 313, 492–501. [DOI] [PubMed] [Google Scholar]
- Markovič, O. and Jörnvall, H. (1986) Pectinesterase. The primary structure of the tomato enzyme. Eur. J. Biochem. 158, 455–462. [DOI] [PubMed] [Google Scholar]
- Martinez‐Godoy, M.A. , Mauri, N. , Juarez, J. , Marques, M.C. , Santiago, J. , Forment, J. and Gadea, J. (2008) A genome‐wide 20 K citrus microarray for gene expression analysis. BMC Genomics, 9, 318. [DOI] [PMC free article] [PubMed] [Google Scholar]
- Marton, L. , Duran‐Vila, N. , Lin, J.J. and Semancik, J.S. (1982) Properties of cell cultures containing the citrus exocortis viroid. Virology, 122, 229–238. [DOI] [PubMed] [Google Scholar]
- Mathesius, U. (2010) The role of auxin in root–symbiont and root–pathogen interactions—from development to defence In: Progress in Botany 71 (Luttge U.E., Beyschlag W., Budel B. and Francis D., eds), pp. 185–210. Heidelberg, Berlin: Springer Verlag. [Google Scholar]
- Momma, T. and Takahashi, T. (1982) Ultrastructure of hop stunt viroid‐infected leaf tissue. J. Phytopathol. 104, 211–221. [Google Scholar]
- Murcia, N. , Serra, P. , Olmos, A. and Duran‐Vila, N. (2009) A novel hybridization approach for detection of citrus viroids. Mol. Cell. Probes, 23, 95–102. [DOI] [PubMed] [Google Scholar]
- Murcia, N. , Bernad, L. , Duran‐Vila, N. and Serra, P. (2011) Two nucleotide positions in the Citrus exocortis viroid RNA associated with symptom expression in Etrog citron but not in experimental herbaceous hosts. Mol. Plant Pathol. 12, 203–208. [DOI] [PMC free article] [PubMed] [Google Scholar]
- Narin, C.J. , Lewandowski, D.J. and Burns, J.K. (1998) Genetics and expression of two pectinesterase genes in Valencia orange. Physiol. Plant. 102, 226–235. [Google Scholar]
- Nueda, M.J. , Sebastian, P. , Tarazona, S. , Garcia‐Garcia, F. , Dopazo, J. , Ferrer, A. and Conesa, A. (2009) Functional assessment of time course microarray data. BMC Bioinformatics, 10, S9. [DOI] [PMC free article] [PubMed] [Google Scholar]
- Owens, R.A. and Hammond, R.W. (2009) Viroid pathogenicity: one process, many faces. Viruses, 1, 298–316. [DOI] [PMC free article] [PubMed] [Google Scholar]
- Owens, R.A. , Blackburn, M. and Ding, B. (2001) Possible involvement of the phloem lectin in long‐distance viroid movement. Mol. Plant–Microbe Interact. 14, 905–909. [DOI] [PubMed] [Google Scholar]
- Palacio‐Bielsa, A. , Foissac, X. and Duran‐Vila, N. (2000) Indexing of citrus viroids by imprint hybridization. Eur. J. Plant Pathol. 105, 897–903. [Google Scholar]
- Paliwal, Y.C. and Singh, R.P. (1981) Cytopathological changes induced by potato spindle tuber viroid in Scopolia sinensis . Can. J. Bot. 59, 677–682. [Google Scholar]
- Passardi, F. , Cosio, C. , Penel, C. and Dunand, C. (2005) Peroxidases have more functions than a Swiss army knife. Plant Cell Rep. 24, 255–265. [DOI] [PubMed] [Google Scholar]
- Prado‐Lopez, S. , Conesa, A. , Armiñán, A. , Martínez‐Losa, M. , Escobedo‐Lucea, C. , Gandia, C. , Tarazona, S. , Melguizo, D. , Blesa, D. , Montaner, D. et al (2010) Hypoxia promotes efficient differentiation of human embryonic stem cells to functional endothelium. Stem Cells, 28, 407–418. [DOI] [PubMed] [Google Scholar]
- Randolph, J.B. and Waggoner, A.S. (1997) Stability, specificity and fluorescence brightness of multiply‐labelled fluorescence DNA probes. Nucleic Acid Res. 25, 2923–2929. [DOI] [PMC free article] [PubMed] [Google Scholar]
- Reanwarakorn, K. and Semancik, J.S. (1998) Regulation of pathogenicity in hop stunt viroid‐related group II citrus viroids. J. Gen. Virol. 79, 3581–3584. [DOI] [PubMed] [Google Scholar]
- Rexová‐Benková, L. and Markovič, O. (1976) Pectic enzymes. Adv. Carbohydr. Chem. Biochem. 33, 323–385. [DOI] [PubMed] [Google Scholar]
- Rhee, Y. , Tzfira, T. , Chen, M.H. , Waigmann, E. and Citovsky, V. (2000) Cell‐to‐cell movement of tobacco mosaic virus: enigmas and explanations. Mol. Plant Pathol. 1, 33–39. [DOI] [PubMed] [Google Scholar]
- Rico, A. , Jones, R. and Preston, G.M. (2008) Adaptation to the plant apoplast by plant pathogenic bacteria In: Plant Pathogenic Bacteria: Genomics and Molecular Biology (Jackson R.W., ed.), pp. 63–89. Norwich, Norfolk: Horizon Scientific Press. [Google Scholar]
- Rizza, S. , Capasso, C. , Catara, G. , Capasso, A. , Conte, E. and Catara, A. (2010) Transcriptional response of Troyer citrange, sour orange and alemow rootstocks to Citrus viroid IIIb (CVd‐IIIb) infection. In:Proceedings of the 17th Conference of the International Organization of Citrus Virologists‐IOCV, pp. 142–149. XVII Conference of the International Organization of Citrus Virologists, Adana, Turkey. Available at http://www.ivia.es/iocv/.
- Roitsch, T. and Gonzalez, M.C. (2004) Function and regulation of plant invertases: sweet sensations. Trends Plant Sci. 9, 606–613. [DOI] [PubMed] [Google Scholar]
- Roitsch, T. , Balibrea, M.E. , Hofmann, M. , Proels, R. and Sinha, A.K. (2003) Extracellular invertase: key metabolic enzyme and PR protein. J. Exp. Bot. 54, 513–524. [DOI] [PubMed] [Google Scholar]
- Sasaki, K. , Iwai, T. , Hiraga, S. , Kuroda, K. , Seo, S. , Mitsuhara, I. , Miyasaka, A. , Iwano, M. , Ito, H. , Matsui, H. and Ohashi, Y. (2004) Ten rice peroxidases redundantly respond to multiple stresses including infection with rice blast fungus. Plant Cell Physiol. 45, 1442–1452. [DOI] [PubMed] [Google Scholar]
- Scharte, J. , Schon, H. and Weis, E. (2005) Photosynthesis and carbohydrate metabolism in tobacco leaves during an incompatible interaction with Phytophthora nicotianae . Plant Cell Environ. 28, 1421–1435. [Google Scholar]
- Semancik, J.S. and Conejero‐Tomas, V. (1987) Viroid pathogenesis and expression of biological activity In: Viroids and Viroid like Pathogens (Semancik J.S., ed.), pp. 71–126. Boca Raton, FL: CRC Press. [Google Scholar]
- Semancik, J.S. and Wanderwoude, W.J. (1976) Exocortis viroid: cytopathic effects at the plasma membrane in association with pathogenic RNA. Virology, 69, 719–726. [DOI] [PubMed] [Google Scholar]
- Semancik, J.S. , Morris, T.J. , Weathers, L.G. , Rordorf, G.F. and Kearns, D.R. (1975) Physical properties of a minimal infectious RNA (viroid) associated with the exocortis disease. Virology, 63, 160–167. [DOI] [PubMed] [Google Scholar]
- Serra, P. , Gagao, S. and Duran‐Vila, N. (2008) A single nucleotide change in hop stunt viroid modulates citrus cachexia symptoms. Virus Res. 138, 130–134. [DOI] [PubMed] [Google Scholar]
- Sinha, A.K. and Roitsch, T. (2001) Effect of different sugars on photosynthesis and chlorophyll fluorescence in photoautotrophic tomato suspension cell cultures. Photosynthetica, 39, 611–614. [Google Scholar]
- Spoel, S.H. and Dong, X. (2008) Making sense of hormone crosstalk during plant immune responses. Cell Host Microbe, 3, 348–351. [DOI] [PubMed] [Google Scholar]
- Stone, B.A. and Clarke, A.E. (1992) Chemistry and Biology of 1,3‐[B]‐Glucans. Melbourne, Vic.: La Trobe University Press. [Google Scholar]
- Tessitori, M. , Maria, G. , Capasso, C. , Catara, G. , Rizza, S. , De Luca, V. , Catara, A. , Capasso, A. and Carginale, V. (2007) Differential display analysis of gene expression in Ertog citron leaves infected by Citrus Viroid III. Biochim. Biophys. Acta, 1769, 228–235. [DOI] [PubMed] [Google Scholar]
- Trillas, M.I. , Cotxarrera, L. , Casanova, E. and Cortadellas, N. (2000) Ultrastructural changes and localization of chitin and callose in compatible and incompatible interactions between carnation callus and Fusarium oxysporum . Physiol. Mol. Plant Pathol. 56, 107–116. [Google Scholar]
- Tsagris, E.M. , Martinez de Alba, A.E. , Gozmanova, M. and Kalantidis, K. (2008) Viroids. Cell. Microbiol. 10, 2168–2179. [DOI] [PubMed] [Google Scholar]
- Van Loon, L.C. , Rep, M. and Pieterse, C.M.J. (2006) Significance of inducible defence‐related proteins in infected plants. Annu. Rev. Phytopathol. 44, 135–162. [DOI] [PubMed] [Google Scholar]
- Vaquerizas, J.M. , Conde, L. , Yankilevich, P. , Cabezón, A. , Mínguez, P. , Díaz‐Uriarte, R. , Al‐Shahrour, F. , Herrero, J. and Dopazo, J. (2005) GEPAS, an experiment‐oriented pipeline for the analysis of microarray gene expression data. Nucleic Acids Res. 33, W616–W620. [DOI] [PMC free article] [PubMed] [Google Scholar]
- Vera, P. , Tornero, P. and Conejero, V. (1993) Cloning and expression analysis of a viroid‐induced peroxidase from tomato plants. Mol. Plant–Microbe Interact. 6, 790–794. [PubMed] [Google Scholar]
- Visvader, J. and Symons, H. (1986) Replication of in vitro constructed viroid mutants: location of the pathogenicity modulating domain of citrus exocortis viroid. EMBO J. 5, 2051–2055. [DOI] [PMC free article] [PubMed] [Google Scholar]
- Wang, D. , Pajerowska‐Mukhtar, K. , Culler, A.H. and Dong, X. (2007) Salicylic acid inhibits pathogen growth in plants through repression of the auxin signaling pathway. Curr. Biol. 17, 1784–1790. [DOI] [PubMed] [Google Scholar]
- Wang, M.C. , Lin, J.J. , Duran‐Vila, N. and Semancik, J.S. (1986) Alteration in cell wall composition and structure in viroid infected cells. Physiol. Mol. Plant Pathol. 28, 107–124. [Google Scholar]
- Wang, Y. , Shibuya, M. , Taneda, A. , Kurauchi, T. , Senda, M. , Owens, R.A. and Sano, T. (2011) Accumulation of Potato spindle tuber viroid‐specific small RNAs is accompanied by specific changes in gene expression in two tomato cultivars. Virology, 13, 72–83. [DOI] [PubMed] [Google Scholar]
- Yang, Y.H. , Dudoit, S. , Luu, P. , Lin, D.M. , Peng, V. , Ngai, J. and Speed, T.P. (2002) Normalization for cDNA microarray data: a robust composite method addressing single and multiple slide systematic variation. Nucleic Acids Res. 30, e15. [DOI] [PMC free article] [PubMed] [Google Scholar]
- Yasuhara, H. (2005) Caffeine inhibits callose deposition in the cell plate and the depolymerization of microtubules in the central region of the phragmoplast. Plant Cell Physiol. 46, 1083–1092. [DOI] [PubMed] [Google Scholar]
- Young, S.A. , Guo, A. , Guikema, J.A. , White, F.F. and Leach, J.E. (1995) Rice cationic peroxidase accumulates in xylem vessels during incompatible interactions with Xanthomonas oryzae pv. oryzae . Plant Physiol. 107, 1333–1341. [DOI] [PMC free article] [PubMed] [Google Scholar]
Associated Data
This section collects any data citations, data availability statements, or supplementary materials included in this article.
Supplementary Materials
Table S1 List of significant genes statistically significant at the nominal P value. Mean Mvalues, R‐squared, nominal and adjusted P values and cluster that correlate with, are indicated in the columns.
Table S2 Correlation values of each gene in the array to the mean profile represented in each of the five clusters revealed by maSigPro analysis.
Supporting info item