

SUMMARY
Phoma exigua is considered to be an assemblage of at least nine varieties that are mainly distinguished on the basis of host specificity and pathogenicity. However, these varieties are also reported to be weak pathogens and secondary invaders on non‐host tissue. In practice, it is difficult to distinguish P. exigua from its close relatives and to correctly identify isolates up to the variety level, because of their low genetic variation and high morphological similarity. Because of quarantine issues and phytosanitary measures, a robust DNA‐based tool is required for accurate and rapid identification of the separate taxa in this species complex. The present study therefore aims to develop such a tool based on unique nucleotide sequence identifiers. More than 60 strains of P. exigua and related species were compared in terms of partial actin gene sequences, or analysed using DNA amplification fingerprinting (DAF) with short, arbitrary, mini‐hairpin primers. Fragments in the fingerprint unique to a single taxon were identified, purified and sequenced. Alignment of the sequence data and subsequent primer trials led to the identification of taxon‐specific sequence characterized amplified regions (SCARs), and to a set of specific oligonucleotide combinations that can be used to identify these organisms in plant quarantine inspections.
INTRODUCTION
The coelomycete fungus Phoma exigua Sacc. is an omnipresent soil inhabitant that occurs with regular incidence as an above‐ground plant pathogen on more than 200 plant genera. In many cases, the associated diseases are regarded as serious (e.g. Álvarez et al., 2005; Koike et al., 2006; Shamoun and Zhao, 2005); however, P. exigua has also been reported to colonize regularly weakened plant material as an opportunistic secondary invader (Boerema et al., 2004). Even animal or human tissue may be colonized (Balis et al., 2006). The complexity of the species has been known for quite some time; Boerema and Höweler (1967) were the first to recognize different varieties within P. exigua. Based on the assumptions of a relatively strict host specificity and appearance on agar medium, four infraspecific taxa were proposed, including the varieties foveata and sambuci‐nigrae. These species are currently recognized as separate species because of differences in colony characters (Boerema et al., 1987) or the absence of certain morphological and physiological characters in vitro (Monte et al., 1990, 1991). Later, Van der Aa et al. (2000) discussed the presence of 11 varieties within the P. exigua complex, nine of which were eventually recognized after amplified fragment length polymorphism (AFLP) analyses (Abeln et al., 2002). The infraspecific taxa currently accepted include the type P. exigua var. exigua and the varieties diversispora, forsythiae, heteromorpha, lilacis, linicola, noackiana, populi and viburni. Boerema et al. (2004) provided some cultural—but no microscopic—characters to distinguish these infraspecific taxa of P. exigua. However, the recognition of these varieties is still considered to be problematical as a result of the natural variation within the taxa and the fact that the expression of many cultural characters depends on small variations in the substrate and growing conditions (Rai, 1998). Therefore, the identification of these isolates is still mainly driven by host association. Closely related species, which are morphologically frequently confused with P. exigua, often play an important role as causal agents of plant diseases. For example, the quarantine organism P. foveata is known as the causal agent of potato gangrene, as is the ubiquitous P. exigua var. exigua (Boerema, 1967; Boyd, 1972). Phoma sambuci‐nigrae is known from elder (Sambucus nigra) (Boerema and Höweler, 1967), whereas P. lycopersici is a widely distributed pathogen of tomato (Lycopersicon esculentum) (Morgan‐Jones and Burch, 1988).
Organizations involved in the assessment of plant health are currently in need of a rapid, easy‐to‐handle protocol to detect and identify isolates of Phoma up to the species or variety level. A rapid and robust DNA‐based tool that could discriminate between the various taxa in this species complex would be the perfect choice. The DNA barcode initiative is, to date, the best approach for the identification of species‐specific nucleotide sequences (Hebert et al., 2002). The identification of such DNA barcodes in the genus Phoma can aid in the rapid detection of potentially serious plant pathogens. Although this initiative is generally focused on the identification of nucleotide sequences that are specific to a single species, we aimed to develop such molecular identifiers for taxa at the subspecies level. In recent years, various genes have been proposed as standard loci for use in DNA barcoding in fungi, such as the internal transcribed spacers (ITSs) of the rDNA operon ITS region (Druzhinina et al., 2005) and cytochrome c oxidase subunit 1 (cox1) (Seifert et al., 2007). However, various studies have reported the low discriminatory power of ITS sequences within the P. exigua complex (Abeln et al., 2002; Cullen et al., 2007). Furthermore, cox1 analysis applied to a subset of 36 P. exigua related strains, according to the methodology of Seifert et al. (2007), did not reveal conserved nucleotide differences between taxa (J. H. C. Woudenberg, unpublished data). In order to develop unique sequence identifiers in the P. exigua complex, other loci need to be screened and more suitable genes identified.
Genes that have often been used in multilocus sequence typing (MLST) are the so‐called housekeeping genes; these are genes that encode for proteins that are required for the basic functioning of every cell. One such gene is actin, the nucleotide sequence of which shows high discriminative powers at the species level (Voigt and Wöstemeyer, 2000). Further fingerprinting‐based methods may be applied: for example, Abeln et al. (2002) showed that AFLP could be of great value in discriminating between the different varieties and species in the Phoma complex. However, the development of taxon‐specific primers (sequence characterized amplified regions, SCARs) based on AFLP fingerprints is expensive and laborious, and therefore not preferred. Other fingerprinting tools can nevertheless be helpful in the design of species‐specific oligonucleotides, such as random amplification of polymorphic DNA (RAPD)‐derived polymerase chain reaction‐restriction fragment length polymorphism (PCR‐RFLP) or microsatellite analysis. The RAPD‐based RFLP method, however, results in a very small number of bands (Macdonald et al., 2000). Moreover, although microsatellite analysis is highly reproducible, the development of specific primers is quite laborious (Groenewald et al., 2007). Another method that could be of value to achieve the development of taxon‐specific primers is DNA amplification fingerprinting (DAF) using mini‐hairpin primers (Caetano‐Anollés and Gresshoff, 1994). Mini‐hairpin primers consist of a seven‐ or eight‐nucleotide‐long DNA loop, and an arbitrary core of three to five nucleotides in length. Such short, but very stable, oligonucleotide primers have proven to be helpful in the estimation of the genetic relationships between species in several agricultural crops and weeds (Caetano‐Anollés et al., 1995), and for the identification of markers linked to a specific mutated locus in pea (Men et al., 1999). In addition to its usefulness in assessing the genetic variation in various plant populations (Caetano‐Anollés, 1998; Caetano‐Anollés et al., 1999; Sen et al., 1997), this method has also been applied successfully in a study on the genetic diversity within the plant pathogenic fungi Fusarium oxysporum f. sp. cubense (Bentley and Bassam, 1996) and Discula destructiva (Caetano‐Anollés et al., 1996). In this study, our aims were as follows: (i) to apply the DAF technique to the P. exigua complex; (ii) to identify fingerprint bands specific to the varieties; and (iii) to convert the DAF profile to a specific SCAR marker. Furthermore, we determined whether sequence comparison of the partial actin gene could aid in the identification of the multiple infraspecific taxa in this complex.
RESULTS
Actin sequence analysis
PCR products of approximately 270 bp in length were obtained, and 59 informative sites were observed between all strains analysed (Table 1). Four uninformative single nucleotide polymorphisms (SNPs) were found in the alignment, which was limited to single strains, and one single nucleotide insertion was observed. Almost identical sequences were obtained for all samples, except for some SNPs and an intron region between positions 51 and 152 (P. exigua var. exigua, CBS 431.74, GenBank Accession Number EU880854), where multiple dissimilarities were found that were highly conserved over the individuals of a single taxon (Fig. 1). Phoma exigua var. diversispora, lilacis and linicola and the species P. lycopersici showed a series of deletions and point mutations between taxa that were suitable for primer development. The designed taxon‐specific primers are listed in Table 2. Phylogenetic results based on the actin sequence alignment (Fig. 2) show that the outgroup species P. herbarum and P. strasseri are basal to the species in the P. exigua complex. Furthermore, several of the species related to the P. exigua complex, P. foveata, P. lycopersici and P. sambuci‐nigrae, could be clearly distinguished, with bootstrap support values of 85%, 99% and 86%, respectively. Remarkably, P. telephii also clusters amidst the taxa in the P. exigua complex, with high bootstrap support for the strains of this species (98%). This may, however, be an artefact of the tree itself because of the high level of basal polytomy. Many of the P. exigua varieties appear to be monophyletic, although this monophyly is based on individual SNPs and a very short sequence length, which may explain the lack of high support values in the backbone structure of the tree. Two of the analysed strains, CBS 101156 and CBS 101207, identified as var. lilacis and exigua, respectively, fall outside the main clusters for these taxa. These morphologically atypical strains are marked with an asterisk.
Table 1.
List of Phoma strains studied. GenBank Accession Numbers refer to the actin sequences obtained in this study.
| Strain no. | Other collection no. | GenBank no. | Species | Variety | Host | Origin |
|---|---|---|---|---|---|---|
| CBS 101151 | PD 82/1022 | EU880846 | P. exigua | var. exigua | Dahlia sp. | Netherlands |
| CBS 101152 | PD 90/835‐3 | EU880847 | P. exigua | var. exigua | Digitalis sp. | Netherlands |
| CBS 101156 | PD 90/731 | EU880848 | P. exigua | var. exigua | Solanum tuberosum | Philippines |
| CBS 113.36 | EU880849 | P. exigua | var. exigua | Dahlia variabilis | Germany | |
| CBS 114.56 | EU880850 | P. exigua | var. exigua | Hydrangea macrophylla | Italy | |
| CBS 236.28 | P. exigua | var. exigua | Solanum tuberosum | Netherlands | ||
| CBS 342.67 | EU880851 | P. exigua | var. exigua | Solanum tuberosum | UK, Northern Ireland | |
| CBS 373.61 | EU880852 | P. exigua | var. exigua | Ulmus sp. | Netherlands | |
| CBS 391.84 | EU880853 | P. exigua | var. exigua | Foeniculum vulgare | Germany | |
| CBS 431.74* | PD 74/2447 | EU880854 | P. exigua | var. exigua | Solanum tuberosum | Netherlands |
| CBS 446.83 | EU880855 | P. exigua | var. exigua | Thymus sp. | Netherlands | |
| CBS 534.75 | EU880856 | P. exigua | var. exigua | Atropa belladonna | Belgium | |
| CBS 761.70 | EU880857 | P. exigua | var. exigua | Digitalis purpurea | Netherlands | |
| CBS 833.84 | EU880858 | P. exigua | var. exigua | Hordeum vulgare | Germany | |
| PD 87/720 | EU880859 | P. exigua | var. exigua | Helianthus annuus | Netherlands | |
| PD 94/1396 | EU880860 | P. exigua | var. exigua | Solanum tuberosum | Netherlands | |
| CBS 102.80* | PD 79/61 | EU880861 | P. exigua | var. diversispora | Phaseolus vulgaris | Kenya |
| CBS 101214 | PD 86/695, IMI 373349 | EU880862 | P. exigua | var. diversispora | Phaseolus lunatus | Zambia |
| CBS 531.86 | EU880863 | P. exigua | var. diversispora | Vigna sp. | Burundi | |
| CBS 101194 | PD 79/687, IPO 89‐19 | EU880864 | P. exigua | var. diversispora | Phaseolus vulgaris | Netherlands |
| PD 86/694 | BBA 3329 | EU880865 | P. exigua | var. diversispora | Vigna radiata | Germany |
| CBS 101197 | PD 95/721 | EU880866 | P. exigua | var. forsythiae | Forsythia sp. | Netherlands |
| CBS 101212 | PD 95/8846 | EU880867 | P. exigua | var. forsythiae | Forsythia sp. | Netherlands |
| CBS 101213* | PD 92/959 | EU880868 | P. exigua | var. forsythiae | Forsythia sp. | Netherlands |
| CBS 443.94* | EU880869 | P. exigua | var. heteromorpha | Nerium oleander | Italy | |
| CBS 101196 | PD 79/176 | EU880870 | P. exigua | var. heteromorpha | Nerium oleander | France |
| CBS 548.90 | EU880871 | P. exigua | var. heteromorpha | Nerium oleander | Italy | |
| PD 88/304 | EU880872 | P. exigua | var. heteromorpha | Nerium oleander | Netherlands | |
| CBS 101206 | PD 88/118 | EU880873 | P. exigua | var. lilacis | Syringa vulgaris | Netherlands |
| CBS 101207 | PD 94/614 | EU880874 | P. exigua | var. lilacis | Syringa vulgaris | Netherlands |
| CBS 569.79* | PD 72/741 | EU880875 | P. exigua | var. lilacis | Syringa vulgaris | Netherlands |
| CBS 489.94 | EU880876 | P. exigua | var. lilacis | Forsythia | Netherlands | |
| CBS 109.49 | EU880877 | P. exigua | var. linicola | Linum usitatissimum | Unknown | |
| CBS 112.28 | EU880878 | P. exigua | var. linicola | Linum usitatissimum | Former USSR | |
| CBS 114.28 | EU880879 | P. exigua | var. linicola | Linum usitatissimum | Netherlands | |
| CBS 116.76* | ATCC 32332, CECT 20022, CECT 20023, IMI 197074, IPO 5987 | EU880880 | P. exigua | var. linicola | Linum usitatissimum | Netherlands |
| CBS 100353* | PD 87/718 | EU880881 | P. exigua | var. noackiana | Phaseolus vulgaris | Guatemala |
| CBS 101203 | PD 79/1114, IPO 50987 | EU880882 | P. exigua | var. noackiana | Phaseolus vulgaris | Colombia |
| CBS 101215 | PD 87/717 | EU880883 | P. exigua | var. noackiana | Phaseolus vulgaris | Central America |
| CBS 101216 | PD 79/1113 | EU880884 | P. exigua | var. noackiana | Phaseolus vulgaris | Colombia |
| CBS 100167 | PD 93/217 | EU880885 | P. exigua | var. populi | Populus (x) euramericana | Netherlands |
| CBS 100168 | PD 94/138 | EU880886 | P. exigua | var. populi | Populus (x) euramericana | Netherlands |
| CBS 101198 | PD 97/12185 | EU880887 | P. exigua | var. populi | Populus sp. | Netherlands |
| CBS 101202 | PD 82/942 | EU880888 | P. exigua | var. populi | Salix sp. | Netherlands |
| CBS 100354* | PD 84/448 | EU880889 | P. exigua | var. viburni | Viburnum opulus | Netherlands |
| CBS 101209 | PD 70/717 | EU880890 | P. exigua | var. viburni | Viburnum sp. | Netherlands |
| CBS 101211 | PD 93/838 | EU880891 | P. exigua | var. viburni | Lonicera sp. | Netherlands |
| CBS 109176* | PD 94/1394, CECT 2828 | EU880892 | P. foveata | Solanum tuberosum | Bulgaria | |
| CBS 200.37† | EU880893 | P. foveata | Solanum tuberosum | UK, England | ||
| CBS 341.67* | CECT 20051, MUCL 9928 | EU880894 | P. foveata | Solanum tuberosum | UK, Northern Ireland | |
| CBS 502.91 | PD 86/276 | EU880895 | P. herbarum | Nerium sp. | Netherlands | |
| CBS 615.75* | PD 73/665, CECT 20014‐16, IHEM 3803, IMI 199779, LCP 90.2647, ATCC 2499 | EU880896 | P. herbarum | Rosa multiflora | Netherlands | |
| CBS 196.36 | ATCC 11847, MUCL 9560 | EU880897 | P. lycopersici | Lycopersicon esculentum | Germany | |
| CBS 378.67* | PD 67/276 | EU880898 | P. lycopersici | Lycopersicon esculentum | Netherlands | |
| CBS 735.74 | EU880899 | P. lycopersici | Lycopersicon esculentum | Netherlands | ||
| CBS 101199 | PD 79/392 | EU880900 | P. lycopersici | Lycopersicon esculentum | Netherlands | |
| CBS 101200 | PD 72/863 | EU880901 | P. lycopersici | Lycopersicon esculentum | Netherlands | |
| CBS 104.68 | CECT 20048, IMI 331913 | EU880902 | P. sambuci‐nigrae | Sambucus nigra | Netherlands | |
| CBS 629.68*, † | PD 67/753 | P. sambuci‐nigrae | Sambucus nigra | Netherlands | ||
| CBS 109170 | PD 75/796 | EU880903 | P. sambuci‐nigrae | Sambucus nigra | Netherlands | |
| CBS 126.93 | PD 73/642 | EU880904 | P. strasseri | Mentha sp. | Netherlands | |
| CBS 261.92* | PD 92/318, ATCC 24146 | EU880905 | P. strasseri | Mentha piperita | USA, Oregon | |
| CBS 109175 | PD 79/524 | EU880906 | P. telephii | Sedum spectabile | Netherlands | |
| CBS 760.73* | PD 71/1616, IMI 300060 | EU880907 | P. telephii | Sedum telephium | Netherlands |
Representative strains designated by Boerema et al. (2004).
Isotype strains.
Figure 1.
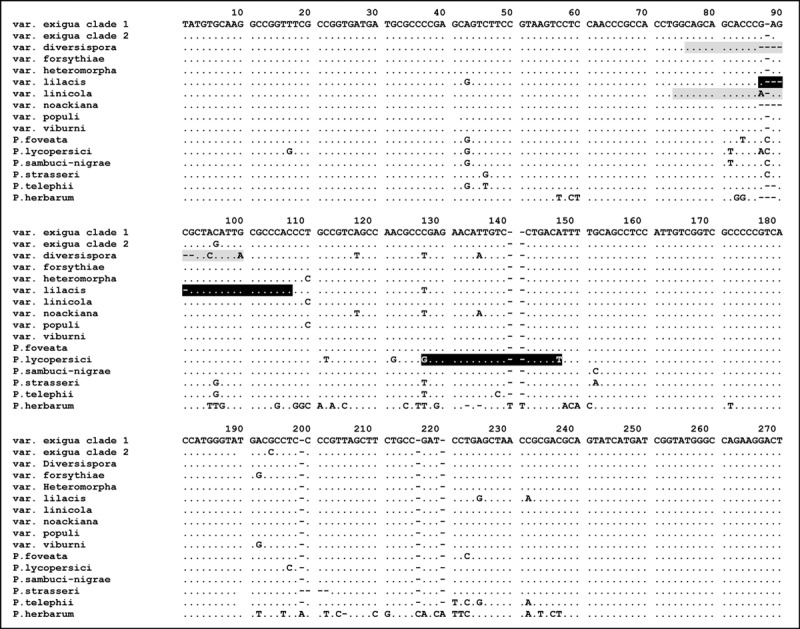
Alignment of actin sequences of 13 Phoma strains belonging to the P. exigua complex and three outgroup species. Strains included are P. exigua var. exigua (CBS 431.74 and CBS 101156), var. diversispora (CBS 531.86), var. forsythiae (CBS 101213), var. heteromorpha (CBS 443.94), var. lilacis (CBS 569.79), var. linicola (CBS 116.76), var. noackiana (CBS 100353), var. populi (CBS 100167), var. viburni (CBS 100354), P. sambuci‐nigrae (CBS 109170), P. foveata (CBS 341.67), and P. lycopersici (CBS 378.67). As outgroup species, P. strasseri (CBS 261.92), P. telephii (CBS 760.73) and P. herbarum (CBS 615.75) were included. Primers designed for this study are indicated by marked blocks: grey sequence blocks represent a forward primer sequence, black blocks a reverse primer. The full stops indicate characters identical to those in the first line and dashes represent alignment gaps. Primer ACTdiv76F spans var. diversispora nucleotides 76‐100, primer ACTlil103R spans var. lilacis nucleotides 87‐107, primer ACTlin74L spans var. linicola nucleotides 74–90, and primer ACTlyc145R spans P. lycopersici nucleotides 127–147.
Table 2.
Taxon‐specific primers designed for the identification of species and varieties in the Phoma exigua complex. The GenBank Accession Number of the sequence of the DNA amplification fingerprinting (DAF) fragment from which the primers were designed is shown in the last column.
| Taxon name | Marker | Primer ID | Primer sequence (5′−3′) | Product size (bp) | T m (°C) | GenBank Accession Number |
|---|---|---|---|---|---|---|
| P. exigua var. diversispora | Actin | ACTdiv76F | CAGCAGCACCCCTCCATTA | 190 | 62 | |
| ACT‐783R* | TACGAGTCCTTCTGGCCCAT | |||||
| P. exigua var. exigua | H‐CCT | Ex2‐1 | GCCCTGCAGACAATTTACGA | 368 | 60 | EU880838 |
| Ex2‐2 | GCCGATGAAAAGGAAAACCT | |||||
| P. exigua var. forsythiae | H‐CAA | For1‐1 | GCCAAGCGATATTGTACGCTAG | 378 | 64 | EU880845 |
| For1‐2 | ACCTCCGAGACATGAACGAC | |||||
| P. exigua var. heteromorpha | H‐CAA | ExpoF | CAAACTGTACACGACTCTTC | 363 | 58 | EU880841 |
| Expo364R | GAATACACTGGTCGGTAGTT | |||||
| P. exigua var. lilacis | Actin | ACT1Fd | GCYGCBCTCGTYATYGACAATGG | 139 | 60 | |
| ACTlil103R | GTGGGCGCAATGTAGCC | |||||
| P. exigua var. linicola | Actin | ACTlin74L | GGCAGCAGCACCCAAG | 195 | 59 | |
| ACT‐783R* | TACGAGTCCTTCTGGCCCAT | |||||
| P. exigua var. noackiana | H‐CCT | Noa1‐1 | AGCCTCCAACGATCATAAG | 482 | 60 | EU880842 |
| Noa1‐2 | TCAAGCACAAGTAGCACAAAAA | |||||
| P. exigua var. populi | H‐CAA | Pop3‐1 | AACGGGCAGTACTGATGCAAT | 400 | 64 | EU880843 |
| Pop3‐2 | CCGACACGTACCCACAATTT | |||||
| P. exigua var. viburni | H‐CAA | Vib4‐1 | CAAGAGATGCCTGGACCGTT | 753 | 64 | EU880844 |
| Vib4‐8 | AGTTTCTCAACTTTGACGCCTAGC | |||||
| P. foveata | H‐CTC | Fov1‐1 | GCCTCAACGGTGAAGATGG | 572 | 58 | EU880839 |
| Fov1‐2 | GCCTCGAGTTCTAAATGAGTTTG | |||||
| P. lycopersici | Actin | ACT1Fd | GCYGCBCTCGTYATYGACAATGG | 174 | 54 | |
| ACTlyc145R | AGTCAGGACAATGTTCTCC | |||||
| P. sambuci‐nigrae | H‐CAA | Sam1‐1 | CCAAGGTGAGGGTCGAGAAG | 253 | 60 | EU880840 |
| Sam1‐4 | CCATGGCACTTTGGAGTCTA |
The asterisk‐marked primer was developed by Carbone and Kohn (1999).
Figure 2.
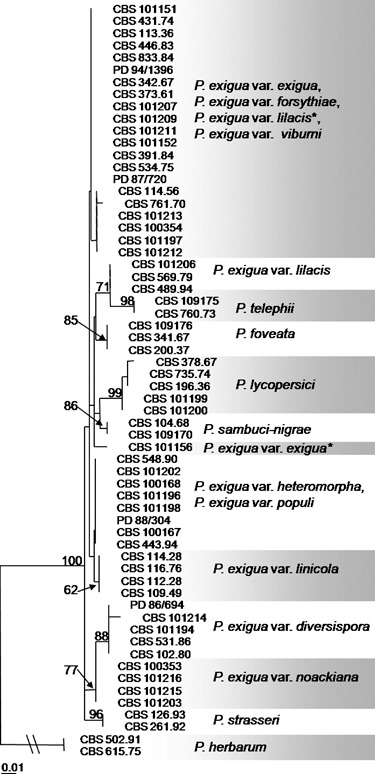
Neighbour‐joining phylogenetic tree obtained from partial actin sequences using the HKY85 substitution model (n = 62). Bootstrap support values are based on 1000 replicates and are shown at the nodes when higher than 60%. The scale bar represents 0.01 substitutions per site. The tree is rooted with two strains of P. herbarum (CBS 615.75 and CBS 502.91). The taxa marked with asterisks are considered to be misidentifications in the culture database.
Analysis of the DAF products
DNA extracts of 42 strains belonging to the P. exigua complex were analysed using five mini‐hairpin primers. Each of the fingerprints contained 1–13 visible bands between 300 and 2000 bp (average of 6.9 bands/primer) (Fig. 3). The results were well reproducible, as multiple amplification reactions in different thermal cyclers and in different amplification runs provided similar banding patterns (data not shown). Considerable variation was observed between the included species and varieties, and none of the bands was consistent over all samples, but often shared bands were found between multiple strains of a single species or variety that were unique for that taxon. Taxon‐specific bands of various sizes were obtained with different mini‐hairpin primers (Table 2). Taxon‐specific primers were developed for P. foveata and P. sambuci‐nigrae, and for P. exigua var. heterospora, forsythiae, noackiana, populi and viburni. In addition, for the P. exigua var. exigua strains that cluster with the reference strains CBS 431.74 and CBS 101152, a specific primer combination was developed.
Figure 3.
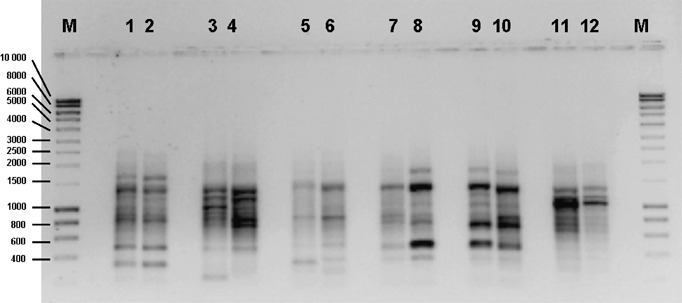
Example of a DAF assay on selected isolates from the P. exigua complex using the H‐CCT primer. Lanes 1 & 2, P. exigua var. heteromorpha CBS 443.94 and CBS 101196. Lanes 3 & 4, P. exigua var. noackiana CBS 100353 and CBS 101203. Lanes 5 & 6, P. exigua var. populi CBS 100167 and CBS 101202. Lanes 7 & 8, P. exigua var. viburni CBS 100354 and CBS 101211. Lanes 9 & 10, P. exigua var. forsythiae CBS 101213 and CBS 101197. Lanes 11 & 12, P. lycopersici CBS 378.67 and CBS 101199. Lanes M, Hyperladder I (Bioline).
A combined unweighted pair group method with arithmetic average (UPGMA) analysis of the five generated fingerprints is presented in Fig. 4. The results indicate that the taxa included in this study, with the exception of var. lilacis and var. exigua, proved to be monophyletic. These taxa were well‐supported (bootstrap support value > 70%) Similar to the data represented in Fig. 2, strain CBS 101207, which was originally identified as P. exigua var. lilacis, did not cluster with the main body of the var. lilacis strains. The type variety exigua appears to consist of two separate clusters. One, indicated in Fig. 4 as ‘Phoma exigua var. exigua 1’, comprises both reference strains, but has long‐branched taxa and a low support value. A second cluster comprising eight other strains, that were also originally identified as P. exigua var. exigua, is indicated in Fig. 4 as ‘Phoma exigua var. exigua 2’ and is well supported (bootstrap support value of 92%). In addition, nucleotide sequence data of the actin region of all var. exigua strains did not reveal consistently significant differences (1, 2). Nevertheless, from the DAF analysis results, the taxonomic status of these diverging strains appears to be questionable. Therefore, the strains in this clade were excluded from the primer design phase of this study.
Figure 4.
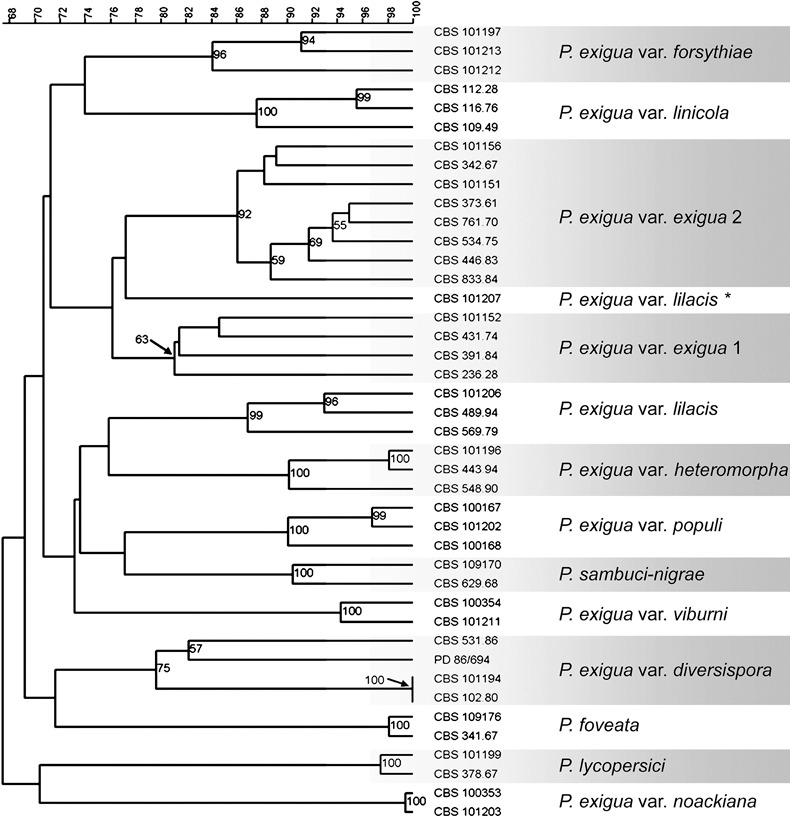
UPGMA analysis based on the combination of all five DAF mini‐hairpin patterns using the simple matching binary coefficient to calculate the similarity between the strains. Bootstrap support is based on 1000 replicates and values higher than 50% are shown. The scale at the top indicates percentage similarity. The taxon marked with an asterisk is considered to be a misidentification in the culture database.
Specificity of taxon‐specific PCR assays
Twelve taxon‐specific primer combinations were developed to distinguish the currently known P. exigua varieties and three species that are often confused with P. exigua. Four of these combinations anneal within the actin gene and eight were developed on the basis of the taxon‐specific bands generated using the DAF mini‐hairpin protocol (Table 2). Specific fragments resulting from DAF were selected from two strains per taxon. The fragments were ligated, cloned and sequenced. Fragments in which genetic variation was absent were used for primer design. The sequences obtained from the DAF fragments did not match with any of the sequences currently available in GenBank.
The developed primer combinations were tested for specificity on a selection of 47 Phoma strains present in the Centraalbureau voor Schimmelcultures (CBS) culture collection, which belonged to 36 different species. Furthermore, the primers were tested on all strains of the target taxa listed in Table 1. This assay resulted in 12 primer combinations which showed no false positives or false negatives (data not shown), giving confidence with regard to the specificity of the developed primers.
As a final trial, the 12 primer combinations were tested to confirm that they were taxon specific. Therefore, the DNA of target strains was amplified using the developed primers. As a positive control, pooled DNA of the 12 taxa, as well as from the second P. exigua var. exigua taxon (represented by CBS 101156), was included. As a negative control, the same DNA was pooled, with exclusion of the DNA of the target taxon. The results showed that the designed primer combinations successfully amplified DNA of the target taxa (Fig. 5), whereas the negative controls did not show any amplification product.
Figure 5.
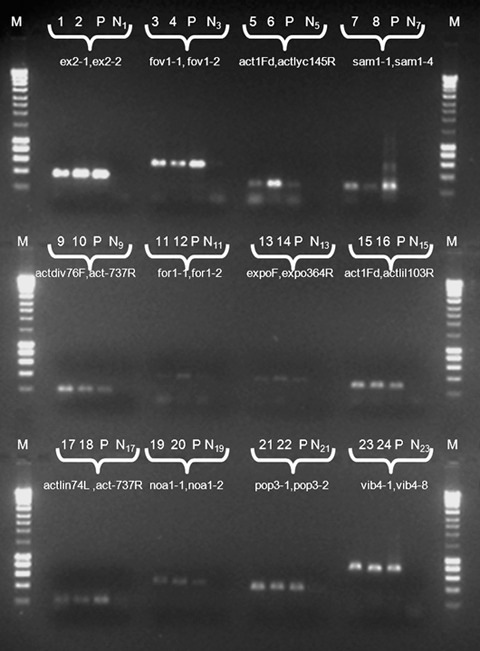
PCR Products amplified from genomic DNA using the species‐specific primer combinations indicated below the wells. Lane 1, P. exigua var. exigua (CBS 431.74); Lane 2, idem (CBS 101152); Lane 3, P. foveata (CBS 341.67); Lane 4, idem (CBS 109176); Lane 5, P. lycopersici (CBS 378.67); Lane 6, idem (CBS 101199); Lane 7, P. sambuci‐nigrae (CBS 629.68); Lane 8, idem (CBS 109170); Lane 9, P. exigua var. diversispora (CBS 102.80); Lane 10, idem (CBS 101194); Lane 11, P. exigua var. forsythiae (CBS 101213); Lane 12, idem (CBS 101197); Lane 13, P. exigua var. heteromorpha (CBS 443.94); Lane 14, idem (CBS 101196); Lane 15, P. exigua var. lilacis (CBS 569.79); Lane 16, idem (CBS 101207); Lane 17, P. exigua var. linicola (CBS 116.76) ; Lane 18, idem (CBS 112.28); Lane 19, P. exigua var. noackiana (CBS 100353); Lane 20, idem (CBS 101203); Lane 21, P. exigua var. populi (CBS 100167) ; Lane 22, idem (CBS 101202); Lane 23, P. exigua var. viburni (CBS 100354); Lane 24, idem (CBS 101211). Lane P comprises genomic DNA from pooled isolates from all varieties (CBS 431.74, CBS 341.67, CBS 378.67, CBS 629.68, CBS 102.80, CBS 101213, CBS 101196, CBS 443.94, CBS 569.79, CBS 116.76, CBS 100353, CBS 100167, CBS 100354 and CBS 101156 =P. exigua var. exigua type 2) amplified with the respective primer pairs. Lanes N1–N23 contains the same pooled DNA as in lane P, but excluding the target DNA of the specific applicable primer pair. Lanes M, Hyperladder I (Bioline).
DISCUSSION
Prior to the development of DNA‐based identification and detection methods, the different taxa in the P. exigua species complex could only be discriminated on the basis of a certain level of host specificity, cultural characters and minute morphological differences in vitro (Van der Aa et al., 2000; Boerema and Höweler, 1967; Boerema et al., 2004). Previous attempts to design sets of taxon‐specific oligonucleotides on the basis of ITS did not differentiate between P. foveata and several P. exigua varieties (Cullen et al., 2007), and a technique developed by Macdonald et al. (2000) required an additional endonuclease digestion, only to distinguish P. foveata from the P. exigua varieties exigua and diversispora and from P. sambuci‐nigrae. As DNA barcoding has been proven to be a useful method in taxon identification, it was preferred to identify such taxon‐specific oligonucleotide sequences. Unfortunately, both gene regions currently applied for DNA barcoding in fungi, cox1 and ITS, have only limited discriminatory power at the subspecies level, which is required for the P. exigua complex. Furthermore, nucleotide sequence analyses of a number of other gene regions (calmodulin, β‐tubulin, translation elongation factor 1‐α, 18S and 28S nrDNA) on a selection of at least 36 well‐vouchered strains of P. exigua and related species provided only a few nucleotide differences, that proved not to be conserved within a taxon (M. M. Aveskamp, unpublished data). As the actin gene can discriminate between several closely related Phoma taxa, apparently with little phylogenetic overlap between sister taxa, its use as a standard barcode region for the genus Phoma deserves further investigation. Although the same locus has been applied previously in the development of identification techniques, and is highly reliable for deep‐level phylogeny (Voigt and Wöstemeyer, 2000), its potential as a barcoding gene has not been studied fully. Nevertheless, our data show that it was not possible to design actin‐based DNA barcodes for all species or varieties in the complex studied, let alone to develop taxon‐specific sets of oligonucleotide primers based on this locus. Future work on the use of actin as a candidate barcoding gene for Phoma could involve the use of a longer amplification product of the gene, as, in this study, we only focused on a product shorter than 300 bp in length. However, the design and development of a robust new primer combination is required before the chances of actin being employed as a barcoding gene for Phoma can be estimated.
When comparing fungal strains at the species level or higher, an MLST approach is often sufficient to differentiate between the separate taxa. However, when multiple infraspecific taxa are involved, such as in the P. exigua species complex, further phylogenetic analysis using fingerprinting methods is often required. Arbitrarily primed technology (APT) methods use single arbitrarily chosen primers to produce simple fingerprints of complex genomes. However, most of these methods are considered to be poorly reproducible between different laboratories or even between different thermal cyclers (MacPherson et al., 1993; Penner et al., 1993). To increase the robustness and reproducibility of this technique, the DAF methodology was developed, which is based on the use of very short oligonucleotide primers (Caetano‐Anollés, 1993). A modified protocol in which mini‐hairpin primers were implemented was later adopted (Caetano‐Anollés and Gresshoff, 1994). Mini‐hairpin primers produce very consistent banding patterns because of the short arbitrary core: in a study on the genetic variability of flowering dogwood (Cornus florida), less than 2% variation in band mobility and less than 3% variation in product yield were observed (Caetano‐Anollés et al., 1999). The reproducibility of this technique was confirmed in the present study, as duplicate reactions resulted in identical banding patterns (data not shown).
However, from an evolutionary point of view, this technique, in combination with the set of strains used, is of less significance, as the evolutionary history and the relationship between the taxa in this complex could not be derived from the results obtained. Most individual taxa in the phylogenetic tree obtained (Fig. 4) were long branched, and bootstrap support for the backbone structure of the tree was low. This may be a result of the relatively small number of bands obtained and the method of scoring the bands—the stricter a band is scored, the longer the branches become. The number of bands obtained per reaction is relatively low compared with that observed when this method is applied to plant material. One of the reasons may be that, in general, plant genomes are much larger than those of fungi. For example, the genome of Leptosphaeria maculans, a teleomorph of P. lingam, is estimated to consist of approximately 34 Mb (Howlett et al., 2001). This is 4–400 times smaller than an average plant genome (Paterson, 2006). The consequence of this is that in a DAF assay on plant samples, more bands will be obtained, and thus more bands could be consistent over multiple taxa, which may lead to higher support values for the basal nodes. Nevertheless, for the development of taxon‐specific SCAR markers, the low phylogenetic applicability is not relevant, as single nucleotide differences can be sufficient to identify taxa.
The lack of support at the deeper nodes in the DAF‐based tree may be one of the explanations why the P. exigua complex, as a whole, seems to be paraphyletic; however, in the actin‐based phylogeny (Fig. 2), there are also some indications that the species borders of P. exigua are not in congruence with the present taxonomic information, although this reconstructed phylogeny is based on a limited number of SNPs from a single locus. The figure mainly illustrates the existence of a so‐called ‘barcoding gap’, and does not necessarily represent the ‘correct’ evolutionary history of the taxa included. Further research is required to obtain a better understanding of the evolutionary history of this species complex. In contrast, most of the individual varieties included in this study formed separate clusters in the DAF data set, which supports the subdivision of P. exigua proposed by Van der Aa et al. (2000). In addition, the closely related P. lycopersici, P. sambuci‐nigrae and P. foveata appeared to be monophyletic. However, a group of strains previously identified as P. exigua var. exigua formed a clearly distinct banding pattern in all analyses conducted, and represent a separate clade in the phylogenetic analysis. The existence of this clade is in congruence with an observation by Abeln et al. (2002), in which one strain, CBS 101156, clustered outside the main P. exigua var. exigua clade in their AFLP study. The authors hypothesized that the alternative banding pattern reflected the distinct geographical origin, as this strain was collected from the Philippines. However, the present results show that the strains in this cluster occur worldwide on a wide range of hosts. Further analysis of this group is required to determine the taxonomic status of these strains. Again, Abeln et al. (2002) mention ‘strain CBS 101207, a P. exigua var. lilacis isolate, being genetically totally different compared to the three other P. exigua var. lilacis isolates’. The present study supports the observation that this deviating strain probably belongs to another yet undescribed variety.
DAF using mini‐hairpin primers appears to be a helpful technique for the discrimination of closely related fungal taxa. Therefore, this technique is considered to be a promising tool for the assessment of infraspecific genetic variation. Using the DAF profiles obtained, we were able to design oligonucleotide primer combinations that can aid in the identification of taxa at the subspecies level. One of the pitfalls of the SCAR‐based identification of P. exigua varieties is that it is based on the absence or presence of two extremely short nucleotide sequences. Mutations or sexual genetic recombination may affect the target DNA of the developed primers, causing false negative identification results. However, it should be noted that, thus far, no evidence has been found for the sexual reproduction of P. exigua. Although the complete set of well‐vouchered strains that is housed in the public collections of CBS and the Dutch Plant Protection Service (PD) was used, the amount of control strains was limited to only three for some taxa. Therefore, it is recommended that the developed primers should be further validated on a larger set of strains. The PCR assays were conducted using only pure cultures in vitro; it is hoped that the data generated could eventually be implemented in a test to distinguish Phoma species and varieties in planta. The availability of such a test would greatly contribute to the reduction of invasive Phoma species and facilitate the utilization of correct phytosanitairy measures.
The border between the species rank and the variety level of a taxon in the P. exigua species complex has been a major point of discussion in the past. For example, P. foveata was recombined as a variety into P. exigua (Boerema, 1967) but, more recently, reinstalled (Boerema et al., 1987), mainly in order to avoid confusion with the plurivorous P. exigua. In this study, it was shown that the species and varieties in this complex are genetically highly similar. To further elucidate the evolutionary history of Phoma and to redefine taxonomical concepts in this genus will be two of the main challenges for the future.
EXPERIMENTAL PROCEDURES
Strains and DNA extraction
Fifty‐eight strains, belonging to the 12 different taxa within the P. exigua complex, were selected for study (Table 1). The reference strains indicated by Boerema et al. (2004) were included. Furthermore, six strains from P. herbarum, P. strasseri and P. telephii were selected as outgroups. The strains were cultured on OA medium (Gams et al., 2007) and incubated at 24 °C in complete darkness. After 14 days of growth, mycelium was scraped off the plates using a sterile scalpel blade and collected in a Microbead tube (Ultraclean Microbial DNA Isolation Kit, Mo Bio Laboratories, Carlsbad, CA, USA). Isolation of DNA was conducted using the Ultraclean Microbial DNA Isolation Kit (Mo Bio Laboratories) according to the manufacturer's instructions. The DNA yield was diluted 10 times and stored at 4 °C until further handling.
Actin PCR and sequence typing
The actin gene region was partially amplified using 0.2 µm of each primer ACT‐512F and ACT‐783R (Carbone and Kohn, 1999). The reaction mixture further contained approximately 5 ng of DNA, 1 × PCR buffer, 1 mm MgCl2, 48 µm deoxynucleoside triphosphates (dNTPs), 0.5 µm of each of the primers and 0.25 units of Taq DNA polymerase (Bioline, Luckenwalde, Germany). Each reaction was made up to a final volume of 12.5 µL. PCR was performed in a 2720 Thermal Cycler (Applied Biosystems, Foster City, CA, USA) using the following amplification conditions: 94 °C for 10 min, followed by 40 cycles of denaturation (94 °C for 30 s), annealing (55 °C for 30 s) and elongation (72 °C for 80 s), and a final extension step at 72 °C for 6 min. Sequencing of the amplicons was performed with PCR primers in both directions using the BigDye Terminator Chemistry v3.1 (Applied Biosystems) according to the manufacturer's recommendations. Sequence products were purified with Sephadex G‐50 Fine (GE Healthcare Bio‐Sciences, Uppsala, Sweden) and subsequently separated and analysed on an ABI Prism 3730 DNA Sequencer (Applied Biosystems). Consensus sequences were computed from the forward and reverse sequences using the BioNumerics v4.5 software package (Applied Maths, St‐Martens‐Lathem, Belgium). The consensus sequences were assembled and aligned using the same software and adjusted manually where necessary. The phylogenetic analyses of the sequence data were performed in paup (Phylogenetic Analysis Using Parsimony) v4.0b10 (Swofford, 2003), and consisted of neighbour‐joining analysis with the uncorrected (‘p’), Jukes‐Cantor and HKY85 substitution models. Alignment gaps were treated as missing data and all characters were unordered and of equal weight. Any ties were broken randomly when encountered. The robustness of the resulting phylogenetic trees was evaluated by 1000 bootstrap replications (Hillis and Bull 1993), and the trees were printed with TreeView v. 1.6.6 (Page 1996).
The consensus sequences obtained were deposited in GenBank see Table 1 (for Accession Numbers).
DAF PCR and fingerprint analysis
Five arbitrary mini‐hairpin primers were designed, and consisted of seven nucleotides forming the stem and loop (5′‐GCGAAGC‐3′), followed by three nucleotides forming an arbitrary core. The designed oligonucleotide primers were 5′‐H‐CAA‐3′, 5′‐H‐CAG‐3′, 5′‐H‐CCA‐3′, 5′‐H‐CCT‐3′ and 5′‐H‐CTC‐3′, where H stands for the stem and loop nucleotides. The amplification of 42 strains was performed using the following amplification conditions: 95 °C for 5 min, followed by 40 cycles of denaturation, annealing and elongation (96, 30 and 72 °C for 30 s for each step), and a final extension step at 72 °C for 6 min. Each PCR had a total volume of 15 µL and contained 1.0 µL of 10 × diluted genomic DNA, 1 × PCR buffer, 2 mm MgCl2, 240 µm of each of the dNTPs, 3 µm of the primer and 2 units of Taq DNA polymerase (Bioline).
The total volume of the PCR product obtained (15 µL) was separated by gel electrophoresis at 110 V for approximately 120 min on a 1% (w/v) agarose gel containing 0.1 µg/mL ethidium bromide in 1 × TAE buffer [0.4 m tris(hydroxymethyl)aminomethane (Tris), 0.05 m sodium acetate (NaAc) and 0.01 m ethylenediaminetetraacetic acid (EDTA), pH 7.85]. The molecular weight marker Hyperladder I (Bioline) was used as DNA standard. Subsequently, the DNA fragments were visualized and photographed under UV light.
The fingerprints were analysed for each primer separately with the BioNumerics v4.5 software package. The similarity between the patterns was calculated using the Jaccard UPGMA algorithm. Analyses were first performed with all five banding patterns separately, with all visible bands having equal weights. This was followed by a combined unweighted analysis using the simple matching binary coefficient, as, on average, an equal number of bands was present for all five amplification reactions.
Primer development
Two well‐vouchered strains were selected per taxon for gel band isolation. Fragments resulting from DAF PCR unique to each taxon were cut out of the agarose gel using sterile scalpel blades. The DNA was resuspended by application of the Illustra GFX PCR DNA and Gel Band Purification Kit (GE Healthcare, Little Chalfont, Buckinghamshire, UK) and ligated into pGEM®‐T Easy vector using pGEM®‐T Easy Vector System I (Promega, Madison, WI, USA), according to the manufacturer's instructions. The vector with insert was cloned into competent Escherichia coli strain JM109 cells (Promega) by applying a heat shock for 50 s at 42 °C. The recombinants were visualized with blue/white screening on standard Luria–Bertani (LB) agar plates supplemented with 100 µg/mL ampicillin, 0.1 mm isopropylthio‐β‐d‐galactoside (IPTG) and 40 µg/mL 5‐bromo‐4‐chloro‐3‐indolyl‐β‐d‐galactopyranoside (X‐Gal). The white colonies were picked up with a pipette tip and resuspended in 10 µL of LB solution for colony PCR. Colony PCR was performed with the universal M13F and M13R primers, and the reaction mixture contained 1.5 µL of liquid colony, 0.2 µm of each primer, 0.4 unit Taq polymerase E (Genaxxon Bioscience, Biberach, Germany), 0.03 mm dNTPs, 1.5 mm MgCl2 and 1 × PCR buffer E ‘incomplete’ (Genaxxon) in a total reaction volume of 10 µL. The initial denaturation step of 5 min at 94 °C was followed by 35 cycles of 94 °C (20 s), 55 °C (20 s) and 72 °C (100 s), with a final elongation step at 72 °C (7 min).
Sequencing of the amplicons was performed in the same way as for the actin amplicons, but with the exception that the universal primers M13F and M13R were applied. Using the Seqman program from the Lasergene package (DNAstar, Madison, WI, USA), the vector's DNA was subtracted, consensus sequences were computed and sequences were aligned. The consensus sequences obtained were compared with sequences deposited in GenBank using the blast search algorithm.
To obtain a conventional PCR assay to identify the separate taxa included in this species complex, primer sets unique to each taxon were designed based on the actin region, or to the taxon‐specific DAF bands using the Primer3 web application (http://primers.sourceforge.net). In the case of the DAF‐based primers, primers were based on taxon‐specific bands that did not show any genetic variation in the sequence analyses. At least one of the designed oligonucleotides contained the complete arbitrary core of the mini‐hairpin primer. For the actin‐based primer combinations, either the universal primer ACT‐783R (Carbone and Kohn, 1999) or the newly designed forward primer ACT1Fd (5′‐GCYGCBCTCGTYATYGACAATGG‐3′) was used as an anchor primer, whilst the second primer was designed on the region of high interspecific variation. It was attempted to design all primers (Table 2) with an annealing temperature of approximately 60 °C to guarantee standardization of PCR conditions. The sequences are deposited in GenBank, and trace files are lodged with MycoBank.
ACKNOWLEDGEMENTS
We thank Mrs C. H. M. Rosendahl‐Peters (Plantenziektenkundige Dienst, Wageningen, The Netherlands) for providing cultures and Dr L.‐H. Zwiers (Centraalbureau voor Schimmelcultures, Utrecht, The Netherlands) for technical guidance. This research was supported by the Dutch Ministry of Agriculture, Nature and Food Quality through an endowment of the FES programme ‘Versterking infrastructuur Plantgezondheid’. The grant of Dr E. Turco was supported by the National Research Council of Italy (CNR) Short‐term Mobility Programme 2007.
REFERENCES
- Van Der Aa, H.A. , Boerema, G.H. and De Gruyter, J. (2000) Contributions towards a monograph of Phoma (Coelomycetes)—VI. 1. Section Phyllostictoides: Characteristics and nomenclature of its type species Phoma exigua . Persoonia, 17, 435–456. [Google Scholar]
- Abeln, E.C.A. , Stax, A.M. , De Gruyter, J. and Van Der Aa, H.A. (2002) Genetic differentiation of Phoma exigua varieties by means of AFLP fingerprints. Mycol. Res. 106, 419–427. [Google Scholar]
- Álvarez, L.A. , Armengol, J. , Perez‐Sierra, A. , León, M. , Abad‐Campos, P. , Vicent, A. , Beltran, C. and Garcia‐Jiménez, J. (2005) Detección de Phoma exigua var. heteromorpha en viveros de adelfa (Nerium oleander L.) en España. Bol. San. Veg. Plagas, 31, 417–423. [Google Scholar]
- Balis, E. , Velegraki, A. , Fragou, A. , Pefanis, A. , Kalabokas, T. and Mountokalakis, T. (2006) Lung mass caused by Phoma exigua . Scand. J. Infect. Dis. 38, 552–555. [DOI] [PubMed] [Google Scholar]
- Bentley, S. and Bassam, B.J. (1996) A robust DNA amplification fingerprinting system applied to analysis of genetic variation within Fusarium oxysporum f. sp. cubense . J. Phytopathol. 144, 207–213. [Google Scholar]
- Boerema, G.H. (1967) The Phoma organisms causing gangrene of potatoes. Neth. J. Plant Pathol. 73, 190–192. [Google Scholar]
- Boerema, G.H. and Höweler, L.H. (1967) Phoma exigua Desm. and its varieties. Persoonia, 5, 15–28. [Google Scholar]
- Boerema, G.H. , Loerakker, W.M. and Hamers, M.E.C. (1987) Check‐list for scientific names of common parasitic fungi. Supplement 2a (additions and corrections): Fungi on field crops: beet and potato; caraway, flax and oilseed poppy. Neth. J. Plant Pathol. 93(suppl. 1), 1–20. [Google Scholar]
- Boerema, G.H. , De Gruyter, J. , Noordeloos, M.E. and Hamers, M.E.C. (2004) Phoma Identification Manual. Differentiation of Specific and Infra‐Specific Taxa in Culture. Wallingford, Oxfordshire: CABI Publishing. [Google Scholar]
- Boyd, A.E.W. (1972) Potato storage diseases. Annu. Rev. Plant Pathol. 51, 297–321. [Google Scholar]
- Caetano‐Anollés, G. (1993) Amplifying DNA with arbitrary oligonucleotide primers. PCR Methods Appl. 3, 85–94. [DOI] [PubMed] [Google Scholar]
- Caetano‐Anollés, G. (1998) Genetic instability of bermudagrass (Cynodon) cultivars ‘Tifgreen’ and ‘Tifdwarf’ detected by DAF and ASAP analysis of accessions and off‐types. Euphytica, 101, 165–173. [Google Scholar]
- Caetano‐Anollés, G. and Gresshoff, P.M. (1994) DNA amplification fingerprinting using arbitrary mini‐hairpin oligonucleotide primers. Bio/Technology, 12, 619–623. [DOI] [PubMed] [Google Scholar]
- Caetano‐Anollés, G. , Callahan, L.M. , Williams, P.E. , Weaver, K.R. and Gresshoff, P.M. (1995) DNA amplification fingerprinting analysis of bermudagrass (Cynodon): genetic relationships between species and interspecific crosses. Theor. Appl. Genet. 91, 228–235. [DOI] [PubMed] [Google Scholar]
- Caetano‐Anollés, G. , Trigiano, R.N. and Windham, M.T. (1996) Sequence signatures from DNA amplification fingerprints reveal fine population structure of the dogwood pathogen Discula destructiva . FEMS Microbiol. Lett. 145, 377–383. [DOI] [PubMed] [Google Scholar]
- Caetano‐Anollés, G. , Schlarbaum, S.E. and Trigiano, R.N. (1999) DNA amplification fingerprinting and marker screening for pseudo‐testcross mapping of flowering dogwood (Cornus florida L.). Euphytica, 106, 209–222. [Google Scholar]
- Carbone, I. and Kohn, L.M. (1999) A method for designing primer sets for speciation studies in filamentous ascomycetes. Mycologia, 91, 553–556. [Google Scholar]
- Cullen, D.W. , Toth, I.K. , Boonham, N. , Walsh, K. , Barker, I. and Lees, A.K. (2007) Development and validation of conventional and quantitative polymerase chain reaction assays for the detection of storage rot potato pathogens, Phytophthora erythroseptica, Pythium ultimum, Phoma foveata . J. Phytopathol. 155, 309–315. [Google Scholar]
- Druzhinina, I.S. , Kopchinskiy, A.G. , Komón, M. , Bisset, J. , Szakacs, G. and Kubicek, C.P. (2005) An oligonucleotide barcode for species identification in Trichoderma and Hypocrea . Fungal Genet. Biol. 42, 813–828. [DOI] [PubMed] [Google Scholar]
- Gams, W. , Verkley, G.J.M. and Crous, P.W. (2007) CBS Course of Mycology. 5th edn. Utrecht: Centraalbureau voor Schimmelcultures. [Google Scholar]
- Groenewald, M. , Groenewald, J.Z. , Linde, C.C. and Crous, P.W. (2007) Development of polymorphic microsatellite and single polymorphism markers for Cercospora beticola (Mycosphaerellaceae). Mol. Ecol. Notes, 7, 890–892. [Google Scholar]
- Hebert, P.D.N. , Cywinska, A. , Ball, S.L. and DeWaard, J.R. (2002) Biological identifications through DNA barcodes. Proc. R. Soc. London, Ser. B: Biol. Sci. 270, 313–321. [DOI] [PMC free article] [PubMed] [Google Scholar]
- Hillis, D.M. and Bull, J.J. (1993) An empirical test of bootstrapping as a method for assessing confidence in phylogenetic analysis. Syst. Biol. 42, 182–192. [Google Scholar]
- Howlett, B.J. , Idnurm, A. and Pedras, M.S.C. (2001) Leptosphaeria maculans, the causal agent of blackleg disease of brassicas. Fungal Genet. Biol. 33, 1–14. [DOI] [PubMed] [Google Scholar]
- Koike, S.T. , Subbarao, K.V. , Verkley, G.J.M. , Fogle, D. and O’Neill, T.M. (2006) Phoma basal rot of romaine lettuce in California caused by Phoma exigua: occurrence, characterization, and control. Plant Dis. 90, 1268–1275. [DOI] [PubMed] [Google Scholar]
- Macdonald, J.E. , White, G.P. and Coté, M.J. (2000) Differentiation of Phoma foveata from P. exigua using a RAPD generated PCR‐RFLP marker. Eur. J. Plant Pathol. 106, 67–75. [Google Scholar]
- MacPherson, J.M. , Eckstein, P.E. , Scoles, G.J. and Gajadhar, A.A. (1993) Variability of the random amplified polymorphic DNA assay among thermal cyclers, and effects of primer and DNA concentration. Mol. Cell. Probe, 7, 293–299. [DOI] [PubMed] [Google Scholar]
- Men, A.E. , Borisov, A.Y. , Rosov, S.M. , Ushakov, K.V. , Tsyganoc, V.E. , Tikhonovich, I.A. and Gresshoff, P.M. (1999) Identification of DNA amplification fingerprinting (DAF) markers close to symbiosis‐ineffective sym31 mutation of pea (Pisum sativum L.). Theor. Appl. Genet. 98, 929–936. [Google Scholar]
- Monte, E. , Bridge, P.D. and Sutton, B.C. (1990) Physiological and biochemical studies in Coelomycetes. Phoma . Stud. Mycol. 32, 21–38. [Google Scholar]
- Monte, E. , Bridge, P.D. and Sutton, B.C. (1991) An integrated approach to Phoma systematics. Mycopathologia, 115, 89–103. [DOI] [PubMed] [Google Scholar]
- Morgan‐Jones, G. and Burch, K.B. (1988) Studies in the genus Phoma. XI. Concerning Phoma lycopersici, the anamorph of Didymella lycopersici, causal organism of stem canker and fruit rot of tomato: second species implicated as a pathogen of tomato. Mycotaxon, 32, 133–142. [Google Scholar]
- Page, R.D.M. (1996) TREEVIEW: An application to display phylogenetic trees on personal computers. Comput. Appl. Biosci. 12, 357–358. [DOI] [PubMed] [Google Scholar]
- Paterson, A.H. (2006) Leafing through the genomes of our major crop plants: strategies for capturing unique information. Nat. Rev. Genet. 7, 174–184. [DOI] [PubMed] [Google Scholar]
- Penner, G.A. , Bush, A. , Wise, R. , Kim, W. , Domier, L. , Kasha, K. , Laroche, A. , Scoles, G. , Molnar, S.J. and Fedak, G. (1993) Reproducibility of random amplified polymorphic DNA (RAPD) analysis among laboratories. PCR Methods Appl. 2, 341–345. [DOI] [PubMed] [Google Scholar]
- Rai, M.K. (1998) The Genus Phoma (Identity and Taxonomy). Dehradun: IBD Publisher & Distributors. [Google Scholar]
- Seifert, K.A. , Samson, R.A. , DeWaard, J.R.. Houbraken, J. , Lévesque, C.A. , Moncalvo, J.‐M. , Louis‐Seize, G. and Hebert, P.D.N. (2007) Prospects for fungus identification using CO1 DNA barcodes, with Penicillium as a test case. Proc. Natl. Acad. Sci. USA, 104, 3901–3906. [DOI] [PMC free article] [PubMed] [Google Scholar]
- Sen, A. , Balyan, H.S. , Sharma, P.C. , Ramesh, B. , Kumar, A. , Roy, J.K. , Varshney, R.K. and Gupta, P.K. (1997) DNA amplification fingerprinting (DAF) as a new source of molecular markers in bread wheat. Wheat Inf. Serv. 85, 35–42. [Google Scholar]
- Shamoun, S.F. and Zhao, S. (2005) First report of Phoma exigua as a pathogen of salal (Gaultheria shallon) in British Columbia, Canada. Plant Dis. 89, 685. [DOI] [PubMed] [Google Scholar]
- Swofford, D. (2003) PAUP* 4.0b10. Phylogenetic analysis using parsimony (*and other methods). Sunderland, MA: Sinauer. [Google Scholar]
- Voigt, K. and Wöstemeyer, J. (2000) Reliable amplification of actin genes facilitates deep‐level phylogeny. Microbiol. Res. 155, 179–195. [DOI] [PubMed] [Google Scholar]