Abstract
Nitrogen-doped graphene quantum dots (N-GQDs) were decorated on a three-dimensional (3D) MoS2–reduced graphene oxide (rGO) framework via a facile hydrothermal method. The distribution of N-GQDs on the 3D MoS2–rGO framework was confirmed using X-ray photoelectron spectroscopy, energy dispersive X-ray elemental mapping, and high-resolution transmission electron microscopy techniques. The resultant 3D nanohybrid was successfully demonstrated as an efficient electrocatalyst toward the oxygen reduction reaction (ORR) under alkaline conditions. The chemical interaction between the electroactive N-GQDs and MoS2–rGO and the increased surface area and pore size of the N-GQDs/MoS2–rGO nanohybrid synergistically improved the ORR onset potential to +0.81 V vs reversible hydrogen electrode (RHE). Moreover, the N-GQDs/MoS2–rGO nanohybrid showed better ORR stability for up to 3000 cycles with negligible deviation in the half-wave potential (E1/2). Most importantly, the N-GQDs/MoS2–rGO nanohybrid exhibited a superior methanol tolerance ability even under a high concentration of methanol (3.0 M) in alkaline medium. Hence, the development of a low-cost metal-free graphene quantum dot-based 3D nanohybrid with high methanol tolerance may open up a novel strategy to design selective cathode electrocatalysts for direct methanol fuel cell applications.
1. Introduction
Zero-dimensional (0D) graphene quantum dots (GQDs) with tunable electrical and optical properties have been considered to be impressive candidates for diverse applications including solar cells, light-emitting diodes, photocatalysts, biomedical imaging, capacitors, batteries, sensors, and fuel cells.1−8 Recently, several advancements have been made in both theoretical and experimental studies to explore the intrinsic properties of various heteroatom-doped GQDs for electrocatalytic applications.1,9 Previous reports reveal that the substitution of N atoms with GQDs could alter the electronic structure and offer more active sites for the oxygen reduction reaction (ORR) in fuel cells.10−12 Qu et al. have synthesized N-doped GQDs (N-GQDs) with oxygen-rich functionalities, which exhibited superior electrocatalytic reactivity toward ORR.1 Yet another report demonstrated the influence of the size of N-GQDs on ORR, and it showed that increasing the N-GQD size leads to an increase in the current density.13 Similarly, N-GQDs were synthesized using an electrochemical method, and their size-dependent electrocatalytic activity for ORR was also evaluated.14
To utilize the potential properties of N-GQDs toward ORR, N-GQD-based hybrid electrocatalysts have also been developed recently.10,15 In particular, the incorporation of N-GQDs on different carbon supports has attracted significant attention to fabricate alternative highly efficient electrocatalysts for ORR.10,16 Among various carbon supports, graphene has been considered a promising support because of its exceptional physiochemical properties such as high specific surface area, high carrier mobility, excellent electrical conductivity, and good chemical stability.17−24 Recently, boron- and nitrogen-doped GQDs were anchored on graphene platelets using a hydrothermal method and demonstrated to be an efficient electrocatalyst for ORR.15 Similarly, a novel class of GQD-decorated graphene nanoribbon was prepared through a one-step reduction reaction for ORR.25 Likewise, microwave-assisted functionalization of GQDs with the N and S codoped graphene electrocatalyst exhibited an excellent methanol tolerance property.26 Very recently, N-GQDs/graphene nanocomposites have been prepared using a facile self-assembly method and employed as an efficient electrocatalyst for ORR.27 The N-rich carbon dot-incorporated graphene electrocatalyst prepared via one-pot synthesis showed a superior methanol tolerance property in an alkaline environment.28
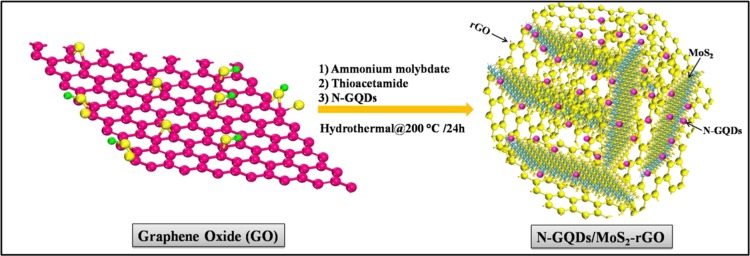
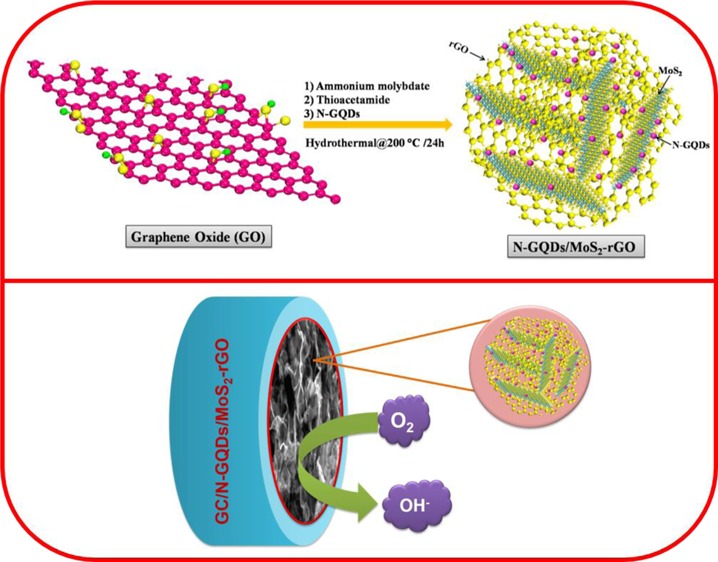
In addition, two-dimensional (2D) metal chalcogenides, especially molybdenum disulfide (MoS2), have also been demonstrated to be potential candidates for ORR because of their unique properties such as large surface area and high electrical conductivity.29,30 However, the electrocatalytic activity of MoS2 can be further improved by modification with different carbon supports. Recent studies have confirmed that the electrocatalytic behavior of the catalysts also depends on their morphological structure such as shape and size.31 In particular, assembling 2D nanosheets into 3D nanostructures offers a porous structure with a large surface area and high electrical conductivity. The electrocatalytic performance of the 3D nanocomposite was higher compared with those of the catalysts with other dimensions such as 1D and 2D.32 Recently, MoS2–reduced graphene oxide (MoS2–rGO) nanocomposites have been synthesized using a hydrothermal method and have been used as efficient electrocatalysts for the hydrogen evolution reaction (HER), ORR, and lithium-ion batteries.32−35 In the present study, we have designed N-GQD-decorated MoS2–rGO with a 3D framework via a simple hydrothermal method as displayed in Scheme 1. This is the first report using N-GQDs along with MoS2–rGO for ORR. The N-GQDs/MoS2–rGO showed a 3D hierarchical framework with crumpled surfaces and edges. The resultant nanohybrid not only exhibited a better ORR onset potential of +0.81 V vs reversible hydrogen electrode (RHE) under an O2-saturated KOH solution but also showed an excellent methanol tolerance property at a high methanol concentration. Thus, these properties make this newly prepared N-GQDs/MoS2–rGO nanohybrid a potential selective cathode electrocatalyst for direct methanol fuel cell applications.
Scheme 1. Schematic Illustration of the Synthesis of a 3D N-GQDs/MoS2–rGO Nanohybrid.
2. Results and Discussion
UV–visible absorption spectra of N-GQDs, GO, MoS2, MoS2–rGO, and N-GQDs/MoS2–rGO dispersed in deionized (DI) water are displayed in Figure 1. The N-GQDs exhibit a characteristic optical absorption peak at 348 nm.5 This intense absorption peak is mainly attributed to the n → π* transition that occurs in the C=O bond of N-GQDs.4 Moreover, the N-GQDs show strong blue luminescence in the presence of UV light (365 nm). This result indicates the formation of uniform sized N-GQDs. Likewise, an absorption peak noted at <300 nm for MoS2, MoS2–rGO, and N-GQDs/MoS2–rGO is assigned to the excitonic features of small-sized MoS2 nanosheets.36 However, no absorption peak is observed for N-GQDs, which might be due to the low content of N-GQDs present in the resultant nanohybrid. On the other hand, a relatively high content of the black colored MoS2–rGO present in the resultant N-GQDs/MoS2–rGO can shield the photons coming into the N-GQDs.37 This effect is commonly known as “light shielding effect”.37,38 A similar phenomenon was also observed earlier for melamine-functionalized 3D graphene sheets with CdS in photocatalytic applications.37
Figure 1.
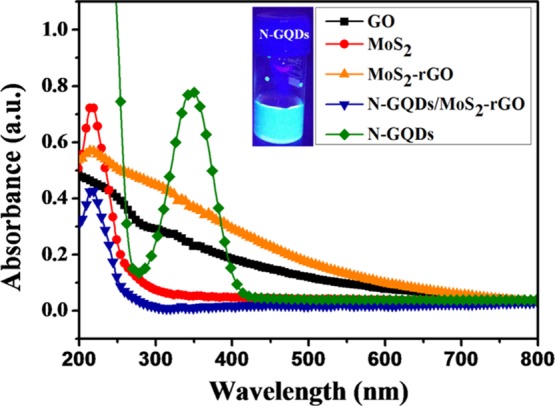
UV–vis absorption spectra of N-GQDs (inset: digital photograph of N-GQDs illuminated with a 365 nm, 8 W UV lamp), GO, MoS2, MoS2–rGO, and N-GQDs/MoS2–rGO.
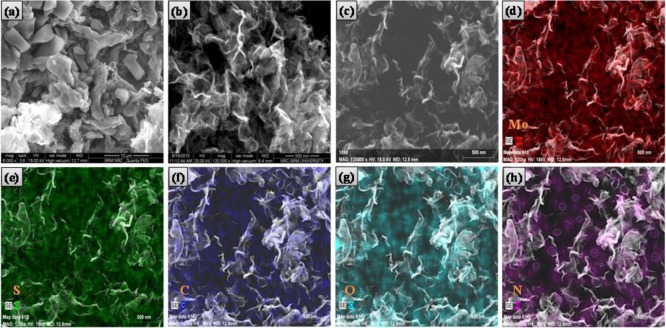
The morphological structure of the N-GQDs/MoS2–rGO nanohybrid was examined using FE-SEM analysis. The prepared graphene oxide (GO) and MoS2 alone showed a well-defined 2D sheetlike morphology (Figure S1). As shown in Figure 2b, the N-GQDs/MoS2–rGO nanohybrid exhibits a typical 3D framework with wrinkled surfaces and edges. This indicates that a few layers of crumpled rGO sheets are folded with MoS2 sheets forming a 3D nanostructure. Thus, MoS2–rGO prepared with the 3D nanostructure can provide a high surface area for the loading of N-GQDs. Figure 2c–h gives the individual elemental mapping of the N-GQDs/MoS2–rGO nanohybrid. Only expected elements such as Mo, S, C, O, and N are identified in the N-GQDs/MoS2–rGO nanohybrid. The N element observed in N-GQDs/MoS2–rGO reconfirms the existence of N-GQDs. Similarly, the EDX profile also shows only the Mo, S, C, O, and N elements in the synthesized nanohybrid (Figure S2).
Figure 2.
Field emission–scanning electron microscopy (FE-SEM) images of (a) MoS2–rGO and (b) N-GQDs/MoS2–rGO nanohybrid and (c) energy dispersive X-ray (EDX) mapping area of the N-GQDs/MoS2–rGO nanohybrid and the corresponding elemental mapping of (d) Mo, (e) S, (f) C, (g) O, and (h) N elements.
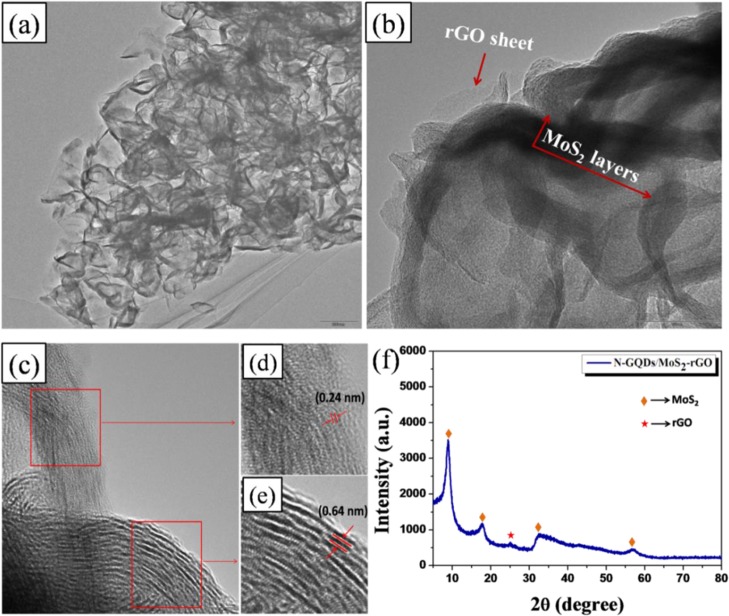
Figure 3a,b shows the TEM images of N-GQDs/MoS2–rGO with different magnifications. The resultant N-GQDs/MoS2–rGO exhibits a typical 3D architecture with wrinkled surfaces or edges (Figure 3a). Thus, the obtained TEM image is similar to the FE-SEM image (Figure 2b). It is also interesting to note that the MoS2 nanosheets and rGO sheets are intercalated with each other, which results in the formation of a 3D MoS2–rGO nanostructure (Figure 3b). Moreover, HR-TEM studies are carried out to further confirm the incorporation of N-GQDs on the MoS2–rGO framework. As depicted in Figure 3d,e, the marked lattice fringe values of 0.24 and 0.64 nm are assigned to the (1120) plane of the graphitic quantum dots and the (002) plane of MoS2, respectively.5,39 The observed (1120) crystal plane corresponding to the graphitic quantum dots clearly discloses the successful incorporation of N-GQDs on the MoS2–rGO nanohybrid. XRD studies were performed to identify the crystalline nature of the 3D hybrid. As displayed in Figure 3f, a broad diffraction peak observed at 2θ = 25° is related to the (002) crystal plane of rGO, and the corresponding d-spacing value is estimated to be 0.35 nm.40 Moreover, two distinct diffraction peaks noted at the 2θ values of 32.5° and 57° are assigned to the (100) and (110) planes of MoS2. This result clearly indicates the well-ordered atomic arrangements of MoS2 along the basal planes.41 More importantly, two additional peaks appeared at a low-angle region, that is, 2θ = 8.8° and 17.7°, which clearly suggests the formation of a lamellar nanostructure of MoS2 with enlarged d-spacing values of 1 and 0.5 nm, respectively (JCPDS Card #: 73-1508).42 It is worth mentioning that the oxygen functionalities of GO that intercalated between the MoS2 sheet results in an increase in the d-spacing value (1 nm) of the nanohybrid compared to that of pristine MoS2 reported elsewhere.32,42
Figure 3.
(a,b) Transmission electron microscopy (TEM) images of N-GQDs/MoS2–rGO with different magnifications, (c) high-resolution TEM (HR-TEM) image of N-GQDs/MoS2–rGO, (d,e) lattice resolved-TEM image of N-GQDs/MoS2–rGO, and (f) X-ray diffraction (XRD) pattern of the N-GQDs/MoS2–rGO nanohybrid.
Fourier transform infrared (FT-IR) spectra of GO, MoS2–rGO, and N-GQDs/MoS2–rGO are displayed in Figure 4. GO shows absorption peaks at 3443, 1733, 1627, 1386, 1220, and 1107 cm–1, which are assigned to the O–H, C=O, C=C, C–O (carboxyl), C–OH, and C–O (alkoxy) groups, respectively.43−45 The decrease in the peak intensity of the oxygen-rich functional groups present in MoS2–rGO and the N-GQDs/MoS2–rGO nanohybrid suggests the successful reduction of GO to rGO.46 Moreover, a peak centered at 605 cm–1 of MoS2–rGO and the N-GQDs/MoS2–rGO nanohybrid corresponds to the Mo–S vibration.47 In addition, a peak that appears at 1040 cm–1 of N-GQDs/MoS2–rGO is assigned to the C–N bond present in N-GQDs.48
Figure 4.
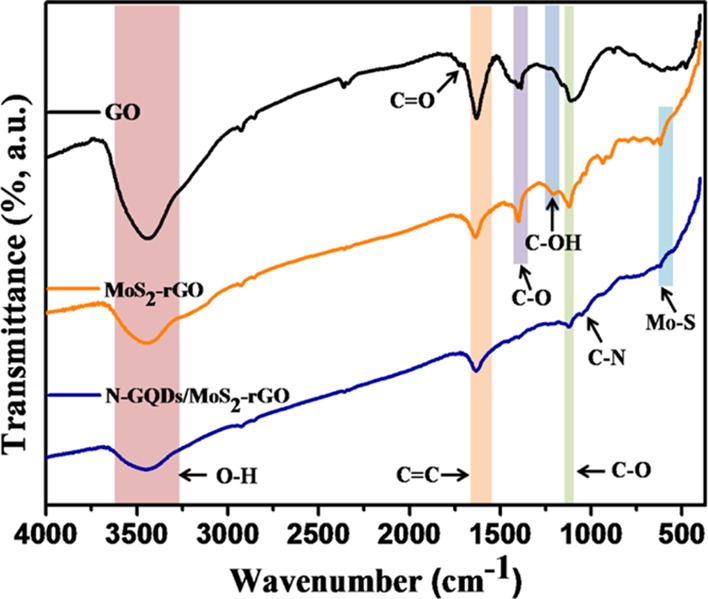
FT-IR spectra of GO, MoS2–rGO, and the N-GQDs/MoS2–rGO nanohybrid.
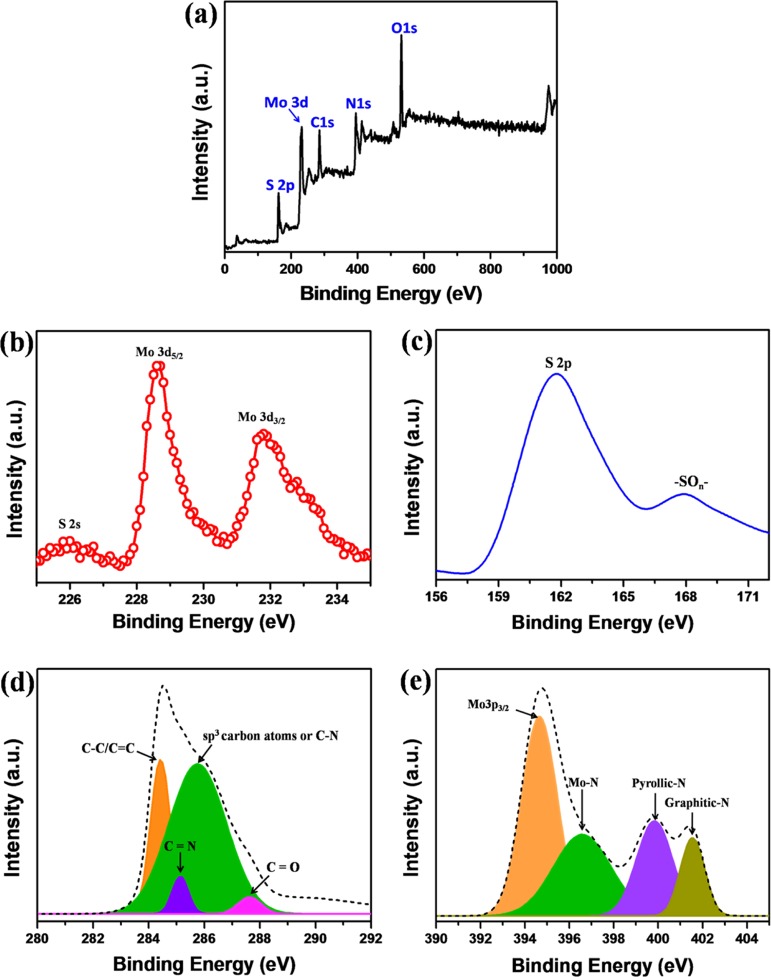
X-ray photoelectron spectroscopy (XPS) analysis was carried out to investigate the chemical nature and identify the elements present in the N-GQDs/MoS2–rGO nanohybrid. Figure 5a shows the XPS survey scan spectrum of the N-GQDs/MoS2–rGO nanohybrid. The predominant peaks identified at 162.5, 230.5, 284.4, 395.4, and 531.8 eV correspond to S 2p, Mo 3d, C 1s, N 1s, and O 1s core-level spectra, respectively. Two peaks identified at 228.6 and 231.8 eV for the high-resolution Mo 3d spectra are assigned to Mo 3d5/2 and Mo 3d3/2, respectively (Figure 5b).49 The spin energy difference between the core levels of Mo 3d5/2 and Mo 3d3/2 is measured to be 3.1 eV, which indicates the Mo4+ oxidation state of Mo in N-GQDs/MoS2–rGO.50 In addition, a small peak located at 226 eV is related to S 2s.32 In the high-resolution S 2p spectrum, S 2p and −SOn– peaks noted at 162 and 168 eV indicate the presence of sulfur species in N-GQDs/MoS2–rGO (Figure 5c).49,51,52 The high-resolution C 1s spectrum can be deconvoluted into four components (Figure 5d). The most intense peaks observed at 284.4 and 285.7 eV are related to the C–C/C=C and sp3 carbon atoms or C–N bonds, respectively.4,5 It is worth noting that the C=N bond observed at 285.1 eV confirms the presence of N-GQDs in the resultant nanohybrid.53 Moreover, a relatively minor component occurred at 287.6 eV, which further indicates the significant reduction in oxygen-rich functionalities present in GO.20 As shown in Figure 5e, the high-resolution N 1s spectrum is deconvoluted into four components. The main peak centered at 394.7 eV is related to Mo 3p3/2, whereas the rest of the peaks noted at 396.6, 399.8, and 401.5 eV correspond to Mo–N, pyrolic-N, and graphitic-N, respectively. Therefore, the different types of C–N bond formation observed in the N 1s spectra confirm the successful incorporation of N-GQDs on the 3D MoS2–rGO framework.5,50,54
Figure 5.
High-resolution XPS spectra of (a) survey scan, (b) Mo 3d, (c) S 2p, and (d) C 1s and (e) N 1s core-level spectra of N-GQDs/MoS2–rGO.
The surface area and porosity of the MoS2–rGO and N-GQDs/MoS2–rGO nanohybrids were investigated using Brunauer–Emmett–Teller (BET) analysis (Figure 6). As shown in Figure 6a,b, both MoS2–rGO and N-GQDs/MoS2–rGO nanohybrids exhibit a typical type (IV) isotherm pattern, which indicates the mesoporous nature of the catalysts.55 The calculated BET surface areas of the MoS2–rGO and N-GQDs/MoS2–rGO nanohybrids are calculated to be 30.3 and 36.4 m2/g, respectively. The pore size distributions of the MoS2–rGO and N-GQDs/MoS2–rGO nanohybrids are estimated using the Barrett–Joyner–Halenda (BJH) method, as shown in the inset of Figure 6a,b. The average pore sizes of the MoS2–rGO and N-GQDs/MoS2–rGO nanohybrids are 3.1 and 6 nm, respectively. These results suggest that the incorporation of N-GQDs on MoS2–rGO using a hydrothermal method can enhance the surface area and the pore size of the resultant nanohybrid.55 The increased pore size of the N-GQD-loaded MoS2–rGO monohybrid is consistent with the FE-SEM image of the N-GQDs/MoS2–rGO nanohybrid (Figure 2b). Moreover, the increased surface area and pore size of the N-GQD-incorporated 3D MoS2–rGO framework can offer more catalytic active sites for effective electrochemical reactions.56
Figure 6.
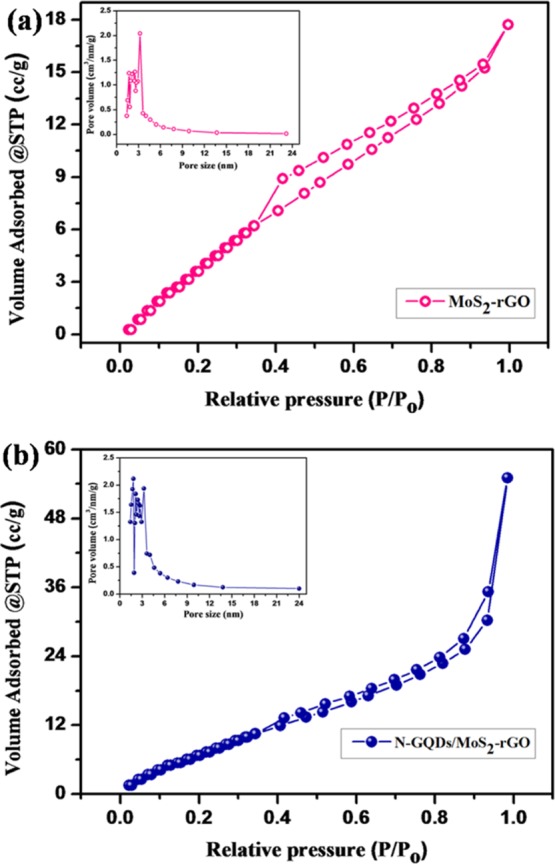
Nitrogen adsorption–desorption isotherms of (a) the MoS2–rGO nanohybrid and (b) the N-GQDs/MoS2–rGO nanohybrid and their respective pore size distributions (insets).
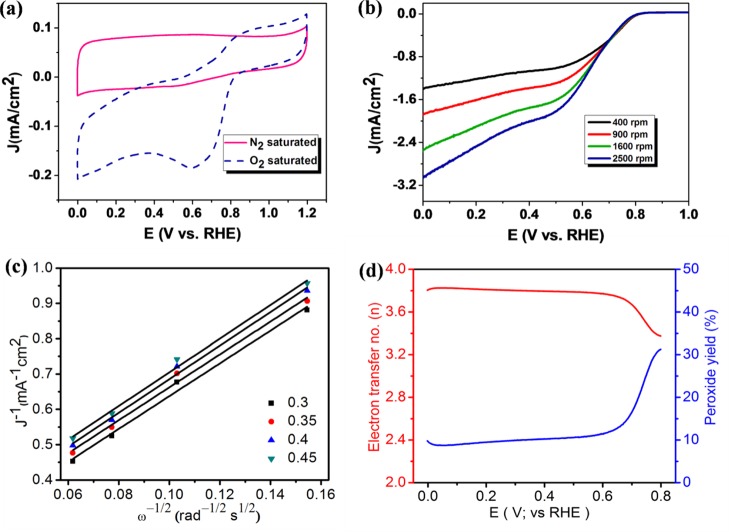
The electrocatalytic activity of the 3D N-GQDs/MoS2–rGO nanohybrid-modified electrode was investigated for ORR activity in 0.1 M KOH using the three-electrode system. Figure 7a shows the CVs observed for the N-GQDs/MoS2–rGO nanohybrid-modified electrode in N2- and O2-saturated 0.1 M KOH in the potential range of 0–1.2 V vs RHE. A featureless CV response occurred when the electrolyte solution was saturated with N2. By contrast, a strong cathodic reduction peak was observed under an O2-saturated environment, suggesting the electrocatalytic reduction of oxygen. As shown in Figure 7b, an increase in the current density with respect to the rotation speed is due to the enhanced diffusion of dissolved oxygen molecules through the porous channel of the 3D N-GQDs/MoS2–rGO nanohybrid-modified electrode.15 Moreover, the N-GQDs/MoS2–rGO nanohybrid catalyst exhibits the most positive ORR onset potential of +0.81 V vs RHE and a current density of 2.56 mA/cm2 at 1600 rpm (Figure 7b). In addition, the number of electrons transferred per oxygen molecule in the ORR process was also calculated using the Koutecky–Levich plot. A plot of J–1 vs ω–1/2 was obtained from the corresponding K–L equation (eq 1).22
| 1 |
where i is the measured current, ik is the kinetic current, id = Bω1/2 is the diffusion-limiting current, B is Levich constant, and ω is the rotational speed of the electrode (eq 2). Also
| 2 |
where n is the number of electrons transferred per O2 molecule, F is the Faraday constant (96 486 C mol–1), A is the geometric area of the working electrode, DO2 is the diffusion coefficient of the O2 molecule (1.9 × 10⁻⁵ cm2 s–1) in 0.1 M KOH, v is the kinematic viscosity of the electrolyte (1.9 × 10⁻⁵ cm2 s–1), and CO2 is the concentration of the O2 molecule (1.2 × 10⁻⁶ mol L–1).22,57
Figure 7.
(a) Cyclic voltammograms (CVs) obtained for the 3D N-GQDs/MoS2–rGO nanohybrid-modified electrode dipped into a N2- and O2-saturated 0.1 M KOH solution at a scan rate of 20 mV/s, (b) linear sweep voltammogram (LSV) obtained for the 3D N-GQDs/MoS2–rGO nanohybrid-modified electrode at a scan rate of 10 mV/s with different rotation speeds ranging from 400 to 2500 rpm, (c) Koutecky–Levich (K–L) plot for the 3D N-GQDs/MoS2–rGO-modified electrode with respect to various potentials, and (d) electron transfer number and peroxide yield for the 3D N-GQDs/MoS2–rGO nanohybrid at the whole potential range obtained from the rotating ring disc electrode (RRDE) voltammogram, as displayed in Figure S3.
Figure 7c shows the linear fitting, and the average number of electrons transferred (n) for N-GQDs/MoS2–rGO is calculated to be about two with different potential regions, indicating the typical two-electron transfer process. The number of electrons (n) transferred in the N-GQDs/MoS2–rGO nanohybrid can be obtained using a well-known procedure based on the RRDE assembly using the percentage of peroxide formation. As shown in Figure 7d, RRDE measurements are taken to deduce n, which is found to be between 3.2 and 3.8 in the potential region of 0.8–0 V vs RHE. On the other hand, the Koutecky–Levich approach suggests a two-electron transfer process for the N-GQDs/MoS2–rGO nanohybrid, indicating two different electron transfer mechanisms for ORR in the present case.
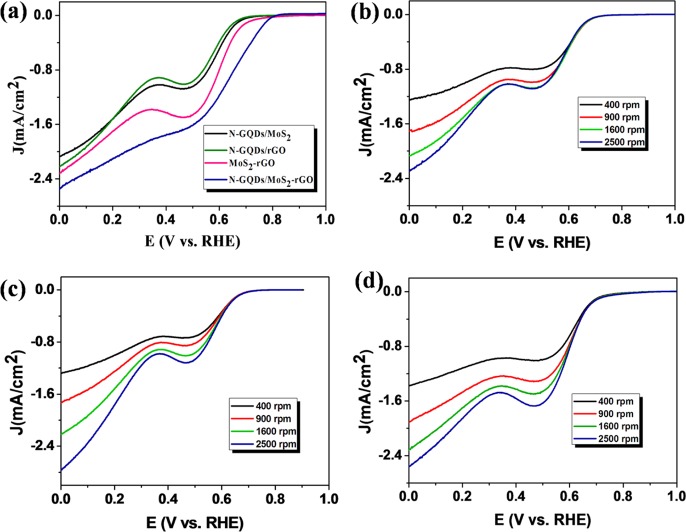
The comparative LSV curves of MoS2–rGO, N-GQDs/rGO, N-GQDs/MoS2, and N-GQDs/MoS2–rGO at the rotation speed of 1600 rpm are depicted in Figure 8a. Interestingly, the N-GQDs/MoS2–rGO nanohybrid exhibits an excellent ORR activity with the positive onset potential of +0.81 V along with the current density of 2.56 mA/cm2. On the basis of electrochemical results and chemical nature/functionalities of the N-GQDs and MoS2–rGO, the following explanation can be provided. In the present work, N-GQDs play a crucial role toward ORR. Electrochemically active sites on N-GQDs in conjunction with the network of MoS2–rGO furnish improved sites for oxygen adsorption and its conversion. This effect is also clearly seen in Figure 8a, where a positive shift in the onset potential, an improved mixed diffusion and kinetic current and diffusion-controlled region is achieved. Thus, a synergistic effect between N-GQDs and MoS2–rGO plays an important role in electrochemical activity. In addition, a larger surface area and pore size in the case of nanohybrid structures (Figure 6) can offer better catalytic active sites on the N-GQDs/MoS2–rGO nanohybrid for effective electrochemical reactions. Moreover, a few recent reports also suggest a synergistic effect in the 3D MoS2–rGO nanocomposite toward various catalytic processes.49,53 The LSV curves of MoS2–rGO-, N-GQDs/rGO-, and N-GQDs/MoS2-modified electrodes with different rotation speeds ranging from 400 to 2500 rpm are displayed in Figure 8b–d. As shown in Figure 8a–d, LSVs of all nanocomposites show two components, one at 0.1 V and another at 0.5 V. These two components are mainly due to a two-step ORR process. The comparison of electrocatalytic performance of some carbonaceous-based electrocatalysts for the ORR process is summarized in Table S1.
Figure 8.
(a) Comparative LSV curves of N-GQDs/MoS2-, N-GQDs/rGO-, MOS2–rGO-, and N-GQDs/MoS2–rGO-modified electrodes in the presence of O2-saturated 0.1 M KOH at 1600 rpm with a scan rate of 10 mV/s, LSV obtained for (b) N-GQDs/MoS2-, (c) N-GQDs/rGO-, and (d) MoS2–rGO electrocatalyst-modified electrode in the presence of O2-saturated 0.1 M KOH solution at various rotation speeds in the range of 400–2500 rpm.
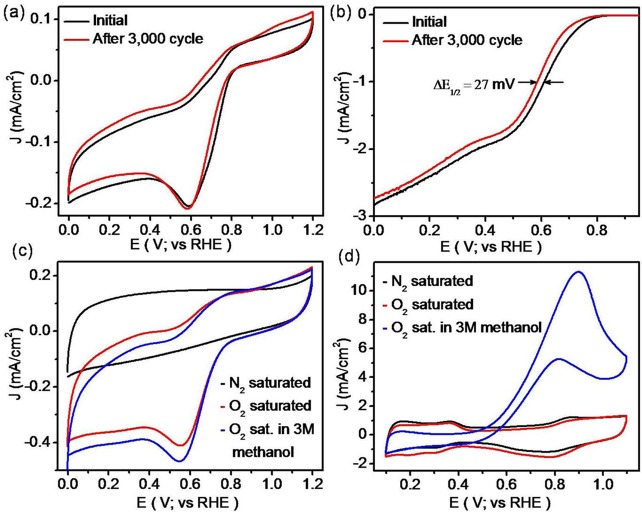
The stability of the N-GQDs/MoS2–rGO nanohybrid was evaluated for up to 3000 continuous cycles between −0.5 and −0.1 V (vs Ag/AgCl), at a scan rate of 20 mV/s in the O2-saturated 0.1 M KOH solution. The recorded comparative CVs and LSVs before and after the cycling tests are shown in Figure 9a,b, respectively. Importantly, the N-GQDs/MoS2–rGO nanohybrid shows no obvious change in its CV curve after 3000 cycles (Figure 9a). In addition, the N-GQDs/MoS2–rGO nanohybrid exhibits only a 27 mV deviation in the half-wave potential (E1/2) for up to 3000 cycles (Figure 9b). Thus, the observed results clearly reveal better stability of the N-GQDs/MoS2–rGO nanohybrid under alkaline conditions.
Figure 9.
(a) CVs of the N-GQDs/MoS2–rGO nanohybrid before and after 3000 cycles with a scan rate of 20 mV/s in the O2-saturated 0.1 M KOH solution and (b) ORR polarization curves of the N-GQDs/MoS2–rGO nanohybrid before and after 3000 cycles with a scan rate of 10 mV/s and rotation rate of 1600 rpm in the O2-saturated 0.1 KOH solution. Comparative CVs of (c) N-GQDs/MoS2–rGO and (d) commercial Pt/C catalyst in the presence and absence of 3 M methanol, with a sweep rate of 100 mV/s in 0.1 M KOH.
To determine the methanol tolerance ability of the resultant nanohybrid, ORR was performed at a high concentration of methanol (3.0 M) in 0.1 M KOH solution and compared with commercial Pt/C (20 wt %) under similar experimental conditions.1,58Figure 9c,d displays the electrocatalytic activity of the N-GQDs/MoS2–rGO nanohybrid and Pt/C in the presence and absence of methanol. As shown in Figure 9c, the N-GQDs/MoS2–rGO catalyst exhibits almost similar voltammograms with a strong cathodic peak even at a higher concentration of methanol (3.0 M), suggesting the excellent methanol tolerance property of the N-GQDs/MoS2–rGO nanohybrid. By contrast, Pt/C shows a substantial oxidation peak in the presence of methanol (3.0 M) under identical experimental conditions (Figure 9d). Thus, the N-GQDs/MoS2–rGO nanohybrid with selective electrocatalytic property toward ORR could be used to replace commercial Pt/C as a cathode catalyst in a direct methanol fuel cell.
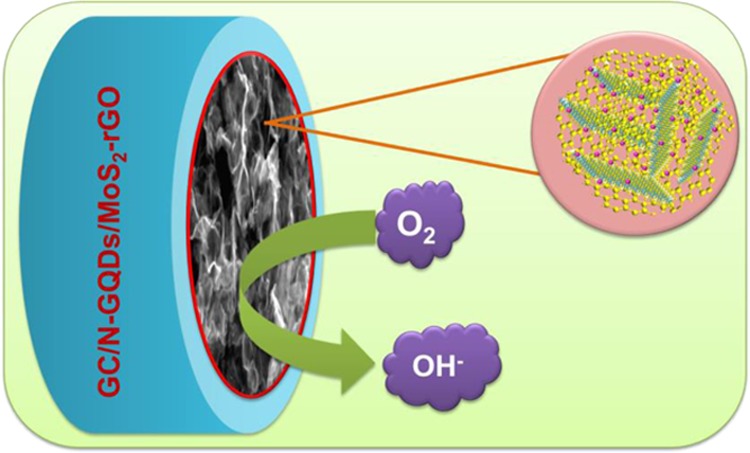
Scheme 2 represents the schematic illustration of the ORR process on the N-GQDs/MoS2–rGO nanohybrid-modified electrode. The 3D architecture of N-GQDs/MoS2–rGO with a highly porous structure provides more catalytic active sites to adsorb oxygen molecules. Thus, resulting in the better oxygen adsorption of the nanohybrid and the synergistic role of N-GQDs and MoS2–rGO enhanced the ORR activity.
Scheme 2. Schematic Representation of ORR on the N-GQDs/MoS2–rGO Nanohybrid-Modified Electrode.
3. Conclusions
A 3D N-GQDs/MoS2–rGO nanohybrid was developed and employed as an efficient electrocatalyst for ORR under an alkaline atmosphere. The different types of C–N bonds observed in the N 1s spectra confirmed the existence of N-GQDs on the N-GQDs/MoS2–rGO nanohybrid. Moreover, incorporation of N-GQDs on MoS2–rGO using the hydrothermal method increased the surface area and the pore size of the resultant nanohybrid. N-GQDs combined with MoS2–rGO synergistically enhanced the ORR performance, with a maximum positive onset potential of +0.81 V versus RHE. The resultant N-GQDs/MoS2–rGO showed better stability and an outstanding methanol tolerance property at a high concentration of methanol (3.0 M) to resist the methanol crossover effects in direct methanol fuel cells.
4. Experimental Details
4.1. Chemicals
Graphite powder (synthetic, conducting grade, 325 mesh, 99.99%) was procured from Alfa Aesar. Ammonium molybdate, thioacetamide, citric acid, and ethylenediamine were purchased from SRL Chemicals, India. All chemicals were used without further purification.
4.2. Synthesis of GO and N-GQDs
GO was synthesized from graphite flakes using the modified Hummers’ method.59 N-GQDs were prepared using a hydrothermal method.5 In brief, 1.68 g of citric acid and 1.44 g of ethylenediamine were mixed in 40 mL of DI water and stirred to get a clear solution. Then, the mixture was transferred into a 50 mL Teflon-lined autoclave and heated at 160 °C for 4 h. Finally, the product was collected through centrifugation and redispersed in DI water.
4.3. Synthesis of the N-GQD-Decorated 3D MoS2–rGO Nanohybrid
The 3D N-GQDs/MoS2–rGO nanohybrid was prepared via a simple hydrothermal method (Scheme 1). In brief, 40 mg of GO was first dispersed in 40 mL of DI water and ultrasonicated (Bath-type ultrasonicator, Labman-LMUC-25, operating frequency is 40 kHz, and the rated output power is 600 W) for 30 min to make a homogeneous dispersion. Subsequently, 106 mg of ammonium molybdate and 240 mg of thioacedamide were dissolved in 40 mL of DI water separately and stirred for 30 min. Then, the predispersed GO solution was slowly added into the above reaction mixture under constant stirring. Followed by GO addition, 1 mL of the as-synthesized N-GQDs predispersed in DI water was injected into the above reaction mixture and stirred for 10 min. Afterward, the solution was placed in a 100 mL Teflon-lined stainless steel autoclave and heated at 200 °C for 24 h in an electric hot air oven. Finally, the obtained fine black solids were washed several times with DI water followed by washing with ethanol and dried at 80 °C overnight. The resultant product was named the N-GQDs/MoS2–rGO nanohybrid. For comparison, MoS2–rGO, N-GQDs/MoS2, and N-GQDs/rGO were also synthesized under identical experimental conditions.
4.4. Characterization Studies
UV–vis absorption spectra were obtained using a Specord 200 plus spectrophotometer (Analytikjena, Germany). XRD analysis was performed using a PANaltical X’pert powder diffractometer using Cu Kα radiation (λ = 1.5418 Å). The surface morphology, elemental mapping, and analysis were examined by FE-SEM and EDX using an FEI Quanta FEG 200 high-resolution scanning electron microscope. HR-TEM images were recorded using a JEOL JEM 2100F transmission electron microscope. XPS measurements were obtained using a Shimadzu ESCA 3100, and the FT-IR spectra were recorded using an FTIR spectrophotometer (Agilent, Cary 660, USA). The surface area and the pore size of the resultant electrocatalyst were analyzed using a Quantachrome Nova-1000 surface analyzer.
4.5. Fabrication of a Modified Electrode and Electrochemical Studies
The N-GQDs/MoS2–rGO nanohybrid-modified glassy carbon (GC) electrode was fabricated as follows. Before the electrode modification, the GC electrode was polished with alumina slurry (0.05 micron). The N-GQDs/MoS2–rGO ink was prepared by homogeneously dispersing 5 mg of sample into 3 mL of 24% of isopropyl alcohol with 25 μL Nafion (5 wt%). Then, this mixture was ultrasonicated for 30 min under ice-cold conditions. Finally, 4 μL of the as-prepared ink was carefully dropped on the well-cleaned GC electrode surface and dried under an ethanol atmosphere. Before the electrochemical measurement, the electrolyte solution was purged with ultrapure N2 or O2 gas for up to 30 min to achieve the saturation condition.
Electrochemical measurements were performed using a CHI760E bipotentiostat workstation (CH Instruments, Inc., USA) with a typical three-electrode configuration using Pt wire and Ag/AgCl (saturated in KCl) and modified GC (geometric area 0.0707 cm2) as the counter, reference, and working electrodes, respectively. An aqueous solution of 0.1 M KOH was used as the electrolyte throughout all electrochemical measurements. Finally, all measurements were converted from Ag/AgCl to RHE (ERHE = EAg/AgCl + 0.998 V).22 The stability of the N-GQDs/MoS2–rGO nanohybrid was evaluated up to 3000 cycles with a scan rate of 10 mV/s and a rotation speed of 1600 rpm in 0.1 KOH solution. In the case of RRDE, the catalyst inks and electrodes were prepared in the same manner as above for RDE measurements, with the only difference in the amount of catalyst inks loaded on the disc electrode. In brief, 10 μL of catalyst inks was carefully dropped on the disc electrode (diameter of 4 mm). In the RRDE measurements, the electrode was scanned with a sweep rate of 10 mV/s, and the ring potential was fixed at 0.5 V vs Ag/AgCl. Equations 3 and 4 were used to calculate the peroxide (% HO2–) yield and the number of electrons transferred.
| 3 |
| 4 |
where ID is the disc current, Ir is the ring current, and N = 0.38 is the current collection efficiency of the Pt ring.
Acknowledgments
The authors gratefully acknowledge the Department of Science and Technology–Science and Engineering Research Board (DST-SERB), New Delhi, India (File No: EMR/2014/000645) and the Ministry of New and Renewable Energy (MNRE), New Delhi, India (File No: 103/239/2015-NT) for their financial support to carry out this research work.
Supporting Information Available
The Supporting Information is available free of charge on the ACS Publications website at DOI: 10.1021/acsomega.6b00275.
FE-SEM image of GO and MoS2, EDX spectra of N-GQDs/MoS2–rGO, RRDE voltammogram, LSV curve of the commercial Pt/C and N-GQDs/MoS2–rGO nanohybrid and comparison table for the carbaneous-based electrocatalysts for ORR studies (PDF)
The authors declare no competing financial interest.
Supplementary Material
References
- Li Y.; Zhao Y.; Cheng H.; Hu Y.; Shi G.; Dai L.; Qu L. Nitrogen-Doped Graphene Quantum Dots with Oxygen-Rich Functional Groups. J. Am. Chem. Soc. 2012, 134, 15–18. 10.1021/ja206030c. [DOI] [PubMed] [Google Scholar]
- Yang S.-T.; Cao L.; Luo P. G.; Lu F.; Wang X.; Wang H.; Meziani M. J.; Liu Y.; Qi G.; Sun Y.-P. Carbon Dots for Optical Imaging in Vivo. J. Am. Chem. Soc. 2009, 131, 11308–11309. 10.1021/ja904843x. [DOI] [PMC free article] [PubMed] [Google Scholar]
- Baker S. N.; Baker G. A. Luminescent Carbon Nanodots: Emergent Nanolights. Angew. Chem., Int. Ed. 2010, 49, 6726–6744. 10.1002/anie.200906623. [DOI] [PubMed] [Google Scholar]
- Qu D.; Zheng M.; Li J.; Xie Z.; Sun Z. Tailoring Color Emissions from N-Doped Graphene Quantum Dots for Bioimaging Applications. Light: Sci. Appl. 2015, 4, e364 10.1038/lsa.2015.137. [DOI] [Google Scholar]
- Qu D.; Zheng M.; Zhang L.; Zhao H.; Xie Z.; Jing X.; Haddad R. E.; Fan H.; Sun Z. Formation Mechanism and Optimization of Highly Luminescent N-Doped Graphene Quantum Dots. Sci. Rep. 2014, 4, 5294. 10.1038/srep05294. [DOI] [PMC free article] [PubMed] [Google Scholar]
- Liu W.-W.; Feng Y.-Q.; Yan X.-B.; Chen J.-T.; Xue Q.-J. Superior Micro-Supercapacitors Based on Graphene Quantum Dots. Adv. Funct. Mater. 2013, 23, 4111–4122. 10.1002/adfm.201203771. [DOI] [Google Scholar]
- Chao D.; Zhu C.; Xia X.; Liu J.; Zhang X.; Wang J.; Liang P.; Lin J.; Zhang H.; Shen Z. X.; Fan H. J. Graphene Quantum Dots Coated VO2 Arrays for Highly Durable Electrodes for Li and Na ion Batteries. Nano Lett. 2015, 15, 565–573. 10.1021/nl504038s. [DOI] [PubMed] [Google Scholar]
- Wang F.; Gu Z.; Lei W.; Wang W.; Xia X.; Hao Q. Graphene Quantum Dots as a Fluorescent Sensing Platform for Highly Efficient Detection of Copper(II) ions. Sens. Actuators, B 2014, 190, 516–522. 10.1016/j.snb.2013.09.009. [DOI] [Google Scholar]
- Saidi W. A. Oxygen Reduction Electrocatalysis using N-Doped Graphene Quantum-Dots. J. Phys. Chem. Lett. 2013, 4, 4160–4165. 10.1021/jz402090d. [DOI] [Google Scholar]
- Zhou X.; Tian Z.; Li J.; Ruan H.; Ma Y.; Yang Z.; Qu Y. Synergistically Enhanced Activity of Graphene Quantum Dot/Multi-Walled Carbon Nanotube Composites as Metal-Free Catalysts for Oxygen Reduction Reaction. Nanoscale 2014, 6, 2603–2607. 10.1039/c3nr05578g. [DOI] [PubMed] [Google Scholar]
- Kundu S.; Yadav R. M.; Narayanan T. N.; Shelke M. V.; Vajtai R.; Ajayan P. M.; Pillai V. K. Synthesis of N, F and S Co-Doped Graphene Quantum Dots. Nanoscale 2015, 7, 11515–11519. 10.1039/C5NR02427G. [DOI] [PubMed] [Google Scholar]
- Tang L.; Ji R.; Li X.; Teng K. S.; Lau S. P. Energy-Level Structure of Nitrogen-Doped Graphene Quantum Dots. J. Mater. Chem. C 2013, 1, 4908–4915. 10.1039/c3tc30877d. [DOI] [Google Scholar]
- Li Q.; Zhang S.; Dai L.; Li L.-S. Nitrogen-Doped Colloidal Graphene Quantum Dots and their Size-Dependent Electrocatalytic Activity for the Oxygen Reduction Reaction. J. Am. Chem. Soc. 2012, 134, 18932–18935. 10.1021/ja309270h. [DOI] [PubMed] [Google Scholar]
- Shinde D. B.; Vishal M. V.; Kurungot S.; Pillai V. K. Electrochemical Preparation of Nitrogen-Doped Graphene Quantum Dots and their Size-Dependent Electrocatalytic Activity for Oxygen Reduction. Bull. Mater. Sci. 2015, 38, 435–442. 10.1007/s12034-014-0834-3. [DOI] [Google Scholar]
- Fei H.; Ye R.; Ye G.; Gong Y.; Peng Z.; Fan X.; Samuel E. L. G.; Ajayan P. M.; Tour J. M. Boron- and Nitrogen-Doped Graphene Quantum Dots/Graphene Hybrid Nanoplatelets as Efficient Electrocatalysts for Oxygen Reduction. ACS Nano 2014, 8, 10837–10843. 10.1021/nn504637y. [DOI] [PubMed] [Google Scholar]
- Zhang B.; Xiao C.; Xiang Y.; Dong B.; Ding S.; Tang Y. Nitrogen-Doped Graphene Quantum Dots Anchored on Thermally Reduced Graphene Oxide as an Electrocatalyst for the Oxygen Reduction Reaction. ChemElectroChem 2016, 3, 864–870. 10.1002/celc.201600123. [DOI] [Google Scholar]
- Kamat P. V. Graphene-Based Nanoassemblies for Energy Conversion. J. Phys. Chem. Lett. 2011, 2, 242–251. 10.1021/jz101639v. [DOI] [Google Scholar]
- Seger B.; Kamat P. V. Electrocatalytically Active Graphene-Platinum Nanocomposites. Role of 2-D Carbon Support in PEM Fuel Cells. J. Phys. Chem. C 2009, 113, 7990–7995. 10.1021/jp900360k. [DOI] [Google Scholar]
- Vinodgopal K.; Neppolian B.; Lightcap I. V.; Grieser F.; Ashokkumar M.; Kamat P. V. Sonolytic Design of Graphene–Au Nanocomposites. Simultaneous and Sequential Reduction of Graphene Oxide and Au(III). J. Phys. Chem. Lett. 2010, 1, 1987–1993. 10.1021/jz1006093. [DOI] [Google Scholar]
- Babu S. G.; Vinoth R.; Kumar D. P.; Shankar M. V.; Chou H.-L.; Vinodgopal K.; Neppolian B. Influence of Electron Storing, Transferring and Shuttling Assets of Reduced Graphene Oxide at the Interfacial Copper Doped TiO2 p–n Heterojunction for Increased Hydrogen Production. Nanoscale 2015, 7, 7849–7857. 10.1039/C5NR00504C. [DOI] [PubMed] [Google Scholar]
- Babu S. G.; Vinoth R.; Neppolian B.; Dionysiou D. D.; Ashokkumar M. Diffused Sunlight Driven Highly Synergistic Pathway for Complete Mineralization of Organic Contaminants using Reduced Graphene Oxide Supported Photocatalyst. J. Hazard. Mater. 2015, 291, 83–92. 10.1016/j.jhazmat.2015.02.071. [DOI] [PubMed] [Google Scholar]
- Patil I. M.; Lokanathan M.; Kakade B. Three Dimensional Nanocomposite of Reduced Graphene Oxide and Hexagonal Boron Nitride as an Efficient Metal-Free Catalyst for Oxygen Electroreduction. J. Mater. Chem. A 2016, 4, 4506–4515. 10.1039/C6TA00525J. [DOI] [Google Scholar]
- Maliyekkal S. M.; Sreeprasad T. S.; Krishnan D.; Kouser S.; Mishra A. K.; Waghmare U. V.; Pradeep T. Graphene: A Reusable Substrate for Unprecedented Adsorption of Pesticides. Small 2013, 9, 273–283. 10.1002/smll.201201125. [DOI] [PubMed] [Google Scholar]
- Koushik D.; Gupta S. S.; Maliyekkal S. M.; Pradeep T. Rapid Dehalogenation of Pesticides and Organics at the Interface of Reduced Graphene Oxide–Silver Nanocomposite. J. Hazard. Mater. 2016, 308, 192–198. 10.1016/j.jhazmat.2016.01.004. [DOI] [PubMed] [Google Scholar]
- Jin H.; Huang H.; He Y.; Feng X.; Wang S.; Dai L.; Wang J. Graphene Quantum Dots Supported by Graphene Nanoribbons with Ultrahigh Electrocatalytic Performance for Oxygen Reduction. J. Am. Chem. Soc. 2015, 137, 7588–7591. 10.1021/jacs.5b03799. [DOI] [PubMed] [Google Scholar]
- Luo Z.; Yang D.; Qi G.; Shang J.; Yang H.; Wang Y.; Yuwen L.; Yu T.; Huang W.; Wang L. Microwave-Assisted Solvothermal Preparation of Nitrogen and Sulfur Co-Doped Reduced Graphene Oxide and Graphene Quantum Dots Hybrids for Highly Efficient Oxygen Reduction. J. Mater. Chem. A 2014, 2, 20605–20611. 10.1039/C4TA05096G. [DOI] [Google Scholar]
- Fan M.; Zhu C.; Yang J.; Sun D. Facile Self-Assembly N-Doped Graphene Quantum Dots/Graphene for Oxygen Reduction Reaction. Electrochim. Acta 2016, 216, 102–109. 10.1016/j.electacta.2016.09.014. [DOI] [Google Scholar]
- Niu W.-J.; Zhu R.-H.; Zeng H.-B.; Cosnier S.; Zhang X.-J.; Shan D. One-Pot Synthesis of Nitrogen-Rich Carbon Dots Decorated Graphene Oxide as Metal-Free Electrocatalyst for Oxygen Reduction Reaction. Carbon 2016, 109, 402–410. 10.1016/j.carbon.2016.08.002. [DOI] [Google Scholar]
- Kibsgaard J.; Chen Z.; Reinecke B. N.; Jaramillo T. F. Engineering the Surface Structure of MoS2 to Preferentially Expose Active Edge Sites for Electrocatalysis. Nat. Mater. 2012, 11, 963–969. 10.1038/nmat3439. [DOI] [PubMed] [Google Scholar]
- Wang T.; Gao D.; Zhuo J.; Zhu Z.; Papakonstantinou P.; Li Y.; Li M. Size-Dependent Enhancement of Electrocatalytic Oxygen-Reduction and Hydrogen-Evolution Performance of MoS2 Particles. Chem.—Eur. J. 2013, 19, 11939–11948. 10.1002/chem.201301406. [DOI] [PubMed] [Google Scholar]
- Kiran V.; Srinivasu K.; Sampath S. Morphology Dependent Oxygen Reduction Activity of Titanium Carbide: Bulk vs. Nanowires. Phys. Chem. Chem. Phys. 2013, 15, 8744–8751. 10.1039/c3cp50731a. [DOI] [PubMed] [Google Scholar]
- Zhou W.; Zhou K.; Hou D.; Liu X.; Li G.; Sang Y.; Liu H.; Li L.; Chen S. Three-Dimensional Hierarchical Frameworks Based on MoS2 Nanosheets Self-Assembled on Graphene Oxide for Efficient Electrocatalytic Hydrogen Evolution. ACS Appl. Mater. Interfaces 2014, 6, 21534–21540. 10.1021/am506545g. [DOI] [PubMed] [Google Scholar]
- Gopalakrishnan K.; Pramoda K.; Maitra U.; Mahima U.; Shah M. A.; Rao C. N. R. Performance of MoS2-Reduced Graphene Oxide Nanocomposites in Supercapacitors and in Oxygen Reduction Reaction. Nanomater. Energy 2015, 4, 9–17. 10.1680/nme.14.00024. [DOI] [Google Scholar]
- Huang G.; Chen T.; Chen W.; Wang Z.; Chang K.; Ma L.; Huang F.; Chen D.; Lee J. Y. Graphene-Like MoS2/Graphene Composites: Cationic Surfactant-Assisted Hydrothermal Synthesis and Electrochemical Reversible Storage of Lithium. Small 2013, 9, 3693–3703. 10.1002/smll.201300415. [DOI] [PubMed] [Google Scholar]
- Zhao B.; Wang Z.; Gao Y.; Chen L.; Lu M.; Jiao Z.; Jiang Y.; Ding Y.; Cheng L. Hydrothermal synthesis of layer-controlled MoS2/graphene composite aerogels for lithium-ion battery anode materials. Appl. Surf. Sci. 2016, 390, 209–215. 10.1016/j.apsusc.2016.08.078. [DOI] [Google Scholar]
- Gopalakrishnan D.; Damien D.; Shaijumon M. M. MoS2 Quantum Dot-Interspersed Exfoliated MoS2 Nanosheets. ACS Nano 2014, 8, 5297–5303. 10.1021/nn501479e. [DOI] [PubMed] [Google Scholar]
- Weng B.; Xu Y.-J. What if the Electrical Conductivity of Graphene Is Significantly Deteriorated for the Graphene–Semiconductor Composite-Based Photocatalysis?. ACS Appl. Mater. Interfaces 2015, 7, 27948–27958. 10.1021/acsami.5b10298. [DOI] [PubMed] [Google Scholar]
- Yan Y.; Sun S.; Song Y.; Yan X.; Guan W.; Liu X.; Shi W. Microwave-Assisted in Situ Synthesis of Reduced Graphene Oxide-BiVO4 Composite Photocatalysts and their Enhanced Photocatalytic Performance for the Degradation of Ciprofloxacin. J. Hazard. Mater. 2013, 250–251, 106–114. 10.1016/j.jhazmat.2013.01.051. [DOI] [PubMed] [Google Scholar]
- Chang K.; Mei Z.; Wang T.; Kang Q.; Ouyang S.; Ye J. MoS2/Graphene Cocatalyst for Efficient Photocatalytic H2 Evolution under Visible Light Irradiation. ACS Nano 2014, 8, 7078–7087. 10.1021/nn5019945. [DOI] [PubMed] [Google Scholar]
- Wei Z.; Pan R.; Hou Y.; Yang Y.; Liu Y. Graphene-Supported Pd Catalyst for Highly Selective Hydrogenation of Resorcinol to 1, 3-Cyclohexanedione through Giant π-Conjugate Interactions. Sci. Rep. 2015, 5, 15664. 10.1038/srep15664. [DOI] [PMC free article] [PubMed] [Google Scholar]
- Li H.; Yu K.; Li C.; Tang Z.; Guo B.; Lei X.; Fu H.; Zhu Z. Charge-Transfer Induced High Efficient Hydrogen Evolution of MoS2/Graphene Cocatalyst. Sci. Rep. 2015, 5, 18730. 10.1038/srep18730. [DOI] [PMC free article] [PubMed] [Google Scholar]
- Xie J.; Zhang J.; Li S.; Grote F.; Zhang X.; Zhang H.; Wang R.; Lei Y.; Pan B.; Xie Y. Controllable Disorder Engineering in Oxygen-Incorporated MoS2 Ultrathin Nanosheets for Efficient Hydrogen Evolution. J. Am. Chem. Soc. 2013, 135, 17881–17888. 10.1021/ja408329q. [DOI] [PubMed] [Google Scholar]
- Lin L.; Zhang S. Effective Solvothermal Deoxidization of Graphene Oxide using Solid Sulphur as a Reducing Agent. J. Mater. Chem. 2012, 22, 14385–14393. 10.1039/c2jm31940c. [DOI] [Google Scholar]
- Vinoth R.; Babu S. G.; Bahnemann D.; Neppolian B. Nitrogen Doped Reduced Graphene Oxide Hybrid Metal Free Catalyst for Effective Reduction of 4-Nitrophenol. Sci. Adv. Mater. 2015, 7, 1443–1449. 10.1166/sam.2015.2181. [DOI] [Google Scholar]
- Yang T.; Liu L.-h.; Liu J.-w.; Chen M.-L.; Wang J.-H. Cyanobacterium Metallothionein Decorated Graphene Oxide Nanosheets for Highly Selective Adsorption of Ultra-Trace Cadmium. J. Mater. Chem. 2012, 22, 21909–21916. 10.1039/c2jm34712a. [DOI] [Google Scholar]
- Vinoth R.; Karthik P.; Muthamizhchelvan C.; Ashokkumar M.; Neppolian B. Carrier Separation and Charge Transport Characteristics of Reduced Graphene Oxide Supported Visible-Light Active Photocatalysts. Phys. Chem. Chem. Phys. 2016, 18, 5179–5191. 10.1039/C5CP08041J. [DOI] [PubMed] [Google Scholar]
- Karade S. S.; Dubal D. P.; Sankapal B. R. MoS2 Ultrathin Nanoflakes for High Performance Supercapacitors: Room Temperature Chemical Bath Deposition (CBD). RSC Adv. 2016, 6, 39159–39165. 10.1039/C6RA04441G. [DOI] [Google Scholar]
- Hu C.; Liu Y.; Yang Y.; Cui J.; Huang Z.; Wang Y.; Yang L.; Wang H.; Xiao Y.; Rong J. One-Step Preparation of Nitrogen-Doped Graphene Quantum Dots from Oxidized Debris of Graphene Oxide. J. Mater. Chem. B 2013, 1, 39–42. 10.1039/C2TB00189F. [DOI] [PubMed] [Google Scholar]
- Zhao Y.; Kuai L.; Liu Y.; Wang P.; Arandiyan H.; Cao S.; Zhang J.; Li F.; Wang Q.; Geng B.; Sun H. Well-Constructed Single-Layer Molybdenum Disulfide Nanorose Cross-Linked by Three Dimensional-Reduced Graphene Oxide Network for Superior Water Splitting and Lithium Storage Property. Sci. Rep. 2015, 5, 8722. 10.1038/srep08722. [DOI] [PMC free article] [PubMed] [Google Scholar]
- Liu J.; Tang S.; Lu Y.; Cai G.; Liang S.; Wang W.; Chen X. Synthesis of Mo2N Nanolayer Coated MoO2 Hollow Nanostructures as High-Performance Anode Materials for Lithium-Ion Batteries. Energy Environ. Sci. 2013, 6, 2691–2697. 10.1039/c3ee41006d. [DOI] [Google Scholar]
- Shi Y.; Huang J.-K.; Jin L.; Hsu Y.-T.; Yu S. F.; Li L.-J.; Yang H. Y. Selective Decoration of Au Nanoparticles on Monolayer MoS2 Single Crystals. Sci. Rep. 2013, 3, 1839. 10.1038/srep01839. [DOI] [PMC free article] [PubMed] [Google Scholar]
- Tian W.; Zhang H.; Duan X.; Sun H.; Tade M. O.; Ang H. M.; Wang S. Nitrogen- and Sulfur-Codoped Hierarchically Porous Carbon for Adsorptive and Oxidative Removal of Pharmaceutical Contaminants. ACS Appl. Mater. Interfaces 2016, 8, 7184–7193. 10.1021/acsami.6b01748. [DOI] [PubMed] [Google Scholar]
- Dong H.; Liu C.; Ye H.; Hu L.; Fugetsu B.; Dai W.; Cao Y.; Qi X.; Lu H.; Zhang X. Three-Dimensional Nitrogen-Doped Graphene Supported Molybdenum Disulfide Nanoparticles as an Advanced Catalyst for Hydrogen Evolution Reaction. Sci. Rep. 2015, 5, 17542. 10.1038/srep17542. [DOI] [PMC free article] [PubMed] [Google Scholar]
- Zhou W.; Hou D.; Sang Y.; Yao S.; Zhou J.; Li G.; Li L.; Liu H.; Chen S. MoO2 Nanobelts@Nitrogen Self-Doped MoS2 Nanosheets as Effective Electrocatalysts for Hydrogen Evolution Reaction. J. Mater. Chem. A 2014, 2, 11358–11364. 10.1039/c4ta01898b. [DOI] [Google Scholar]
- Iturbe-Ek J.; Andrade-Martínez J.; Gómez R.; Rodríguez-González V. A Functional Assembly of SiO2 Nanospheres/Graphene Oxide Composites. Mater. Lett. 2015, 142, 75–79. 10.1016/j.matlet.2014.11.149. [DOI] [Google Scholar]
- Lai F.; Miao Y.-E.; Huang Y.; Zhang Y.; Liu T. Nitrogen-Doped Carbon Nanofiber/Molybdenum Disulfide Nanocomposites Derived from Bacterial Cellulose for High-Efficiency Electrocatalytic Hydrogen Evolution Reaction. ACS Appl. Mater. Interfaces 2016, 8, 3558–3566. 10.1021/acsami.5b06274. [DOI] [PubMed] [Google Scholar]
- Lai L.; Potts J. R.; Zhan D.; Wang L.; Poh C. K.; Tang C.; Gong H.; Shen Z.; Lin J.; Ruoff R. S. Exploration of the Active Center Structure of Nitrogen-Doped Graphene-Based Catalysts for Oxygen Reduction Reaction. Energy Environ. Sci. 2012, 5, 7936–7942. 10.1039/c2ee21802j. [DOI] [Google Scholar]
- Liu R.; Wu D.; Feng X.; Müllen K. Nitrogen-Doped Ordered Mesoporous Graphitic Arrays with High Electrocatalytic Activity for Oxygen Reduction. Angew. Chem. 2010, 122, 2619–2623. 10.1002/ange.200907289. [DOI] [PubMed] [Google Scholar]
- Hummers W. S.; Offeman R. E. Preparation of Graphitic Oxide. J. Am. Chem. Soc. 1958, 80, 1339. 10.1021/ja01539a017. [DOI] [Google Scholar]
Associated Data
This section collects any data citations, data availability statements, or supplementary materials included in this article.


