Abstract
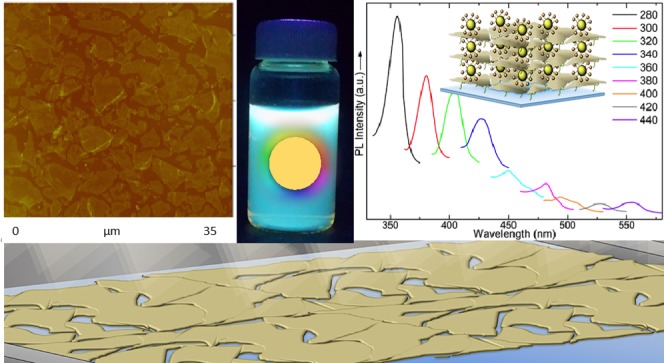
The special electronic, optical, thermal, and mechanical properties of graphene resulting from its 2D nature, as well as the ease of functionalizing it through a simple acid treatment, make graphene an ideal building block for the development of new hybrid nanostructures with well-defined dimensions and behavior. Such hybrids have great potential as active materials in applications such as gas storage, gas/liquid separation, photocatalysis, bioimaging, optoelectronics, and nanosensing. In this study, luminescent carbon dots (C-dots) were sandwiched between oxidized graphene sheets to form novel hybrid multilayer films. Our thin-film preparation approach combines self-assembly with the Langmuir–Schaefer deposition and uses graphene oxide nanosheets as template for grafting C-dots in a bidimensional array. Repeating the cycle results in a facile and low-cost layer-by-layer procedure for the formation of highly ordered hybrid multilayers, which were characterized by photoluminescence, UV–visible, X-ray photoelectron, and Raman spectroscopies, as well as X-ray diffraction and atomic force microscopy.
Introduction
Carbon dots (C-dots),1,2 which were serendipitously discovered during the purification of single-walled carbon nanotubes,3 have an almost spherical shape and sizes ranging from 10 nm to a few nanometers. Their good solubility, low cytotoxicity,4,5 great compatibility,6 efficient functionalization,7 and chemical passivity8 make them suitable for applications in bioimaging,4,9 photocatalysis,10 drug and gene delivery,11,12 optoelectronic devices,13,14 nanoprobes,15 and sensors.16,17 The C-dots can be synthesized by many methods, namely, laser ablation,18 microwave-assisted pyrolysis,19 thermal oxidation,20 arc discharge,3 electrochemical oxidation,21,22 ultrasonication,23 and combustion.24 Microwave-assisted pyrolysis, which was used in this study, is a preferable choice because of its low cost, facility, and efficiency. A remarkable property of C-dots is photoluminescence; however, the mechanism generating it is not yet well understood, but several potential origins have been suggested, such as surface passivation, surface groups, polyaromatic fluorophores, pairing of electrons and holes on the surface of the C-dot, differently sized nanoparticles, and structural defects.25,26
In this study, we aim at arranging C-dots in two-dimensional (2D) arrays. In fact, 2D materials have revealed outstanding and promising prospects in science and nanotechnology in the last years because of their unique properties in the fields of photonics, sensing, flexible electronics, and energy harvesting.27,28 Graphene, being a single-layered material with superior electronic, optical, thermal, and mechanical properties, is ideally suited for layer-by-layer (LbL) assembly. Novel functional materials29 with modified, optimized, or enhanced properties can be formed by constructing pillared structures, where graphene sandwiches a variety of guest moieties. Thus, the synthesis of a hybrid thin film, combining the properties of C-dots and graphene, is a great challenge for potential applications in the fields of sensing, catalysis, optoelectronics, and biomedicine.
There have already been several efforts in this direction; for instance, Datta et al.30 prepared a hybrid material combining chemically oxidized graphene (also known as graphene oxide, GO) and C-dots for bioimaging and cell-labeling applications. This material was synthesized via noncovalent interactions following a self-assembly (SA) path. The fluorescence of the C-dots was not majorly changed by the vicinity of GO, and their cytotoxicity remained at a relatively low level. Another example is the work of Zhang et al.,31 who synthesized a composite material via a direct assembly of C-dots on the layered double hydroxide (LDH) surface. This hybrid material is an excellent absorber of methyl blue, making it suitable for the removal of anionic organic dyes.
In this study, a facile and low-cost bottom-up LbL approach, which combines the Langmuir–Schaefer (LS) method with the SA technique, was used for the production of a new class of highly ordered C-dot intercalated graphene structures.32 This method uses GO nanosheets as platform for grafting C-dots in a 2D configuration and allows for perfect LbL growth.33 This precise control combined with the possibility to cover large substrates in a homogeneous manner makes the LB technique promising for preventing the aggregation of carbon-based nanostructures, such as fullerene derivatives or C-dots,34−36 in hybrid multilayers.
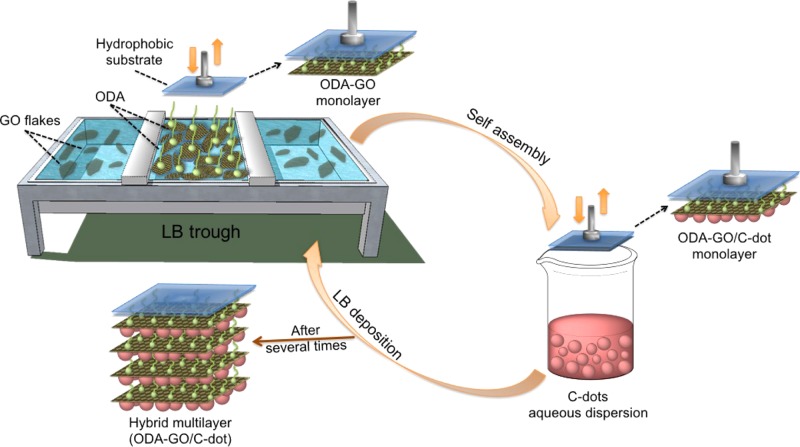
For our thin-film preparation approach, the C-dots (with a mean diameter of 4 nm) were produced by microwave-assisted pyrolysis,37 using citric acid, which acts as the carbon source, and urea, which offers hydrophilic amine groups on the surface of the C-dots. Suspensions of GO (prepared as described below) in ultrapure water were used as subphase in the Langmuir–Blodgett (LB) deposition system. As described in our previous work,32,38 spreading the long-chain molecule octadecylamine (ODA) on the water surface triggers the GO to covalently bond via the amide functionality. This results in the formation of a Langmuir film of ODA-GO on the water surface, the packing of which can be modified by applying an external pressure through the movable barrier of the LB apparatus. The hybrid Langmuir film was transferred to a hydrophobic support (hydrophobicity increases the transfer ratio) by horizontally lowering it (known as LS method) to touch the ODA-GO/water interface. After lifting the substrate again from the interface, it was lowered into an aqueous dispersion of C-dots to induce SA of the latter on the GO sheets. By repeating this cyclic procedure, hybrid multilayer films were fabricated and characterized by photoluminescence, UV–vis, X-ray photoelectron (XPS), and Raman spectroscopies, as well as X-ray diffraction (XRD) and atomic force microscopy (AFM).
Results and Discussion
Structural and Morphological Characterization of Pristine C-Dots
C-dots were synthesized by employing the microwave-assisted pyrolysis procedure applied by Qu et al.37 According to them, water-soluble luminescent C-dots decorated with terminal amine groups on the surface of the dots, exhibiting relative stable physicochemical and optical features, are obtained. A detailed characterization of the produced C-dots (including XRD, Fourier transform infrared (FT-IR), UV–vis, and XPS measurements, as well as optical images of their aqueous suspensions and films under UV light) confirms these conclusions and is presented in Supporting Information. PL spectra of the C-dot aqueous dispersions with excitation wavelengths from 300 to 460 nm are shown in Figure 1. These spectra are typical of C-dots7,18 exhibiting excitation-dependent photoluminescence with emission red-shifting from ∼425 up to ∼525 nm with increasing excitation wavelength. The maximum fluorescence intensity with emission at 447 nm is observed when the C-dots are excited at 360 nm. The broad emission bands, as well as the appearance of two distinctive peaks in Figure 1e spectrum or shoulders in other spectra, as at ∼500 nm in the case of Figure 1d, reveal the complicated mechanism of the C-dot fluorescence.39 The presence of various surface groups and traps leads to many dissimilar states, which can be involved in the emission process and thus also explains the excitation-dependent nature of the C-dot photoluminescence.39
Figure 1.
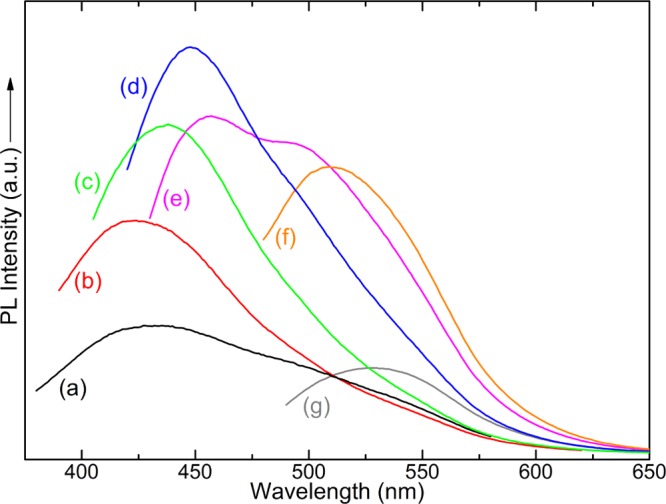
Photoluminescence spectra of C-dot aqueous dispersion. Excitation wavelengths: (a) 300 nm, (b) 320 nm, (c) 340 nm, (d) 360 nm, (e) 380 nm, (f) 400 nm, and (g) 460 nm.
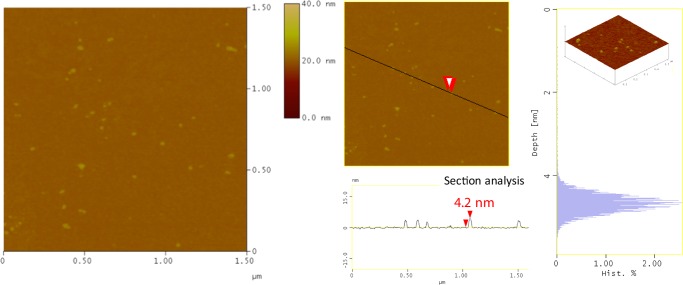
To image pristine C-dots, we adopted a deposition procedure, in which we first transferred a stearic acid Langmuir film on a Si wafer and then horizontally dipped it into the C-dot dispersion to induce SA (for details of the procedure, see Supporting Information). AFM images of such a stearic acid/C-dot hybrid monolayer are shown in Figure 2. Isolated and uniform particles are observed, confirming that combining the LS technique with SA34,35,40 avoids the aggregation of C-dots. From the topographical height profile (section analysis), the height of particles is found to be about 4.2 ± 0.2 nm, as derived, whereas their average height deduced from the depth-analysis histogram37 is 4.5 ± 0.2 nm.
Figure 2.
AFM topography images of a stearic acid/C-dot hybrid monolayer deposited on a Si wafer (section-analysis and depth-analysis histograms are included).
Structural Control and Characterization of Hybrid ODA-GO/C-Dot Monolayers
Π–a isotherms of ODA Langmuir films on pure water and on an aqueous GO dispersion (20 ppm) are shown in Figure 3 (all of the recorded Π–a isotherms at various concentrations of 5, 7, 15, 30, and 40 ppm are shown in Supporting Information). The curves show the change in the slope corresponding to the phase transitions of ODA-GO sheets from a 2D gas to a 2D liquid and then to a 2D solid during the compression process.32,41 In the absence of GO, the Π–a isotherm is a smoothly increasing curve with a liftoff area of 32.8 Å2. When adding a small amount of GO (0.02 mg mL–1) to the aqueous subphase, the liftoff area increases to 52 Å2, which demonstrates that the GO flakes stabilize the ODA layer32 through covalent grafting of the terminal amine groups of ODA to the epoxides of the GO sheets via nucleophilic substitution reactions.42−44 Finally, representative AFM images of hybrid ODA-GO layers deposited on Si wafer (see Supporting Information) at different surface pressures reveal the homogeneity of the produced monolayers and the precise control of the surface coverage.
Figure 3.
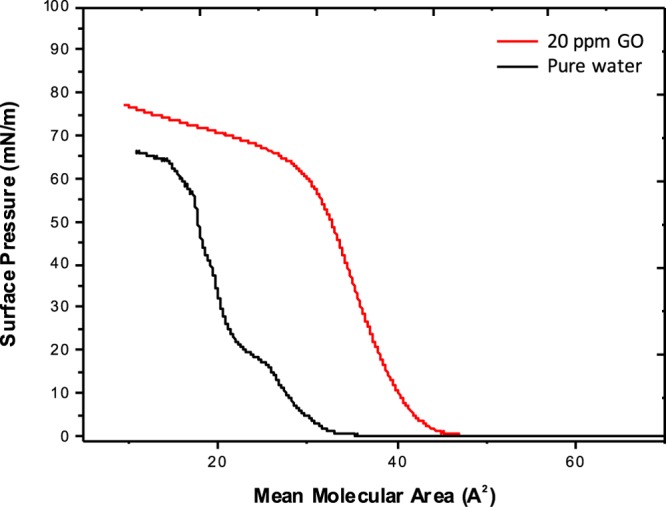
Π–a isotherms of ODA Langmuir films on pure water and on an aqueous dispersion of GO.
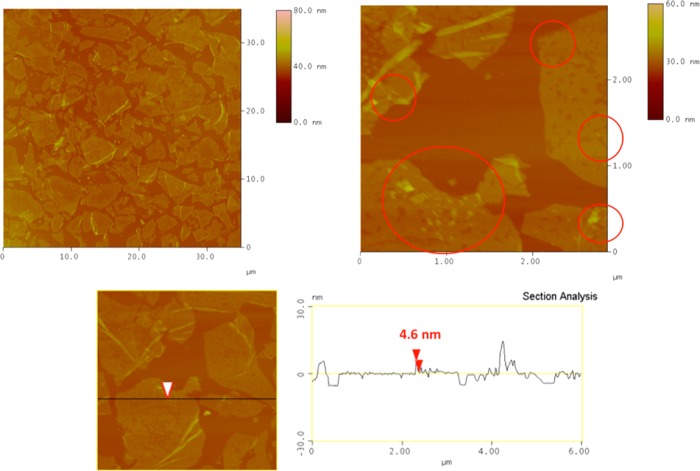
Representative AFM images of the first hybrid ODA-GO/C-dot monolayer deposited on Si wafer by combining the LS method with SA are presented in Figure 4. The topographic images show that the surface coverage of the substrate is quite high; GO layers with well-defined edges are almost contacting each other with small voids between them. This closely packed homogeneous array demonstrates the highly controllable formation of ODA-GO/C-dot hybrid layers.32 The average thickness of the flakes is 1.0–1.5 nm, as derived from the topographical height profile (section analysis), corresponding to the size of single GO layers,45 which is 6.1 Å. Moreover, uniform particles can be observed on top of the GO layers. The average size (section analysis) of these particles is 4.5–5.0 nm, corresponding to the exact size of the pristine C-dots (see Figure 2).
Figure 4.
AFM height images and section analysis of ODA-GO/C-dot hybrid monolayers deposited by combining the LS method with SA.
Raman spectra of ODA-GO/C-dot and ODA-GO hybrid monolayers deposited on Si wafer are presented in Figure 5. Both spectra display characteristic D- and G-bands associated with sp3 and sp2 hybridized carbon atoms, respectively.46,47 Because of the presence of ODA, the D-band intensity is significantly enhanced for the ODA-GO layer, which is also reflected in the ratio of the intensities of D-band to G-band (ID/IG) that is frequently used to express the degree of functionalization of graphene materials and amounts to 1.22. In contrast, ID/IG decreases to 1.04 when C-dots are added to the hybrid system, in agreement with the Raman spectrum of C-dots alone, where ID/IG = 0.95 (Figure S6). Both spectra exhibit three broad bands at ∼2700, ∼2930, and ∼3180 cm–1, which are linked to the 2D vibrational mode, D + D′ mode, and 2D′ mode, respectively.46−49 Although no shifting of the peaks is observed, the grafting of the C-dots enhances the intensity of the bands in the 2D region. We can therefore conclude that the change in ID/IG and the increase of intensity in the 2D region indicate the successful attachment of C-dots on the surface of ODA-GO and hence the formation of the ODA-GO/C-dot hybrid monolayer.
Figure 5.
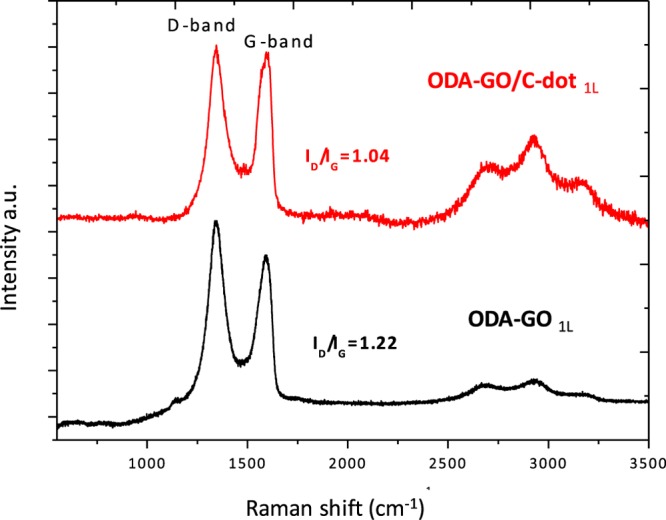
Raman spectra of ODA-GO and ODA-GO/C-dot hybrid monolayers.
Characterization of Graphene/C-Dot Hybrid Films
The XRD pattern of a 60-layer-thick graphene/C-dot hybrid multilayer compared to that of a ODA-GO/ODA hybrid multilayer constructed under the same conditions is shown in Figure 6. The graphene/C-dot hybrid multilayer shows the 001 diffraction peak below 2° (2θ), indicating the successful intercalation of C-dots between the organomodified GO sheets. Because this peak also partially overlaps with the (000) beam, we also report the spectrum, where a baseline was subtracted (see red line in Figure 6). The position of the 001 peak at 2θ = 1.7° corresponds to a d001-spacing of 52.0 ± 0.1 Å. The position of the 003 reflection peak at 5.1° confirms this result. The d001 value of 52.0 Å is much higher than the corresponding value of a hybrid organo-GO multilayer (d001 = 37.6 ± 0.1 Å), where instead of the C-dots, a second ODA molecule is grafted in the SA step. In fact, we propose that the hydrophilic terminal groups of C-dots interact with the first GO layer and simultaneously interpenetrate the flexible organic chains of ODA molecules covalently attached on the second GO layer (see inset).
Figure 6.
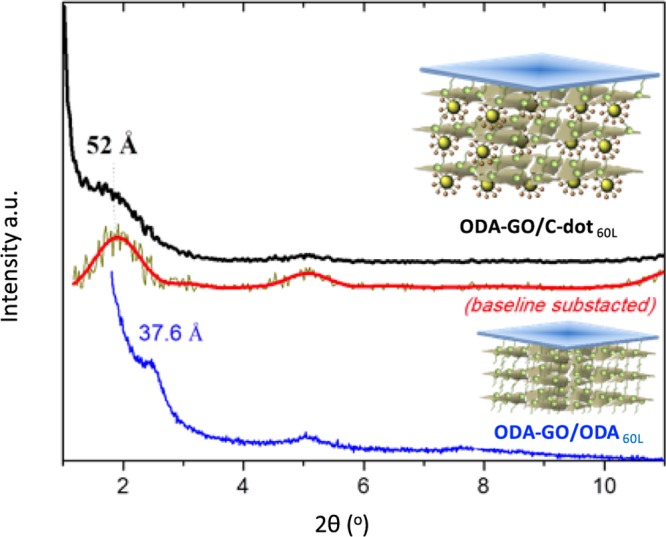
Comparison of XRD patterns of a 60-layer-thick ODA-GO/C-dot hybrid multilayer and a 60-layer-thick ODA-GO/ODA multilayer.
The C 1s core-level X-ray photoemission spectrum of a 60-layer-thick ODA-GO/C-dot hybrid multilayer is shown in Figure 7 and compared to the spectra of pristine bulk GO and of C-dots. The C 1s core-level X-ray photoemission spectrum of graphene oxide reveals the different oxygen functional groups emerging after the oxidation. More specifically, the contribution at 288.1 eV is due to carbonyl (C=O) groups and makes up 11.0% of the total carbon intensity; the peak due to epoxy (C–O–C) functional groups is located at 286.9 eV and contributes to 32.5% of the total carbon intensity. Two peaks centered at 285.5 and 289.1 eV stem from the C–O and C(O)O bonds and represent 34.5 and 17.8% of the total carbon 1s peak intensity, respectively. Additionally, one identifies the peak at 284.6 eV arising from the C–C and C–H bonds of the hexagonal lattice and accounting for 4.2% of the total carbon intensity. On the other hand, the C 1s photoelectron spectrum of C-dots comprises three peaks that are assigned to C–C and/or C–H bonds (66.7% of the total spectral intensity), C–O and/or C–N bonds (21.0%), and C=O bonds (12.3%). The spectrum of the hybrid multilayer consists of the following five components. The first peak at 284.6 eV is due to C–C and C–H bonds contributing only 6.9% to the total C 1s intensity. The main component at 285.6 eV (61.0%) is ascribed to the C–O and C–N bonds and arises from the hydroxyl moieties of both GO and C-dots as well as from the amine groups of ODA and C-dots. The third peak at 286.6 eV (11.8%) is assigned to the C–O–C epoxide/ether groups; this peak is significantly reduced compared with the GO photoelectron spectra due to the bond between the amine end groups of C-dots and the epoxy groups of GO. Finally, the peak at 287.7 eV (17.0%) represents the ketonic functionalities (C=O), and the smallest contribution (3.3%) at 288.9 eV comes from carboxyl groups (O–C=O). The high intensity of the C–O/C–N peak and the significant contribution of the carbonyl groups imply that the C-dots bear both oxygen- and nitrogen-containing surface functional groups, as confirmed by the FT-IR and XPS spectra of the pristine C-dots in Supporting Information.
Figure 7.
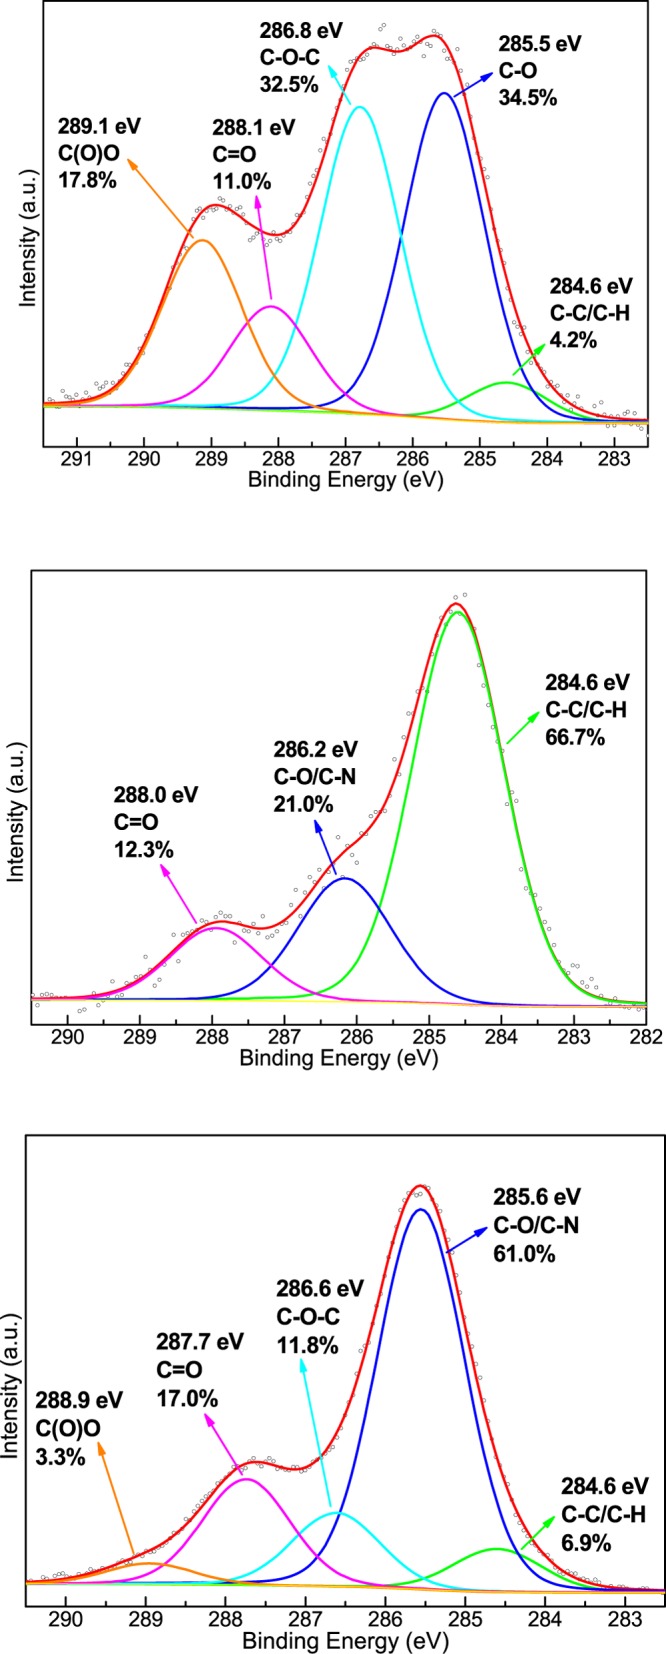
C 1s core-level X-ray photoemission spectra of GO (top panel), C-dots (middle panel), and graphene/C-dot hybrid multilayer (bottom panel).
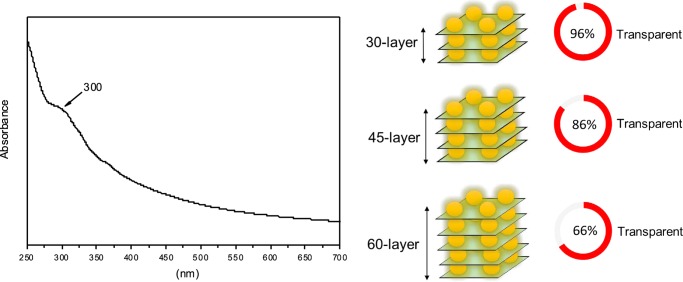
The UV–vis absorption spectrum of the 60-layer-thick ODA-GO/C-dot hybrid multilayer deposited on quartz substrates is presented in Figure 8 (left). It also shows an ascending absorption profile from lower to higher energies with a tiny absorption step at around 300 nm. The latter as well as the overall absorption characteristics of the material are correlated to the presence of C-dots in the interlayer space of the hybrid multilayer. Furthermore, the transparency can be controlled by adjusting the number of the deposited layers: a 30-layer film is 96% transparent at 550 nm, whereas the transparencies of 45- and 60-layer films decrease to 86 and 66%, respectively (Figure 8, right). These values are considerably higher than those of other graphene-based films reported in the literature.50−55
Figure 8.
UV–vis absorption spectrum of a 60-layer-thick ODA-GO/C-dot hybrid multilayer deposited on quartz (left), and transparencies (at 550 nm) for different thicknesses of the deposited hybrid layers (right).
As expected, the hybrid multilayers display photoluminescence because of the presence of C-dot. The PL spectra of the ODA-GO/C-dot hybrid multilayer collected with excitation wavelengths from 280 to 440 nm are shown in Figure 9. Once again, the excitation-dependent photoluminescence characteristic of C-dots is observed. As the excitation wavelength varies from 280 to 440 nm, emission shifts from ∼356 up to ∼555 nm. In contrast to the pristine C-dots, the maximum fluorescence intensity of the hybrid multilayer is observed when exciting at high energy (280 nm) and produces an emission peaked at 356 nm. Moreover, the emission peaks are significantly narrower compared to the peaks of the PL spectra of pristine C-dots. The latter two facts suggest that either only smaller C-dots were incorporated in the interlayer space of GO, as also suggested by the AFM analysis, or the interparticle interactions between C-dots are much smaller in the hybrid multilayer; of course, also both hypothesis could be true. In any case, the hybrid multilayers exhibit adjustable and high-quality photoluminescence with narrow emission lines.
Figure 9.
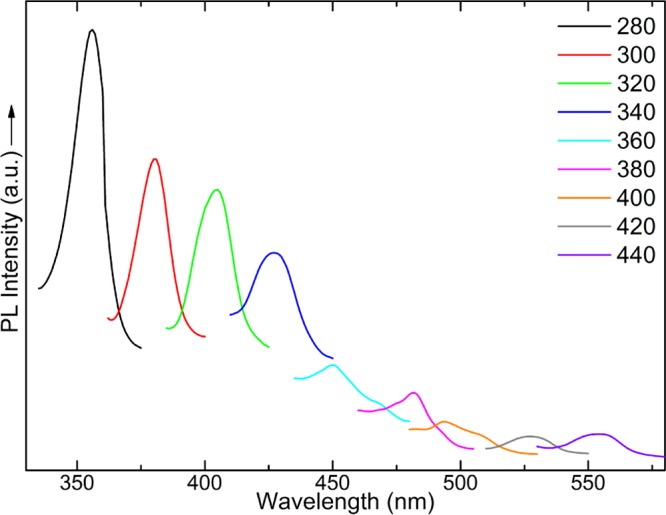
Photoluminescence spectra of the ODA-GO/C-dot hybrid multilayers with excitation wavelengths from 280 to 440 nm.
Furthermore, it is important to note that the ODA-GO/C-dot hybrid films do not appear to exhibit any PL quenching phenomena. This fact can be deduced by comparing the number of C-dots accessible by the PL excitation beam, with a 3 mm × 3 mm frontal area, in a 60-layer film to the number of C-dots accessed when the beam passes through the pristine C-dot aqueous dispersion, where the depth of the source-beam penetration is assumed 5 mm and all self-absorption effects have been excluded. Assuming that three C-dots are positioned on each graphene sheet, spaced 50 nm from each other in both directions, it can be estimated that the number of accessible C-dots is 216 × 109. On the contrary, if the beam accesses an aqueous dispersion of C-dots, where each C-dot has a mass density of 2 g/cm3 and a radius of 2.5 nm, and the dispersion was prepared as 0.15 g of C-dots/mL of H2O, the number of C-dots accessible by the beam is 2.2 × 10¹³. Thus, the number of C-dots interrogated in the ODA-GO/C-dot film is 100 times less than those being observed in the dispersion. Therefore, if the C-dots within the ODA-GO/C-dot suffered any PL quenching, their already lower concentration would not have provided such a strong PL signal. In fact, as recently reported by Vassilakopoulou et al.,56 C-dots encapsulated in MCM-41 continue to exhibit their PL signal without quenching while being protected by the matrix.
Conclusions
In summary, a low-cost and highly controllable LbL synthetic approach for the preparation of a new class of hybrid intercalated graphene structures is presented. A hybrid multilayer consisting of luminescent C-dots sandwiched between GO layers was successfully fabricated by combining the LS method with SA. This approach allows for a tunable coverage, uniformity over extended surface areas, and single-layer-level control of the assembly, as confirmed by Π–a isotherms and AFM. XRD measurements revealed the presence of the C-dots within graphene nanosheets and confirmed the highly ordered structure of the hybrid multilayer. We postulate that the hydrophilic terminal groups of C-dots interact with the GO layer above while at the same time being trapped within the flexible organic chains of the organic surfactant (ODA) that is covalently attached on a second GO layer below. The existence of C-dots in the hybrid multilayer system was corroborated by XPS, whereas Raman spectroscopy showed that the insertion of C-dots between the GO nanosheets left the electronic structure of GO unaffected. The transparency of the hybrid multilayers can be controlled by adjusting the number of deposited layers and is considerable higher than that of other graphene-based films reported in the literature. Finally, the hybrid multilayers exhibit adjustable and high-quality photoluminescence with narrow emission lines. The ODA-GO/C-dot multilayer constitutes a novel hybrid system suitable for being employed in diverse applications, such as nanoprobes, sensors, optoelectronic devices, and transparent electrodes, as well as in the fields of photocatalysis and drug delivery. Moreover, another potential application of the produced graphene/C-dot hybrid thin films is in light-emitting diodes (LEDs). Recently, Zhang et al.57 have fabricated a carbon-dot-based LED, where the color of the light emitted from the C-dots is voltage dependent, and with increasing bias, the emission peaks also became stronger.57 In our hybrid system, the use of graphene as a template could play an important role because the conductivity of graphene can enhance the voltage-dependent color emission of C-dots, favoring the development of colorful and brighter LEDs with multicolor single pixels.
Experimental Section
Materials
Citric acid (99%), urea (98%), ODA (99%), acetone, methanol, and ethanol were purchased from Sigma-Aldrich, whereas nitric acid (65%), sulfuric acid (95–97%), potassium chlorate, and powder graphite (purum, ≤0.2 mm) were acquired from Fluka. Ultrapure water (18.2 MΩ) was produced by a Millipore Simplicity system. The Si wafers (P/Bor, single-side polished, Si-Mat) and quartz substrates (Aldrich) were cleaned before use for 15 min in an ultrasonic bath with water, acetone, and ethanol. All reagents were of analytical grade and used without further purification.
Synthesis of GO
GO was produced from graphite using a modified Staudenmaier method.42,58−60 In a typical synthesis, 10 g of powdered graphite was added to a mixture of 400 mL of 95–97% H2SO4 and 200 mL of 65% HNO3, and the mixture was cooled in an ice–water bath. Powdered KClO3 (200 g) was added to the mixture in small portions under vigorous stirring and cooling in the ice–water bath. The reaction was quenched after 18 h by pouring the mixture into ultrapure water, and the oxidation product was washed until the pH reached 6.0. The above oxidation procedure was repeated two more times and finally the sample was dried at room temperature.
Synthesis of C-Dots
C-dots were synthesized using microwave-assisted pyrolysis.37 More specifically, 3 g of citric acid and 3 g of urea were dissolved in 10 mL of distilled deionized water to form a transparent solution. The solution was heated in a microwave oven (750 W, HOME, HMG23_8EL) for 5 min and subsequently heated in a drying oven at 65 °C overnight. A certain amount of water was added to the obtained solid, forming a dark brown aqueous dispersion, which was filtered to remove large particles. The C-dots were used immediately after the filtration or kept in dark for later use. It is noteworthy to mention that the C-dots are quite sensitive to light, as their color changes from dark orange to light orange, then yellow, and finally light yellow after a couple of weeks of exposure to light.
Preparation of Hybrid Graphene/C-Dot Multilayers
An LB trough (KSV 2000 NIMA Technology) was cleaned with ethanol and distilled deionized water. GO suspensions in ultrapure water (0.02 mg mL–1) were used as subphase, and a Pt Wilhelmy plate was employed to monitor the surface pressure during the compression and deposition procedures. For the formation of a GO film in the air–water interface, 200 μL of a 0.2 mg mL–1 ODA solution in chloroform/methanol (9:1 v/v) was spread onto the subphase using a microsyringe. After a waiting time of 20 min for the occurrence of solvent evaporation and the GO-surfactant functionalization, the hybrid ODA-GO layer was compressed at a rate of 5 mm min–1 until the target surface pressure of 20 mN m–1 was reached, forming a dense ODA-GO Langmuir layer.32 This pressure was maintained throughout the deposition process. The layers were transferred onto the hydrophobic substrates by the LS technique (horizontal dipping), with downward and lifting speeds of 10 and 5 mm min–1, respectively. After the transfer of the ODA-GO layer to substrates, the hybrid GO film was dipped into an aqueous dispersion of C-dots (0.2 mg mL–1) to induce the formation of a graphene/C-dot hybrid layer (ODA-GO/C-dot) by SA. A hybrid multilayer film was formed by repeating this cyclic procedure 60 times, as shown in Scheme 1. After each deposition step, the substrates were rinsed several times by dipping into ultrapure water (to remove any weakly attached cations or molecules that remained from the deposition steps) and dried with nitrogen flow (to avoid contaminating the aqueous dispersion in the LB trough and/or the C-dot dispersion32,41). Hydrophobic Si wafers and surfactant-treated quartz substrates (see Supporting Information for quartz modification) were used for the deposition of the hybrid films.
Scheme 1. Schematic Representation of the Synthetic Procedure for the Development of the Hybrid GO/C-Dot Multilayer Film.
Characterization Techniques
AFM images were collected in tapping mode with a Bruker Multimode 3D Nanoscope using a microfabricated silicon cantilever type TAP-300G, with a tip radius of <10 nm and a force constant of approximately 20–75 N m–1. Hybrid monolayers were deposited onto silicon wafers by combining the LS method with SA. Raman spectra were recorded on a Micro-Raman system RM 1000 RENISHAW using a laser excitation line at 532 nm. A 0.5–1 mW laser power was used with a 1 μm focus spot to avoid photodecomposition of the hybrid monolayers. XPS measurements were performed at a base pressure of 5 × 10⁻¹⁰ mbar in a SPECS GmbH spectrometer equipped with a monochromatic Mg Kα source (hv = 1253.6 eV) and a PHOIBOS 100 hemispherical analyzer. The energy resolution was set to 0.3 eV, and the photoelectron take-off angle was 45° with respect to the surface normal. All binding energies were referenced to the C 1s core level at 284.6 eV. The spectral analysis included a Shirley background subtraction and peak deconvolution employing mixed Gaussian–Lorentzian functions, in a least-squares curve-fitting program (WinSpec) developed at the Laboratoire Interdisciplinaire de Spectroscopie Electronique, University of Namur, Belgium. Hybrid multilayers were deposited onto silicon wafers by combining the LS method with SA, whereas the pristine samples (C-dots and GO) were deposited onto silicon wafers from aqueous dispersions by drop casting. XRD patterns of hybrid multilayers were collected on a D8 Avance Bruker diffractometer by using Cu Kα radiation (40 kV, 40 mA) and a secondary-beam graphite monochromator. The patterns were recorded in the 2θ range of 2–80°, in steps of 0.02°, and a counting time of 2 s per step. UV–vis spectra were recorded on a Shimadzu UV-2401PC two-beam spectrophotometer in the range of 200–800 nm, at a step of 0.5 nm, using the combination of deuterium and halogen lamps as the light source. The photoluminescence spectra were recorded on a Jobin Yvon Fluorolog 3 spectrofluorometer FL-11 employing a 450 W xenon lamp and a P928P photodetector. The slits were set to 5 nm. The photoluminescence spectra were corrected through the instrument-supplied files created from compounds with known quantum yields and specific for the Si photodetector. All optical UV–vis and PL spectra were recorded at room temperature either from hybrid thin films deposited on quartz substrates or using 10 mm path-length quartz cuvettes in the case of C-dot aqueous dispersions. For the photoluminescence spectra, the detector–source geometry was at 90° with respect to the sample, and for the photoluminescence measurements of the film, the quartz substrate was set in a reflective geometry. Infrared spectra covering the spectral range 400–4000 cm–1 were recorded on a Shimadzu FT-IR 8400 infrared spectrometer equipped with a deuterated triglycine sulfate detector. Each spectrum was the average of 128 scans collected at 2 cm–1 resolution. The C-dot samples were in the form of KBr pellets containing ca. 2 wt % of the materials.
Acknowledgments
This study was supported in part by the “Graphene-based electronics” research program of the Stichting voor Fundamenteel Onderzoek der Materie (FOM), part of the Nederlandse Organisatie voor Wetenschappelijk Onderzoek (NWO).
Supporting Information Available
The Supporting Information is available free of charge on the ACS Publications website at DOI: 10.1021/acsomega.7b00107.
Preparation of hydrophobic quartz substrates, deposition procedure for C-dot isolation, C-dot characterization (XRD, FT-IR, UV–vis, XPS) (PDF)
The authors declare no competing financial interest.
Supplementary Material
References
- Zhao A.; Chen Z.; Zhao C.; Gao N.; Ren J.; Qu X. Recent Advances in Bioapplications of C-Dots. Carbon 2015, 85, 309–327. 10.1016/j.carbon.2014.12.045. [DOI] [Google Scholar]
- Lim S. Y.; Shen W.; Gao Z. Carbon Quantum Dots and Their Applications. Chem. Soc. Rev. 2015, 44, 362–381. 10.1039/C4CS00269E. [DOI] [PubMed] [Google Scholar]
- Xu X.; Ray R.; Gu Y.; Ploehn H. J.; Gearheart L.; Raker K.; Scrivens W. A. Electrophoretic Analysis and Purification of Fluorescent Single-Walled Carbon Nanotube Fragments. J. Am. Chem. Soc. 2004, 126, 12736–12737. 10.1021/ja040082h. [DOI] [PubMed] [Google Scholar]
- Yang S.-T.; Cao L.; Luo P. G.; Lu F.; Wang X.; Wang H.; Meziani M. J.; Liu Y.; Qi G.; et al. Carbon Dots for Optical Imaging in Vivo. J. Am. Chem. Soc. 2009, 131, 11308–11309. 10.1021/ja904843x. [DOI] [PMC free article] [PubMed] [Google Scholar]
- Yang S.-T.; Wang X.; Wang H.; Lu F.; Luo P. G.; Cao L.; Meziani M. J.; Liu J.-H.; Liu Y.; et al. Carbon Dots as Nontoxic and High-Performance Fluorescence Imaging Agents. J. Phys. Chem. C 2009, 113, 18110–18114. 10.1021/jp9085969. [DOI] [PMC free article] [PubMed] [Google Scholar]
- Baker S. N.; Baker G. A. Luminescent Carbon Nanodots: Emergent Nanolights. Angew. Chem., Int. Ed. 2010, 49, 6726–6744. 10.1002/anie.200906623. [DOI] [PubMed] [Google Scholar]
- Dimos K. Carbon Quantum Dots: Surface Passivation and Functionalization. Curr. Org. Chem. 2016, 20, 682–695. 10.2174/1385272819666150730220948. [DOI] [Google Scholar]
- Zhai X.; Zhang P.; Liu C.; Bai T.; Li W.; Dai L.; Liu W. Highly Luminescent Carbon Nanodots by Microwave-Assisted Pyrolysis. Chem. Commun. 2012, 48, 7955–7957. 10.1039/c2cc33869f. [DOI] [PubMed] [Google Scholar]
- Chen B.; Li F.; Li S.; Weng W.; Guo H.; Guo T.; Zhang X.; Chen Y.; Huang T.; et al. Large Scale Synthesis of Photoluminescent Carbon Nanodots and Their Application for Bioimaging. Nanoscale 2013, 5, 1967–1971. 10.1039/c2nr32675b. [DOI] [PubMed] [Google Scholar]
- Qu D.; Zheng M.; Du P.; Zhou Y.; Zhang L.; Li D.; Tan H.; Zhao Z.; Xie Z.; et al. Highly Luminescent S, N Co-Doped Graphene Quantum Dots with Broad Visible Absorption Bands for Visible Light Photocatalysts. Nanoscale 2013, 5, 12272–12277. 10.1039/c3nr04402e. [DOI] [PubMed] [Google Scholar]
- Liu C.; Zhang P.; Zhai X.; Tian F.; Li W.; Yang J.; Liu Y.; Wang H.; Wang W.; et al. Nano-Carrier for Gene Delivery and Bioimaging Based on Carbon Dots with Pei-Passivation Enhanced Fluorescence. Biomaterials 2012, 33, 3604–3613. 10.1016/j.biomaterials.2012.01.052. [DOI] [PubMed] [Google Scholar]
- Song Y.; Shi W.; Chen W.; Li X.; Ma H. Fluorescent Carbon Nanodots Conjugated with Folic Acid for Distinguishing Folate-Receptor-Positive Cancer Cells from Normal Cells. J. Mater. Chem. 2012, 22, 12568–12573. 10.1039/c2jm31582c. [DOI] [Google Scholar]
- Guo X.; Wang C.-F.; Yu Z.-Y.; Chen L.; Chen S. Facile Access to Versatile Fluorescent Carbon Dots toward Light-Emitting Diodes. Chem. Commun. 2012, 48, 2692–2694. 10.1039/c2cc17769b. [DOI] [PubMed] [Google Scholar]
- Wang F.; Chen Y.-h.; Liu C.-y.; Ma D.-g. White Light-Emitting Devices Based on Carbon Dots’ Electroluminescence. Chem. Commun. 2011, 47, 3502–3504. 10.1039/c0cc05391k. [DOI] [PubMed] [Google Scholar]
- Zhi Y.; Zhaohui L.; Minghan X.; Yujie M.; Jing Z.; Yanjie S.; Feng G.; Hao W.; Liying Z. Controllable Synthesis of Fluorescent Carbon Dots and Their Detection Application as Nanoprobes. Nano-Micro Lett. 2013, 5, 247–259. 10.1007/BF03353756. [DOI] [Google Scholar]
- Wei W.; Xu C.; Ren J.; Xu B.; Qu X. Sensing Metal Ions with Ion Selectivity of a Crown Ether and Fluorescence Resonance Energy Transfer between Carbon Dots and Graphene. Chem. Commun. 2012, 48, 1284–1286. 10.1039/C2CC16481G. [DOI] [PubMed] [Google Scholar]
- Zhou L.; Lin Y.; Huang Z.; Ren J.; Qu X. Carbon Nanodots as Fluorescence Probes for Rapid, Sensitive, and Label-Free Detection of Hg2+ and Biothiols in Complex Matrices. Chem. Commun. 2012, 48, 1147–1149. 10.1039/C2CC16791C. [DOI] [PubMed] [Google Scholar]
- Sun Y.-P.; Zhou B.; Lin Y.; Wang W.; Fernando K. A. S.; Pathak P.; Meziani M. J.; Harruff B. A.; Wang X.; et al. Quantum-Sized Carbon Dots for Bright and Colorful Photoluminescence. J. Am. Chem. Soc. 2006, 128, 7756–7757. 10.1021/ja062677d. [DOI] [PubMed] [Google Scholar]
- Zhu H.; Wang X.; Li Y.; Wang Z.; Yang F.; Yang X. Microwave Synthesis of Fluorescent Carbon Nanoparticles with Electrochemiluminescence Properties. Chem. Commun. 2009, 5118–5120. 10.1039/b907612c. [DOI] [PubMed] [Google Scholar]
- Bourlinos A. B.; Stassinopoulos A.; Anglos D.; Zboril R.; Georgakilas V.; Giannelis E. P. Photoluminescent Carbogenic Dots. Chem. Mater. 2008, 20, 4539–4541. 10.1021/cm800506r. [DOI] [Google Scholar]
- Zhao Q.-L.; Zhang Z.-L.; Huang B.-H.; Peng J.; Zhang M.; Pang D.-W. Facile Preparation of Low Cytotoxicity Fluorescent Carbon Nanocrystals by Electrooxidation of Graphite. Chem. Commun. 2008, 5116–5118. 10.1039/b812420e. [DOI] [PubMed] [Google Scholar]
- Zhou J.; Booker C.; Li R.; Zhou X.; Sham T.-K.; Sun X.; Ding Z. An Electrochemical Avenue to Blue Luminescent Nanocrystals from Multiwalled Carbon Nanotubes (MWCNTS). J. Am. Chem. Soc. 2007, 129, 744–745. 10.1021/ja0669070. [DOI] [PubMed] [Google Scholar]
- Li H.; He X.; Liu Y.; Huang H.; Lian S.; Lee S.-T.; Kang Z. One-Step Ultrasonic Synthesis of Water-Soluble Carbon Nanoparticles with Excellent Photoluminescent Properties. Carbon 2011, 49, 605–609. 10.1016/j.carbon.2010.10.004. [DOI] [Google Scholar]
- Tian L.; Ghosh D.; Chen W.; Pradhan S.; Chang X.; Chen S. Nanosized Carbon Particles from Natural Gas Soot. Chem. Mater. 2009, 21, 2803–2809. 10.1021/cm900709w. [DOI] [Google Scholar]
- Georgakilas V.; Perman J. A.; Tucek J.; Zboril R. Broad Family of Carbon Nanoallotropes: Classification, Chemistry, and Applications of Fullerenes, Carbon Dots, Nanotubes, Graphene, Nanodiamonds, and Combined Superstructures. Chem. Rev. 2015, 115, 4744–4822. 10.1021/cr500304f. [DOI] [PubMed] [Google Scholar]
- Wang Y.; Hu A. Carbon Quantum Dots: Synthesis, Properties and Applications. J. Mater. Chem. C 2014, 2, 6921–6939. 10.1039/C4TC00988F. [DOI] [Google Scholar]
- Kaul A. B. Two-Dimensional Layered Materials: Structure, Properties, and Prospects for Device Applications. J. Mater. Res. 2014, 29, 348–361. 10.1557/jmr.2014.6. [DOI] [Google Scholar]
- Feng W.; Zhenxing W.; Qisheng W.; Fengmei W.; Lei Y.; Kai X.; Yun H.; Jun H. Synthesis, Properties and Applications of 2d Non-Graphene Materials. Nanotechnology 2015, 26, 292001 10.1088/0957-4484/26/29/292001. [DOI] [PubMed] [Google Scholar]
- Kouloumpis A.; Zygouri P.; Dimos K.; Gournis D.. Layer-by-Layer Assembly of Graphene-Based Hybrid Materials. In Functionalization of Graphene; Wiley-VCH Verlag GmbH & Co. KGaA, 2014; pp 359–400. [Google Scholar]
- Datta K. K. R.; Kozak O.; Ranc V.; Havrdova M.; Bourlinos A. B.; Safarova K.; Hola K.; Tomankova K.; Zoppellaro G.; et al. Quaternized Carbon Dot-Modified Graphene Oxide for Selective Cell Labelling - Controlled Nucleus and Cytoplasm Imaging. Chem. Commun. 2014, 50, 10782–10785. 10.1039/C4CC02637C. [DOI] [PubMed] [Google Scholar]
- Zhang M.; Yao Q.; Lu C.; Li Z.; Wang W. Layered Double Hydroxide–Carbon Dot Composite: High-Performance Adsorbent for Removal of Anionic Organic Dye. ACS Appl. Mater. Interfaces 2014, 6, 20225–20233. 10.1021/am505765e. [DOI] [PubMed] [Google Scholar]
- Kouloumpis A.; Spyrou K.; Dimos K.; Georgakilas V.; Rudolf P.; Gournis D. A Bottom-up Approach for the Synthesis of Highly Ordered Fullerene-Intercalated Graphene Hybrids. Front. Mater. 2015, 2, 10. 10.3389/fmats.2015.00010. [DOI] [Google Scholar]
- Gengler R. Y. N.; Gournis D.; Aimon A. H.; Toma L. M.; Rudolf P. The Molecularly Controlled Synthesis of Ordered Bi-Dimensional C60 Arrays. Chem. – Eur. J. 2012, 18, 7594–7600. 10.1002/chem.201103528. [DOI] [PubMed] [Google Scholar]
- Bourlinos A. B.; Georgakilas V.; Bakandritsos A.; Kouloumpis A.; Gournis D.; Zboril R. Aqueous-Dispersible Fullerol-Carbon Nanotube Hybrids. Mater. Lett. 2012, 82, 48–50. 10.1016/j.matlet.2012.05.026. [DOI] [Google Scholar]
- Bourlinos A. B.; Bakandritsos A.; Kouloumpis A.; Gournis D.; Krysmann M.; Giannelis E. P.; Polakova K.; Safarova K.; Hola K.; et al. Gd(iii)-Doped Carbon Dots as a Dual Fluorescent-Mri Probe. J. Mater. Chem. 2012, 22, 23327–23330. 10.1039/c2jm35592b. [DOI] [Google Scholar]
- Bourlinos A. B.; Karakassides M. A.; Kouloumpis A.; Gournis D.; Bakandritsos A.; Papagiannouli I.; Aloukos P.; Couris S.; Hola K.; et al. Synthesis, Characterization and Non-Linear Optical Response of Organophilic Carbon Dots. Carbon 2013, 61, 640–643. 10.1016/j.carbon.2013.05.017. [DOI] [Google Scholar]
- Qu S.; Wang X.; Lu Q.; Liu X.; Wang L. A Biocompatible Fluorescent Ink Based on Water-Soluble Luminescent Carbon Nanodots. Angew. Chem., Int. Ed. 2012, 51, 12215–12218. 10.1002/anie.201206791. [DOI] [PubMed] [Google Scholar]
- Gengler R. Y. N.; Toma L. M.; Pardo E.; Lloret F.; Ke X. X.; Van Tendeloo G.; Gournis D.; Rudolf P. Prussian Blue Analogues of Reduced Dimensionality. Small 2012, 8, 2532–2540. 10.1002/smll.201200517. [DOI] [PubMed] [Google Scholar]
- Arcudi F.; Đorđević L.; Prato M. Synthesis, Separation, and Characterization of Small and Highly Fluorescent Nitrogen-Doped Carbon Nanodots. Angew. Chem. 2016, 128, 2147–2152. 10.1002/ange.201510158. [DOI] [PubMed] [Google Scholar]
- Bourlinos A. B.; Trivizas G.; Karakassides M. A.; Baikousi M.; Kouloumpis A.; Gournis D.; Bakandritsos A.; Hola K.; Kozak O.; et al. Green and Simple Route toward Boron Doped Carbon Dots with Significantly Enhanced Non-Linear Optical Properties. Carbon 2015, 83, 173–179. 10.1016/j.carbon.2014.11.032. [DOI] [Google Scholar]
- Michopoulos A.; Kouloumpis A.; Gournis D.; Prodromidis M. I. Performance of Layer-by-Layer Deposited Low Dimensional Building Blocks of Graphene-Prussian Blue onto Graphite Screen-Printed Electrodes as Sensors for Hydrogen Peroxide. Electrochim. Acta 2014, 146, 477–484. 10.1016/j.electacta.2014.09.031. [DOI] [Google Scholar]
- Gengler R. Y. N.; Veligura A.; Enotiadis A.; Diamanti E. K.; Gournis D.; Jozsa C.; van Wees B. J.; Rudolf P. Large-Yield Preparation of High-Electronic-Quantity Graphene by a Langmuir-Schaefer Approach. Small 2010, 6, 35–39. 10.1002/smll.200901120. [DOI] [PubMed] [Google Scholar]
- Bourlinos A. B.; Gournis D.; Petridis D.; Szabo T.; Szeri A.; Dekany I. Graphite Oxide: Chemical Reduction to Graphite and Surface Modification with Primary Aliphatic Amines and Amino Acids. Langmuir 2003, 19, 6050–6055. 10.1021/la026525h. [DOI] [Google Scholar]
- Dreyer D. R.; Park S.; Bielawski C. W.; Ruoff R. S. The Chemistry of Graphene Oxide. Chem. Soc. Rev. 2010, 39, 228–240. 10.1039/B917103G. [DOI] [PubMed] [Google Scholar]
- Dekany I.; Kruger-Grasser R.; Weiss A. Selective Liquid Sorption Properties of Hydrophobized Graphite Oxide Nanostructures. Colloid Polym. Sci. 1998, 276, 570–576. 10.1007/s003960050283. [DOI] [Google Scholar]
- Ferrari A. C.; Meyer J. C.; Scardaci V.; Casiraghi C.; Lazzeri M.; Mauri F.; Piscanec S.; Jiang D.; Novoselov K. S.; et al. Raman Spectrum of Graphene and Graphene Layers. Phys. Rev. Lett. 2006, 97, 187401 10.1103/PhysRevLett.97.187401. [DOI] [PubMed] [Google Scholar]
- Torrisi F.; Hasan T.; Wu W.; Sun Z.; Lombardo A.; Kulmala T. S.; Hsieh G.-W.; Jung S.; Bonaccorso F.; et al. Inkjet-Printed Graphene Electronics. ACS Nano 2012, 6, 2992–3006. 10.1021/nn2044609. [DOI] [PubMed] [Google Scholar]
- Cançado L. G.; Jorio A.; Ferreira E. H. M.; Stavale F.; Achete C. A.; Capaz R. B.; Moutinho M. V. O.; Lombardo A.; Kulmala T. S.; et al. Quantifying Defects in Graphene Via Raman Spectroscopy at Different Excitation Energies. Nano Lett. 2011, 11, 3190–3196. 10.1021/nl201432g. [DOI] [PubMed] [Google Scholar]
- Martins Ferreira E. H.; Moutinho M. V. O.; Stavale F.; Lucchese M. M.; Capaz R. B.; Achete C. A.; Jorio A. Evolution of the Raman Spectra from Single-, Few-, and Many-Layer Graphene with Increasing Disorder. Phys. Rev. B 2010, 82, 125429 10.1103/PhysRevB.82.125429. [DOI] [Google Scholar]
- Fan T.-J.; Yuan C.-Q.; Tang W.; Tong S.-Z.; Liu Y.-D.; Huang W.; Min Y.-G.; Arthur J. E. A Novel Method of Fabricating Flexible Transparent Conductive Large Area Graphene Film. Chin. Phys. Lett. 2015, 32, 076802 10.1088/0256-307X/32/7/076802. [DOI] [Google Scholar]
- He L.; Tjong S. C. Aqueous Graphene Oxide-Dispersed Carbon Nanotubes as Inks for the Scalable Production of All-Carbon Transparent Conductive Films. J. Mater. Chem. C 2016, 4, 7043–7051. 10.1039/C6TC01224H. [DOI] [Google Scholar]
- Lin X.; Jia J.; Yousefi N.; Shen X.; Kim J.-K. Excellent Optoelectrical Properties of Graphene Oxide Thin Films Deposited on a Flexible Substrate by Langmuir-Blodgett Assembly. J. Mater. Chem. C 2013, 1, 6869–6877. 10.1039/c3tc31497a. [DOI] [Google Scholar]
- Su R.; Sun W. F.; Tian C.; Huang W. M.; Lin S. F.; Chen D. Q.; Chen G. H. An Edge-Decorated Submicron Reduced Graphite Oxide Nanoflake and Its Composites with Carbon Nanotubes for Transparent Conducting Films. RSC Adv. 2015, 5, 46785–46789. 10.1039/C5RA02704G. [DOI] [Google Scholar]
- Zheng Q.; Li Z.; Yang J.; Kim J.-K. Graphene Oxide-Based Transparent Conductive Films. Prog. Mater. Sci. 2014, 64, 200–247. 10.1016/j.pmatsci.2014.03.004. [DOI] [Google Scholar]
- Zheng Q.; Zhang B.; Lin X.; Shen X.; Yousefi N.; Huang Z.-D.; Li Z.; Kim J.-K. Highly Transparent and Conducting Ultralarge Graphene Oxide/Single-Walled Carbon Nanotube Hybrid Films Produced by Langmuir-Blodgett Assembly. J. Mater. Chem. 2012, 22, 25072–25082. 10.1039/c2jm34870e. [DOI] [Google Scholar]
- Vassilakopoulou A.; Georgakilas V.; Vainos N.; Koutselas I. Successful Entrapment of Carbon Dots within Flexible Free-Standing Transparent Mesoporous Organic-Inorganic Silica Hybrid Films for Photonic Applications. J. Phys. Chem. Solids 2017, 103, 190–196. 10.1016/j.jpcs.2016.12.027. [DOI] [Google Scholar]
- Zhang X.; Zhang Y.; Wang Y.; Kalytchuk S.; Kershaw S. V.; Wang Y.; Wang P.; Zhang T.; Zhao Y.; et al. Color-Switchable Electroluminescence of Carbon Dot Light-Emitting Diodes. ACS Nano 2013, 7, 11234–11241. 10.1021/nn405017q. [DOI] [PubMed] [Google Scholar]
- Liaros N.; Tucek J.; Dimos K.; Bakandritsos A.; Andrikopoulos K. S.; Gournis D.; Zboril R.; Couris S. The Effect of the Degree of Oxidation on Broadband Nonlinear Absorption and Ferromagnetic Ordering in Graphene Oxide. Nanoscale 2016, 8, 2908–2917. 10.1039/C5NR07832F. [DOI] [PubMed] [Google Scholar]
- Stergiou D. V.; Diamanti E. K.; Gournis D.; Prodromidis M. I. Comparative Study of Different Types of Graphenes as Electrocatalysts for Ascorbic Acid. Electrochem. Commun. 2010, 12, 1307–1309. 10.1016/j.elecom.2010.07.006. [DOI] [Google Scholar]
- Staudenmaier L. Verfahren Zur Darstellung Der Graphitsaure. Ber. Dtsch. Chem. Ges. 1898, 31, 1481. 10.1002/cber.18980310237. [DOI] [Google Scholar]
Associated Data
This section collects any data citations, data availability statements, or supplementary materials included in this article.


