Abstract
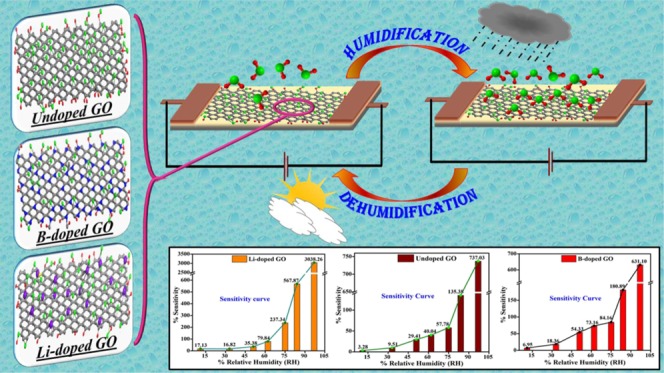
Nowadays, humidity sensors have become essential in numerous applications. However, there are several problems while using them for humidity detection, such as low sensitivity, delayed response and recovery times, less stability, and narrow humidity detection ranges. Here, we demonstrate for the first time a highly sensitive chemiresistive sensor for low-level humidity detection in ambient atmosphere by introducing graphene oxide (GO) and doped GO (Li-doped GO and B-doped GO) as a thin film in a facile manner. The sensitivity, repeatability, and stability studies show that thin film-based fabricated humidity sensors are unprecedently efficient in the detection of different percentages of humidity from 11 to 97% at room temperature. The incorporation of doping into GO induces a dramatic change in the sensing behavior of the base film (undoped GO). This allows the sensor to be used in a variety of applications such as humidity sensing, which we validate through our experiment with a “cheap and readily available” recognition system.
1. Introduction
Sensors act as an automated device to make a correlation between the digital and physical worlds, having a unique performance that can create new applications and ways for better operator interaction.1 Several types of sensors are used to explain and solve numerous problems in electronic devices such as temperature sensor, gas sensor, touch sensor, light sensor, and humidity sensor.
Portable, reliable, and low-cost humidity sensors play an important role in our day-to-day life, including industry, agriculture, environmental fields,2 and medical devices.3 To maintain an optimal environment, it is essential to have a suitable humidity sensor that can detect and control the ambient environment under different conditions including the rise and fall of temperature or mixtures of various gases precisely and providently.4 Generally, humidity is measured in two ways: it is measured by a change in resistance with respect to the variation in relative humidity (RH) (resistive-type humidity sensor) or it is measured by capacitance variation due to RH (capacitive-type humidity sensor). Resistive-type humidity sensors are used generally for conductive sensing materials and highly moisture-sensitive materials. On the other hand, capacitive humidity sensors are used for nonconducting materials. So far, a lot of efforts have been made to develop high-performance humidity sensors using various transduction techniques such as capacitance,5 resistance,6 optical fiber,7 and various electronic devices.8−10 Furthermore, several kinds of sensing materials have been used in humidity sensors, such as polymers,11 metal oxide,12 carbon nanotubes,13 and composites,14,15 but they have their own advantages and specific conditions of application. Some researchers have also used N-doped carbon spheres dispersed with a cationic surfactant in poly(vinyl alcohol) matrix sensors, which present an exponential dependence of the conductance on RH (RH varies from 9 to 97%), with the conductance varying 4 orders of magnitude with varying RH.16 Also, graphene oxide (GO) has aroused tremendous interest for various sensing applications mainly due to its wide accessibility, ease of synthesis and solution processability, high chemical stability, and adaptable properties.17 GO has also proven to be a potential candidate for water purification and humidity sensors.18 Generally, these electrical-type GO-based humidity sensors exhibit low conductivity because of the interruption of the conjugated electronic state in GO and are less moisture sensitive in nature. Conductivity may be partially restored by using reduced GO (rGO), but it is far behind that of pristine graphene.19 Therefore, developing a novel humidity sensor based on GO by using its unique structure and chemical properties while avoiding its drawback is highly desired.20 Researchers have found better sensitivity and response and recovery times for GO as a capacitive-type sensor but not as a resistive-type sensor. Moreover, these sensors are quite expensive and not readily available. Therefore, to overcome this problem, our main aim is to modify GO with lithium (Li) and boron (B) doping. We think that a small amount (<1%) of Li and B insertion as dopant or impurity can change various properties such as moisture sensitivity, reliability, and conductivity of the materials. However, for Li-doped and B-doped GO, information about the effect of doping toward the humidity sensor is scarce. Till now, a few reports in the literature have been found on the use of Li-doped and B-doped graphene on some applications21−23 but none on humidity sensors.
Therefore, we presume that the present research can answer these questions, clarifying the effect of Li and B doping (<1% of dopant) on GO and stimulating new experimental research about the suitability of doped GO for resistive-type humidity sensors in terms of better sensitivity and low response time. Thus, in this paper, we have mainly focused on humidity on a single analyte. Therefore, in this research, we try to explore its potential for future humidity-sensing applications.
2. Results and Discussion
Fourier transform infrared (FTIR) spectra of GO, Li-GO, and B-GO (Figure 1) show a broad peak at 3420.37, 3430.84, and 3420.97 cm–1, respectively, in the high-frequency area corresponding to the vibration for the stretching and bending of OH groups present in the adsorbed water molecules by undoped and doped GO. Therefore, from this observation, it can be concluded that the sample has strong hydrophilicity for both undoped and doped GO. The absorption peaks at 2363.37, 2363.38, and 2360.48 cm–1 are observed because of the symmetric and antisymmetric stretching vibrations of CH2 for GO, B-GO, and Li-GO, respectively. Also, C–OH stretching is found at 1386.10 cm–1 for undoped GO, 1391.69 cm–1 for B-GO, and 1398.24 cm–1 for Li-GO corresponding to the stretching vibration of C–OH of alcohol. Again, C–O–C groups are found at 1227.15 cm–1 for undoped GO, 1212.48 cm–1 for B-GO, and 1268.36 cm–1 for Li-doped GO.
Figure 1.
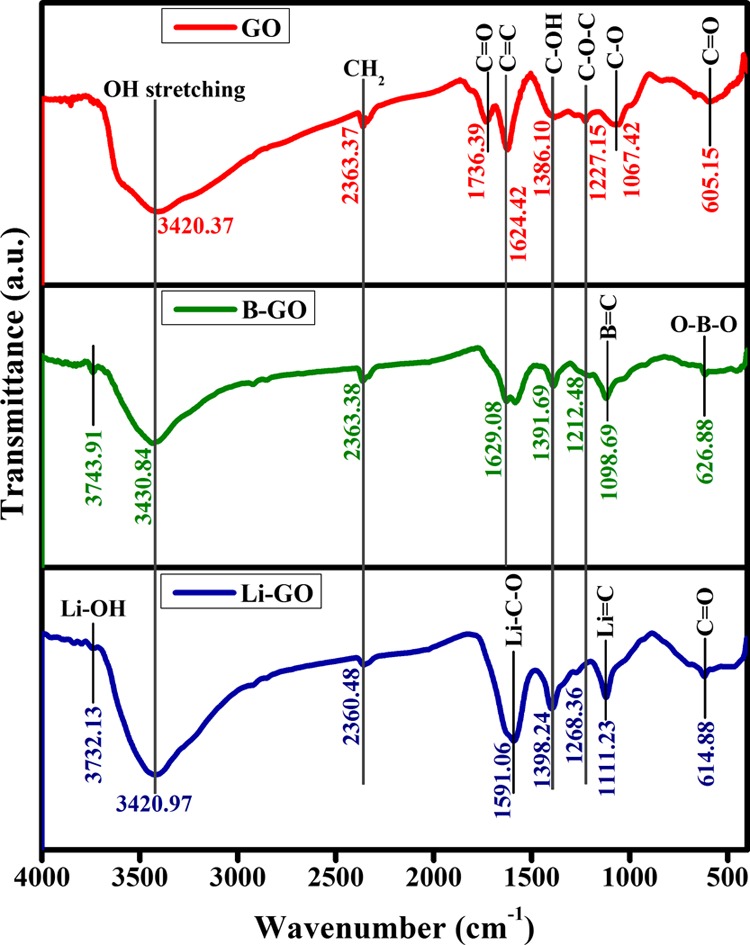
FTIR spectra of undoped GO, Li-doped GO, and B-doped GO.
The two absorption peaks found in the middle of the frequency area for GO at 1736.39 and 1624.42 cm–1 can be accredited to the stretching vibrations of C=O and C=C of carbonyl groups and carboxylic acid, respectively, present at the edges of GO. The peak at 1067.42 cm–1 corresponds to the stretching vibration of C–O due to the presence of carboxylic acid. The presence of these oxygen-containing groups confirms that GO has been produced. The formation of hydrogen bonds between carbon and water molecules occurs as a result of the presence of hydroxyl groups, which further elucidates the hydrophilic nature of GO.24
After the doping of boron in GO, the peaks at 626.88 and 1098.69 cm–1 are due to the stretching vibrations of the O–B–O and the B–C bonds, respectively, confirming the presence of boron in the graphene structure.25 Moreover, for Li-doped GO, a peak is found at 3732.13 cm–1, which corresponds to the Li–OH stretching. Also, two peaks in the middle of the frequency area at 1591.06 and 1111.23 cm–1 are found, which clearly proves the presence of Li in GO. The absence of a peak at 1736.39 cm–1 for both Li-doped GO and B-doped GO is attributed to the metal leakage with the carboxylic group. From FTIR, it is clearly observed that the oxygen-containing groups have not been fully removed at the time of doping, which confirms that the full reduction of GO does not take place.
The X-ray diffraction (XRD) pattern of the prepared GO shows an interlayer spacing of 0.801, 0.336, and 0.211 nm for the (001) reflection peak at 2θ = 11.04°, 26.54°, and 42.22° (Figure 2), respectively. The large interlayer gaps of GO sheets prove the presence of oxygen-containing groups introduced by the oxidation of graphite.26
Figure 2.
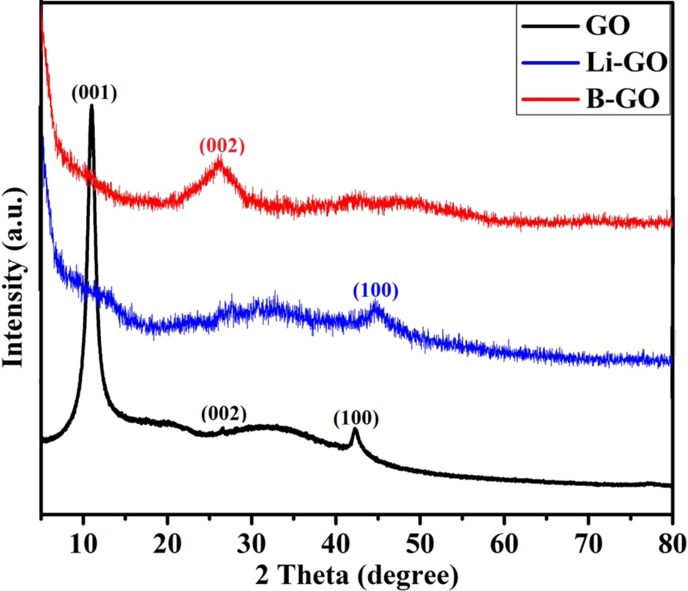
XRD spectra of the prepared samples.
From the graph, it can be found that the disappearance of the XRD peak at 11.04° is due to the Li doping in GO, which caused the distortion of the graphitic structure. This reflection corresponding to (001) is of LiC6. This (001) of LiC6 confirms the intercalation of lithium into the graphitic structure, which confirms doping. The XRD peak at 42.96° (100) shows an interlayer spacing of 0.214 nm that corresponds to the disorder in the graphitic structure, which still remains after doping.
The (002) reflection peak at 2θ = 26.92° shows an interlayer spacing of B-doped GO, which is approximately 0.332 nm, and is slightly lower than the (002) graphite spacing of 0.336 nm. It shows that the sample has a structure similar to that of graphite, with less defects caused by boron doping.27
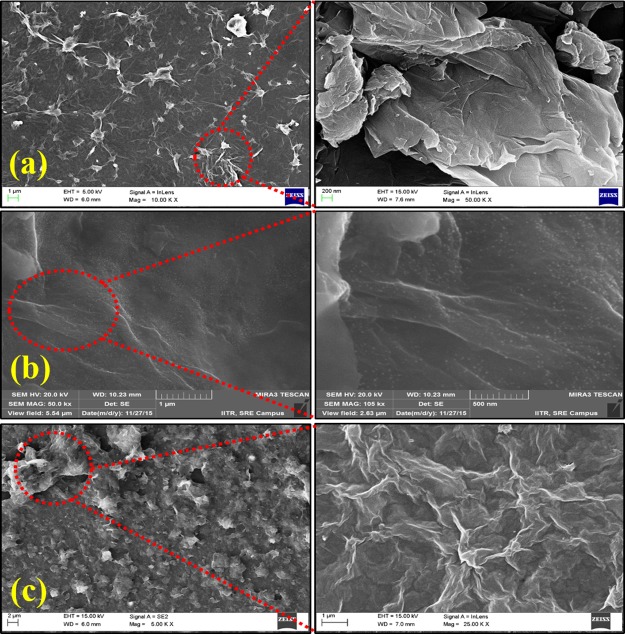
The surface morphologies of the prepared samples are shown in Figure 3. FESEM images of the undoped GO shows well-defined, layered, and interlinked three-dimensional homogeneous graphene sheets, forming a spongelike porous network structure. From Figure 3a, it is easy to differentiate the number of individual layers, including the kinked and wrinkled areas. Figure 3b shows the morphology of the Li-doped GO. FESEM shows a small, white, dotlike structure, which confirms the presence of lithium in GO. From Figure 3c, the morphology of B-doped GO can be seen to have the same type of normal exfoliated structure as GO. Some researchers observed that the doping of smaller-sized boron atoms into GO results in some twisting effect of the doped GO sheet around the boron atoms.25 This is possible due to the compressive force generated at the time of substitutional doping.
Figure 3.
Field emission scanning electron microscopy (FESEM) images of the prepared samples: (a) undoped GO, (b) Li-doped GO, and (c) B-doped GO.
TGA provides the physical or chemical properties (%wt loss) of the material as a function of increasing temperature or time. The TGA curves of GO show the typical two-step degradation as the temperature is increased (Figure 4). From the differential thermogravimetry (DTG) curves, it can be observed that the weight loss that starts below 100 °C is mainly due to the release of hydrate water from the GO sheets and that the distinct weight loss at 205.3 °C is due to the breakdown of less-stable oxygen-containing groups on GO sheets.28 If the temperature is further increased up to 636 °C, mass loss occurs because of the decomposition of more-stable functional groups. Nearly identical TGA curves are observed for both Li-doped GO and B-doped GO samples. For Li-doped GO and B-doped GO, above than 850 °C nearly 20% residue has been obtained. Also, for Li-doped GO, it shows the maximum stability by the removal of more-stable functional groups at 794.4 °C.
Figure 4.
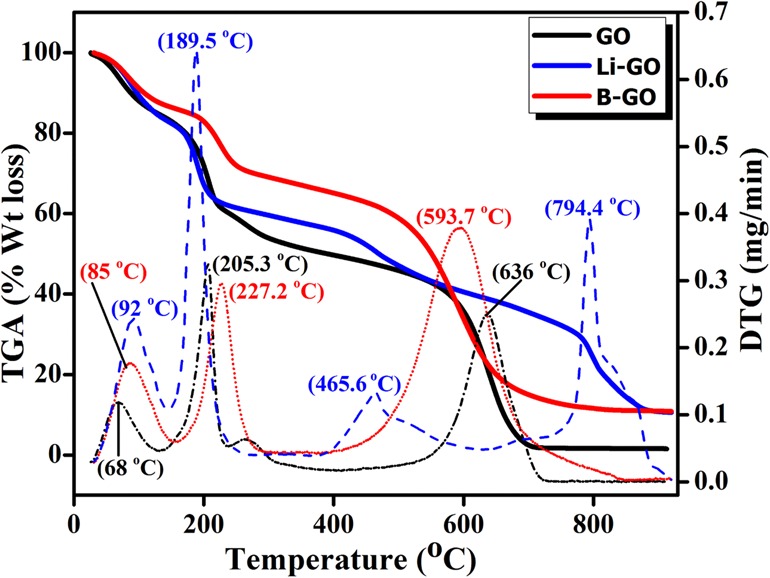
Thermogravimetric analysis (TGA) analysis of the prepared samples.
Raman spectrometry is an appropriate tool to examine the disordered/doped materials. The Raman spectrum provides clear evidence for the fractionary stage, owing to the very weak intensity of (h k l), whereas this phase would be difficult to detect from the XRD peaks.
The first- and second-order Raman spectra of undoped GO, Li-doped GO, and B-doped GO are shown in Figure 5. As can be seen from Figure 5, a D-band is observed at 1358 cm–1 for the undoped GO flakes because of the (weak) disordered band of the graphite edges (D-band) and can be attributed to the breathing motion of sp2 atoms in the rings of carbon and defects in the graphene flakes.29 This band position generally gives the sensitivity with respect to the applied strain, temperature, and the level of doping. However, for Li-doped GO and B-doped GO, the D-band is observed at 1345 and 1351 cm–1, respectively. It shows that the peaks have been shifted (blue shift) 13 and 7 cm–1 for Li and B, respectively, because of the loss of some quanta by interacting with the vibrational modes of the material called phonons. The peak around 1595 cm–1 is called the G-band (E2g2) of GO. The G mode is formed because of the relative motion of sp2 carbon atoms in rings and in chains. For Li-doped GO and B-doped GO, the peaks are observed at 1582 cm—1 and 1588 cm–1, respectively. From this figure, it can be found that the intensity of the D-band is increased and that both D- and G-bands are broadened for Li-doped GO and B-doped GO, which confirms the incorporation of oxygen-containing groups. Simultaneously, it also gives information about the decrease in the crystalline nature as compared with graphite.30 Second-order D-band (2D-band), as a result of two phonon vibrational processes, occurs at 2899, 2896, and 2913 cm–1 for GO, Li-doped GO, and B-doped GO, respectively. However, the red shift is observed for B-doped GO because of the decrease in the frequency of phonons interacting with the incident photon.
Figure 5.
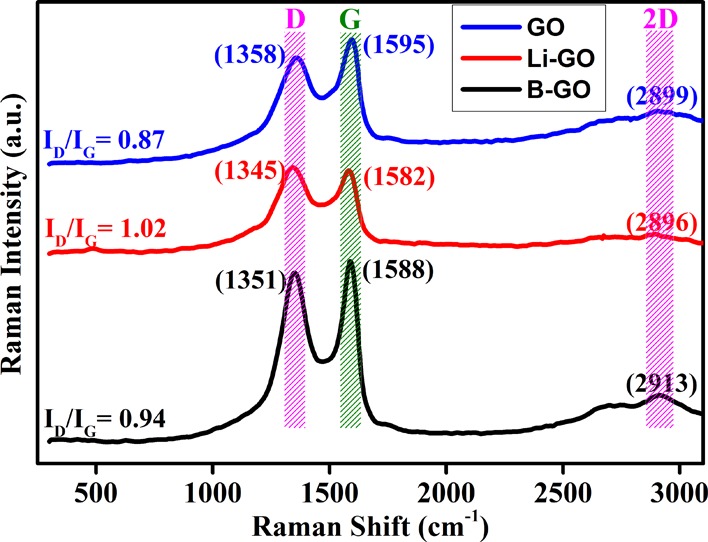
Raman spectra of the prepared samples.
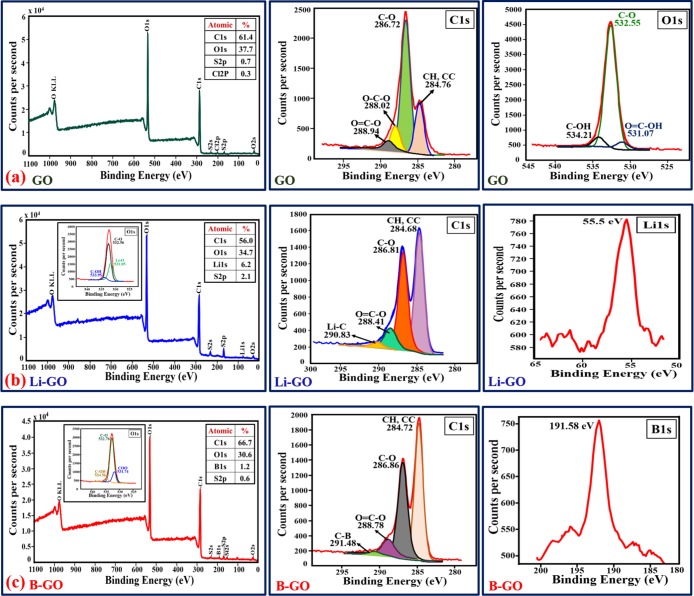
X-ray photoelectron spectroscopy (XPS) analysis for undoped GO, Li-doped GO, and B-doped GO was carried out with the binding energy ranging from 0 to 1100 eV to study the elemental composition (qualitative and quantitative analyses of functional groups) of the material. The survey spectrum in Figure 6 shows the presence of carbon and oxygen for undoped GO, carbon and lithium for Li-doped GO, and carbon and boron for B-doped GO.
Figure 6.
XPS spectra of (a) undoped GO, (b) Li-doped GO, and (c) B-doped GO.
The C1 spectrum generally shows four types of functional groups for undoped GO: C–H/C=C (∼284.6 eV), O–C–O (∼286.72 eV), C=O (∼288.02 eV), and O=C–O (∼288.94 eV). However, we have not found any O=C–OH groups, which may be due to their short-lived existence during the deconvolution of C1s. The deconvolution of O1s represents the presence of C–OH (∼534.21 eV), and the peaks around 532.55 and 531.07 eV deconvoluted to C–O and O=C–OH, respectively.31
The L1s peak is found at ∼55.5 eV and confirms the presence of Li in the GO framework. The C1s spectra of the Li-doped GO show peaks at ∼290.83, ∼288.41, ∼286.81, and ∼284.68 eV for Li–C, O=C–O, C–O, and CH/CC, respectively. Lithium doping is supposed to be interstitial doping to GO;32 still, in some cases, oxygen-containing lithium species such as LiO2 and/or LiOH are present as an overlayer, which results in the presence of the sharp L1s peak.
From the figure, it can be found that the B1s peak (∼191.58 eV) shows the presence of boron in the GO structure. This peak is visible due to the “graphitic” boron while boron atoms substitute the carbon atoms in the GO frameworks.27 The deconvoluted XPS spectrum of C1s (Figure 6c) shows distinct peaks at ∼291.48, ∼288.78, ∼286.86, and ∼284.72 eV corresponding to the different chemical atmospheres of the C–C bond in the GO structure. The intense peak (∼284.72 eV) in the C1s spectrum corresponds to the C–H/C–C sp2 bonded graphite-like carbon, which confirms the formation of a conjugated honeycomb structure formed by most of the carbon atoms in an arranged manner. At higher binding energies, lower intense peaks are observed, which shows the presence of some functional groups that bonded with the GO structure even after partial reduction. Boron doping is believed to be substitutional doping to GO,33 although in some cases oxygen-containing boron groups (B=O) are supposed to be present at the sheet edges of B-doped GO to validate the broad feature of the B1s peak.34
We have tested the humidity-sensing performance of the undoped GO, Li-doped GO, and B-doped GO sensors with increasing and decreasing levels (11–97%) of RH in this work. Parameters such as humidity/sensitivity, linearity, hysteresis loss, response time, and recovery time are evaluated to optimize the sensing capability of the sample as a resistive-type sensor.
The variation in the sensor resistance with different %RH values (11–97% RH) is shown in Figure 7. From the figure, it can be seen that as the RH level increases, the obtained resistance of the sensor shifts to the lower values monotonically. As we already know, the adsorbed water molecules (confirmed using FTIR and XPS) increase the dielectric constant and lower the resistance by swelling or 2D capillary effect. Also, more adsorbed water molecules can strengthen the space–charge polarization effect and introduce fast diffusion into the inner portion of the Li-doped GO film.35 Further, this will help the formation of protons between the hydroxyl-containing groups. Among the three samples, Li-doped GO exhibits the best linearity.
Figure 7.
Linearity and sensitivity of the prepared samples: (a) GO, (b) Li-doped GO, and (c) B-doped GO.
Also, Figure 7 demonstrates the relationship between sensitivity (calculated using eq 3) and %RH. Obviously, the sensitivity of Li-doped GO is higher than those of all other samples. When the RH level increases from 11 to 97%, the sensitivity increases from 17.13 to 3038.16%. By contrast, the sensitivities of undoped GO and B-doped GO increase from 3.28 to 737.03% and 6.95 to 631.10%, respectively. These values are significantly lower than the value obtained for Li-doped GO under the same conditions. The detrimental increments in the sensing capacity are accredited to the presence of water molecules in the extended interlayer distance at the time of Li doping and the increase in large charge storage capability.36 As the RH increases, the succeeding water molecules attach with the first water layer and result in a continuous water adsorption by layer-by-layer permeation. This is possible due to the attaching of the water molecule with the H-bond through hydroxyl groups. Additionally, the synthesis of our sensor material and its performance display the required reproducibility and long-term stability throughout this research.
For a perfect humidity sensor, the hysteresis value must be very small or negligible. Therefore, it is one of the most significant parameters of a humidity sensor and indicates good reliability by defining the maximum time lag between the adsorption and desorption processes. Generally, the hysteresis effect of any sensor material is defined by the difference between the resistances with respect to increasing and decreasing %RH. The hysteresis of the prepared samples was measured by keeping the fabricated thin films between closed air-tight boxes with the RH ranging from 11 to 97% and vice versa, as shown in Figure 8. The percentage hysteresis (% hysteresis) loss is calculated using eq 5. The hysteresis curves for all samples are shown in Figure 8, where the downward arrow represents the adsorption phenomenon (11–97% RH) and the upward arrow represents the desorption phenomenon (97–11% RH). For the Li-doped GO, it has been found that both the adsorption and desorption lines overlap each other with a negligible gap, which means that the sample has a very low hysteresis of 0.83%. However, for undoped GO and B-doped GO samples, higher hystereses of 1.03 and 2.26%, respectively, are observed compared with that for the Li-doped GO within the same range. The results obtained for humidity are listed in Table 1. Thus, the Li-doped GO shows better stability among all samples.
Figure 8.
Hysteresis loss of the prepared samples: (a) GO, (b) Li-doped GO, and (c) B-doped GO.
Table 1. Summary of the Humidity Results Obtained for All Samples.
| sample name | % linearity | % hysteresis | response time | recovery time |
|---|---|---|---|---|
| undoped GO | 89.4 | 1.03 | 23 | 49 |
| Li-doped GO | 92.0 | 0.83 | 4 | 25 |
| B-doped GO | 71.7 | 2.26 | 40 | 50 |
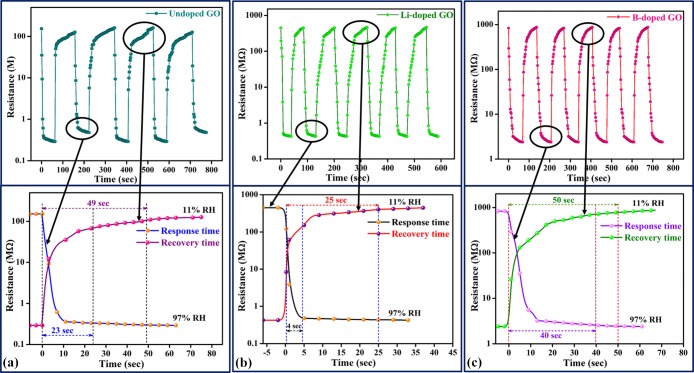
As we know, the main criteria for any humidity sensor are the significant effect of response and recovery times. From Figure 9, it can be observed that the response and recovery times of sensors depend on the different RH levels (ranging from 11 to 97%). As per the resistance observed from the recorder, the response time (humidification from 11 to 97% RH) and the recovery time (dehumidification from 97 to 11% RH) of Li-doped GO were 4 and 25 s, respectively, both better than those of undoped GO (the response time was 23 s, and the recovery time was 49 s) and B-doped GO (the response time was 40 s, and the recovery time was 50 s) resistive-type sensors. The excellent response and recovery times for Li-doped GO are attributed not only to the ample hydrophilic/oxygen-containing functional groups (LiOH) present as an overlayer by Li doping (confirmed using FTIR and XPS results) with GO but also to the large interlayer distance (at 100) compared with the undoped GO films, which enables water adsorption and desorption37 during the reaction. These water molecules act like an electron acceptor, which in turn increases the response and recovery times. Again, for B-doped GO, although the interlayer distance (at 002) is increased compared with GO, due to the substitutional doping of boron, oxygenated boron species has been found in some cases, which in turn reduces the hydrophilic functional groups.
Figure 9.
Response and recovery times of the prepared samples: (a) GO, (b) Li-doped GO, and (c) B-doped GO.
The prepared samples are compared with other samples in terms of cost, synthesis, and sensing performance, as shown in Table 2.
Table 2. Comparison of Sensing Performance between the GO-Doped Humidity Sensors and Other Graphene-Based Humidity Sensors.
| s. no. | materials used | types of sensor | cost and synthesis time | response time (s) | % sensitivity | ΔRH (%) | ref |
|---|---|---|---|---|---|---|---|
| 1 | GO/Li-doped GO/B-doped GO | resistive | less expensive and short synthesis process | 23/4/40 | 737/3038/631 | 97 | present work |
| 2 | GO | resistive | cheap but long synthesis process | 100 | 790 | 65 | (38) |
| 3 | GO | capacitive | quite expensive | 10.5 | 3710 pF | 93 | (36) |
| 4 | graphene-polypyrrole | resistive | expensive and long synthesis process | 15 | 1273 | 58 | (38) |
| 5 | scotch-tape graphene | resistive | expensive and long synthesis process | 600 | 71.4 | 70 | (38) |
| 6 | reduced-GO | resistive | cheap but time-taking process | 50 | 51.4 | 84 | (38) |
| 7 | GO–silicon bilayer | resistive | less expensive and time-consuming process | 19 | 1016 | 53 | (38) |
| 8 | reduced-GO/SnO2 | capacitive | expensive and time-consuming process | 102 | 1605 pF | 97 | (39) |
| 9 | N-CSs/PVA—CTAB | capacitive IDE (0.1 mm)/(0.3 mm) | less expensive and less synthesis process | 19/8 | 1700/870 | 97 | (16) |
2.1. Proposed Mechanism
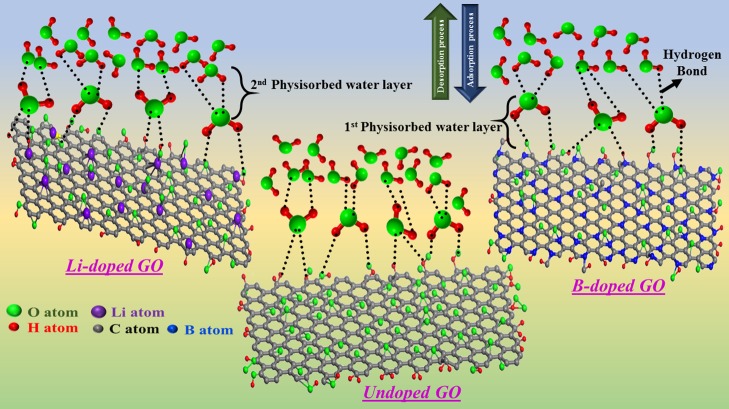
To confirm the better sensing properties, a schematic mechanism has been proposed (Figure 10) to understand the role of sensing materials with different % RH values. As we know, the GO layers are interlinked by hydrogen bonding between the different functional groups and water molecules. At low %RH, water molecules are attached to the available vacant sites of the GO surface with the help of double hydrogen bonding, which is known as the first physisorbed water layer (Figure 10). In this case, the double hydrogen bonding restricts the mobility of water molecules. Because of the lower number of protons present and the restriction in mobility, high energy is required to transfer the protons between the adjacent hydroxyl groups that show a high resistance in GO-based films.36 At high %RH, these water molecules dominate H-bonds, causing an increase in the space between the GO layers, weakening of the van der Waals force, and reduction in the H-bond interactions (intra- and interlayer).40 Because of this, physisorbed water can be ionized to produce a large number of hydronium ions as charge carriers that cause a decrease in the electrical resistance. The proposed mechanism is similar for both Li-doped GO and B-doped GO.
Figure 10.
Proposed sensing mechanism.
It is worth mentioning that doping with lithium creates LiOH at the edges (confirmed using FTIR and XPS), which further increases the humidity of that particular sensor. Also, from the humidity-sensing results, it has been found that water molecules and oxygenated functional groups play a vital role for better sensing characteristics.
3. Experimental Section
3.1. Materials and Chemicals
Graphite powder (98.5% purity) was purchased from S. K. Carbon Ltd., Faridabad, India. Sulfuric acid (H2SO4) (98% purity), 35% hydrochloric acid (HCl), and 98% sodium hydroxide pellets (NaOH) were purchased from HiMedia Laboratories Pvt. Ltd. Mumbai, India. Nitric acid (HNO3) (69–72% purity), ortho-phosphoric acid (H3PO4) (88% purity), and hydrogen peroxide (H2O2) (40% purity) were purchased from Avantor Performance Materials India Limited, Gujarat, India. Potassium permanganate (KMnO4) (99% purity) was purchased from RFCL Limited, Haryana. Lithium hydroxide (LiOH·H2O) with 99% purity and boric acid (H3BO3) with 99.5% purity were purchased as Li and B precursors for Li and B from HiMedia Laboratories Pvt. Ltd., India and RFCL Limited, India, respectively. Also, for creating the different RH conditions, salts such as lithium chloride (LiCl·H2O), magnesium chloride (MgCl2·6H2O), magnesium nitrate (MgNO3·4H2O), sodium nitrate (NaNO3), sodium chloride (NaCl), and potassium chloride (KCl) were purchased from Hi-Media Laboratories Pvt. Ltd., India, and potassium sulfate (K2SO4) was purchased from RFCL Limited, India.
3.2. GO Synthesis
This method is a modification of the earlier-described approaches by Hummers and Offeman41 and Panwar et al.42 Natural flakes of graphite (1 g) were dispersed into a 100 mL solution of sulfuric acid (H2SO4), nitric acid (HNO3), and ortho-phosphoric acid (H3PO4) with a volume ratio of 7:2:1, respectively. This solution was stirred for 2–3 h to achieve a graphite-intercalated compound (GIC). The reaction mechanism involves HNO3- and H3PO4-assisted cointercalation; primarily, HNO3 molecules intercalate into the graphite layers, and in the second step, HNO3 molecules are replaced with larger H3PO4 molecules and hence increase the overall distances of individual graphite layers.43 H2SO4 also takes part in the intercalation, but it helps in the formation of dimanganese heptoxide by reacting with KMnO4 according to the following reaction17,44
| 1 |
| 2 |
Because this dimanganese heptoxide (Mn2O7) is very unstable and explosive in nature, the reaction temperature was maintained within 55 °C during the addition of 6 g of KMnO4. After the addition of KMnO4, the solution was transferred into an oil bath to maintain the same temperature during 12 h of continuous stirring to oxidize the GIC. Again, 0.8 wt % NaOH in 100 mL of deionized (DI) water was added dropwise to the suspension under constant stirring.
The resultant solution was heated up to 80 °C in the oil bath under continuous stirring for 3–4 h. Then, the heated solution was diluted by adding an additional 120 mL of water under continuous stirring. After 15 min of the addition of water, H2O2 (8 mL) was added to the solution to finish the reaction. The solution became yellow, confirming the end of the reaction. For purification, the mixture was washed several times by rinsing and centrifugation with 10% HCl followed by DI water. After filtration followed by drying (under vacuum) at room temperature, the GO powder was obtained and confirmed by different characterizations.
3.3. Preparation of Li-Doped and B-Doped GO
The obtained undoped GO (1 g) powder was added with lithium hydroxide (5 wt%) in 150 mL of DI water, followed by sonication for 30 min; then, the obtained solution was heated at a constant temperature of 100 °C for 36 h. Then, the solution was filtered and washed with DI water. In the same way, we prepared B-doped GO films using GO powder combined with boric acid (H3BO3). The GO/H3BO3 mixture was prepared using the reflux method to systematically control the efficiency of boron doping in the undoped GO. The syntheses of undoped GO, Li-doped GO, and B-doped GO are shown in Figure S1. Then, both the Li-doped GO and B-doped GO powder were added to water through sonication (10:1 ratio) and put onto a cleaned glass substrate for preparing the thin film by the drop-casting process.
3.4. Characterization
A Thermo-Nicolet FTIR spectrometer was used for a detailed evaluation of the structural properties of the prepared composite using KBr pellets. The surface morphology and microstructure of the as-prepared films were investigated using a FEI Quanta 200 F field emission scanning electron microscope at an accelerating voltage of 15 kV. The crystallinity analysis was carried out using a Bruker AXS D8 Advance powder X-ray diffractometer with high-intensity Cu Kα radiation (1.5418 Å) in the range of 15°–90° (2θ). To analyze the thermal degradation of the composites, TGA was performed using an Exstar TG/DTA 6300 thermogravimetric analyzer in the temperature range 25 to 800 °C at a heating rate of 5 °C min–1 under an air flow rate of 200 mL min–1. XPS analysies of undoped GO, Li-doped GO, and B-doped GO powder samples were carried out on a PHI 5000 Versaprobe-II. Raman spectra of the samples were measured using an Invia Renishaw Raman spectrophotometer with an excitation wavelength of 514 nm using an argon ion laser.
3.5. Sensor Fabrication and Experimental Setup
Glass slides (7.5 × 2.5 cm2) with a thickness of 1.2 mm were cut into 2.5 × 2.5 cm2 strips followed by a well-cleaning process using Piranha solution (3:1 mixture of H2SO4 with H2O2) to remove any organic residues from the surface of the substrate. Two copper plates as electrodes (with dimensions of 20 × 4.65 × 0.16 mm3) were intricately equipped at the two ends of each strip with a conductive silver paste, leaving a gap of 7.5 × 7.5 mm2 for the humidity-sensing test. For electrical connectivity between the sensor and the controlled dc power supply, a 10 cm-long copper wire (having 0.6 mm diameter) was soldered at each end of the electrodes. The open areas of the electrodes were wrapped by a Teflon tape to avoid any chemical reaction arising from humidity or any other surrounding substances. In thin film sensor fabrication, thin films of undoped GO, Li-doped GO, and B-doped GO (50 mL, 1 mg/mL, dissolved in water) samples were prepared by dispersion of the sample on an empty area of a glass substrate by the drop-casting process. Then, the glass substrate was oven-dried at a temperature under 55 °C for 2 h.
A homemade setup (Figure S2) was constructed to carry out the humidity-sensing studies. In this setup, six boxes (approximate volume of ∼737 cm3) were taken for different humidity conditions ranging from 11 to 97%. For creating the different RH conditions, different saturated salt solutions were taken, such as LiCl, MgCl2·6H2O, MgNO3·4H2O, NaNO3, NaCl, KCl, and K2SO4, which yielded 11, 33, 51, 62, 75, 84, and 97% RH, respectively, in air-tight closed plastic boxes made of poly(vinyl chloride) (PVC) at room temperature (30 °C). These solutions were kept overnight in the respective boxes at a controlled atmosphere (room temperature ≈ 25 °C) to confirm that the trapped air inside of the boxes reached an equilibrium state (optimum humidity condition). Next day, the obtained RH levels in different boxes were tested using a standard hygrometer to ensure the required %RH was obtained.
The humidity measurement was carried out by inserting the thin film on a glass substrate in the respective RH boxes until the input current of the sensing material reached a stable value. Resistance of the sample according to the fixed RH was measured using a picoammeter with a constant −10 to 10 V dc voltage supply, using Ohm’s law. The same process was followed for all boxes more than nine times day and night. The testing was done in the glove box for maintaining a constant environment. The average value of the obtained resistance was used for this study. The same procedure was followed for all RH percentages.
3.6. Calibration and Sensing Measurements of the Devices
Before the experiment, all saturated salt solutions were kept inside of the boxes with necessary amount of water to make it fully saturated. Then, a dry-bulb thermometer was used to measure the dry-bulb temperature (Tdb) from the atmosphere, and a wet-bulb thermometer was used to measure the wet-bulb temperature (Twb) for the particular salt solution. The difference between the temperatures (Tdb – Twb) was used to calculate the %RH by using the psychrometric chart/calculator, as shown in Table 3.
Table 3. Calibration Table Used for Measuring the %RH.
| name of saturated salts | Tdb – Twb (°C) | calculated %RH | measured %RH |
|---|---|---|---|
| lithium chloride (LiCl·H2O) | 31.5 – 14.4 = 17.1 | 11.0 | 11 |
| magnesium chloride (MgCl2·2H2O) | 30.4 – 19.2 = 11.2 | 33.3 | 33 |
| magnesium nitrate (MgNO3·4H2O) | 30.5 – 22.6 = 7.9 | 50.5 | 51 |
| sodium nitrate (NaNO3) | 31.0 – 25.0 = 6.0 | 62.0 | 62 |
| sodium chloride (NaCl) | 32.0 – 28.0 = 4.0 | 74.5 | 75 |
| potassium chloride (KCl) | 32.0 – 29.6 = 2.4 | 83.5 | 84 |
| potassium sulfate (K2SO4) | 31.0 – 30.6 = 0.4 | 96.5 | 97 |
Then, the sensitivity of the prepared sample was measured using the percentage relative change in dc electrical resistance (ΔR/R%), defined as follows
 |
3 |
where Re and Rx denote the sensor resistance in the empty box and in the respective RH box (RHx) (from 11 to 97%). In addition, during this experiment, the RH and room temperature were approximately ∼31% and ∼27 °C, respectively.
The percentage linearity and hysteresis of the sensor were calculated using the following equation
 |
4 |
| 5 |
where ymax and ymin are the maximum and minimum values of the obtained resistance at maximum and minimum %RH; ys is the resistance mean value at the mean of the %RH. In the case of hysteresis, ymn and ymp are the maximum and minimum values of y at the mean of the %RH.
4. Conclusions
A novel, cheap, and reliable resistive-type humidity sensor based on undoped GO, Li-doped GO, and B-doped GO has been presented in this work. Other researchers have found better sensitivity, response time, and recovery time for GO as a capacitive-type sensor but not for resistive-type. Again, as per the comparative study presented in this work, it has been found that these sensors are quite expensive, have long response and recovery times, and need a complex synthesis process. From this study, it has been observed that the large number of hydrophilic/oxygen-containing groups, including carboxyl groups and hydroxyl groups as well as vacancies present in Li-doped GO films, bestow the Li-doped GO as an excellent humidity-sensing material. As we know, the presence of more water molecules increases the ion conductivity of the materials. Electrical property (resistance) testing with different levels of RH shows that the sensor based on Li-doped GO exhibits excellent sensitivity (3038.26%) compared with the other samples over the entire RH range (11–97%). Moreover, the sensor shows an exceptional performance with respect to quick response and recovery times, low hysteresis, and excellent stability. From this study, we find that doping dominates the whole research compared with other virgin samples for the humidity sensor. Herewith, we also propose a mechanism that can help readers understand the excellent potential performance of the Li-doped GO sensor.
Acknowledgments
The authors would like to thank the Science and Engineering Research Board, Department of Science and Technology (DST), Govt. of India, for supporting the work by providing the DST INSPIRE fellowship.
Supporting Information Available
The Supporting Information is available free of charge on the ACS Publications website at DOI: 10.1021/acsomega.6b00399.
Schematic synthesis of undoped GO, Li-doped GO, and B-doped GO and experimental setup for the humidity-sensing test facility with necessary accessories (PDF)
Author Contributions
K.R. conducted all of the experiments, analyzed the results, and wrote the first draft of the manuscript. K.P. supervised the research activities and contributed to the manuscript preparation. Both authors regularly discussed the progress of the research, reviewed the manuscript, and gave approval for the final version.
The authors declare no competing financial interest.
Supplementary Material
References
- Borini S.; White R.; Wei D.; Astley M.; Haque S.; Spigone E.; Harris N.; Kivioja J.; Ryhänen T. Ultrafast Graphene Oxide Humidity Sensors. ACS Nano 2013, 7, 11166–11173. 10.1021/nn404889b. [DOI] [PubMed] [Google Scholar]
- Chu J.; Peng X.; Feng P.; Sheng Y.; Zhang J. Study of humidity sensors based on nanostructured carbon films produced by physical vapor deposition. Sens. Actuators, B 2013, 178, 508–513. 10.1016/j.snb.2012.12.104. [DOI] [Google Scholar]
- Chen Z.; Lu C. Humidity Sensors: A Review of Materials and Mechanisms. Sens. Lett. 2005, 3, 274–295. 10.1166/sl.2005.045. [DOI] [Google Scholar]
- Stetter J. R.; Penrose W. R.; Yao S. Sensors, Chemical Sensors, Electrochemical Sensors, and ECS. J. Electrochem. Soc. 2003, 150, S11. 10.1149/1.1539051. [DOI] [Google Scholar]
- Chen W.-P.; Zhao Z.-G.; Liu X.-W.; Zhang Z.-X.; Suo C.-G. A capacitive humidity sensor based on multi-wall carbon nanotubes (MWCNTs). Sensors 2009, 9, 7431–7444. 10.3390/s90907431. [DOI] [PMC free article] [PubMed] [Google Scholar]
- Tang Q.-Y.; Chan Y. C.; Zhang K. Fast response resistive humidity sensitivity of polyimide/multiwall carbon nanotube composite films. Sens. Actuators, B 2011, 152, 99–106. 10.1016/j.snb.2010.09.016. [DOI] [Google Scholar]
- Wong W. C.; Chan C. C.; Chen L. H.; Li T.; Lee K. X.; Leong K. C. Polyvinyl alcohol coated photonic crystal optical fiber sensor for humidity measurement. Sens. Actuators, B 2012, 174, 563–569. 10.1016/j.snb.2012.07.032. [DOI] [Google Scholar]
- Song S.-H.; Yang H.-H.; Han C.-H.; Ko S.-D.; Lee S.-H.; Yoon J.-B. Metal-oxide-semiconductor field effect transistor humidity sensor using surface conductance. Appl. Phys. Lett. 2012, 100, 101603. 10.1063/1.3691936. [DOI] [Google Scholar]
- Li Y.; Deng C.; Yang M. A novel surface acoustic wave-impedance humidity sensor based on the composite of polyaniline and poly(vinyl alcohol) with a capability of detecting low humidity. Sens. Actuators, B 2012, 165, 7–12. 10.1016/j.snb.2011.12.037. [DOI] [Google Scholar]
- Xie J.; Wang H.; Lin Y.; Zhou Y.; Wu Y. Highly sensitive humidity sensor based on quartz crystal microbalance coated with ZnO colloid spheres. Sens. Actuators, B 2013, 177, 1083–1088. 10.1016/j.snb.2012.12.033. [DOI] [Google Scholar]
- Kulkarni M. V.; Apte S. K.; Naik S. D.; Ambekar J. D.; Kale B. D. Ink-jet printed conducting polyaniline based flexible humidity sensor. Sens. Actuators, B 2013, 178, 140–143. 10.1016/j.snb.2012.12.046. [DOI] [Google Scholar]
- Song S.-H.; Yang H.-H.; Han C.-H.; Ko S.-D.; Lee S.-H.; Yoon J.-B. Metal-oxide-semiconductor field effect transistor humidity sensor using surface conductance. Appl. Phys. Lett. 2012, 100, 101603. 10.1063/1.3691936. [DOI] [Google Scholar]
- Chen W.-P.; Zhao Z.-G.; Liu X.-W.; Zhang Z.-X.; Suo C.-G. A capacitive humidity sensor based on multi-wall carbon nanotubes (MWCNTs). Sensors 2009, 9, 7431–7444. 10.3390/s90907431. [DOI] [PMC free article] [PubMed] [Google Scholar]
- Tang Q.-Y.; Chan Y. C.; Zhang K. Fast response resistive humidity sensitivity of polyimide/multiwall carbon nanotube composite films. Sens. Actuators, B 2011, 152, 99–106. 10.1016/j.snb.2010.09.016. [DOI] [Google Scholar]
- Li Y.; Deng C.; Yang M. A novel surface acoustic wave-impedance humidity sensor based on the composite of polyaniline and poly(vinyl alcohol) with a capability of detecting low humidity. Sens. Actuators, B 2012, 165, 7–12. 10.1016/j.snb.2011.12.037. [DOI] [Google Scholar]
- Cunha B. B.; Greenshields M. W. C. C.; Mamo M. A.; Coville N. J.; Hümmelgen I. A. A surfactant dispersed N-doped carbon sphere-poly(vinyl alcohol) composite as relative humidity sensor. J. Mater. Sci.: Mater. Electron. 2015, 26, 4198–4201. 10.1007/s10854-015-2966-7. [DOI] [Google Scholar]
- Dreyer D. R.; Park S.; Bielawski C. W.; Ruoff R. S. The chemistry of graphene oxide. Chem. Soc. Rev. 2010, 39, 228–240. 10.1039/B917103G. [DOI] [PubMed] [Google Scholar]
- Daio T.; Bayer T.; Ikuta T.; Nishiyama T.; Takahashi K.; Takata Y.; Sasaki K.; Lyth S. M. In-Situ ESEM and EELS Observation of Water Uptake and Ice Formation in Multilayer Graphene Oxide. Sci. Rep. 2015, 5, 11807. 10.1038/srep11807. [DOI] [PMC free article] [PubMed] [Google Scholar]
- Yuan W.; Liu A.; Huang L.; Li C.; Shi G. High-performance NO2 Sensors Based on Chemically Modified Graphene. Adv. Mater. 2013, 25, 766–771. 10.1002/adma.201203172. [DOI] [PubMed] [Google Scholar]
- Chi H.; Liu Y. J.; Wang F.; He C. Highly Sensitive and Fast Response Colorimetric Humidity Sensors Based on Graphene Oxides Film. ACS Appl. Mater. Interfaces 2015, 7, 19882–19886. 10.1021/acsami.5b06883. [DOI] [PubMed] [Google Scholar]
- Denis P. A. Chemical Reactivity of Lithium Doped Monolayer and Bilayer Graphene. J. Phys. Chem. C 2011, 115, 13392–13398. 10.1021/jp203547b. [DOI] [Google Scholar]
- Pešić J.; Gajić R.; Hingerl K.; Belić M. Strain-enhanced superconductivity in Li-doped graphene. EPL 2014, 108, 67005. 10.1209/0295-5075/108/67005. [DOI] [Google Scholar]
- Shahriary L.; Athawale A. A. Graphene Oxide Synthesized by using Modified Hummers Approach. Int. J. Renew. Energy Environ. Eng. 2014, 2, 58–63. [Google Scholar]
- Gebhardt J.; Koch R. J.; Zhao W.; Höfert O.; Gotterbarm K.; Mammadov S.; Papp C.; Görling A.; Steinrück H.-P.; Seyller T. Growth and electronic structure of boron-doped graphene. Phys. Rev. B: Condens. Matter Mater. Phys. 2013, 87, 155437. 10.1103/physrevb.87.155437. [DOI] [PubMed] [Google Scholar]
- Chen C.; Yang Q.-H.; Yang Y.; Lv W.; Wen Y.; Hou P.-X.; Wang M.; Cheng H.-M. Self-assembled free-standing graphite oxide membrane. Adv. Mater. 2009, 21, 3007–3011. 10.1002/adma.200803726. [DOI] [Google Scholar]
- Park S.; An J.; Potts J. R.; Velamakanni A.; Murali S.; Ruoff R. S. Hydrazine-reduction of graphite- and graphene oxide. Carbon 2011, 49, 3019–3023. 10.1016/j.carbon.2011.02.071. [DOI] [Google Scholar]
- McAllister M. J.; Li J.-L.; Adamson D. H.; Schniepp H. C.; Abdala A. A.; Liu J.; Herrera-Alonso M.; Milius D. L.; Car R.; Prud’homme R. K.; Aksay I. A. Single sheet functionalized graphene by oxidation and thermal expansion of graphite. Chem. Mater. 2007, 19, 4396–4404. 10.1021/cm0630800. [DOI] [Google Scholar]
- Sole C.; Drewett N. E.; Hardwick L. J. In situ Raman study of lithium-ion intercalation into microcrystalline graphite. Faraday Discuss. 2014, 172, 223. 10.1039/c4fd00079j. [DOI] [PubMed] [Google Scholar]
- Sahoo M.; Sreena K. P.; Vinayan B. P.; Ramaprabhu S. Green synthesis of boron doped graphene and its application as high performance anode material in Li ion battery. Mater. Res. Bull. 2015, 61, 383–390. 10.1016/j.materresbull.2014.10.049. [DOI] [Google Scholar]
- Yang D.; Velamakanni A.; Bozoklu G.; Park S.; Stoller M.; Piner R. D.; Stankovich S.; Jung I.; Field D. A.; Ventrice C. A. Jr.; Ruoff R. S. Chemical analysis of graphene oxide films after heat and chemical treatments by X-ray photoelectron and micro-Raman spectroscopy. Carbon 2009, 47, 145–152. 10.1016/j.carbon.2008.09.045. [DOI] [Google Scholar]
- Landi B. J.; Ganter M. J.; Cress C. D.; DiLeo R. A.; Raffaelle R. P. Carbon nanotubes for lithium ion batteries. Energy Environ. Sci. 2009, 2, 638–654. 10.1039/b904116h. [DOI] [Google Scholar]
- Yeom D.-Y.; Jeon W.; Tu N. D. K.; Yeo S. Y.; Lee S.-S.; Sung B. J.; Chang H.; Lim J. A.; Kim H. High-concentration boron doping of graphene nanoplatelets by simple thermal annealing and their supercapacitive properties. Sci. Rep. 2015, 5, 9817. 10.1038/srep09817. [DOI] [PMC free article] [PubMed] [Google Scholar]
- Ferrighi L.; Datteo M.; Di Valentin C. Boosting Graphene Reactivity with Oxygen by Boron Doping: Density Functional Theory Modeling of the Reaction Path. J. Phys. Chem. C 2014, 118, 223–230. 10.1021/jp410966r. [DOI] [Google Scholar]
- Cheng B.; Tian B.; Xie C.; Xiao Y.; Lei S. Highly sensitive humidity sensor based on amorphous Al2O3 nanotubes. J. Mater. Chem. 2011, 21, 1907–1912. 10.1039/C0JM02753G. [DOI] [Google Scholar]
- Yu H.-W.; Kim H. K.; Kim T.; Bae K. M.; Seo S. M.; Kim J.-M.; Kang T. J.; Kim Y. H. Self-Powered Humidity Sensor Based on Graphene Oxide Composite Film Intercalated by Poly(sodium 4-styrene sulfonate). ACS Appl. Mater. Interfaces 2014, 6, 8320–8326. 10.1021/am501151v. [DOI] [PubMed] [Google Scholar]
- Bi H.; Yin K.; Xie X.; Ji J.; Wan S.; Sun L.; Terrones M.; Dresselhaus M. S. Ultrahigh humidity sensitivity of graphene oxide. Sci. Rep. 2013, 3, 2714. 10.1038/srep02714. [DOI] [PMC free article] [PubMed] [Google Scholar]
- Medhekar N. V.; Ramasubramaniam A.; Ruoff R. S.; Shenoy V. B. Hydrogen Bond Networks in Graphene Oxide Composite Paper: Structure and Mechanical Properties. ACS Nano 2010, 4, 2300–2306. 10.1021/nn901934u. [DOI] [PubMed] [Google Scholar]
- Naik G.; Krishnaswamy S. Room-Temperature Humidity Sensing Using Graphene Oxide Thin Films. Graphene 2016, 5, 1–13. 10.4236/graphene.2016.51001. [DOI] [Google Scholar]
- Zhang D.; Chang H.; Li P.; Liu R.; Xue Q. Fabrication and characterization of an ultrasensitive humidity sensor based on metal oxide/graphene hybrid nanocomposite. Sens. Actuators, B 2016, 225, 233–240. 10.1016/j.snb.2015.11.024. [DOI] [Google Scholar]
- Kawai S.; Saito S.; Osumi S.; Yamaguchi S.; Foster A. S.; Spijker P.; Meyer E. Atomically controlled substitutional boron-doping of graphene nanoribbons. Nat. Commun. 2015, 6, 8098. 10.1038/ncomms9098. [DOI] [PMC free article] [PubMed] [Google Scholar]
- Hummers W. S. Jr.; Offeman R. E. Preparation of Graphitic Oxide. J. Am. Chem. Soc. 1958, 80, 1339. 10.1021/ja01539a017. [DOI] [Google Scholar]
- Panwar V.; Chattree A.; Pal K. A new facile route for synthesizing of graphene oxide using mixture of sulfuric–nitric–phosphoric acids as intercalating agent. Phys. E 2015, 73, 235–241. 10.1016/j.physe.2015.06.006. [DOI] [Google Scholar]
- Sorokina N. E.; Maksimova N. V.; Nikitin A. V.; Shornikova O. N.; Avdeev V. V. Synthesis of Intercalation Compounds in the Graphite–HNO3–H3PO4 System. Inorg. Mater. 2001, 37, 584–590. 10.1023/A:1017512216205. [DOI] [Google Scholar]
- Newton T. A. Partition Coefficients—A Lecture Demonstration. J. Chem. Educ. 1982, 59, 973. 10.1021/ed059p973.1. [DOI] [Google Scholar]
Associated Data
This section collects any data citations, data availability statements, or supplementary materials included in this article.


