Abstract
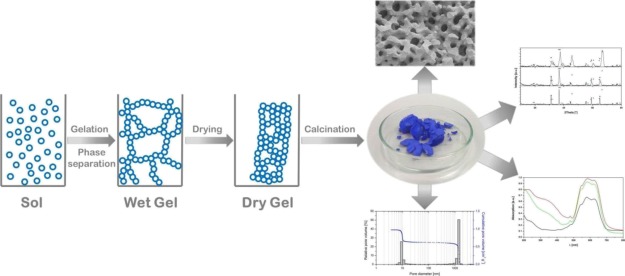
Enhancing the activity and stability of catalysts is a major challenge in scientific research nowadays. Previous studies showed that the generation of an additional pore system can influence the catalytic performance of porous catalysts regarding activity, selectivity, and stability. This study focuses on the epoxide-mediated sol–gel synthesis of mixed metal oxides, NiAl2O4 and CoAl2O4, with a spinel phase structure, a hierarchical pore structure, and Ni and Co contents of 3 to 33 mol % with respect to the total metal content. The sol–gel process is accompanied by a polymerization-induced phase separation to introduce an additional pore system. The obtained mixed metal oxides were characterized with regard to pore morphology, surface area, and formation of the spinel phase. The Brunauer–Emmett–Teller surface area ranges from 74 to 138 m2·g–1 and 25 to 94 m2·g–1 for Ni and Co, respectively. Diameters of the phase separation-based macropores were between 500 and 2000 nm, and the mesopore diameters were 10 nm for the Ni-based system and between 20 and 25 nm for the cobalt spinels. Furthermore, Ni–Al spinels with 4, 5, and 6 mol % Ni were investigated in the dry reforming of CH4 (DRM) with CO2 to produce H2 and CO. CH4 conversions near the thermodynamic equilibrium were observed depending on the Ni content and reaction temperature. The Ni catalysts were further compared to a noble metal-containing catalyst based on a spinel system showing comparable CH4 conversion and carbon selectivity in the DRM.
Introduction
In the last two decades, mixed metal oxides with a spinel structure (AB2O4) have considerably gained importance as thermally stable pigments,1−3 cathode materials,4 and catalysts.5−7 Three types of spinels are known, whose structure results from the different atomic radii and lattice energies.8 The normal spinel consists of a cubic closely packed primitive cell of O2–, where one-eighth of the tetrahedral voids are filled with A2+, whereas half of the octahedral voids are filled with B3+, as found for CoAl2O4, Mn3O4, and ZnAl2O4.8,9 In the inverse spinel, for example, Fe3O4, CoFe2O4, and NiFe2O4, A2+ fills the octahedral voids, whereas half of B3+ is shifted to the tetrahedral voids.8 The third type is the disordered spinel (NiAl2O4), in which A2+ and B3+ are statistically allocated to the octahedral and tetrahedral voids.8
Regarding the implementation of spinels in the field of heterogeneous catalysis and possible industrial applications, several studies have evaluated the activity of spinel-based materials in catalytic test reactions. Although these studies were restricted on a laboratory scale, the high potential as catalysts offered by these systems was illustrated. Table 1 gives an overview of spinels evaluated in catalytic test reactions.
Table 1. Examples for Spinels in Catalytic Reactions.
Within these examples, the dry reforming of CH4 (DRM) takes a special role because the spinel acts as a precursor for the catalytically active NiO formed via reduction. Moreover, catalysts based on NiAl2O4 or CoAl2O4 could represent a low-cost alternative to commonly used DRM catalysts based on noble metals (e.g., Pt, Pd, and Rh).10−12
The solid-state chemistry represents a simple approach to spinels and mixed metal oxides.19 Usually inorganic metal salts or metal oxides are mixed and treated thermally at temperatures between 773 and 1773 K. However, this method suffers from weak reproducibility, generation of multiphase systems, very low specific surface areas, and long reaction times because of the slow solid-state diffusion processes. To generate materials with higher specific surface area, approaches based on wet chemistry are more promising. Coprecipitation,20 sonochemical methods,21 and especially the sol–gel route result in high surface area particles that can exhibit spinel structures. Previous studies described the sol–gel process as an efficient way for the synthesis of mixed metal oxides with a high surface area, high purity, and good chemical homogeneity.22
However, the conventional sol–gel method is based on metal alkoxides as precursors, which is not straightforward for the preparation of mixed metal oxides. The difficulty results from the different susceptibility to hydrolysis for most alkoxide precursors, resulting in inhomogeneous morphologies and a nonuniform metal distribution.
Metal salts (e.g., chlorides or nitrates) that can form complexes of the type [M(H2O)6]n+ after dissolution in an aqueous solution offer an alternative to alkoxides. Their usage as precursors for the sol–gel process was first described by Gash et al.23 Gelation was induced through the addition of “proton scavengers” such as epoxides that cause the deprotonation of the aqueous complex while undergoing an irreversible ring opening reaction itself. Whereas the slow increase of the pH value causes uniform hydrolysis, the deprotonated metal complexes undergo condensation reactions via oxolation and olation, forming dimers. These are followed by trimers that can further condense to form larger ionic structures.24
In general, the sol–gel synthesis leads to the formation of mesoporous mixed metal oxides with a high surface area. However, an important feature of solid catalysts is the cooperation of high surface area and efficient mass transfer. To enable this interaction, the creation of a hierarchical pore structure by incorporating an additional macropore system is a promising technique.25 Nakanishi et al. first reported the polymerization-induced phase separation during gelation as an approach to obtain an additional macropore system.26 A polymeric component [polyethylene oxide (PEO)] is added to the initial sol, which forms a second, separated phase during the gelation. The driving force of the phase separation is an increased Gibbs free energy resulting from a compositional change due to the increased condensation of the inorganic species (sol) during the sol–gel transition. The subsequent loss of mixing entropy results in a decreased stability of the entire system. As a consequence, a phase-separated system with two interconnected phases is formed, consisting of the condensed inorganic phase and the organic polymer phase, while the solvent is homogeneously distributed in both phases.27 A macroporous interconnected network of mesoporous struts is obtained after the thermal removal of the polymeric phase.
Such a hierarchical pore structure based on a macroporous network formed by the phase separation and the mesopores that are formed during the sol–gel-transition are highly advantageous in the field of heterogeneous catalysis.28 The small mesopores can act as reaction pores and thereby increase the specific surface area significantly. Because of the larger macropores, a very efficient mass transfer to and from the reaction pores can be achieved, which can suppress diffusion limitation often present during catalytic reactions.29
The combination of epoxide-mediated sol–gel synthesis and polymerization-induced phase separation establishes access to various different mixed metal and nonmetal oxides with a hierarchical pore structure. Preceding studies featured the preparation of macroporous Al2O3 doped with Cr3+ and hierarchically structured Mullite (3Al2O3·2SiO2).30,31 Most recently, iron-based aerogels with a spinel structure (ABET = 150 to 270 m2·g–1) were successfully prepared starting from chloride salts of the first row d-block elements (Co, Ni, Cu, and Zn).32 Ferrite spinels with different spinel structures (inverse spinel: CoFe2O4 and NiFe2O4; normal spinel: ZnFe2O4; mixed spinel: CuFe2O4) were detected via X-ray diffraction (XRD). The preparation of hierarchically structured iron-based xerogel monoliths by the addition of poly(acrylamide) (PAAm) as a porogen was first described in 2013 and later extended to the preparation of macroporous zinc ferrite.33,34 Depending on the solvent composition and PAAm concentration, well-defined macropore morphologies were obtained with pore sizes between 1300 and 1900 nm for iron oxide xerogels and between 550 and 1290 nm for zinc ferrite xerogels. Furthermore, additional micropores were generated by removing fine carbon particles formed during calcination under an argon stream. The iron oxide monolith’s Brunauer–Emmett–Teller (BET) surface area was found to be between 5 and 262 m2·g–1.
However, to the best of our knowledge, to this day, there are no reports of hierarchically structured spinel systems composed of NiAl2O4 and CoAl2O4 and their applicability. Herein, we report the preparation of NiAl2O4 and CoAl2O4 by the epoxide-mediated sol–gel synthesis accompanied by polymerization-induced phase separation. Furthermore, the catalytic properties of NiAl2O4 in the DRM were investigated.
Results and Discussion
Modification of the Synthesis Procedure
The preparation of hierarchically structured alumina materials with adjustable macropore sizes, based on the method of Tokudome et al.,37 was only possible for a small amount of PEO in the reaction mixture. Higher amounts of PEO led to the absence of an interconnected structure and a particle-like morphology in the final product. The synthesis, as described by Tokudome et al.,37 was carried out at room temperature, at which the pH increased rapidly from 0.5 (solution of AlCl3·6H2O in EtOH/H2O) to 2.5. Hence, gelation was completed within 3 min after the addition of propylene oxide (PO) (Figure 1). In contrast to that, aluminum hexaqua complexes were stable up to a pH of 3.38 Therefore, the complete gelation of the Tokudome-based system at pH < 3 can be attributed to the steadily increasing temperature up to 313 K because of the exothermic ring opening of PO during hydrolysis. The rapid gelation fixes the system (sol–gel-transition) prior to the complete phase separation. Consequently, the macropore morphology cannot be controlled exactly.
Figure 1.
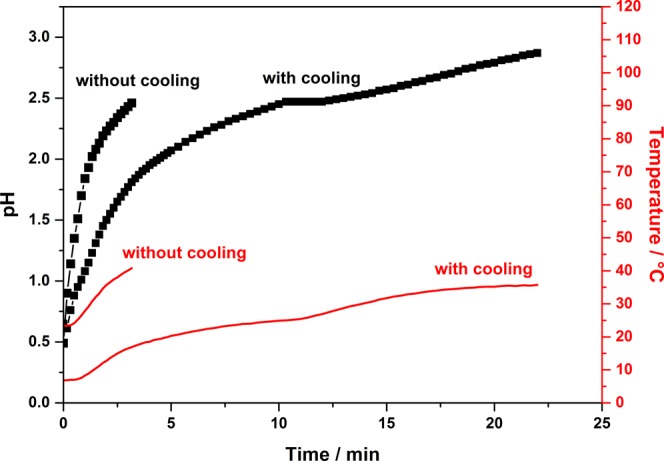
Behavior of pH (black) and temperature (red) over the reaction time for the AlCl3·6H2O sol–gel system (without addition of NiCl2·6H2O or CoCl2·6H2O) without cooling, as suggested by Tokudome et al.,37 and with cooling of the initial sol to 278 K prior and during the addition of PO.
The gelation process was decelerated by cooling the system to 278 K prior to the addition of PO, thus leading to a pH of 2.5 after 15 min and a completed gelation after an elongated time of 25 min at pH 2.9 (Figure 1). This difference in the gelation time to the original protocol37 is significant to control the development of the macropores.
A prolonged gelation time leads to a fully phase-separated system and the possibility to control the macropore morphology by variation of the polymer content. The so-called interconnected structures of the macropores and the mesoporous alumina skeleton can be achieved over a wide range of the PEO content. Mercury porosimetry (not shown) indicated no altering effect on the mesopore structure; the pore diameter remains constant at 8 nm. The modification of the procedure (cooling) has nearly no effect on the macropore size, which can be varied between 500 and 2000 nm depending on the PEO content. The extended gelation time increases the number of generated macropores and mesopores, which is indicated by the pore volume that is twice as large as observed by Tokudome.37
Ni–Al System
The measured contents of Ni and Al are in good agreement with the calculated Ni and Al contents from the initial mass of NiCl2·6H2O and AlCl3·6H2O [inductive coupled plasma-optical emission spectroscopy (ICP-OES) results shown in the Supporting Information, Table S1]. For all samples, the deviation is ≤ 6%, at which an increasing Ni content results in a smaller deviation. A linescan during the scanning electron microscopy–energy-dispersive X-ray spectroscopy (SEM-EDX) measurement (see the Supporting Information, Figure S1) shows a similar intensity profile for the Kα1 emission of Ni and Al atoms over the surface. This indicates a homogeneous distribution of Ni in the Al2O3 matrix.
The Ni–Al system underwent several color changes during the synthesis. Prior to gelation, the solution of NiCl2·6H2O and AlCl3·6H2O had a clear green color, which changed to blue during gelation and back to green for the dried monolith. The intensity of the samples’ color depends on the Ni content; hence the green color of the samples with 33 mol % Ni was more intense than that of the samples with 3 mol % Ni. Finally, the monoliths exhibited a blue color after calcination at 1223 K for 12 h, which is typical for NiAl2O4.
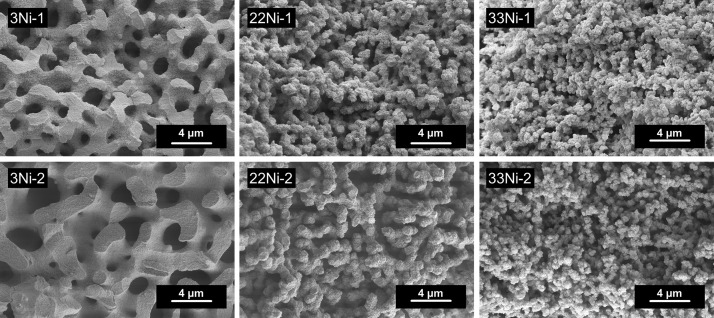
SEM images were recorded to investigate the morphologies. Thereby, a well-defined interconnected alumina network (Figure 2 left) was found for the samples with 3 mol % Ni (3Ni-1, 3Ni-2). With increasing Ni content, the macropore structure is maintained but exhibits a more particulate shape, as seen for 22Ni and 33Ni (Figure 2 middle and right). Because of an increased amount of PEO (3.5 × 10⁻⁶ mol %) in the second synthesis approach of 3Ni-2, 22Ni-2, and 33Ni-2, the phase separation is promoted,37 and consequently, the resulting macropores are enlarged in contrast to the samples from the first synthesis approach with 2.8 × 10⁻⁶ mol % PEO (3Ni-1, 22Ni-1, and 33Ni-1). This behavior is the most notable on comparing the SEM images of the 3Ni samples (Figure 2 left). The morphology of the macropore system of the samples with the highest Ni content (33Ni-1 and 33Ni-2) exhibits a pure particulate structure.
Figure 2.
SEM images of samples with increasing Ni content (left to right) and increasing PEO content (top to bottom).
The effect of Ni and PEO contents on the pore morphology was investigated with mercury porosimetry (Table 2). An increased PEO content at a constant Ni content leads to larger macropores because the tendency toward phase separation is increased.37 The pore diameter of 3Ni increases from 1040 nm for 3Ni-1 to 1396 nm for 3Ni-2. Nevertheless, the volume of the phase separation-based pores (macropores) is nearly unaffected by an increasing PEO content and ranges between 0.59 and 1.17 cm3·g–1 for all samples. The macropore size decreases significantly with increasing Ni content, while keeping the PEO content stable. As can be seen in Table 2, the macropores shrink, for example, from 1040 nm (3Ni-1) to 547 nm (33Ni-1) and from 1396 nm (3Ni-2) to 662 nm (33Ni-2). Thereby, the macropore volume increases with increasing Ni content from 0.76 to 1.17 cm3·g–1 (3Ni-1 and 33Ni-1) and from 0.59 to 1.15 cm3·g–1 (3Ni-2 and 33Ni-2).
Table 2. Textural Properties of Samples with Different Ni and PEO Contents (from Mercury Porosimetry) and BET-Surface Areas (from Nitrogen Sorption) for the Ni–Al System After Calcination at 1223 K.
| macroporesa |
mesoporesb |
BET surface area | |||
|---|---|---|---|---|---|
| sample | dP,modal/nm | VP/cm3·g–1 | dP,modal/nm | VP/cm3·g–1 | ABET/m2·g–1 |
| 3Ni-1 | 1040 | 0.76 | 11.9 | 0.43 | 137 |
| 22Ni-1 | 686 | 1.13 | 11.8 | 0.34 | 110 |
| 33Ni-1 | 547 | 1.17 | 16.0 | 0.31 | 73 |
| 3Ni-2 | 1396 | 0.59 | 11.7 | 0.44 | 138 |
| 22Ni-2 | 883 | 1.03 | 10.8 | 0.31 | 110 |
| 33Ni-2 | 662 | 1.15 | 14.4 | 0.29 | 74 |
Macropores between 50 and 10 000 nm pore size.
Mesopores below 50 nm pore size.
This behavior is based on the influence of Ni on the sol–gel process: because the Ni precursor (NiCl2·6H2O) exhibits a different hydrolysis and condensation behavior compared to the Al precursor (AlCl3·6H2O), the sol–gel-transition and the resulting phase separation are affected by the amount of Ni in the sol. The macropore morphology can further be affected by the formation of Ni–PEO complexes that can delay the onset of the phase separation.39 Thus, at the point of the sol–gel-transition, the system is fixated in an early stage of phase separation, with smaller pores, higher pore volume, and higher number of pores. Regarding the mesopore morphology, there is no distinct tendency for the pore diameter. The differences are in the range of the methodical error. However, a decreasing mesopore volume at elevated Ni contents reflects an interference of Ni on the sol–gel-transition. Nevertheless, a higher degree of Ni integration into the Al2O3 network can be observed with increasing Ni concentration.
Besides mercury porosimetry, nitrogen sorption was applied to investigate the pore structure of the samples and to determine the BET surface area. Nitrogen sorption reveals type IV isotherms with a H1 hysteresis loop for all samples, as can be seen in Figure 3. In accordance with the results from mercury porosimetry, the pore volume ranges from 0.3 to 0.4 cm3·g–1. Furthermore, a decreasing specific surface area from 138 to 74 m2·g–1 at a constant polymer and increasing Ni content (Table 2) can be observed. This behavior directly correlates with the decreased mesopore volume in 33Ni-2 compared to 3Ni-2. The decrease of the pore volume by 33% together with a nearly unchanged mesopore diameter indicates a higher porosity in 3Ni-2, which results in a higher BET surface area. Furthermore, the increase of PEO as a porogen and a subsequent enlargement of the macropores do not influence the BET surface area significantly.
Figure 3.
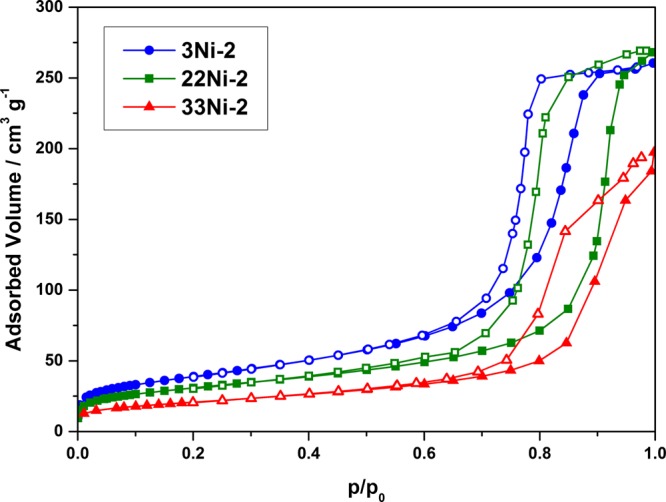
Nitrogen sorption isotherms of the Ni–Al samples at different Ni contents (●, ■, and ▲: adsorption branch; ○, □, and △: desorption branch).
The materials’ crystal phases were studied by XRD with respect to a varying Ni–Al molar ratio (Figure 4). The material with the lowest Ni content (3Ni) features solely γ-Al2O3 reflections, which is characterized by a defective spinel structure. Here, several tetrahedral and octahedral voids are vacant compared to the normal spinel structure.8 Therefore, the reflections of γ-Al2O3 are similar to the reflections of NiAl2O4, but shifted by 2° to higher 2θ values. In the case of 22Ni, the reflections are slightly shifted to lower 2θ values and lie between the typical reflections of NiAl2O4 and γ-Al2O3. This indicates that a mixed phase exists, containing NiAl2O4 and γ-Al2O3. The assumption is confirmed by the disappearance of the typical γ-Al2O3 reflection at 37.6° 2θ with increasing Ni content. The slight shift between the typical reflections may result from the integration of Ni in the γ-Al2O3 network. At the hypostoichiometric Ni contents (22 mol %), Ni occupies the defects in the defect spinel structure of γ-Al2O3 and forms the spinel. The integration of Ni results in a distortion of the γ-Al2O3 structure and the shift toward lower 2θ values. In the case of the exact spinel composition of 33 mol % Ni (33Ni), the reflections can be attributed primarily to the NiAl2O4 phase. The ratio of the reflection intensities of 37° and 45° 2θ further proves the presence of the spinel phase. In γ-Al2O3, the intensity ratio is 1.6:1 for the aforementioned reflections, whereas it is 2.6:1 for NiAl2O4. The latter ratio was found in the XRD pattern of the exact spinel composition with 33 mol % Ni. Still, this sample features additional reflections at 43.3°, 62.8°, and 75.4° 2θ, which can be attributed to the formation of NiO. “Excess” Ni that was not integrated into the structure accumulated on the surface of the sample and was oxidized during calcination, which is manifested by the formation of a green layer on the outside of the sample.8
Figure 4.
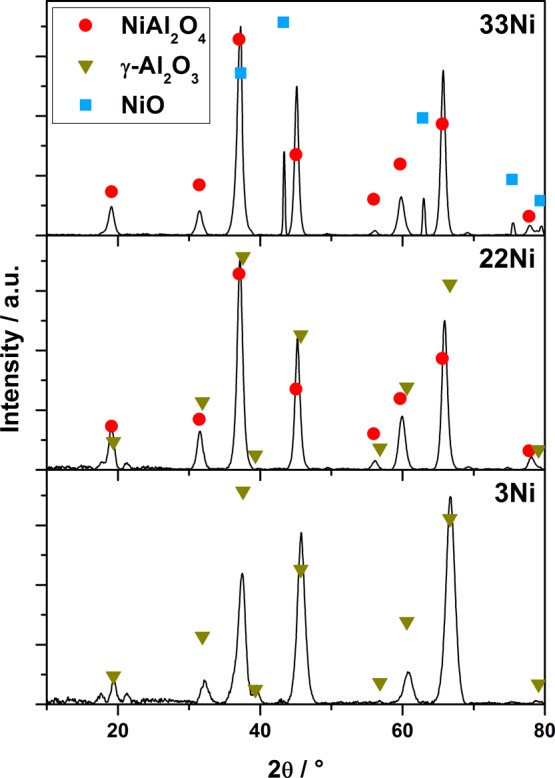
XRD patterns of Ni–Al samples with Ni contents of 3, 22, and 33 mol % (bottom to top).
The existence of NiAl2O4 rather than a mixture of NiO and Al2O3 was further confirmed by ultraviolet–visible (UV–Vis) spectroscopy. Bands from 360 to 380 nm and from 550 to 700 nm (Figure 5) were detected. These bands were shifted toward higher wavelengths with increasing Ni content. Additionally, the intensity of the absorption bands becomes more pronounced with increasing Ni content. Here, 3Ni features only weak bands between 550 and 650 nm, which are more dominant for 22Ni and 33Ni. The recorded spectra are in good accordance with the literature.40,41 Nevertheless, additional bands are described at 260, 325, and 710 nm.41 As can be seen in Figure 5, these bands are visible as shoulders at 320 and 720 nm for 22Ni and 33Ni, respectively. According to the literature,8,40,41 the bands can be assigned to different electron transitions in the ligand field. The bands at 380 nm [3A2g(F) → 3T1g(P)] and 715 nm [3A2g(F) → 3T1g(F)] can be assigned to the octahedral coordination of Ni2+. But the doublet at 600 and 640 nm, as visible in Figure 5, indicates Ni2+ in a tetrahedral coordination.40,41 The existence of Ni2+ in both octahedral and tetrahedral coordinations further proves the presence of NiAl2O4 and confirms a disordered spinel structure.8
Figure 5.
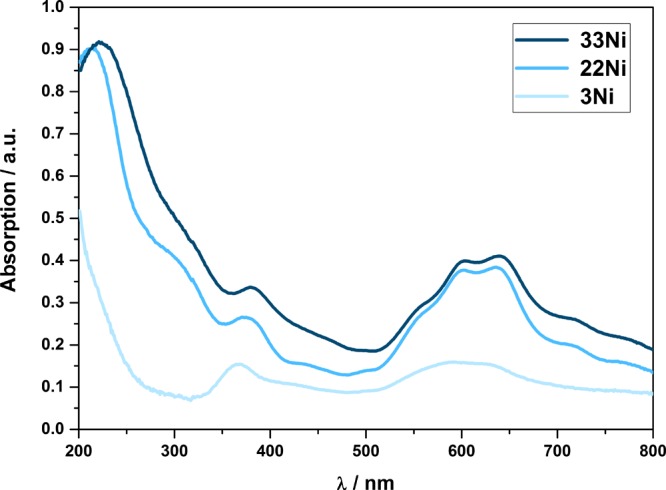
UV–vis spectra of the Ni–Al samples.
Co–Al System
The ICP-OES (see the Supporting Information, Table S2) results reveal a deviation of only 2% between the measured and calculated Co and Al contents from the initial mass of CoCl2·6H2O and AlCl3·6H2O. The good agreement between both values indicates that nearly no Co species was extracted during the washing process of the gelated bodies. Furthermore, the small deviation and the uniform color of the calcined samples denote that Co is homogeneously distributed in the Al2O3 network, without the occurrence of the clustered Co species. Additionally, the distribution of Co and Al was investigated by SEM-EDX linescans (Supporting Information, Figure S2). As it was found for the Ni–Al system, the emission profiles of Kα1 radiation for Co and Al over the scanned surface are comparable, indicating a homogeneous distribution of both species.
Similar to the Ni–Al system, the samples in the Co–Al system underwent several color changes during the synthesis. Prior to gelation, the solution of CoCl2·6H2O and AlCl3·6H2O had a dark blue color. The intensity of the color thereby depended on the Co content, being more intense for higher Co concentrations. The addition of PO caused a slow color change from blue to purple and eventually to pink. Drying at 323 K and calcination at 1323 K finally led to a color shift back to blue. In analogy to the Ni–Al system, the calcined sample with the highest Co content (33Co) exhibited a dark olive colored layer on the outside that indicates the existence of additional cobalt oxide species. The specific color corresponds to the coordination of Co2+. Tetrahedrally coordinated Co2+ exhibits a blue color, as seen in the solution of CoCl2·6H2O, whereas an octahedral coordination of Co2+ is indicated by a pink coloration,8 comparable to the color of the observed gel body. In an aqueous ethanol solution of CoCl2·6H2O, an equilibrium of cobalt exists, consisting of the hexaqua complex [Co(H2O)6]2+ (octahedral) and the tetrachloro cobaltate(II) complex [CoCl4]2– (tetrahedral). A slow increase of the pH value was achieved after the addition of PO, and a subsequent consumption of Cl– occurs because of the irreversible ring opening and formation of 1-chloro-2-propanol.23 The consumption of Cl– results in a shift of the equilibrium toward octahedrally coordinated Co2+ (pink color). During calcination, the typical cobalt blue spinel CoAl2O4 is formed in which Co2+ now occupies the tetrahedral voids.8
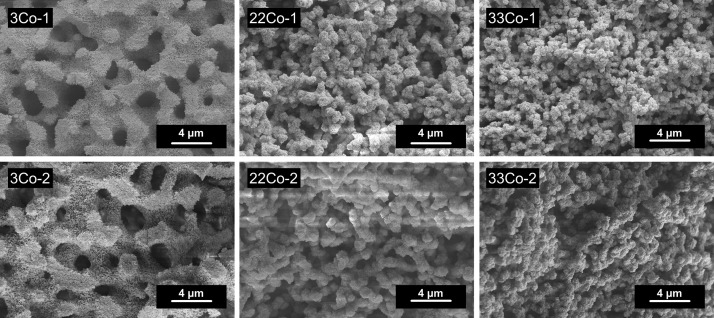
As seen in the SEM images (Figure 6), a change of the alumina network comparable to those of the Ni–Al system can be observed. The addition of Co2+ influences the morphology of the macropore structure: low Co contents (3Co-1, Figure 6 left) result in a well-defined interconnected structure with distinct struts. In case of higher Co contents (33Co-1 and 33Co-2), an interconnected structure with a more particle-like shape (Figure 6 right) is obtained. Besides higher Co contents, increasing the PEO content to 3.5 × 10⁻⁶ mol % resulted in a particular shape of the macropore structure (Figure 6 bottom row) because of an increased tendency toward phase separation.
Figure 6.
SEM images of samples with increasing Co content (left to right) and increasing PEO content (top to bottom).
Mercury porosimetry (Table 3) of the Co–Al system reveals tendencies in the macropore morphology similar to the Ni–Al system: at a higher PEO content, the macropore size increases, whereas the pore volume shows no specific tendency and ranges for all samples between 0.80 and 1.30 cm3·g–1. A decreasing macropore size to less than the half of the width was observed on increasing the Co content from 3 to 33 mol % and keeping the PEO amount constant. Hence, no effect on the pore volume was found. The integration of Co into the Al2O3 network can influence the sol–gel-transition and subsequently the phase separation because of the different hydrolysis and condensation behavior of the Co precursor (CoCl2·6H2O) compared to the Al system (AlCl3·6H2O). This effect is only reflected by a sharp decrease of the mesopore volume by 79–80%. However, regarding the mesopore diameter, there is no tendency observable. The Co system is more sensitive and susceptible to system changes, which leads to stronger deviations under slightly varying synthesis conditions (temperature) or Co precursor masses. The result is a higher variation of the mesopore diameter compared to the Ni system.
Table 3. Textural Properties of Samples with Different Co and PEO Contents (from Mercury Porosimetry) and BET Surface Areas (from Nitrogen Sorption).
| macroporesa |
mesoporesb |
BET surface area | |||
|---|---|---|---|---|---|
| sample | dP,modal/nm | VP/cm3·g–1 | dP,modal/nm | VP/cm3·g–1 | ABET/m2·g–1 |
| 3Co-1 | 1134 | 1.26 | 31.2 | 0.75 | 90 |
| 22Co-1 | 665 | 0.98 | 18.9 | 0.26 | 72 |
| 33Co-1 | 547 | 0.97 | 25.1 | 0.16 | 18 |
| 3Co-2 | 1311 | 0.79 | 21.2 | 0.46 | 94 |
| 22Co-2 | 820 | 0.97 | 16.3 | 0.28 | 74 |
| 33Co-2 | 594 | 0.83 | 32.2 | 0.09 | 25 |
Macropores between 50 and 10 000 nm pore size.
Mesopores below 50 nm pore size.
Nitrogen sorption of the material reveals type IV isotherms, as shown in Figure 7. The BET surface area, also obtained from the nitrogen sorption measurements, shows a direct correlation with the Co content. The sample 3Co-2 exhibits a specific surface area of 94 m2·g–1, whereas 33Co-2 exhibits a surface area of only 25 m2·g–1. The structural change of the macropore morphology from an interconnected to a particle-like structure plays just a marginal role in the decrease of the surface area. Hence, the significant reduction of 65% at higher Co concentrations can be correlated with the strongly decreasing mesopore volume. Here, a loss of ∼80% from 0.46 cm3·g–1 (3Co-2) to 0.09 cm3·g–1 (33Co-2) was found. The loss of mesopore volume is sharper compared to that of the Ni–Al system, and therefore, the reduction of the surface area is more pronounced in the Co–Al system. These findings indicate a strong interference of Co2+ during the sol–gel-transition. Another reason for the decreasing BET surface areas at high Co concentrations could also be the nonporous Co species enriched at the monoliths’ outer layer.
Figure 7.
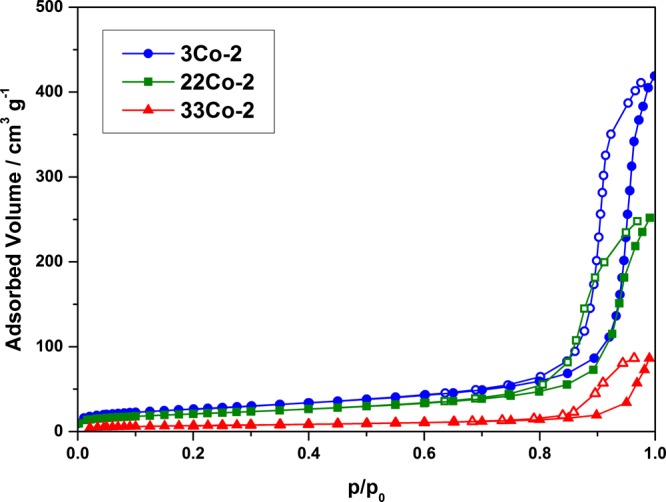
Nitrogen sorption isotherms of the Co–Al samples at different Co contents (●, ■, and ▲: adsorption branch; ○, □, and △: desorption branch).
In general, comparable XRD patterns were observed for the different Co–Al samples (Figure 8). Compared to γ-Al2O3, the reflections of CoAl2O4 are shifted only 0.5°–2° toward lower 2θ values. In the case of the Co-poor sample (3Co), two different alumina species, namely γ- and θ-Al2O3, can be found (Figure 8 bottom). Whereas all reflections are shifted to lower 2θ values with increasing Co content (22Co and 33Co), the θ-Al2O3 phase cannot be detected anymore. The intensity of the reflections at 45°, 60°, and 66° is changed from γ-Al2O3 in favor of CoAl2O4. Furthermore, the position and intensity of the reflexes at 31.2°, 36.8°, 59.2°, and 65.1° can be clearly assigned to the spinel phase, thus indicating a mixture of γ-Al2O3 and CoAl2O4 in 22Co and primarily CoAl2O4 in 33Co. An additional XRD pattern of the dark olive green layer deposited on the outside of the 33Co monolith was recorded. A close-up look at the reflections at 2θ = 31.2°, 36.8°, 55.5°, 59.2°, and 65.1° indicates the presence of an additional crystal phase formed during calcination (Figure 9). It can be assumed that the double reflections originate from CoAl2O4 and because of an excess of Co (also Co3O4). The latter are shifted by 0.2° to higher 2θ values. In case of the reflections at 31.2° and 36.8° 2θ, Co3O4 only appears as a shoulder of the typical CoAl2O4 reflection. Looking back at the nitrogen sorption results, this nonporous Co3O4 phase, enriched on the outer layer of the monoliths, might promote the effect of the decreasing surface area for Co rich samples.
Figure 8.
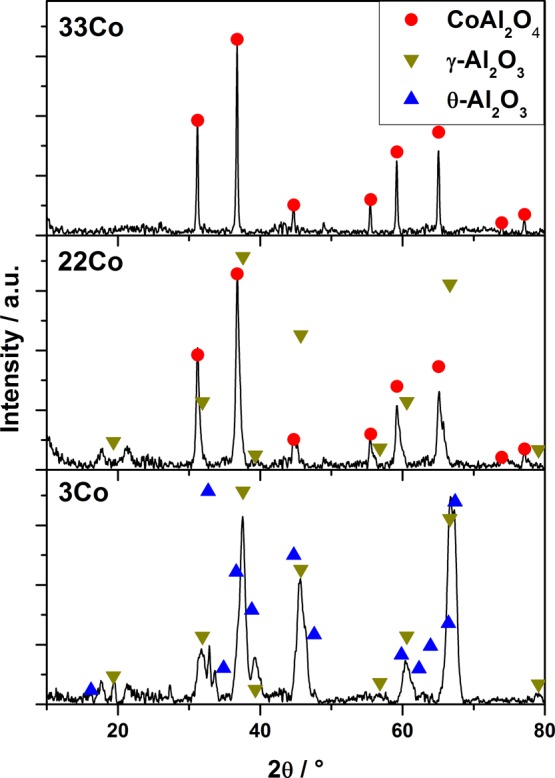
XRD pattern of Co–Al samples with Co contents of 3, 22, and 33 mol % (bottom to top).
Figure 9.
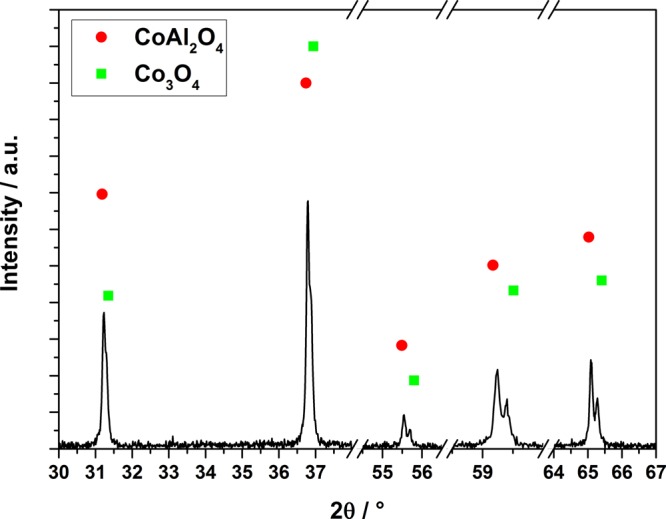
Magnified XRD pattern of the outer layer of 33Co with CoAl2O4 and Co3O4 reflections.
In the cobalt aluminum spinel, Co2+ can exist in both tetrahedral and octahedral coordinations. In the octahedral field, both high- and low-spin configurations occur. Nevertheless, Co2+ prefers the tetrahedral coordination because of the weak octahedral stabilization energy and the high energetic stabilization of the half- and fully occupied orbitals of this (high-spin) coordination.8 In the UV–vis spectra (Figure 10), three distinctive bands at wavelengths between 500 and 700 nm as well as two smaller bands between 400 and 500 nm can be identified. With increasing Co content, the intensity of the band at 480 nm increases, whereas the intensity of the band at 408 nm decreases. Furthermore, the bands at 550 and 580 nm and their corresponding transitions [4A2(F) → 4T1(P) and 4A2(F) → 2T(G)] are shifted to higher wavelengths and can be assigned to tetrahedrally coordinated Co2+.3,42,43 An additional band between 300 and 400 nm, visible as a shoulder, was recorded for 33Co. This band can be attributed to Co2+ occupying octahedral voids and forming a partially inverse spinel3,44,45 or to the Co3O4 phase formed from excessive Co2+.
Figure 10.
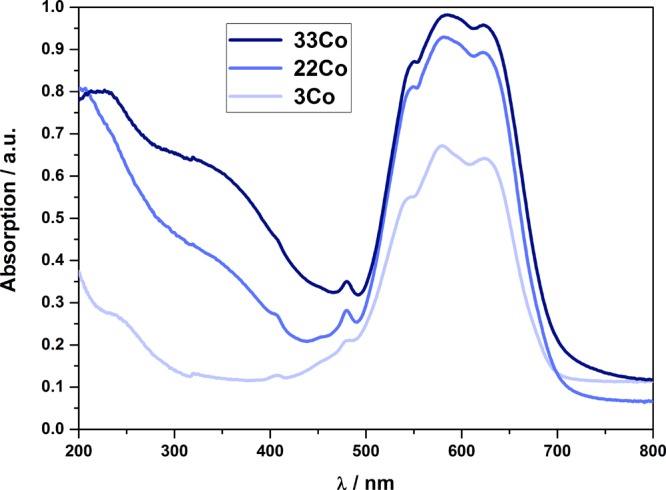
UV–vis spectra of the Co–Al samples.
DRM
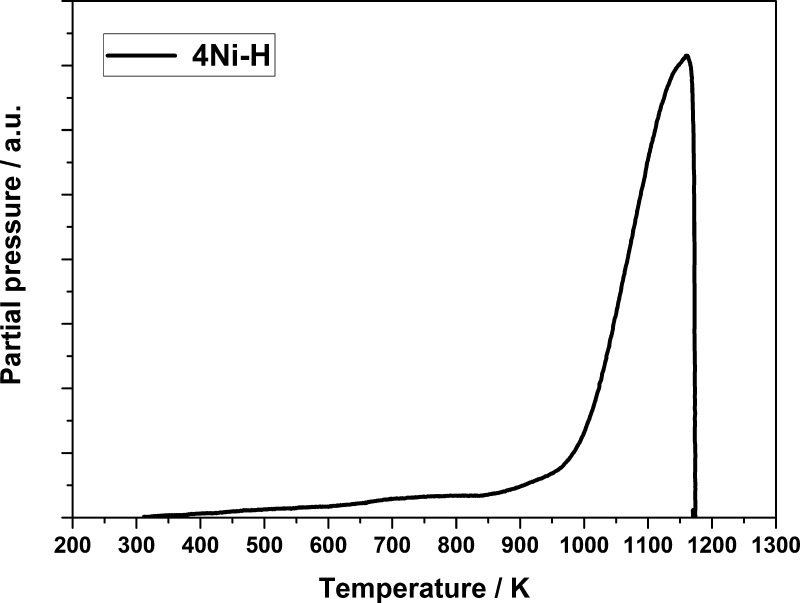
It was investigated whether the hierarchical pore structure of the Ni spinel-based materials leads to an enhanced catalytic activity in the DRM with CO2 compared to a Ni catalyst with a monomodal pore structure.46 Recently published articles suggest that the CH4 conversion using sol–gel-based NiAl2O4 is higher compared to catalysts prepared by other methods (e.g., impregnation).47−49 The sol–gel synthesis leads to a higher dispersion of the active phase and prevents the formation of agglomerates.50 No NiO reflections were observed in the XRD patterns at lower Ni contents, and Ni was integrated into the alumina matrix during preparation. Thereby, the Ni spinel is formed, which on comparison to bulk NiO is only hardly reducible because of very strong metal-support interactions. As can be seen in Figure 11, NiO is primarily present in the spinel phase (Tred > 1000 K). Bulk NiO (Tred = 600 K) was not observed and only traces of NiO were detected by temperature-programmed reduction (TPR). These NiO traces show weak interactions to the γ-Al2O3 phase and are not bound to the spinel phase.
Figure 11.
TPR profile of 4Ni–H.
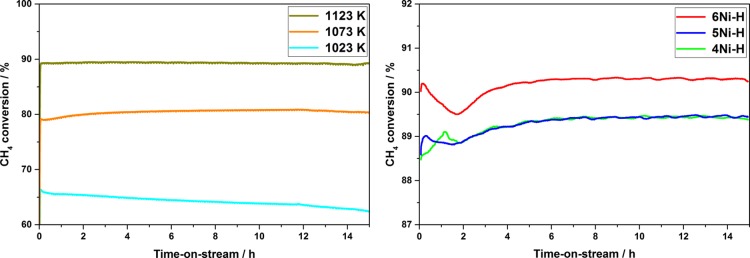
In a first step, DRM was studied over the hierarchical structured catalyst containing 4 mol % Ni (4Ni–H). The reaction temperature was varied in steps of 50 K from 1023 to 1123 K at an overall gas hourly space velocity (GHSV) of 6000 h–1. As can be seen in Figure 12 (left), the catalyst containing 4 mol % Ni shows a high activity without the occurrence of an activation period, as it is often observed for other Ni-containing catalysts.35,51 Because of the endothermic nature of the reaction, increasing CH4 and CO2 conversions at elevated reaction temperatures can be observed. Therefore, the CH4 conversion of 62% at 1023 K increases to 80% at 1073 K and even to 90% at 1123 K. The catalytic conversion is near the thermodynamic equilibrium (XCH4 = 94.6%) at 1123 K. Only sample 4Ni–H shows a decreasing CH4 conversion over the time-on-stream (TOS) of 15 h at the lowest reaction temperature, indicative of catalyst deactivation.
Figure 12.
CH4 conversion in the dry reforming over 4Ni–H (4 mol % Ni) at 1023, 1073, and 1123 K (left) and CH4 conversion at 1123 K over 4Ni–H, 5Ni–H, and 6Ni–H (4, 5, and 6 mol % Ni) (right) (because of the higher magnification in the right graph, the decrease at ∼2 h becomes more evident).
To investigate the effect of the Ni content on the catalytic activity, catalysts with slightly varying Ni contents were investigated in the DRM at 1123 K (Figure 12 right). The catalysts 4Ni–H, 5Ni–H, and 6Ni–H (4, 5 and 6 mol % Ni) all had a high initial activity, whereas the CH4 conversion increases with increasing metal content (88.5% for 4Ni–H to > 90% for 6Ni–H). But in all cases, the CH4 conversion goes through a slight minimum at ∼2 h TOS with a decrease of 0.2–0.5%. This behavior is often observed for Ni-containing DRM catalysts.51,52 Nevertheless, after 15 h TOS, 4Ni–H and 5Ni–H show a nearly identical CH4 conversion of around 89%, whereas a slightly increased Ni content of 6 mol % (6Ni–H) results in a CH4 conversion of 90% after 15 h TOS. Therefore, the effect of the metal content on the hierarchical catalysts is negligibly low and well within the experimental error.
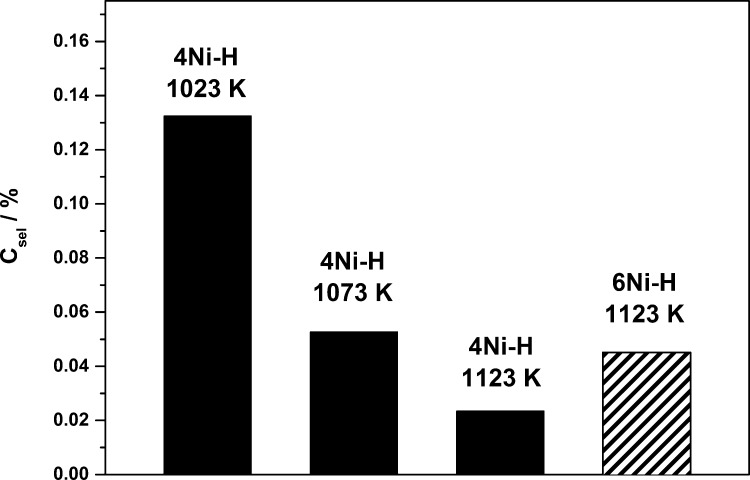
During the dry reforming, undesired side reactions occur; whereas the reverse water gas shift reaction causes a syngas molar ratio of < 1, CH4 decomposition and Boudouard reaction often result in the deactivation of the catalyst because of the extensive carbon formation on the surface of the active phase. With focus on the amount of deposited carbon, 4Ni–H (4 mol % Ni) accumulates less carbon than both the other catalysts. Still, values of ≤ 0.1 g·g–1 carbon per catalyst mass for all three samples show the high potential of the hierarchical catalysts toward carbon suppression. The amount of carbon deposited via CH4 decomposition was summarized as carbon selectivity (Csel), as can be seen in Figure 13 for several samples. Here, the effect of the reaction temperature was also taken into account (reduction temperature 1023 K). As expected, the Csel directly correlates with the reaction temperature because DRM is a highly endothermic reaction, and the side reaction cannot be suppressed below 1023 K. The exothermic Boudouard reaction is most prominent at lower temperatures, whereas endothermic CH4 decomposition occurs at elevated temperatures.53 The Csel is significantly decreased if the reaction temperature is elevated by 50 K. Besides the effect of the reaction temperature, elevated Ni contents enhance the carbon formation tendency. When the Ni content is increased from 4 to 6 mol %, the Csel is raised from 0.02 to 0.04% (Figure 13), which can be attributed to a larger number of active sites on the catalyst with the higher Ni content.
Figure 13.
Csel for 4Ni–H and 6Ni–H at temperatures of 1023, 1073, and 1123 K.
Generally, noble metal-containing catalysts show high conversions and a low tendency to deactivate. To compare the pure Ni catalysts to a noble metal catalyst, a spinel containing 0.5 mol % Rh and 3 mol % Ce as promoters in addition to 4 mol % Ni was prepared.
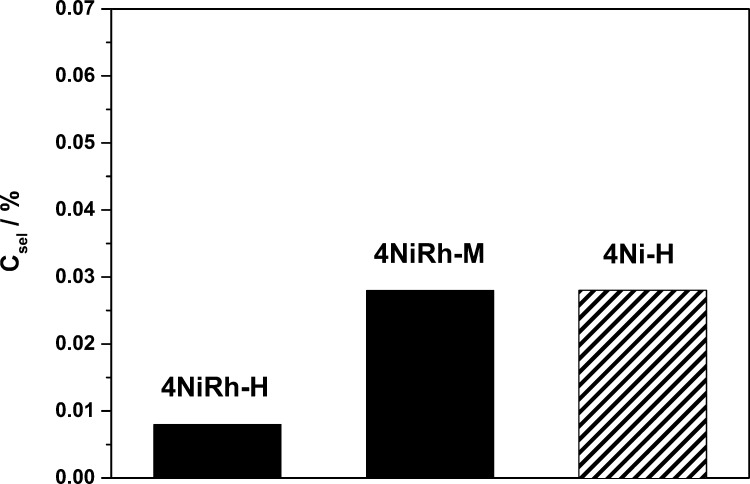
Figure 14 shows an increased conversion over the complete TOS for 4NiRh–H and 4Ni–H compared to 4NiRh–M, which is only mesoporous. In the presence of additional macropores, the conversion is higher by 3%, that is, ∼90%. This shows the potential of DRM catalysts with a hierarchical pore structure. Furthermore, under equivalent reaction conditions (1123 K, GHSV = 6000 h–1), the direct comparison between the hierarchical Rh-containing catalyst 4NiRh–H and the noble metal-free catalyst 4Ni–H shows the absence of a conversion minimum and a higher conversion of 4NiRh H during the first 4–5 h TOS. After 5 h TOS, 4NiRh–H and 4Ni–H show comparable CH4 conversions of ∼90%. Both catalysts have a hierarchical pore structure and comparable specific surface area (> 150 m2·g–1) and yielded equivalent CH4 conversions and molar ratio of the resulting syngas. Because of an already high level of DRM activity and low carbon formation tendency, it can be assumed that the influence of the noble metal and promoter can be neglected. The hierarchical spinel containing only Ni can be seen as a promising alternative to the more expensive noble metal catalyst. Even though the syngas molar ratio (not shown) was comparable for 4NiRh–H and 4NiRh–M, nearly double the amount of carbon and twice as high Csel were found for the monomodal, mesoporous catalyst 4NiRh–M (Figure 15).
Figure 14.
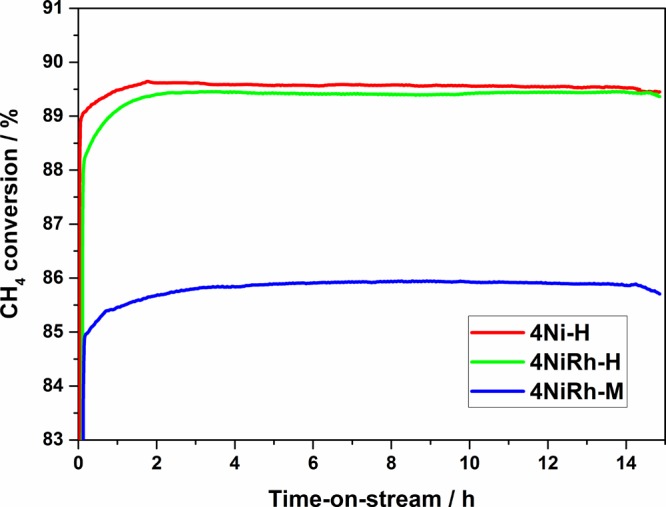
XCH4 at 1123 K over TOS of 15 h for 4Ni–H (4 mol % Ni, meso- and macroporous), 4NiRh–H (4 mol % Ni, 0.5 mol % Rh, meso- and macroporous), and 4NiRh–M (4 mol % Ni, 0.5 mol % Rh, mesoporous).
Figure 15.
Csel for 4NiRh–H, 4NiRh–M, and 4Ni–H at 1123 K.
Comparing 4NiRh–H and 4Ni–H, it needs to be mentioned that the noble metal-containing hierarchical catalyst accumulated less carbon compared to the noble metal-free catalyst. This is indicated by a Csel, which is decreased by a factor of 3.5 for 4NiRh–H compared to 4Ni–H. But looking at 4NiRh–M, a comparable tendency to deposit carbon was found, similar to the hierarchical catalysts with only 4 mol % Ni. Hence, the addition of the macropore network allows the noble metal-free catalyst to challenge the mesoporous Rh-containing catalyst. Nevertheless, elevated CH4 conversions and negligibly low carbon formation tendency (< 0.1 g·g–1 carbon per catalyst mass), without significant deactivation, was found for all studied (hierarchical) catalysts during the DRM over 15 h TOS.
Conclusions
Here, the preparation of hierarchically structured spinels of the type MAl2O4, based on Ni and Co, via an epoxide-mediated sol–gel synthesis is reported. The addition of PEO leads to a polymerization-induced phase separation and the formation of macropores in the range of 547 to 1396 nm for the Ni–Al system and 547 to 1311 nm for the Co–Al system. A variation of the macropore size is possible by either changing the polymer and/or metal (Ni or Co) concentration. Generally, controlling the macropore structure was achieved with a modification of the original synthesis procedure37 because the step of initial cooling of the synthesis solution increased the gelation time significantly. The mesopores resulting from the sol–gel process exhibit diameters in the range of 11 to 16 nm. XRD and UV–vis spectroscopy proved the existence of the spinel phase and showed that the obtained NiAl2O4 systems are characterized by a disordered spinel structure, whereas the new CoAl2O4 materials have a normal spinel structure.
Furthermore, we report on the applicability of the hierarchical NiAl2O4 spinel as a high surface area catalyst for the DRM. Over the Ni spinel-based catalysts, CH4 conversions of up to 90% are reached. The catalyst, containing 4 mol % Ni and with a hierarchical pore structure, shows a comparable performance to a noble metal-containing analogue. Especially at a reaction temperature of 1123 K, the feed gas conversions and syngas molar ratio are near the thermodynamic equilibrium while only traces of carbon are deposited. On comparing 4NiRh–H and 4NiRh–M, it can be assumed that the low Csel is promoted by the hierarchical pore structure, as already suggested in the literature. The obtained results of NiAl2O4 as DRM catalysts show the potential of hierarchical Ni spinels in catalytic gas-phase reactions at elevated temperatures. Still, further investigations on the role of the macropores during the DRM reaction need to be conducted.
Experimental Section
Materials and Starting Composition
Metal chlorides as precursors, namely AlCl3·6H2O (97%, Alfa Aesar) and NiCl2·6H2O (98%, Alfa Aesar) or CoCl2·6H2O (98%, Alfa Aesar), were dissolved in a mixture of distilled water and ethanol (100%, Bioenergie Icking GmbH). Polymerization-induced phase separation was achieved by the addition of PEO (MW 900 000, Acros Organics) as a porogen, whereas PO (99.5%, extra pure, Acros Organics) was used as a gelation agent. The molar ratios of the composition are shown in Table 4.
Table 4. Molar Ratio of the Components in the Synthesis of Hierarchically Structured Spinels and the Respective Sample Names.
| Ni + Al or Co + Al | EtOH | H2O | PO | PEO contenta (MW 900 000) (mol %) | Ni or Co contentb (mol %) | Ni–Al or Co–Al molar ratio | sample name |
|---|---|---|---|---|---|---|---|
| 1 | 5.4 | 18.1 | 3.1 | 2.8 × 10⁻⁶ | 3 | 0.03 | 3Ni-1, 3Co-1 |
| 3.5 × 10⁻⁶ | 3Ni-2, 3Co-2 | ||||||
| 2.8 × 10⁻⁶ | 22 | 0.28 | 22Ni-1, 22Co-1 | ||||
| 3.5 × 10⁻⁶ | 22Ni-2, 22Co-2 | ||||||
| 2.8 × 10⁻⁶ | 33 | 0.50 | 33Ni-1, 33Co-1 | ||||
| 3.5 × 10⁻⁶ | 33Ni-2, 33Co-2 |
Based on the total amount of Ni or Co + Al + PEO.
Based on total amount of metal (Ni or Co + Al).
Regarding the samples investigated in the DRM, the Ni contents differed from the contents described in Table 4. As shown by Stolze et al.,35 a Ni content of 5 mol % proves to be suitable regarding the activity and carbon formation tendency. Therefore, samples investigated in the DRM had Ni contents of 4 mol % (4Ni–H), 5 mol % (5Ni–H), and 6 mol % (6Ni–H). The molar ratios of Ni–Al were 0.04, 0.05, and 0.06. Nevertheless, the molar ratios between the metals (Al + Ni) and EtOH (5.4), H2O (18.1), PO (3.1), and PEO (3.5 × 10⁻⁶) as well as the synthesis procedure were unaltered. Besides the Ni catalysts, samples containing noble metal promoters in addition to Ni were prepared. These were either mesoporous or hierarchically structured with a meso/macroporous network and contained 0.5 mol % Rh and 3 mol % Ce as promoter and additionally 4 mol % Ni. The samples were labeled 4NiRh–H for the hierarchical meso- and macroporous catalyst and 4NiRh–M for the mesoporous catalyst. The addition of the respective amounts of Rh and Ce was proved to enhance the CH4 conversion while decreasing the C-selectivity.36 The synthesis procedure remained unchanged, except for the addition of the respective amounts of Ce(NO3)3·6H2O (99.5%, Acros) and Rh(NO3)3·6H2O (p.a., Alfa Aesar) to the water–ethanol solution of NiCl2·6H2O and AlCl3·6H2O. The molar ratios between the metals and the residual components (EtOH, H2O, PO, and PEO) were maintained.
Synthesis
The applied synthesis protocol represents a modified version of the epoxide-mediated sol–gel route developed by Tokudome et al.37 AlCl3·6H2O, MCl2·6H2O (M = Ni, Co), and PEO were dissolved in a water–ethanol mixture and stirred thoroughly. The solution was cooled below room temperature. Afterward, PO was added quickly and stirred vigorously under cooled conditions for several minutes. In the next step, the mixture was stirred at room temperature for a certain period of time and finally transferred to a water bath. Gelation and gel aging took place at 313 K for 24 h. The obtained gel bodies were washed with ethanol and air-dried at 323 K for 7 days. Finally, the dried monoliths were calcined under an air atmosphere in a muffle furnace (Nabertherm N7/H) for 12 h at 1223 K (Ni–Al system) and 1323 K (Co–Al system) separately at a heating rate of 5 K·min–1 to obtain the hierarchically structured spinel-containing alumina network.
Characterization
SEM images were obtained using a DSM 940 and LEO GEMINI 1530 (Zeiss Germany) microscope. The samples were placed on a carbon conductor, and a layer of gold was deposited on them.
EDX was utilized to examine the homogeneous distribution of the different metals in the samples. For this procedure, the samples were embedded in epoxide resin (G1-GATAN), ground, and polished using an alumina suspension (Buehler, MasterPrep Polishing Suspension). Furthermore, the samples were etched using an argon ion beam. The samples were covered with carbon via the vapor deposition process to avoid charging effects during the experiments.
Mercury porosimetry was used to examine the pore morphology, especially the pore diameter and the pore volume. Prior to the measurements, the samples were activated at 393 K for 24 h. The characterization was conducted using a PASCAL 440 porosimeter (Fisher Scientific) with a maximum pressure of 400 kPa. A contact angle of mercury of 141.3° was applied, and the surface tension of mercury was set at 0.484 N·m–1.
Nitrogen sorption (ASAP 2000, Micromeritics) was used to determine the specific surface area (ABET), pore volume, and pore diameter, primarily for the mesopores generated during the sol–gel process. Prior to the examination, the samples were dried and activated at 523 K under ultrahigh vacuum. The determination of the specific surface area was conducted using the linearized form of the BET equation in the range of 0.05 ≤ p/p0 ≤ 0.30. The determination of the pore volume was carried out at a relative pressure p/p0 of 0.99.
The crystal structures of the samples were examined using an X-ray powder diffractometer (BRUKER D8 DISCOVER, Bruker). The samples were homogenized via ground milling. To examine the transition metal species, UV–vis spectroscopy (LAMBDA 650S, PerkinElmer) was used.
The resulting composition of the samples was characterized by ICP-OES. Prior to the examination on an OPTIMA 8000 system (PerkinElmer), the samples were solubilized in a solution of nitric, hydrochloric, sulfuric, and phosphoric acid using a microwave reactor for 100 min.
Catalytic Experiments
Selected materials were studied as catalysts in the DRM with CO2. Experiments were performed using a cylindrical fixed-bed reactor made from quartz glass at an ambient pressure. The reactor was filled with 100 mg of the catalyst (ABET > 150 m2·g–1, particle size between 500 and 1000 μm) and diluted with α-Al2O3 (Elektroschmelze Zschornewitz) to a volume of 1 cm3. The catalysts were reduced using a gas flow (100 mL·min–1) of 5 vol % H2 in argon, while heating the reactor at the rate of 10 K·min–1 to the reduction temperature of 1023 K, which was then held for 1 h. The catalytic reaction took place under isothermal conditions at temperatures of 1023, 1073, and 1123 K for 15 h with a feed gas flow of 100 mL·min–1 (GHSV = 6000 h–1) consisting of 47.5 vol % CH4, 47.5 vol % CO2, and 5.0 vol % Ar. The concentrations of CH4, CO2, and CO in the product gas flow were continuously analyzed using a Fourier transform infrared (FTIR) spectrometer (URAS26, ABB Instruments). Gas chromatography (GC-14B, Shimadzu) was applied to determine the amount of hydrogen formed. The water amount was determined using a dew point hygrometer (Optidew Vision, Michell Instruments).
After 15 h TOS, the reactor was flushed with argon before the deposited carbon residues were removed via thermal treatment in an air flow (10 mL·min–1) at 1123 K for 2 h. During carbon removal, the emerging gases were analyzed via FTIR for carbon quantification, assuming that the elemental carbon is oxidatively converted to CO and CO2 only. The C-selectivity (Csel) is defined as the amount of carbon relative to the carbon converted from CH4 after 15 h on-stream. The experimental error for the conversions of CH4 and CO2 and nH2/nCO was ≤ 3% and that of the C-selectivity (Csel) was ≤ 10%.
Acknowledgments
We acknowledge the financial support of the Open Access Publication Fund of the Martin-Luther-University Halle-Wittenberg.
Glossary
Abbreviations
- PO
propylene oxide
- PEO
polyethylene oxide
- DRM
dry reforming of methane
Supporting Information Available
The Supporting Information is available free of charge on the ACS Publications website at DOI: 10.1021/acsomega.7b01621.
ICP-OES results and SEM-EDX images (PDF)
The authors declare no competing financial interest.
Supplementary Material
References
- Sadek H. E. H.; Khattab R. M.; Gaber A. A.; Zawrah M. F. Nano Mg1-xNixAl2O4 spinel pigments for advanced applications. Spectrochim. Acta, Part A 2014, 125, 353–358. 10.1016/j.saa.2014.01.115. [DOI] [PubMed] [Google Scholar]
- Abdel-Mohsen F. F.; Emira H. S. A. Thermally stable pigments based on mixed metal oxides. Pigm. Resin Technol. 2013, 42, 231–236. 10.1108/prt-03-2011-0013. [DOI] [Google Scholar]
- Zayat M.; Levy D. Blue CoAl2O4 Particles Prepared by the Sol–Gel and Citrate–Gel Methods. Chem. Mater. 2000, 12, 2763–2769. 10.1021/cm001061z. [DOI] [Google Scholar]
- Yang X.; Tang W.; Liu Z.; Makita Y.; Ooi K. Synthesis of lithium-rich LixMn2O4 spinels by lithiation and heat-treatment of defective spinels. J. Mater. Chem. 2002, 12, 489–495. 10.1039/b109463g. [DOI] [Google Scholar]
- Fortunato G.; Oswald H. R.; Reller A. Spinel-type oxide catalysts for low temperature CO oxidation generated by use of an ultrasonic aerosol pyrolysis process. J. Mater. Chem. 2001, 11, 905–911. 10.1039/b007306g. [DOI] [Google Scholar]
- Kwak B. K.; Park D. S.; Yun Y. S.; Yi J. Preparation and characterization of nanocrystalline CuAl2O4 spinel catalysts by sol-gel method for the hydrogenolysis of glycerol. Catal. Commun. 2012, 24, 90–95. 10.1016/j.catcom.2012.03.029. [DOI] [Google Scholar]
- Sahli N.; Petit C.; Roger A. C.; Kiennemann A.; Libs S.; Bettahar M. M. Ni catalysts from NiAl2O4 spinel for CO2 reforming of methane. Catal. Today 2006, 113, 187–193. 10.1016/j.cattod.2005.11.065. [DOI] [Google Scholar]
- Hollemann A. F.; Wiberg E.. Lehrbuch der Anorganischen Chemie, 101st ed.; deGruyter: Berlin, 1995. [Google Scholar]
- Sickafus K. E.; Wills J. M.; Grimes N. W. Structure of Spinel. J. Am. Ceram. Soc. 1999, 82, 3279–3292. 10.1111/j.1151-2916.1999.tb02241.x. [DOI] [Google Scholar]
- Pakhare D.; Spivey J. A review of dry (CO2) reforming of methane over noble metal catalysts. Chem. Soc. Rev. 2014, 43, 7813–7837. 10.1039/c3cs60395d. [DOI] [PubMed] [Google Scholar]
- de Miguel S. R.; Vilella I. M. J.; Maina S. P.; San José-Alonso D.; Román-Martínez M. C.; Illán-Gómez M. J. Influence of Pt addition to Ni catalysts on the catalytic performance for long term dry reforming of methane. Appl. Catal., A 2012, 435–436, 10–18. 10.1016/j.apcata.2012.05.030. [DOI] [Google Scholar]
- Rogers J. L.; Mangarella M. C.; D’Amico A. D.; Gallagher J. R.; Dutzer M. R.; Stavitski E.; Miller J. T.; Sievers C. Differences in the Nature of Active Sites for Methane Dry Reforming and Methane Steam Reforming over Nickel Aluminate Catalysts. ACS Catal. 2016, 6, 5873–5886. 10.1021/acscatal.6b01133. [DOI] [Google Scholar]
- Yanyan J.; Jinggang L.; Xiaotao S.; Guiling N.; Chengyu W.; Xiumei G. CuAl2O4 powder synthesis by sol-gel method and its photodegradation property under visible light irradiation. J. Sol-Gel Sci. Technol. 2007, 42, 41–45. 10.1007/s10971-006-1525-3. [DOI] [Google Scholar]
- Ribeiro N. F. P.; Neto R. C. R.; Moya S. F.; Souza M. M. V. M.; Schmal M. Synthesis of NiAl2O4 with high surface area as precursor of Ni nanoparticles for hydrogen production. Int. J. Hydrogen Energy 2010, 35, 11725–11732. 10.1016/j.ijhydene.2010.08.024. [DOI] [Google Scholar]
- Salhi N.; Boulahouache A.; Petit C.; Kiennemann A.; Rabia C. Steam reforming of methane to syngas over NiAl2O4 spinel catalysts. Int. J. Hydrogen Energy 2011, 36, 11433–11439. 10.1016/j.ijhydene.2010.11.071. [DOI] [Google Scholar]
- Yan L.; Ren T.; Wang X.; Gao Q.; Ji D.; Suo J. Excellent catalytic performance of ZnxCo1–xCo2O4 spinel catalysts for the decomposition of nitrous oxide. Catal. Commun. 2003, 4, 505–509. 10.1016/s1566-7367(03)00131-6. [DOI] [Google Scholar]
- Lee H.; Jung J. C.; Kim H.; Chung Y.-M.; Kim T. J.; Lee S. J.; Oh S.-H.; Kim Y. S.; Song I. K. Effect of pH in the preparation of ZnFe2O4 for oxidative dehydrogenation of n-butene to 1,3-butadiene: Correlation between catalytic performance and surface acidity of ZnFe2O4. Catal. Commun. 2008, 9, 1137–1142. 10.1016/j.catcom.2007.10.023. [DOI] [Google Scholar]
- Kung H. H.; Kundalkar B.; Kung M. C.; Cheng W. H. Selectivity in the oxidative dehydrogenation of butene on zinc-iron oxide catalyst. J. Phys. Chem. 1980, 84, 382–388. 10.1021/j100441a008. [DOI] [Google Scholar]
- Colinas J. M. F.; Areán C. O. Kinetics of Solid-State Spinel Formation: Effect of Cation Coordination Preference. J. Solid State Chem. 1994, 109, 43–46. 10.1006/jssc.1994.1068. [DOI] [Google Scholar]
- Weitkamp J.; Gläser R.. Katalyse. In Winnacker/Küchler: Chemische Technik: Prozesse und Produkte, Band 1 Methodische Grundlagen, 5th ed.; Dittmeyer R., Keim W., Kreysa G., Oberholz A., Eds.; Wiley-VCH: Weinheim, 2004; pp 645–718. [Google Scholar]
- Jeevanandam P.; Koltypin Y.; Gedanken A. Preparation of nanosized nickel aluminate spinel by a sonochemical method. Mater. Sci. Eng., B 2002, 90, 125–132. 10.1016/s0921-5107(01)00928-x. [DOI] [Google Scholar]
- Cui H.; Zayat M.; Levy D. Sol-Gel Synthesis of Nanoscaled Spinels Using Propylene Oxide as a Gelation Agent. J. Sol-Gel Sci. Technol. 2005, 35, 175–181. 10.1007/s10971-005-4165-0. [DOI] [Google Scholar]
- Gash A. E.; Tillotson T. M.; Satcher J. H. Jr.; Poco J. F.; Hrubesh L. W.; Simpson R. L. Use of Epoxides in the Sol–Gel Synthesis of Porous Iron(III) Oxide Monoliths from Fe(III) Salts. Chem. Mater. 2001, 13, 999–1007. 10.1021/cm0007611. [DOI] [Google Scholar]
- Akitt J. W.; Farthing A. Aluminium-27 nuclear magnetic resonance studies of the hydrolysis of aluminium(III). Part 4. Hydrolysis using sodium carbonate. J. Chem. Soc., Dalton Trans. 1981, 1617–1623. 10.1039/dt9810001617. [DOI] [Google Scholar]
- Yokoi T.; Tatsumi T.. Hierarchically Porous Materials in Catalysis. In Hierarchically Structured Porous Materials; Su B.-L., Sanchez C., Yang X.-Y., Eds.; Wiley-VCH: Weinheim, 2012; pp 483–530. [Google Scholar]
- Nakanishi K.; Soga N. Phase Separation in Gelling Silica–Organic Polymer Solution: Systems Containing Poly(sodium styrenesulfonate). J. Am. Ceram. Soc. 1991, 74, 2518–2530. 10.1111/j.1151-2916.1991.tb06794.x. [DOI] [Google Scholar]
- Tokudome Y.; Nakanishi K.; Kanamori K.; Hanada T. In situ SAXS observation on metal–salt-derived alumina sol–gel system accompanied by phase separation. J. Colloid Interface Sci. 2010, 352, 303–308. 10.1016/j.jcis.2010.08.041. [DOI] [PubMed] [Google Scholar]
- Wang G.; Coppens M.-O. Rational design of hierarchically structured porous catalysts for autothermal reforming of methane. Chem. Eng. Sci. 2010, 65, 2344–2351. 10.1016/j.ces.2009.09.079. [DOI] [Google Scholar]
- Nair M. M.; Kaliaguine S. Structured catalysts for dry reforming of methane. New J. Chem. 2016, 40, 4049–4060. 10.1039/c5nj03268g. [DOI] [Google Scholar]
- Fujita K.; Tokudome Y.; Nakanishi K.; Miura K.; Hirao K. Cr3+-doped macroporous Al2O3 monoliths prepared by the metal-salt-derived sol–gel method. J. Non-Cryst. Solids 2008, 354, 659–664. 10.1016/j.jnoncrysol.2007.06.091. [DOI] [Google Scholar]
- Guo X.; Li W.; Nakanishi K.; Kanamori K.; Zhu Y.; Yang H. Preparation of mullite monoliths with well-defined macropores and mesostructured skeletons via the sol–gel process accompanied by phase separation. J. Eur. Ceram. Soc. 2013, 33, 1967–1974. 10.1016/j.jeurceramsoc.2013.02.018. [DOI] [Google Scholar]
- UaCearnaigh D. C.; Baghi R.; Hope-Weeks L. J. Sol–gel synthesis of a series of first row d-block ferrites via the epoxide addition method. RSC Adv. 2016, 6, 48212–48221. 10.1039/c6ra05831k. [DOI] [Google Scholar]
- Kido Y.; Nakanishi K.; Miyasaka A.; Kanamori K. Synthesis of Monolithic Hierarchically Porous Iron-Based Xerogels from Iron(III) Salts via an Epoxide-Mediated Sol–Gel Process. Chem. Mater. 2012, 24, 2071–2077. 10.1021/cm300495j. [DOI] [Google Scholar]
- Kido Y.; Nakanishi K.; Kanamori K. Sol–gel synthesis of zinc ferrite-based xerogel monoliths with well-defined macropores. RSC Adv. 2013, 3, 3661–3666. 10.1039/c3ra22481c. [DOI] [Google Scholar]
- Stolze B.; Titus J.; Schunk S. A.; Milanov A.; Schwab E.; Gläser R. Stability of Ni/SiO2-ZrO2 catalysts towards steaming and coking in the dry reforming of methane with carbon dioxide. Front. Chem. Sci. Eng. 2016, 10, 281–293. 10.1007/s11705-016-1568-0. [DOI] [Google Scholar]
- Ocsachoque M.; Pompeo F.; Gonzalez G. Rh–Ni/CeO2–Al2O3 catalysts for methane dry reforming. Catal. Today 2011, 172, 226–231. 10.1016/j.cattod.2011.02.057. [DOI] [Google Scholar]
- Tokudome Y.; Fujita K.; Nakanishi K.; Miura K.; Hirao K. Synthesis of Monolithic Al2O3 with Well-Defined Macropores and Mesostructured Skeletons via the Sol–Gel Process Accompanied by Phase Separation. Chem. Mater. 2007, 19, 3393–3398. 10.1021/cm063051p. [DOI] [Google Scholar]
- Baes C. F.; Mesmer R. S.. The Hydrolysis of Cations; John Wiley & Sons: New York, 1976. [Google Scholar]
- Canfield G. M.; Bizimis M.; Latturner S. E. Transition-Metal Ion Exchange Using Poly(ethylene glycol) Oligomers as Solvents. Chem. Mater. 2010, 22, 330–337. 10.1021/cm901988f. [DOI] [Google Scholar]
- Tirsoaga A.; Visinescu A.; Jurca B.; Ianculescu A.; Carp O. Eco-friendly combustion-based synthesis of metal aluminates MAl2O4 (M = Ni, Co). J. Nanopart. Res. 2011, 13, 6397–6408. 10.1007/s11051-011-0392-1. [DOI] [Google Scholar]
- Scheffer B.; Heijeinga J. J.; Moulijn J. A. An electron spectroscopy and x-ray diffraction study of nickel oxide/alumina and nickel-oxide-tungsten trioxide/alumina catalysts. J. Phys. Chem. 1987, 91, 4752–4759. 10.1021/j100302a023. [DOI] [Google Scholar]
- Angeletti C.; Pepe F.; Porta P. Structure and catalytic activity of CoxMg1–xAl2O4 spinel solid solutions. Part 1. —Cation distribution of Co2+ ions. J. Chem. Soc., Faraday Trans. 1977, 73, 1972–1982. 10.1039/f19777301972. [DOI] [Google Scholar]
- Gaudon M.; Apheceixborde A.; Ménétrier M.; Le Nestour A.; Demourgues A. Synthesis Temperature Effect on the Structural Features and Optical Absorption of Zn1–xCoxAl2O4 Oxides. Inorg. Chem. 2009, 48, 9085–9091. 10.1021/ic900482v. [DOI] [PubMed] [Google Scholar]
- El Habra N.; Crociani L.; Sada C.; Zanella P.; Casarin M.; Rossetto G.; Carta G.; Paolucci G. MOCVD of CoAl2O4 Thin Films from {Co[Al(OiC3H7)4]2} as Precursor. Chem. Mater. 2007, 19, 3381–3386. 10.1021/cm0615931. [DOI] [Google Scholar]
- Lavrenčič Štangar U.; Orel B. Preparation and Spectroscopic Characterization of Blue CoAl2O4 Coatings. J. Sol-Gel Sci. Technol. 2003, 26, 771–775. 10.1023/a:1020767025898. [DOI] [Google Scholar]
- Ewbank J. L.; Kovarik L.; Diallo F. Z.; Sievers C. Effect of metal–support interactions in Ni/Al2O3 catalysts with low metal loading for methane dry reforming. Appl. Catal., A 2015, 494, 57–67. 10.1016/j.apcata.2015.01.029. [DOI] [Google Scholar]
- Liu C.-j.; Ye J.; Jiang J.; Pan Y. Progresses in the Preparation of Coke Resistant Ni-based Catalyst for Steam and CO2 Reforming of Methane. ChemCatChem 2011, 3, 529–541. 10.1002/cctc.201000358. [DOI] [Google Scholar]
- Rad S. J. H.; Haghighi M.; Eslami A. A.; Rahmani F.; Rahemi N. Sol–gel vs. impregnation preparation of MgO and CeO2 doped Ni/Al2O3 nanocatalysts used in dry reforming of methane: Effect of process conditions, synthesis method and support composition. Int. J. Hydrogen Energy 2016, 41, 5335–5350. 10.1016/j.ijhydene.2016.02.002. [DOI] [Google Scholar]
- Sajjadi S. M.; Haghighi M.; Eslami A. A.; Rahmani F. Hydrogen production via CO2-reforming of methane over Cu and Co doped Ni/Al2O3 nanocatalyst: impregnation versus sol–gel method and effect of process conditions and promoter. J. Sol-Gel Sci. Technol. 2013, 67, 601–617. 10.1007/s10971-013-3120-8. [DOI] [Google Scholar]
- Fang X.; Peng C.; Peng H.; Liu W.; Xu X.; Wang X.; Li C.; Zhou W. Methane Dry Reforming over Coke-Resistant Mesoporous Ni-Al2O3 Catalysts Prepared by Evaporation-Induced Self-Assembly Method. ChemCatChem 2015, 7, 3753–3762. 10.1002/cctc.201500538. [DOI] [Google Scholar]
- Titus J.; Roussière T.; Wasserschaff G.; Schunk S.; Milanov A.; Schwab E.; Wagner G.; Oeckler O.; Gläser R. Dry reforming of methane with carbon dioxide over NiO–MgO–ZrO2. Catal. Today 2016, 270, 68–75. 10.1016/j.cattod.2015.09.027. [DOI] [Google Scholar]
- Gardner T. H.; Spivey J. J.; Kugler E. L.; Pakhare D. CH4–CO2 reforming over Ni-substituted barium hexaaluminate catalysts. Appl. Catal., A 2013, 455, 129–136. 10.1016/j.apcata.2013.01.029. [DOI] [Google Scholar]
- Fan M.-S.; Abdullah A. Z.; Bhatia S. Catalytic Technology for Carbon Dioxide Reforming of Methane to Synthesis Gas. ChemCatChem 2009, 1, 192–208. 10.1002/cctc.200900025. [DOI] [Google Scholar]
Associated Data
This section collects any data citations, data availability statements, or supplementary materials included in this article.


