Abstract
Childhood vaccination data are made available at a school level in some U.S. states. These data can be geocoded and may be considered as having a high spatial resolution. However, a school only represents the destination location for the set of students that actually reside and interact within some larger areal region, creating a spatial mismatch. Public school districts are often used to represent these regions, but fail to account for private schools and school of choice programs. We offer a new approach to estimate childhood vaccination coverage rates at a community level by integrating school level data with population commuting information. The resulting mobility-adjusted vaccine coverage estimates resolve the spatial mismatch problem and are more aligned with the geographic scale at which public health policies are implemented. We illustrate the utility of our approach using a case study on diphtheria, tetanus, and pertussis (DTP) vaccination coverage for kindergarten students in California. The modeled community-level DTP coverage estimates yield a statewide coverage of 92.37%, which is highly similar to the 92.44% coverage rate calculated from the original school-level data.
Keywords: vaccination, immunization, mobility, interpolation, pertussis
1. Introduction
The refusal or delay of childhood vaccinations has been identified in both the popular press and scientific literature as an increasing public health concern across the United States (Dempsey et al., 2011; Hayes, 2015; Hughes, 2006; Omer et al., 2006; Park, 2008). One common approach to encouraging or mandating childhood vaccination is through school entry vaccine requirements. Although there is strong scientific evidence for the safety and effectiveness of immunizations, concerns about the risks associated with vaccination (and the increasing number of required and recommended childhood vaccines) have gained momentum in various popular and social media outlets. In the 2014–2015 school year, nearly 2% of all U.S. kindergarteners entered school with a nonmedical exemption (NME) from vaccination requirements (Seither et al., 2015).
Each U.S. state has autonomy to establish vaccination requirements for children enrolled in their school system (Salmon et al., 2005), and the level of restrictiveness varies from state to state (Yang and Debold, 2014). As a result, coverage among incoming kindergarteners for common vaccines such as diphtheria, tetanus, and pertussis (DTP); measles, mumps, and rubella (MMR); and varicella fluctuates substantially throughout the U.S. (Seither et al., 2015). Some states, such as Arkansas and Colorado, have DTP and MMR coverage rates that are far below the thresholds required to ensure herd immunity (Seither et al., 2015), the percentage of the population that must be vaccinated in order to prevent outbreaks in the general population, which includes those with health problems that contraindicate vaccination.
Vaccine-related behavior also fluctuates considerably at a community or regional scale within states (Atwell et al., 2013; Birnbaum et al., 2013; Lieu et al., 2015; Omer et al., 2008; Yang et al., 2016). Examining vaccine coverage rates at the state level, using data such as that provided by the National Immunization Survey1 can be helpful, but obscures significant local variation in coverage rates throughout states and the associated risks of infectious disease outbreaks. The ability to identify highly vaccinated and undervaccinated neighborhoods, school districts, and other types of local communities or regions is important for policy makers, public health officials, and medical providers who aim to make informed, evidence-based decisions and recommendations for appropriate interventions and care strategies related to vaccine-preventable diseases (Lieu et al., 2015).
Several states make vaccination coverage information publicly available for specific checkpoint grade levels, such as kindergarten and sixth grade. While some states provide data aggregated by the county (e.g., Kansas) or public school district (e.g., New Mexico and Tennessee), others allow access to school-level data (e.g., California, Oregon, and Virginia). School-level data can be considered high spatial resolution information, since schools are located at precise locations, which can be georeferenced and integrated into a Geographic Information System (GIS). Analysis of the school-level data has the potential to provide important knowledge regarding regional or local trends in vaccination coverage. Yet, the particular nature of this data creates an interesting set of problems for GIS and spatial analysis efforts. The main limitation is that schools represent discrete point locations in space with a set of attributes, while the students who attend the schools reside and interact within some larger areal region, such as a school district. The school-level point data only represent a terminus location for a set of individuals whose residences are distributed spatially throughout some region. Previous estimates of vaccination coverage rates for local communities have yet to fully account for the spatial mismatch between the school-level data and the area served by a particular school.
In this paper, we present a new data-integration method to estimate community-level vaccination coverage rates using school-level data and population mobility information. Our approach accounts for the spatial mismatch school-level point representation and the areal regions in which students reside. We incorporate aspects of both interpolation and aggregation, but tailor our approach for the particularities of U.S. school attendance geography to estimate the coverage rate for the DTP vaccine for California (CA) kindergarteners entering school in 2014. California experienced outbreaks of pertussis, also known as whooping cough, in 2010 and 2014 (California Department of Public Health, 2015), which may signal that the vaccine coverage rate had dropped below the herd immunity threshold in some communities. We estimate DTP coverage percent for census blocks, the smallest areal units of census geography, providing a highly detailed spatial representation of community-level vaccination coverage throughout the state. The resulting map and areal-level data provide geographic visualization and spatial analysis opportunities that are not available when relying solely on the school-level point data.
2. Background
The two most commonly-used approaches for estimating areal data from a point observations are: (1) interpolation, which estimates values for locations without data using a set of known values from the surrounding region and (2) aggregation of the point data to preexisting areal units.
In the interpolation approach, known values from a point dataset are used to estimate values at unsampled locations. A significant problem arises if using interpolation to estimate vaccination coverage from school-level data. Interpolation assumes that the characteristic being studied is continuously distributed throughout space and the values at the known point locations represent a set of sample points drawn from this spatially distributed phenomenon. However, this assumption does not match the reality of the school-level vaccination coverage data. In this case, a school is not a sample point drawn from a continuous surface, but instead is a destination point for the students who reside at locations distributed throughout some region.
In the aggregation approach, a set of areal units is chosen, and then the points falling within each unit are aggregated and summarized into a single value representing the entirety of that unit. For estimating vaccination coverage rates, two important problems arise in this approach. First, if large areal units such as counties are chosen as the aggregation unit, the size of the areal units has the potential to obscure the geographic detail available from the school-level data. Second, if small areal units such as U.S. Census block groups are chosen, there is a possibility that some units will not contain a school and, therefore, require an additional decision rule and processing step to assign a vaccination coverage percentage to these units.
In the U.S., the problems associated with the size of the areal units are exacerbated by the particularities of primary and secondary (grades K-12) school attendance geography, which are summarized below. Generally, schools in the U.S. fall into one of three broad categories, 1) public schools, which are publicly-funded, free to attend, and have defined geographic service areas, 2) charter (and magnet) schools, which are publicly-funded and free, but only in some cases have specifically defined service areas, and 3) private schools, which do not receive public funds, may charge tuition for attendance, and do not have defined service areas (United States Network for Education Information, 2008).
The public school system provides much of the overall education in the U.S., and attendance at public schools is tied to the residential locations’ of the students (Danielsen et al., 2014). A public school district defines the areal extent of the region or catchment in which students must attend a particular public school or set of schools. When multiple public schools are located within a single district, the district is further divided into subregions that delineate the particular service area for each school. Historically in the U.S., public schools were distributed systematically to serve a single neighborhood or community and thus minimize travel for students (Bell, 2007). More recently, the link between geography, distance, and school attendance has been weakened via increases in the availability of both public and private school choice options (Ely and Teske, 2015; Henig, 2009). Public school choice provides parents with the option of sending their children to a school that is not located in the school district or subregion in which they reside (Ely and Teske, 2015).
The use of public school district boundaries as an aggregation unit for the school-level vaccination data may appear to be a reasonable option. However, this approach generates at least three potential complications related to student attendance geography in the U.S. First, private and charter school student populations are not bound by the public school district geography. A private or charter school located within a public school district’s boundaries may have numerous students who reside outside of that particular district. Second, in states offering public school choice programs, students may attend a school located outside the public school district or subregion assigned to their residence. Third, some school districts have multiple public schools within their boundaries and do not provide the detailed subregion boundary information for each school in a useable format. Supplemental Figure 1 provides examples of the potential complications arising from public school districts as an aggregation unit for the school-level data.
3. Community-level vaccination coverage
Our approach for estimating vaccination coverage at a community-level is based on two extensions of a traditional interpolation. The first extension is that we allow the distance decay function to vary spatially throughout the study region, as suggested by Lu and Wong (2008). The second extension is the incorporation of ancillary data within the interpolation process, a technique known as an intelligent method of interpolation (Zhang and Qiu, 2011). However, rather than estimating over an empty raster grid, we estimate the vaccination coverage rates for predefined areal units, which is more similar to an aggregation approach.
We conceptualize that a community’s vaccine coverage rate can be estimated based on the coverage rates of nearby schools and the likelihood that students living within the community attend those nearby school locations. Our approach draws from a modified gravity model (Weibull, 1976), which incorporates supply, demand, and a distance decay function to calculate the attraction among locations. Although we use the concept of attraction in our model, because the attraction is only one-way (toward schools) in our approach, we do not consider the demand parameter. Hence, the attraction between a community’s students to a particular school is based on the enrollment size of the school (supply) and the distance from the community to the school (distance decay).
Rather than assigning a community’s students to a single school, we model school attendance as a set of probabilities that a community’s students attend schools located near the community. These probabilities are based on the relative attraction among the nearby schools, which are modeled as a function of the distance to the schools, the size of the schools, and the mobility of the adults in the community. This approach recognizes the effects of school choice programs, such that the students residing in one community may attend multiple schools. The three general assumptions in our school attendance model and vaccination coverage estimation approach are as follows:
Students are more likely to attend a nearby school rather than one located a long distance from their residences. In our model, the probability of a student attending a specific school is dependent on the distance from the student’s residence to the school while also accounting for the distance to any other schools in the student’s local area. This assumption incorporates the local nature of school attendance, while also acknowledging that students may not attend the nearest school if alternate options are present (i.e., school of choice).
The total number of students enrolled at a school affects the probability of attendance at that school. For example, when two schools are equidistant from a student’s residence, the probability that the student attends the larger of the two schools will be greater than the probability that the student attends the smaller of the two. In our model, the size of the school is expressed as the number of students enrolled, which is an observable indication of the attraction that school has on the surrounding communities.
The mobility of students’ parent(s) or guardian(s) will affect which school the students attend. We assume that residents with a long daily work commute overcome distance more readily than those with a short daily commute and are thus more mobile. Studies conducted in Minnesota (Wilson et al., 2007) and Oregon (Yang et al., 2012) report that students who attend a non-assigned public school travel longer distances on average than students attending their assigned school. Hence, we consider differences in parents’ ability to overcome distance, allowing mobility to modify the relationship between distance and the probability of attending a school (#1 above). For example, in our model, highly mobile parents would be more likely to choose a distantly-located school than their lower mobility counterparts, given the same set of schools to choose from.
3.1. Case study
Our case study is conducted in California, which has a total population of roughly 37 million residents, a yearly elementary school population of approximately 3 million students (CalEdFacts, n.d.), and about 0.5 million students entering kindergarten each year (CDPH, Immunization Branch, 2015). Prior to the adoption of new legislation passed in 2015 (SB277), California had a relaxed policy regarding NMEs from vaccination for school entry. Between 2010 and 2014, vaccination coverage among incoming kindergarteners has decreased, while NME use has increased (CDPH, Immunization Branch, 2015). During this time period, several outbreaks of vaccine-preventable diseases occurred within the state. California provides school-level vaccination data for incoming kindergarten students for all schools having 10 or more incoming students. This provides researchers with a highly detailed record of childhood vaccination for the entire state. In 2010, “school of choice” legislation was enacted within the state, allowing schools to admit students that reside in other public school districts.
Data and methods
Vaccination
Vaccination data for kindergarteners entering California schools in the 2014–2015 school year (n = 7,032 schools) were acquired from California Department of Public Health (http://www.cdph.ca.gov). For each school, the database contains the total number of students entering kindergarten, the number of students having medical and non-medical exemptions, and the number of students having documented proof of vaccination for the state-mandated vaccines. For DTP, the kindergarten-entry requirement is DTP, or combination of DTP and diphtheria-tetanus toxoids (e.g., DTaP, DT), and to be considered vaccinated in the database a child had to have received at least 5 doses of the vaccine, although 4 doses was considered vaccinated if at least one dose was given on or after the child’s fourth birthday (California Code of Regulations, 2015). The school-level vaccination data were matched to school addresses gathered from California Department of Education (http://www.cde.ca.gov), then geocoded using Google’s Geocoding API (https://maps.googleapis.com/maps/api/geocode/) and a custom R (R Core Team, 2015) script.
Population mobility
The most recent five-year (2009–2013) American Community Survey (ACS) block group data were gathered from http://www.census.gov/programs-surveys/acs/ for all of California (n = 23,111). We used Journey to Work (JTW) information as a proxy measure of parent/guardian mobility. JTW data are reported as the proportion of the working population that travels a specific number of minutes to the workplace daily during a one-way commute, reported in 0–4, 5–9, 10–14, 15–19, 20–24, 25–29, 30–34, 35–39, 40–44, 45–59, 60–89, and ≥90 minute intervals. The original JTW data were converted to a cumulative probability distribution representation, such that each interval represented the proportion of the working population that travels each distance or more during their daily commute.
For each block group, a logistic-based distance decay function (de Vries et al., 2009) was fit to the JTW data using a nonlinear least squares regression. Observed cumulative probability served as the outcome variable and travel distance was the predictor variable in the regression model. The midpoint values of the JTW class intervals were used for the travel distance values, except for the ≥90 minute class, which was set to 90 minutes. The function takes the form
| Equation 1. |
where C(d) is the cumulative probability; d is the travel time; γ is the Y intercept when d = 0, so it is constrained to 1 (100% probability of traveling 0 minutes or more); and β0 and β1 are the estimated parameters. This particular function was employed because it provides the requisite flexibility to estimate distance decay behavior (Delamater, 2013; Delamater et al., 2013).
Overall, the nonlinear regression models provided highly accurate predictions of the observed JTW data; the mean R2 for the block group models was 0.98. Examples of the observed data, the modeled distance decay function, and estimated parameters for low, medium, and high mobility block groups are provided in Figure 1. In the Figure 1 examples, the overall differences in mobility can be most easily observed by viewing the median JTW time for each community, which is the travel time in which 50% or more of the community travels to work on a daily basis. For visualization purposes, the median JTW time was calculated for each block group by solving its particular distance decay function for C(d) = 0.5 and is mapped for CA in Figure 2. As the map shows, median JTW varies substantially throughout the state.
Figure 1: Distance decay functions for examples of low, medium, and high mobility block groups.
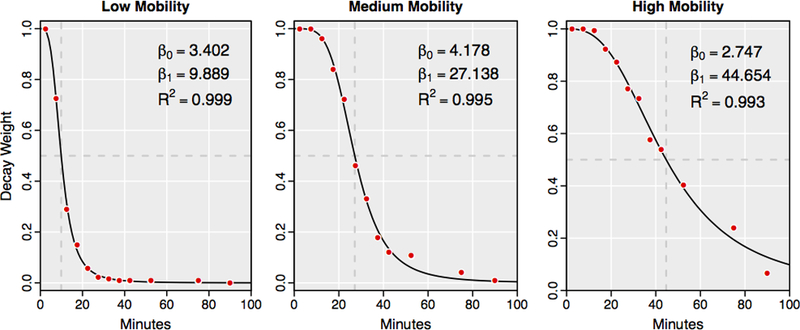
Dashed lines show the Median journey to work (JTW) time, the travel time that 50% or more of workers commute daily.
Figure 2: Mobility for California residents.
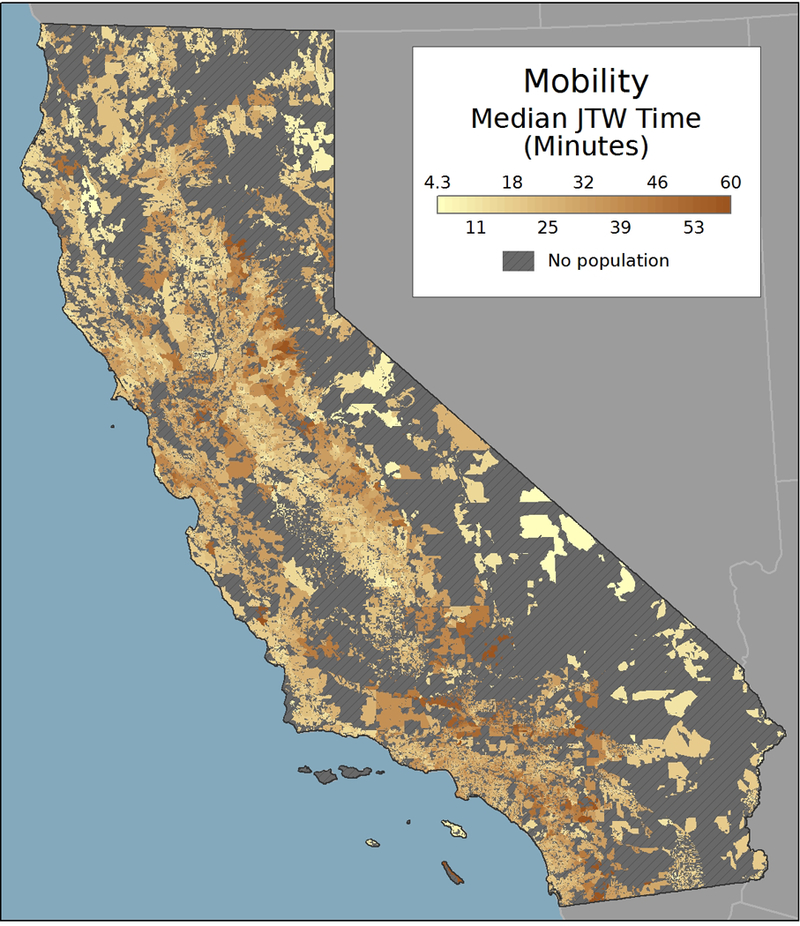
Median journey to work (JTW) time is the travel time that 50% or more of workers commute daily.
Distance
Census block data for all of California (n = 710,145) were downloaded from https://www.census.gov/geo/maps-data/data/tiger-line.html. Many of the census blocks in California are unoccupied because they represent desert or mountain terrain. Only census blocks with a population greater than 0 in 2010 were retained for analysis (n = 403,398). Block polygons were converted to geographic (geometric) centroid locations and the Euclidean distance (kilometers) from each centroid to each kindergarten location in California was calculated. Measuring the distances over a travel network was deemed impractical, as the operation would require roughly 2.8 billion unique shortest path distance calculations.
To link the Euclidean distance data with the JTW travel time data, a conversion between the two distance measures (kilometers and minutes) was necessary. To accomplish this, 2,000 tuples (d ≤ 200 km) were sampled from the block-school origin-destination matrix. A custom R script was implemented to query Google’s Distance Matrix API (https://maps.googleapis.com/maps/api/distancematrix/) for travel time information for the 2,000 samples. Visual interpretation of the scatterplot between Euclidean distance (kilometers) and travel time (minutes) showed a non-linear relationship for shorter distances and a linear relationship at further distances, which was evocative of the variogram plots used in geostatistical operations (Burrough and McDonnell, 1998; Goovaerts, 1997). We chose a Gaussian variogram function (Goovaerts, 1997; Kupfersberger and Deutsch, 1999), as it provided the requisite flexibility to characterize the observed relationship. The function takes the form
| Equation 2. |
where d is the travel time; s, n, and r are the parameters to be estimated; and h is the Euclidean distance. A nonlinear least squares regression was used to estimate the model parameters. As Figure 3 shows, the non-linear model provided an adequate model fit (R2 = 0.834) for the process of converting between the two distance measures.2
Figure 3:
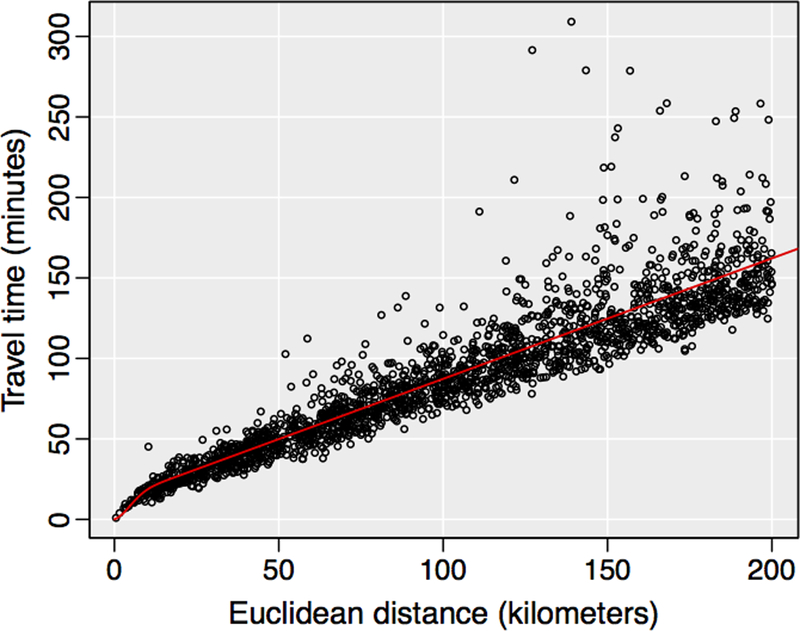
Relationship between travel time and Euclidean distance
Blocks were assigned the JTW function of the block group they were located within. Using the modeled function from Equation 2, all Euclidean distance measurements in block-school origin-destination matrix were converted to travel times. In this step, all distances greater than 60 minutes were removed from the matrix and replaced with “no data” entries, as 60 minutes one-way from a child’s residence was considered to be an appropriate cutoff value for a 0% likelihood of attending a particular school for kindergarten3
Mobility-adjusted community-level estimation
For each block, the weighted sum of the number of students enrolled and the number of students vaccinated for DTP were calculated for all schools falling within 60 minutes travel time of the block. This approach can be represented as
| Equation 3. |
where Si is the number of kindergarteners in block i; Sj is the number of kindergarteners at school j; di,j is the travel time between block i and school j; and w2i,j is the probability weight squared for block i and school j, calculated as C(di,j) using block i’s mobility function from Equation 1 and di,j. All potential weights (wi,j) fall between 0 and 1, with higher weights assigned to shorter distances. Because the distance decay curve functions in Equation 1 were estimated using cumulative probabilities, we square the w term in Equation 3 to reinforce the local nature of school attendance and emphasize the probability of attendance at a nearby school, rather than distantly located schools. Si is calculated separately for both kindergarten enrollment (SENR) and the number of kindergarteners with the DTP vaccination (SDTP). DTP vaccination coverage for each block is calculated as a proportion by dividing the sum of the kindergarteners having the DTP vaccination by the sum of all kindergarteners.
Figure 4 provides example calculations of Equation 3 to illustrate the effect of incorporating differing adult mobility on the block-level DTP coverage estimates. In the figure, three schools with varying enrollments and school-level DTP coverage are located at 5, 8, and 25 minutes from the centroid of the population unit. In the example on the left, the population has low mobility, while the population in the example on the right is extremely mobile. The relative probabilities of attendance for each school, given the specific distances and enrollments are School 1 = 0.875, School 2 = 0.119, and School 3 = 0.005 for the low mobility community and School 1 = 0.395, School 2 = 0.077, and School 3 = 0.528 for the high mobility community. In this example, the probability of students attending School 3 (lower DTP coverage) is much higher because many in the community have a long daily commute (represented by higher w values at greater distances), which results in a lower DTP coverage estimate compared to the low mobility community.
Figure 4: Example DTP coverage calculations for communities with low (left) and high (right) mobility.
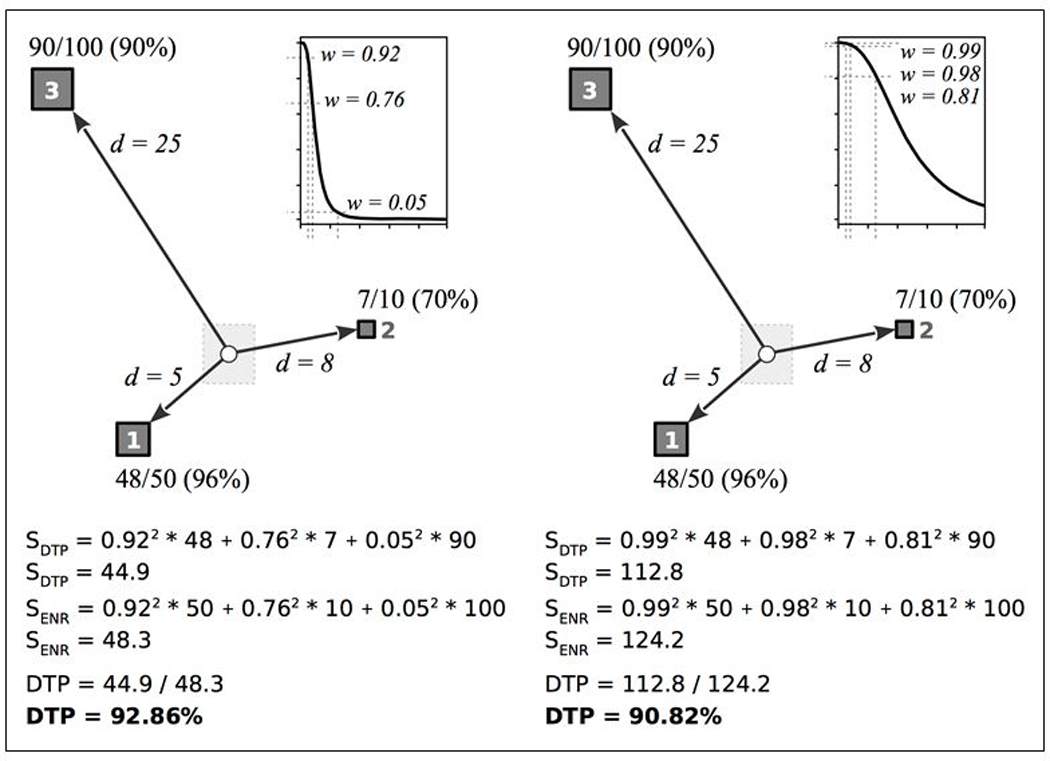
The circle represents the population location (block) and the squares represent schools. Travel time is represented by d. The school locations are labeled with the number of students with the DTP vaccination, the total number of students, and the percent of students with the DTP vaccination. The graph shows the block-specific mobility function, with the weight values (w) for d = 5, 8, and 25 minutes.
Model validation
The accuracy of the community-level DTP vaccination coverage estimates cannot be empirically verified with publically available data, because that would require protected personal information including the vaccination status and residential location of all California kindergarten students in 2014. However, the approach can be validated by integrating the modeled block-level coverage estimates with an independent representation of the residential distribution of the kindergarten population. Because students generally enter kindergarten between the ages of 4 and 6, this population is not well defined. Hence, block-level residential distribution of 5-year-olds was used as a proxy representation of the kindergarten population. 2010 U.S. Census data were employed, as this was the most recent data source meeting both the age and spatial requirements. The 2010 census data has a total age-5 population of 505,175, which is similar in magnitude to the 531,940 enrolled kindergarteners in the 2014 school-level data.
For each block, the estimated DTP coverage was multiplied by the age-5 population, which produced the number of age-5 residents that were vaccinated for DTP. This representation of DTP vaccination coverage for the kindergarten population differs from the original school-level data by considering the residential location of students, rather than only the terminus location of the schools the students attend. To compare the block-level estimates to the school-level data, we examined the state-level DTP vaccination produced by each. For the block-level data, the estimated number of vaccinated age-5 residents were summed and then divided by the total number of age-5 residents in the state. For the school-level data, the similar approach was implemented using the sum of vaccinated kindergarteners and all kindergarteners.
4. Results
Community-level mobility-adjusted DTP coverage for California kindergarteners entering school in 2014 is mapped in Figure 5. In the map, the color scheme for DTP coverage diverges at 92% with red shading indicating low coverage and green shading indicating high coverage rates. Estimates of the herd immunity vaccination threshold for pertussis range from 92% to 96% (Anderson and May, 1985; Fine, 1993), meaning that 92% can be considered a conservative estimate of the herd immunity threshold. Figure 5 highlights the general variation in DTP coverage across the state, with the lowest coverage areas found in the northernmost part of the state and highest coverage areas found in the central valley region. Other urban regions along the Pacific coast appear as regional pockets of lower DTP coverage. The smooth appearance of the DTP coverage map is partially due to the small size of the block-level units and partially due to the use of distance decay in our approach, which produces an overall smoothing effect.
Figure 5:
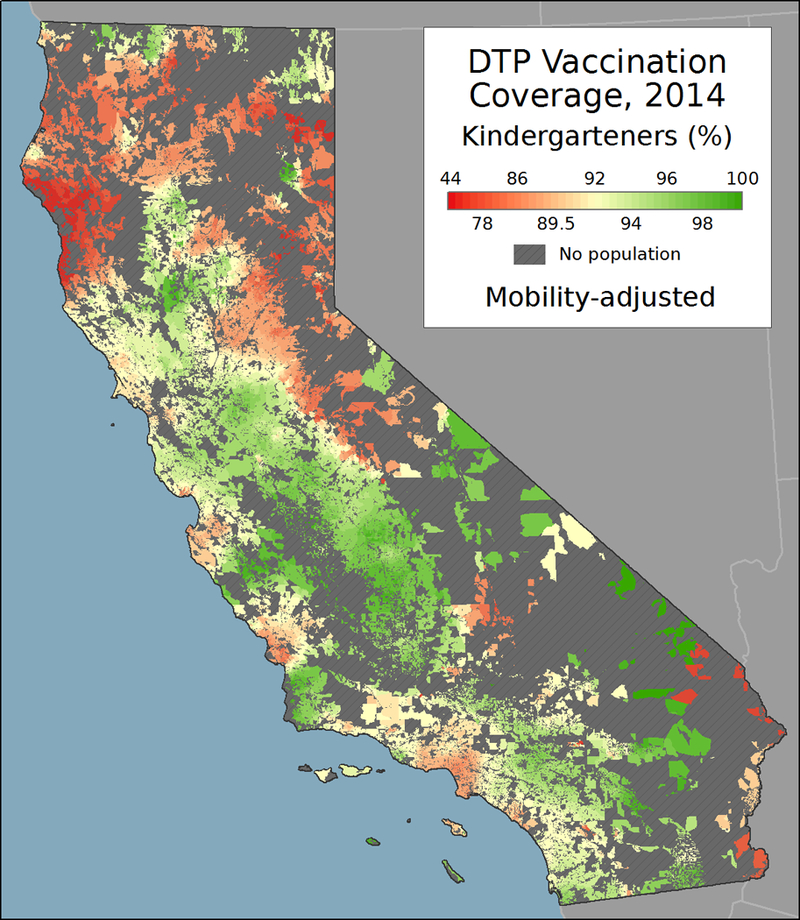
Mobility-adjusted community-level DTP coverage in California, 2014.
Figure 6 highlights undervaccinated regions, as defined by 92% and 96% herd immunity vaccine coverage thresholds for pertussis. For mapping and display purposes, census blocks with DTP coverage estimates less than the threshold value were merged into a contiguous region if within 1 mile of another block less than the threshold. Regions with a DTP coverage rate greater than the threshold value, but smaller than 1 square mile and completely contained within a region under the threshold value, were consolidated into the undervaccinated regions. As Figure 6 shows, many of California’s communities were below these critical thresholds in 2014.
Figure 6:
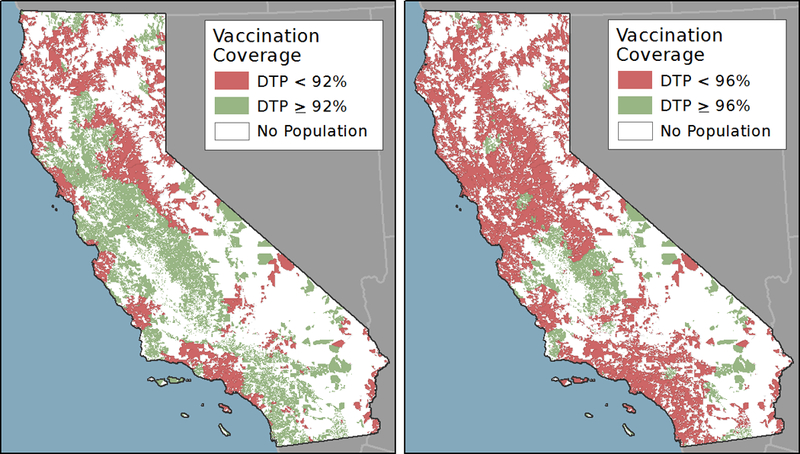
Regions in which DTP coverage is less than the herd immunity threshold of 92% (left) and 96% (right) in California, 2014
Using the raw 2014 school-level data, the overall DTP vaccination coverage for all California kindergarteners was 92.44%. For comparison, the block-level mobility-adjusted coverage estimates in combination with the as of 92.37%. The high level of agreement supports the validity of the community-level estimation approach, especially when considering that the two statewide figures were calculated using completely independent representations of the school-age population.
Although the overall statewide DTP vaccination coverage between the two approaches is extremely similar, the relative distribution of coverage varies considerably within the observation units (schools vs. communities). To illustrate the effects of the community-based approach, the distribution of vaccination coverage for both the school-level (kindergarten enrollment) and block-level (age-5 population) data are plotted in Figure 7. The plot shows a somewhat bimodal distribution for vaccination coverage by school in California, with a large number of schools reporting DTP coverage of greater than 98% and another smaller peak representing schools with DTP coverage of 60% or less. These schools often coexist with the same geographic communities, such as when a public elementary school reports complete coverage but a private school in the same neighborhood reports a very low rate. School-level data obscures the fact that multiple public and private schools may serve the school-age children in a particular community. Thus, the utility of the community-level estimation approach is demonstrated in Figure 7, showing that the dichotomous nature of the school-level data has been smoothed toward the middle when accounting for the residential distribution of students, rather than only their destination points. The smoothing effect of the method is further demonstrated in Figure 8, which provides an example of the school-level data and block-level estimates from a small region in northern California.
Figure 7:
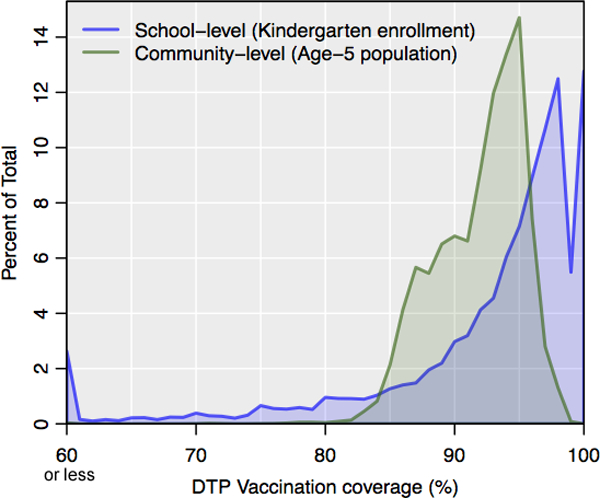
Stratification of DTP vaccination coverage for kindergarteners in 2014 by school (blue) and age-5 population in 2010 by block (green).
Figure 8:
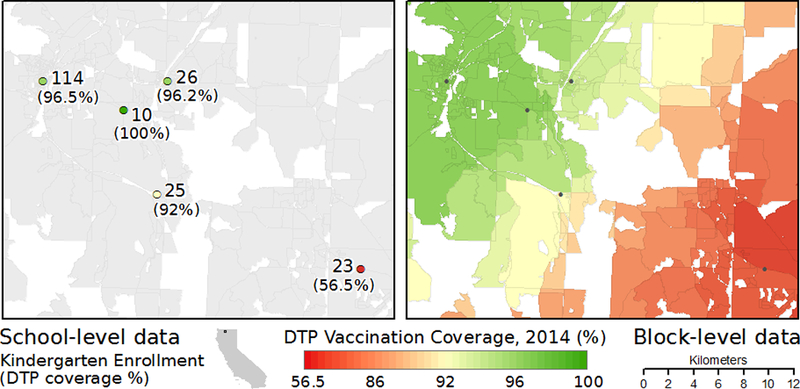
Comparison of original school-level DTP vaccination coverage data (left) and block-level mobility-adjusted estimates (right).
5. Discussion and conclusions
Increased use of NMEs (and thus lower vaccination coverage) has been linked to a higher risk of measles and pertussis outbreaks in Colorado (Feikin et al., 2000), Michigan (Omer et al., 2008), and California (Atwell et al., 2013). In the Michigan and California studies, school-level data were employed to make inferences regarding regions or communities. Although the oft-used Kulldorff spatial scan statistic (Kulldorff, 1997) was used to identify clusters with high exemption rates in both studies, each relied on a simple geographic overlay to link the school-level point data to US census tracts. As mentioned previously, this approach underestimates the complex nature of linking school attendance data with student residential distribution.
Our mobility-adjusted approach to estimate vaccination coverage at a community level offers a solution to the spatial mismatch between the school-level representation of student vaccination coverage and the community or regional spatial scale at which public health interventions and care strategies are generally implemented. Importantly, the our school attendance model was constructed using a robust theoretical representation of student population distribution, which accounts for the particular problems associated with school-level geography, such as differences among public, charter, and private school attendance, multi-school school districts, and school of choice programs.
Using the California kindergarten data from 2014, the usefulness of the community-level output is demonstrated via the clear representation of spatial variability in DTP coverage throughout the state (Figure 5). Attempting to view these broad-scale statewide spatial trends in DTP coverage using the raw school-level (point) data is much more difficult due to the discrete nature of point data, the highly uneven spatial distribution of schools within urban and rural regions, and the large geographic extent of California. At a local scale, Figure 8 provides a detailed example of the DTP coverage estimates, illustrating the discrete nature of the school data and the continuous nature of the community-level output.
We used our DTP coverage estimates to identify regions falling under the 92% and 96% DTP vaccination coverage level required for herd immunity for pertussis. As Figure 6 shows, many regions throughout California fell below these critical threshold values and were possibly at risk for a disease outbreak. Yet, a simple dichotomous characterization of coverage percent is just one of many analysis options available with the community-level estimates. The continuous representation of vaccination coverage and the high spatial resolution provide an opportunity to examine the spatial distribution of vaccination coverage at a detailed scale, as well as the opportunity to identify and stratify regions based on precise estimates of coverage status.
Limitations
Although our approach for estimating community-level vaccination coverage does provide progress toward the ability to distinguish geographic regions by their vaccination coverage status, we do acknowledge its limitations. First, although public school districts appear to be influenced by geography (e.g., proximity to the schools in the district), the school attendance model does not explicitly include these boundaries in the probability calculations. The use of distance to schools and school attendance (size) does serve as an imperfect proxy of school districts, while also accounting for private school attendance and the school of choice program. However, in regions where the school populations are well defined by the school district, our approach may overemphasize the likelihood that students attend an out-of-district school. Without detailed information regarding the geographic distribution of each school’s student population, the effects of this limitation cannot be fully examined.
A second limitation in our approach stems from the use of journey to work data as a proxy for parental/guardian mobility. The JTW information provides important information regarding population commuting patterns and mobility, but has not been previously used to model school attendance patterns. Although our approach incorporates the JTW information to modify the relative probabilities of school attendance, the principal influences of attendance in our model are distance to nearby schools and school enrollment. By squaring the weight values in Equation 3, our school attendance model emphasizes the probability of attending the nearest school and deemphasizes the attraction of distant schools.
In our school attendance model, the attractiveness of a school was based only on the kindergarten enrollment and distance. Although Bell (2007) notes that “geography matters in parents’ decisions regarding schools,” this assumption may be more valid for communities with limited alternative school choices. Past research has shown that parents consider a multitude of factors in determining which school to send their children, including academic quality and safety among others (Bell, 2009). If school-level data were available for these characteristics, they could potentially be incorporated into an improved school attendance model, thereby improving community-level vaccination coverage estimates.
The case study includes data limitations that may affect the interpretation of the resulting DTP coverage estimates. First, the California exemption and vaccination database does not include information for schools with less than 10 students. Although there is evidence that these small schools have higher exemption and lower vaccination coverage rates, their geographic location and coverage status cannot be estimated given the publically available data. Next, for each school the number of students reported as having the DTP vaccination does not include those students who may be vaccinated, but do not have proof upon school entry (called conditional entrants). The school database does not include follow-up information for these students, thus the community-level DTP estimations may be underestimated as a result. Again, the analysis is limited to the publically available data, which only reports the status of students having proof of vaccination at the time of school entry.
Conclusions
We provide a novel approach to estimate mobility-adjusted community-level vaccination coverage using school-level data. Importantly, our approach addresses the spatial mismatch problem stemming from the high resolution provided by school-level point data and the geographically distributed nature of the students that attend these schools. By incorporating school size, distance to schools, and parental mobility, we account for the particularities of school attendance geography in the U.S. Importantly, our approach overcomes the problems with traditional aggregation and interpolation approaches used in previous research.
In the case study, we estimate community-level DTP vaccination coverage of kindergarten students for the state of California at a US census block-level. This is the smallest unit of census geography and blocks can easily be aggregated to larger, more conventional areal units, such as neighborhoods, regions, or cities. In California, the recent policy change to eliminate NMEs will undoubtedly affect the spatial distribution of vaccine coverage for children throughout the state (Delamater et al., 2016), underscoring the importance of mapping and monitoring efforts. Throughout the U.S., the noted changes in the use of NMEs, their associated effects on childhood vaccination coverage, and the amplification of vaccine-preventable disease outbreaks highlight the dynamic and changing geography of vaccination. The ability to distinguish local regions and communities by their vaccination status may provide an extremely important resource for future mitigation and intervention efforts dedicated to reducing vaccine-preventable disease outbreaks.
Supplementary Material
Highlights.
-
-
We provide an approach to estimate vaccination coverage for local communities
-
-
The approach addresses spatial mismatch between schools and student distribution
-
-
Case study shows spatial distribution of DTP coverage in California kindergarteners
Acknowledgements
This research was supported through a grant from the George Mason University Provost Multidisciplinary Research Initiative. The authors would also like to acknowledge the helpful comments and suggestions provided by the two anonymous reviewers.
Footnotes
Higher spatial resolution NIS data (by zip code) are available as a restricted dataset from the U.S. Centers for Disease Control and Prevention (CDC) Research Data Center. Access to this information requires payment of management fees. However, the relatively low number of children surveyed per state for the NIS (e.g., 23,248 children were surveyed in the entire U.S. in 2013) does not provide sufficient coverage for detailed spatial analysis of within state variation.
The relationship was also tested using a multiple linear regression model, with the addition of population density of the block group as a proxy variable to capture differences in the urban/rural nature of travel time. However, the inclusion of this information provided a negligible improvement in model fit.
The mean distance for all blocks to their nearest school was 2.69 minutes. Only 7.8% of all blocks are located more than 10 minutes from the nearest school. These percentages fall to 0.7% and 0.09% for blocks located more than 30 and 50 minutes (respectively) from the nearest school. For 142 blocks (0.035% of all blocks), the nearest school was located more than 60 minutes away. For these cases only, the maximum distance threshold was extended to include the nearest school.
References
- Anderson RM, May RM, 1985. Vaccination and herd immunity to infectious diseases. Nature 318, 323–329. doi: 10.1038/318323a0 [DOI] [PubMed] [Google Scholar]
- Atwell JE, Van Otterloo J, Zipprich J, Winter K, Harriman K, Salmon DA, Halsey NA, Omer SB, 2013. Nonmedical Vaccine Exemptions and Pertussis in California, 2010. Pediatrics 132, 624–630. doi: 10.1542/peds.2013-0878 [DOI] [PubMed] [Google Scholar]
- Bell C, 2009. Geography in Parental Choice. American Journal of Education 115, 493–521. doi: 10.1086/599779 [DOI] [Google Scholar]
- Bell CA, 2007. Space and Place: Urban Parents’ Geographical Preferences for Schools. The Urban Review 39, 375–404. doi: 10.1007/s11256-007-0059-5 [DOI] [Google Scholar]
- Birnbaum MS, Jacobs ET, Ralston-King J, Ernst KC, 2013. Correlates of high vaccination exemption rates among kindergartens. Vaccine 31, 750–756. doi: 10.1016/j.vaccine.2012.11.092 [DOI] [PubMed] [Google Scholar]
- Burrough PA, McDonnell RA, 1998. Principles of Geographical Information Systems, 2nd ed. Oxford University Press, Oxford. [Google Scholar]
- CalEdFacts, n.d. CalEdFacts - Publications (CA Dept of Education) [WWW Document]. URL http://www.cde.ca.gov/re/pn/fb/index.asp (accessed 1.20.16).
- California Code of Regulations, n.d., Required Immunizations.
- California Department of Public Health, 2015. Pertussis Report August 3, 2015.
- California Department of Public Health, Immunization Branch, 2015. 2014– 2015 Kindergarten Immunization Assessment Results.
- Danielsen BR, Harrison DM, Zhao J, 2014. It Makes a Village: Residential Relocation after Charter School Admission. Real Estate Economics 42, 1008–1041. doi: 10.1111/1540-6229.12074 [DOI] [Google Scholar]
- Delamater PL, 2013. Spatial accessibility in suboptimally configured health care systems: A modified two-step floating catchment area (M2SFCA) metric. Health & Place 24, 30–43. doi: 10.1016/j.healthplace.2013.07.012 [DOI] [PubMed] [Google Scholar]
- Delamater PL, Leslie TF, Yang YT, 2016. California Senate Bill 277’s Grandfather Clause and Nonmedical Vaccine Exemptions in California, 2015–2022. JAMA Pediatrics. doi: 10.1001/jamapediatrics.2015.4856 [DOI] [PubMed] [Google Scholar]
- Delamater PL, Messina JP, Grady SC, WinklerPrins V, Shortridge AM, 2013. Do More Hospital Beds Lead to Higher Hospitalization Rates? A Spatial Examination of Roemer’s Law. PLoS ONE 8, e54900. doi: 10.1371/journal.pone.0054900 [DOI] [PMC free article] [PubMed] [Google Scholar]
- Dempsey AF, Schaffer S, Singer D, Butchart A, Davis M, Freed GL, 2011. Alternative Vaccination Schedule Preferences Among Parents of Young Children. Pediatrics. doi: 10.1542/peds.2011-0400 [DOI] [PubMed] [Google Scholar]
- de Vries JJ, Nijkamp P, Rietveld P, 2009. Exponential or power distance-decay for commuting? An alternative specification. Environment and Planning A 41, 461–480. [Google Scholar]
- Ely TL, Teske P, 2015. Implications of Public School Choice for Residential Location Decisions. Urban Affairs Review 51, 175–204. doi: 10.1177/1078087414529120 [DOI] [Google Scholar]
- Feikin DR, Lezotte DC, Hamman RF, Salmon DA, Chen RT, Hoffman RE, 2000. Individual and community risks of measles and pertussis associated with personal exemptions to immunization. JAMA 284, 3145–3150. doi: 10.1001/jama.284.24.3145 [DOI] [PubMed] [Google Scholar]
- Fine PEM, 1993. Herd Immunity: History, Theory, Practice. Epidemiologic Reviews 15, 265–302. [DOI] [PubMed] [Google Scholar]
- Goovaerts P, 1997. Geostatistics for Natural Resources Evaluation. Oxford University Press, Oxford. [Google Scholar]
- Hayes C, 2015. Dear Anti-Vax Parents: We’re Not Mad At You [WWW Document]. Newsweek. URL http://www.newsweek.com/dear-anti-vax-parents-were-not-mad-you-304332 (accessed 8.13.15).
- Henig JR, 2009. Geo‐Spatial Analyses and School Choice Research. American Journal of Education 115, 649–657. doi: 10.1086/599784 [DOI] [Google Scholar]
- Hughes V, 2006. News feature: A shot of fear. Nat Med 12, 1228–1229. doi: 10.1038/nm1106-1228 [DOI] [PubMed] [Google Scholar]
- Kulldorff M, 1997. A spatial scan statistic. Communications in Statistics - Theory and Methods 26, 1481–1496. doi: 10.1080/03610929708831995 [DOI] [PMC free article] [PubMed] [Google Scholar]
- Kupfersberger H, Deutsch CV, 1999. Methodology for integrating analog geologic data in 3-D variogram modeling. AAPG bulletin 83, 1262–1278. [Google Scholar]
- Lieu TA, Ray GT, Klein NP, Chung C, Kulldorff M, 2015. Geographic Clusters in Underimmunization and Vaccine Refusal. Pediatrics. doi: 10.1542/peds.2014-2715 [DOI] [PubMed] [Google Scholar]
- Lu GY, Wong DW, 2008. An adaptive inverse-distance weighting spatial interpolation technique. Computers & Geosciences 34, 1044–1055. doi: 10.1016/j.cageo.2007.07.010 [DOI] [Google Scholar]
- Omer SB, Enger KS, Moulton LH, Halsey NA, Stokley S, Salmon DA, 2008. Geographic Clustering of Nonmedical Exemptions to School Immunization Requirements and Associations With Geographic Clustering of Pertussis. American Journal of Epidemiology 168, 1389–1396. doi: 10.1093/aje/kwn263 [DOI] [PubMed] [Google Scholar]
- Omer SB, Pan WKY, Halsey NA, Stokley S, Moulton LH, Navar AM, Pierce M, Salmon DA, 2006. Nonmedical exemptions to school immunization requirements: Secular trends and association of state policies with pertussis incidence. JAMA 296, 1757–1763. doi: 10.1001/jama.296.14.1757 [DOI] [PubMed] [Google Scholar]
- Park A, 2008. How Safe Are Vaccines? Time 36–41. [PubMed] [Google Scholar]
- R Core Team, 2015. R: A Language and Environment for Statistical Computing. R Foundation for Statistical Computing, Vienna, Austria. [Google Scholar]
- Salmon DA, Sapsin JW, Teret S, Jacobs RF, Thompson JW, Ryan K, Halsey NA, 2005. Public Health and the Politics of School Immunization Requirements. Am J Public Health 95, 778–783. doi: 10.2105/AJPH.2004.046193 [DOI] [PMC free article] [PubMed] [Google Scholar]
- Seither R, Calhoun K, Knighton CL, Mellerson J, Meador S, Tippins A, Greby SM, Dietz V, 2015. Vaccination Coverage Among Children in Kindergarten — United States, 2014–15 School Year. Morbidity and Mortality Weekly Report (MMWR) 64, 897–904. [DOI] [PubMed] [Google Scholar]
- United States Network for Education Information, 2008. Organization of U.S. Education: The School Level. United States Department of Education. [Google Scholar]
- Weibull JW, 1976. An axiomatic approach to the measurement of accessibility. Regional Science and Urban Economics 6, 357–379. doi: 10.1016/0166-0462(76)90031-4 [DOI] [Google Scholar]
- Wilson EJ, Wilson R, Krizek KJ, 2007. The implications of school choice on travel behavior and environmental emissions. Transportation Research Part D: Transport and Environment 12, 506–518. doi: 10.1016/j.trd.2007.07.007 [DOI] [Google Scholar]
- Yang Y, Abbott S, Schlossberg M, 2012. The Influence of School Choice Policy on Active School Commuting: A Case Study of a Middle-Sized School District in Oregon. Environment and Planning A 44, 1856–1874. doi: 10.1068/a44549 [DOI] [Google Scholar]
- Yang YT, Debold V, 2014. A Longitudinal Analysis of the Effect of Nonmedical Exemption Law and Vaccine Uptake on Vaccine-Targeted Disease Rates. Am J Public Health 104, 371–377. doi: 10.2105/AJPH.2013.301538 [DOI] [PMC free article] [PubMed] [Google Scholar]
- Yang YT, Delamater PL, Leslie TF, Mello MM, 2016. Sociodemographic Predictors of Vaccination Exemptions on the Basis of Personal Belief in California. Am J Public Health 106, 172–177. doi: 10.2105/AJPH.2015.302926 [DOI] [PMC free article] [PubMed] [Google Scholar]
- Zhang C, Qiu F, 2011. A Point-Based Intelligent Approach to Areal Interpolation. The Professional Geographer 63, 262–276. doi: 10.1080/00330124.2010.547792 [DOI] [Google Scholar]
Associated Data
This section collects any data citations, data availability statements, or supplementary materials included in this article.


