

Introduction:
The use of pediatric clinical scoring systems in clinical care and research has exploded in the last decade. Clinical scoring systems appeal to multiple stakeholders because they are quantitative, can be validated and improve patient outcomes.1–4 Pediatric asthma is no exception; as the most common chronic disease of childhood, development of clinical scores and guidelines have helped to streamline and improve pediatric asthma care delivery.5
Many hospitals have developed clinical care guidelines for management of acute asthma exacerbations built around manual, provider determined asthma severity scores. Examples include the Pediatric Asthma Score (PAS) and pediatric respiratory assessment measure (PRAM). These scores contain similar elements but are customized to individual hospitals.6–8 The use of these scores to guide inpatient treatment of acute asthma exacerbations has improved patient outcomes including reduced length of stay, decreased admission rates and decreased medication burden in both the emergency department and inpatient wards5; 9–11.
Respiratory scores like PAS contain subjective elements like auscultation, have limited interrater reliability, and are less sensitive in older children and adolescents. They are used intermittently and depend on frequent reassessment, increasing the burden on staff.12 The provider-determined PAS score used in our institution includes qualitative measurements (Figure S1,13). Despite being useful on the wards, PAS scores are measured inconsistently in our ICU and not regularly used to make care decisions.
There is significant variation in care of PICU asthma patients, both within and across centers and hospitals.14 Despite the existence of stepwise guidelines for outpatient asthma management 15, there are no national or international guidelines to direct severe acute asthma exacerbation management in the pediatric ICU. Validated scores for asthma severity can be useful in clinical and quality research on asthma therapies such as intravenous bronchodilators and use of non-invasive ventilation.
The objective of this study was to produce a novel, automated acute asthma severity score using machine learning. Machine learning is built on a foundation of mathematics, logic, probability, neuroscience and decision theory. These foundational building blocks are used to generate computer algorithms that can keep a record of the relative strength of associations between data elements (similar to memory) through repeated training sessions. As a result, machine learning can identify patterns in complex data and then uses those patterns to construct models that can predict outcomes without relying on explicit human generated programming code. Supervised learning is a subfield of machine learning based on tools of classification and regression; it depends on input of a labeled training data set to help the computer “learn” relationships. That knowledge is then applied to an independent testing data set. Accuracy of outputs can then be analyzed. Artificial neural networks are a specific set of algorithms modeled after the structure of the human brain, designed to cluster and classify data and subsequently produce novel outputs.16
We hypothesized that application of machine learning algorithms to passively collected vital sign data (heart rate, respiratory rate, oxygen saturation) in critically-ill pediatric asthma patients can generate an automated respiratory severity score (pARS) that could eventually replace PAS. Once created, the pARS can be validated and applied prospectively in the PICU, wards and emergency department to aid in clinical research and provider decision support without increasing the burden of staff or utilizing subjective measures.
Methods:
This was a single center study conducted at a large quaternary children’s hospital. The Colorado Multiple Institutional Review Board (COMIRB 16–1359) approved this study. Eligible patients were identified during a 1-year period, January 1, 2016 to January 1, 2017 using data collected and stored during their clinical care.
Patient selection:
Inclusion criteria included patients admitted to the PICU age 2–18 years old with diagnosis codes for status asthmaticus across all severities. Data from patients who had ICD 9/ICD 10 procedure codes within the encounter for intubation, or received continuous invasive mechanical ventilation were excluded. Diagnosis codes for other potentially confounding chronic respiratory and neurologic conditions also disqualified patients (Table S1 and S2).
Data collection:
Demographic variables and time stamped clinical data including charted PAS score, respiratory support and medications were obtained from the electronic health record (EHR). Using bed numbers and admission/discharge time stamps, each patient’s continuous vital sign information was manually extracted from a central research database. This database stores vital sign data (numeric and wave form) from PICU patients attached to Phillips monitors. Data extracted for this study included time-stamped values for heart rate, respiratory rate, and pulse oximetry.
Data preparation:
The EHR respiratory flow sheet data were aligned with vital sign data using date and time stamps for PAS score in Matlab (version R2017a). The recorded PAS was used as an outcome to train the supervised machine learning models. Patient data with complete records for 3 parameters (heart rate, respiratory rate and pulse oximetry readings) overlapping with PAS time points were included. Patient data with incomplete alignment were excluded to create the final study cohort of 128 patients. For each PAS score recorded in the medical record, 20 minutes of vital sign measurements were associated with one PAS score via a standard one-to-many matching strategy to create discrete time periods for algorithm training (Figure S2). To control for age-based variability in heart rate and respiratory rate, z-scores for each patient’s heart rate and respiratory rate were calculated using patient age and normalized percentile equations published by Bonafide et al. 2013.17 To exclude readings likely due to artifact, thresholds for heart rate, respiratory rate and oximetry values were also applied (see Additional Methods).
Statistical analysis:
Patients were randomly assigned into a training (80%) or testing (20%) set (balanced validation) and compared to ensure balance by demographic criteria and clinical criteria. A separate randomized 10-fold cross validation was conducted to further validate findings.
Machine learning:
Supervised machine learning techniques use input and output data to find patterns and make predictions. A cascaded artificial neural network was used to predict a respiratory score ranging from 1–15, based on training inputs. Neural networks depend on linking “neurons” or multiple learning units to detect patterns in data. In comparison with the conventional feed-forward neural network, the cascaded network structure is more advanced. It augments a set of cascaded paths to direct the nodes in the preceding and current layers to be the input into the next layer (Figure S3). The cascaded artificial neural network included 8 hidden layers with 3 to 50 neurons in each layer. Machine learning regression models based on Normal and Poisson distribution were used for comparative purposes. Accuracy of machine learning models was assessed by comparison of the median absolute error for each of the testing sets. Matlab (version R2017a) was the program used to create the machine learning algorithm.
Results:
The health record query returned 186 eligible patients admitted to the PICU for status asthmaticus without potential confounding diagnosis as described in our exclusion criteria. Of the 186, 21 patients were excluded due to lack of stored vital sign data during the admission and an additional 37 patients were excluded due to lack of PAS scores that aligned with available extracted vital sign data. The remaining N=128 patients were included in our randomization and subsequent machine learning analysis (Figure 1). 50.8% of the inclusion cohort were male, with 34.4% Hispanic/Latino ethnicity and 19.5% identifying as African American/Black. The median age was 7.9 years old and the median length of hospital stay was 79 hours (Table 1).
Figure 1:
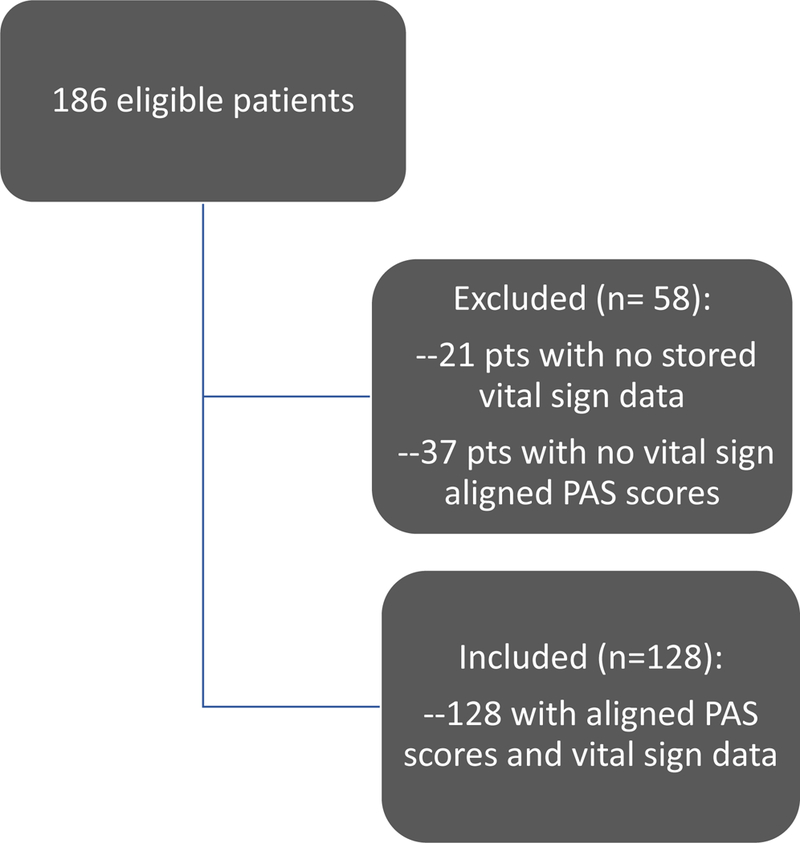
Consort diagram illustrating the cohort used for analysis
Table 1:
Cohort Description and Demographics, Distribution of Demographics Within Balanced Testing and Training Sets, Reported Race and Ethnicity
| N (%) or median (IQR) | Full cohort (n = 128) | Training (n = 102) |
Test (n= 26) |
|---|---|---|---|
| Sex= male | 65 (50.8%) | 50 (49.0%) | 15 (57.7%) |
| Age (years) | 7.9 (4.4 – 11.4) | 7.6 (4.0 – 11.4) | 9.0 (5.4 – 11.4) |
| Hispanic or Latino Ethnicity | 44 (34.4%) | 34 (33.3%) | 10 (38.5%) |
| Race | |||
| White | 66 (51.6%) | 51 (50.0%) | 15 (57.7%) |
| Black/African American | 25 (19.5%) | 19 (18.6%) | 6 (23.1%) |
| Other* | 37 (28.9%) | 32 (31.4%) | 5 (19.2%) |
| Length of Stay (hours) | 79 (42 – 117) | 71 (39 – 112) | 85 (50 – 138) |
| Max PAS score | 10 (9 – 12) | 9 – 12) | 11 (10 – 12) |
| PAS score, median (range) | 7 (5 – 15) | 7 (5 – 15) | 8 (5 −13) |
Other race includes: American Indian/Alaska Native (n = 1), Asian (n = 1), Native Hawaiian/Other Pacific (n = 1), Unknown/Not Reported (n = 3), Other (n = 23) and More than one Race (n = 9)
In our training data we had 4943 original PAS scores or 12.5 manual scores calculated per day of hospitalization. The median (range) of PAS scores was 7 (5 to 15). Plots of PAS score vs heart rate z-score, PAS score vs respiratory rate z-score show a positive relationship (Figure S4).
The training (n=102) and testing (n=26) patients in our balanced set showed comparable distributions of demographic and clinical factors (heart rate z-score, respiratory rate z-score and PAS scores) (Table 1). The balanced training set (n=102 patients and 37,084 data points) was reduced slightly to 36,321 data points after application of the artifact thresholds for age adjusted heart rate and respiratory rate. For the 10-fold cross validation, the number of data points included in each fold of training varied from ~34,000 to 38,000.
Based on comparison of median absolute error for the balanced testing set for each of the machine learning models, the cascaded artificial neural network with 8 hidden layers trained with the balanced group yielded the smallest median absolute error (MAE) of 1.21. The median absolute errors across the balanced group Poisson and Normal models were 1.24 and 1.25 respectively. The Poisson and Normal models each yielded slightly higher median absolute errors for the extreme values of the PAS scores (Figure 2). The most accurate predictions occurred in the mid-range values of 6–9, where the most training data existed (Figure 2).
Figure 2:
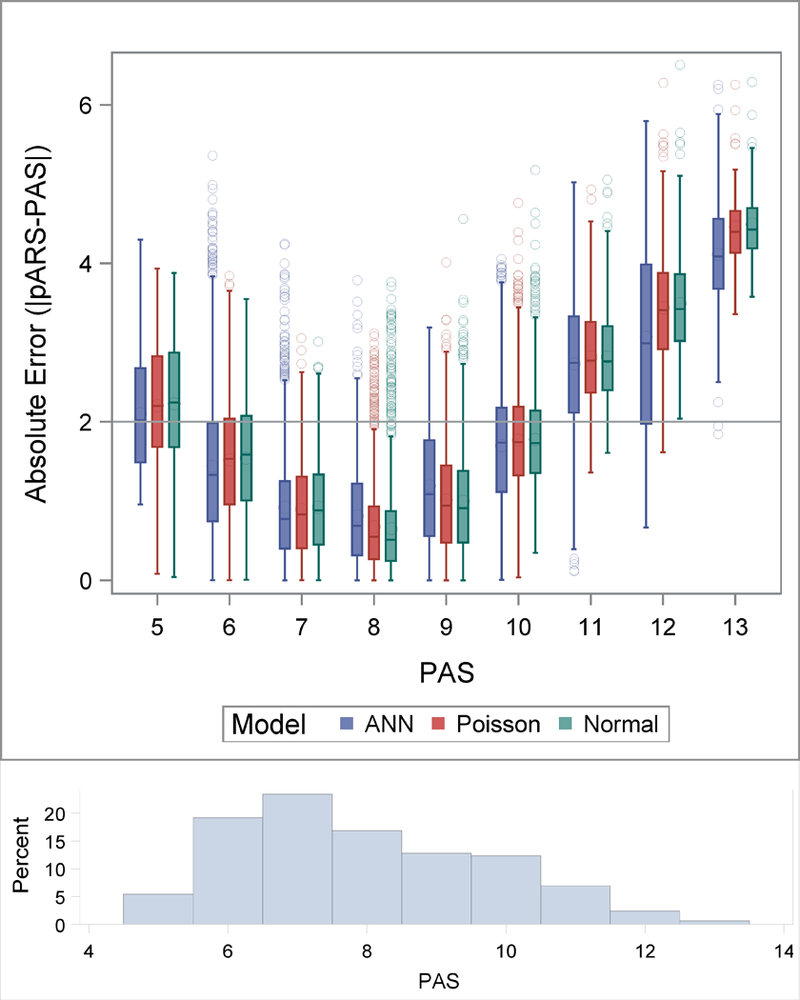
Absolute error of pARS plotted at each PAS value for the ANN, Poisson and Normal Models in the balanced test set. The distribution of the absolute errors are represented using box plots, the boxes extend to the 25th and 75th percentiles, the median values are indicated with a line inside the box and means are denoted with a large circle. The whiskers extend to 1.5 times the interquartile range and values outside of that are indicated with points. A reference line at 2 is plotted. A histogram of the PAS scores is displayed at the bottom of the figure.
In our asthma clinical care guidelines, 2- point discrimination on the PAS scale is a clinically relevant range for guiding care. Thus, we also evaluated pARS predictability in the +/− 2 point range. Specifically, 80% of the pARS scores produced by the ANN algorithm are within +/− 2.10 of the recorded PAS for the balanced testing set. The results from the 10-fold cross validation are similar (Figure S5).
The pARS values also aligned well with PAS when mapped over time across the course of individual patient encounters (Figure 3).
Figure 3:
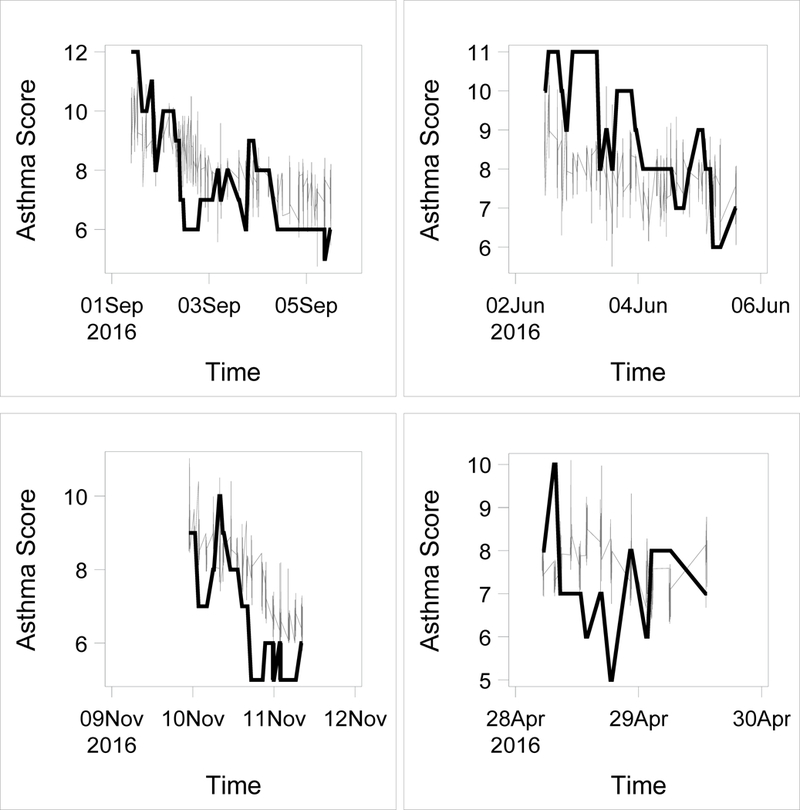
pARS scores (grey lines) overlaid on PAS scores (thick black lines) plotted over time for 4 example subjects.
Discussion:
We successfully created pARS, a novel, pediatric automated asthma severity score, using physiologic data and machine learning. Using an artificial neural network trained with 3 vital sign parameters, the pARS was well within 2 points of recorded PAS scores based on analysis of median absolute error. This level of accuracy makes the automated score non-inferior to the manual Pediatric Asthma Score (PAS) used at our institution.
The pARS was most accurate in the mid-range of asthma severity between 6–9. This severity range is when critical decisions about patient care (transfer to ICU vs floor) are made, increasing the potential positive impact of an objective decision support tool that uses pARS.
This work is foundational in its use of the secondary electronic medical data merged with passive vital sign monitoring information collected in the course of patient care to create an automated pediatric respiratory score. The strengths of this machine score are its objectivity, and that it uses data collected automatically from monitors already in use. It also incorporates age-based parameters. It is unique in its ability to continuously monitor acute changes in asthma status with a computed score.
Because it is objective, automated and can be continuously generated, this score has potential to help standardize acute pediatric asthma care in the PICU. Studies of PICU management of severe asthma across pediatric hospitals and even within a single institution have revealed marked variability in practice. 14; 18 While there are global treatment guidelines for asthma in the primary care and emergency room setting 15; 19, acute care of life threatening pediatric asthma, particularly in severe exacerbations treated in PICU, is not standardized. Respiratory scoring systems for pediatric asthma have streamlined and improved inpatient care, but there is inconsistent use of any such scoring system in the PICU. Bartlett et al. implemented and studied a successful clinical care guideline in the PICU which included a bronchodilator weaning pathway based on a subjective staff generated respiratory score called the Modified Pulmonary Index Score (MPIS) and showed decreased length of stay in the hospital overall.5 An automated, quantitative score to replace these respiratory scores is appealing to critical care providers who are concerned about evidence based clinical decision making, interrater reliability and staff efficiency.
Currently no automated asthma severity score has been published that is sensitive to changes in acute respiratory status. Existing work in pediatric asthma prediction has focused on predicting the occurrence of asthma exacerbations and asthma control deterioration.20–24. Other machine learning and predictive analytic work in pediatrics has targeted sentinel events such as sepsis, respiratory failure requiring intubation and cardiac arrest as outcomes. The frequency of these events is low and thus requires a large patient population and significant monitoring time to assess validity. The pARS score can be validated over a shorter time frame and in smaller populations because it assesses and learns the continuum of disease severity and can be associated with more common outcomes, for example decreasing length of stay in PICU rather than leveraging outcomes such as respiratory arrest and death that are discrete rare events.
Limitations of this study include incomplete data from the clinical record and vital sign database, which decreased our inclusion cohort. While data fidelity issues are innate to using electronic clinical record data for secondary research investigation, this highlights the importance of considering issues of data input and integrity as we build our health data systems, particularly as it becomes imperative to merge and map multiple data sources25. Due to the practice patterns in our PICU the PAS score is not recorded as frequently as on the inpatient floors which limited data analysis, further emphasizing the need for an automated score. Additionally, our algorithm training was restricted to the specific PAS score used at our center, and therefore may not generalize to systems that use other versions of manual clinical scoring. We were able to build this score using a heterogenous pediatric patient population at altitude (~5,280 ft) seen at an urban quaternary care center. All patients included were on oxygen while in the PICU as a part of standard of care. This introduces variability into the pulse oximetry data incorporated into the algorithm. Future prospective, multi-center study is needed to further elucidate the impact of oxygen therapy on vital sign parameters.
Our study algorithm was also not designed to include other clinical features or risk factors that can influence asthma severity. For example, acute bronchodilator use, effect of non-invasive ventilation, as well as markers of chronic asthma severity including controller medication use and adherence, atopy, prior hospitalization history, recent exacerbations, symptom surveys, baseline FEV1%, environmental exposures could all impact pARS predictive ability. Prospective collection of some of these parameters in future studies may strengthen our model and allow further personal risk stratification and treatment algorithms. Work by Luo et al. in 2015 was able to merge 2 years of pediatric asthma personal symptoms data collected via a mobile application with patient attributes and environmental variables to successfully predict a child’s asthma control deterioration 1 week ahead.23
Our study analyzed vital sign parameters measured at 1 min intervals. Because of limited computing power and data storage and access limitations, we were not able to analyze the dense data contained in these vital sign waveforms. The ability to apply deep or unsupervised machine learning to high data density vital sign wave forms has enormous predictive potential. For example, trends in heart rate variability have been used to predict neonatal sepsis and arterial waveforms analyzed to predict hypovolemic shock.26–28 Advances in mobile and hospital-based monitoring and cloud based analytics are innovations that will help facilitate research and clinical application of high resolution physiologic data, conquering current challenges of poor fidelity data due to artifact and variable collection and the size of the data files.
Any decision support tool is only useful if providers trust and utilize it. Implementation and adoption of this tool in the PICU will require significant changes to work flow with patients and use of the EHR. Significant quality improvement and culture change work will be needed to adopt this scoring system as a clinical decision-making tool.
Given these limitations and context, the next steps are to work prospectively to validate pARS as a research instrument and associate it with meaningful clinical outcomes first in our institution, and then more broadly. Technologic innovation addressing issues including integration of data sources and the EHR, computing power and speed to run machine learning methods continuously will be required to translate this score into a clinician decision support tool. With prospective validation, real time implementation and work flow adoption, we believe a score like pARS can drive higher quality care, improve patient flow, decrease length of stay and medication burden (facilitate timely weaning of continuous medications).
Conclusion:
This study shows that creation of an automated pediatric acute respiratory score (pARS) leveraging machine learning techniques such as artificial neural networks to analyze simple vital sign parameters and limited clinical data is feasible. The potential impact of such a score to improve and standardize PICU management of acute asthma exacerbation is significant. Our study revealed multiple barriers to integration of disparate clinical data sources and was also weakened by incomplete EHR and monitor data, both common challenges in studies using secondary retrospective queries on data produced by routine clinical practice. Further prospective validation of our algorithm is imperative to improve data integrity, refine and expand contributing features, and assess impact of pARS on clinical outcomes including length of stay, and medication burden and operational impacts such as staff efficiency.
Supplementary Material
Acknowledgements/Author contributions:
We would like to acknowledge the contributions of Alix Mizoue, Sarah Deakyne, Jennifer Sadlowski and Deborah Batson for their assistance with data extraction, Kyle Robison in assisting with COMIRB project submission, Dr. Paul Stillwell for his clinical editing skills, as well as Dr. Angela Czaja for contributing her expertise and insights specific to the pediatric ICU.
Funding Sources:
AI Messinger: No relevant disclosures. Funded by NIH and NHLBI, Abman T-32 Fellowship Training Grant #2T32HL007670–26
Footnotes
Disclosures
N Bui: Patents: (1) Apparatus and methods for smart phone-based Sp02 measurement; (2) Respiratory Rate Measurement System; (3) TYTH: Typing On Your Teeth: Tongue-Teeth Localization for Human-Computer Interface
BD Wagner: No relevant disclosures
SJ Szefler: Has consulted for Aerocrine, AstraZeneca, Boehringer Ingelheim, Daiichi Sankyo, GlaxoSmithKline, Genentech, Merck, Novartis, Propeller Health, Regeneron, Roche, Sanofi and Teva, and has received research support from the National Institutes of Health, the National Heart, Lung and Blood Institute, the Colorado Department of Public Health and Environment Colorado Cancer, Cardiovascular and Pulmonary Disease Program and GlaxoSmithKline. SJ Szefler receives support from the Colorado Department of Public Health and Environment. Also supported by NHLBI AsthmaNet U10 HL098075 and National Heart, Lung and Blood Institute, 1UG1HL139123, Precision Interventions for Severe and/or exacerbation Prone Asthma (PrecISE).
T Vu: Co-founder and Board Member of Now Vitals, Inc., Co-founder and President Earable Inc. Patents: (1) Method, apparatus, and system for capacitive touch communication; (2) Thermal comfort building monitoring with wearables: method, apparatus, and system; (3) Resource Access Permission Recommendation Method for Mobile Applications; (4) Method, apparatus, and system for two factor authentication in single step with wearable devices; (5) Method, apparatus, and system for non-contact breathing volume monitoring using radio signals from afar; (6) Method and apparatus for battery-free identification token for touch sensing devices; (7) Method, apparatus, and system for in-ear biological signal monitoring (8) Apparatus and methods for smart phone-based Sp02 measurement; (9) Computing Systems for Determining Vital Information; (10) Personalized Health Care Wearable Sensor System; (11) Drone Presence Detection by Identifying Physical Signatures in the Drone’s RF Communication; (12) An Ear-Worn Device for Providing Silent Speech Input to Computing Systems; (13) TYTH: Typing On Your Teeth: Tongue-Teeth Localization for Human-Computer Interface; (14) Respiratory Rate Measurement System; (15) Making GPS Signal Goes Indoor Through Commodity WiFi Access Points. T Vu receives support from National Science Foundation, Department of Homeland Security, Colorado Office of Economic Development and International Trade, University of Colorado, Google Inc, Microsoft inc. Qualcomm Inc.
RR Deterding: Co-Founder and Board Member – Triple Endoscopy, Inc. (Patent Nasal Endoscopy Scope), Advisory Board Pediatric Interstitial Lung Disease for Boehringer Ingelheim, Co-Founder and President Now Vitals, Inc., Co-Founder and Board Member Earable Inc. Patents: 1). Computing Systems for Determining Vital Information; 2). Personalized Health Care Wearable Sensor System; 3) Respiratory rate measurement system; 4) Health Sticker: A modular adhesive platform monitoring vital signs; 5) Breathing Gripper: A miniature breath monitoring device. RR Deterding receives support from Colorado Advanced Industries Accelerator (AIA).
References:
- 1.Fairchild KD. 2013. Predictive monitoring for early detection of sepsis in neonatal icu patients. Curr Opin Pediatr. 25(2):172–179. [DOI] [PMC free article] [PubMed] [Google Scholar]
- 2.Moss TJ, Lake DE, Calland JF, Enfield KB, Delos JB, Fairchild KD, Moorman JR. 2016. Signatures of subacute potentially catastrophic illness in the icu: Model development and validation. Crit Care Med. 44(9):1639–1648. [DOI] [PMC free article] [PubMed] [Google Scholar]
- 3.Sullivan BA, Fairchild KD. 2015. Predictive monitoring for sepsis and necrotizing enterocolitis to prevent shock. Semin Fetal Neonatal Med. 20(4):255–261. [DOI] [PubMed] [Google Scholar]
- 4.Parshuram CS, Duncan HP, Joffe AR, Farrell CA, Lacroix JR, Middaugh KL, Hutchison JS, Wensley D, Blanchard N, Beyene J et al. 2011. Multicentre validation of the bedside paediatric early warning system score: A severity of illness score to detect evolving critical illness in hospitalised children. Crit Care. 15(4):R184. [DOI] [PMC free article] [PubMed] [Google Scholar]
- 5.Bartlett KW, Parente VM, Morales V, Hauser J, McLean HS. 2017. Improving the efficiency of care for pediatric patients hospitalized with asthma. Hosp Pediatr. 7(1):31–38. [DOI] [PubMed] [Google Scholar]
- 6.Chalut DS, Ducharme FM, Davis GM. 2000. The preschool respiratory assessment measure (pram): A responsive index of acute asthma severity. J Pediatr. 137(6):762–768. [DOI] [PubMed] [Google Scholar]
- 7.Ducharme FM, Chalut D, Plotnick L, Savdie C, Kudirka D, Zhang X, Meng L, McGillivray D. 2008. The pediatric respiratory assessment measure: A valid clinical score for assessing acute asthma severity from toddlers to teenagers. J Pediatr. 152(4):476–480, 480 e471. [DOI] [PubMed] [Google Scholar]
- 8.Gorelick MH, Stevens MW, Schultz TR, Scribano PV. 2004. Performance of a novel clinical score, the pediatric asthma severity score (pass), in the evaluation of acute asthma. Acad Emerg Med. 11(1):10–18. [DOI] [PubMed] [Google Scholar]
- 9.Kelly C Anderson CL, Pestian JP, Wenger AD, Finch AB, Strope GL, Luckstead EF. 2000. Improved outcomes for hospitalized asthmatic children using a clinical pathway. Ann Allergy Asthma Immunol. 84(5):509–516. [DOI] [PubMed] [Google Scholar]
- 10.Cunningham S, Logan C, Lockerbie L, Dunn MJ, McMurray A, Prescott RJ. 2008. Effect of an integrated care pathway on acute asthma/wheeze in children attending hospital: Cluster randomized trial. J Pediatr. 152(3):315–320. [DOI] [PubMed] [Google Scholar]
- 11.Wazeka A, Valacer DJ, Cooper M, Caplan DW, DiMaio M. 2001. Impact of a pediatric asthma clinical pathway on hospital cost and length of stay. Pediatr Pulmonol. 32(3):211–216. [DOI] [PubMed] [Google Scholar]
- 12.Birken CS, Parkin PC, Macarthur C. 2004. Asthma severity scores for preschoolers displayed weaknesses in reliability, validity, and responsiveness. J Clin Epidemiol. 57(11):1177–1181. [DOI] [PubMed] [Google Scholar]
- 13.Asthma clinical care guidelines: Information for healthcare providers, childrens hospital colorado. 2013. Aurora CO; [accessed 2018 September 25, 2018]. https://www.ihconline.org/media/cms/Childrens_Hospital_Colorado_asthmac_147F03BB6763A.pdf.
- 14.Bratton SL, Odetola FO, McCollegan J, Cabana MD, Levy FH, Keenan HT. 2005. Regional variation in icu care for pediatric patients with asthma. J Pediatr. 147(3):355–361. [DOI] [PubMed] [Google Scholar]
- 15.National Asthma E, Prevention P. 2007. Expert panel report 3 (epr-3): Guidelines for the diagnosis and management of asthma-summary report 2007. J Allergy Clin Immunol. 120(5 Suppl):S94–138. [DOI] [PubMed] [Google Scholar]
- 16.Panch T, Szolovits P, Atun R. 2018. Artificial intelligence, machine learning and health systems. J Glob Health. 8(2):020303. [DOI] [PMC free article] [PubMed] [Google Scholar]
- 17.Bonafide CP, Brady PW, Keren R, Conway PH, Marsolo K, Daymont C. 2013. Development of heart and respiratory rate percentile curves for hospitalized children. Pediatrics. 131(4):e1150–1157. [DOI] [PMC free article] [PubMed] [Google Scholar]
- 18.Silber JH, Rosenbaum PR, Wang W, Ludwig JM, Calhoun S, Guevara JP, Zorc JJ, Zeigler A, Even-Shoshan O. 2016. Auditing practice style variation in pediatric inpatient asthma care. JAMA Pediatr. 170(9):878–886. [DOI] [PubMed] [Google Scholar]
- 19.Bateman ED, Hurd SS, Barnes PJ, Bousquet J, Drazen JM, FitzGerald JM, Gibson P, Ohta K, O’Byrne P, Pedersen SE, Pizzichini E, Sullivan SD, Wenzel SE, Zar HJ.. 2008. Global strategy for asthma management and prevention: Gina executive summary. Eur Respir J. 31(1):143–178. [DOI] [PubMed] [Google Scholar]
- 20.Akinbami LJ, Moorman JE, Liu X. 2011. Asthma prevalence, health care use, and mortality: United states, 2005–2009. Natl Health Stat Report. (32):1–14. [PubMed] [Google Scholar]
- 21.Akinbami LJ, Moorman JE, Bailey C, Zahran HS, King M, Johnson CA, Liu X. 2012. Trends in asthma prevalence, health care use, and mortality in the united states, 2001–2010. NCHS Data Brief. (94):1–8. [PubMed] [Google Scholar]
- 22.Weissman JS, Gatsonis C, Epstein AM. 1992. Rates of avoidable hospitalization by insurance status in massachusetts and maryland. Journal of the American Medical Association. 268(17):2388–2394. [PubMed] [Google Scholar]
- 23.Luo G, Stone BL, Fassl B, Maloney CG, Gesteland PH, Yerram SR, Nkoy FL. 2015. Predicting asthma control deterioration in children. BMC Med Inform Decis Mak. 15:84. [DOI] [PMC free article] [PubMed] [Google Scholar]
- 24.Luo G, Nkoy FL, Stone BL, Schmick D, Johnson MD. 2015. A systematic review of predictive models for asthma development in children. BMC Med Inform Decis Mak. 15:99. [DOI] [PMC free article] [PubMed] [Google Scholar]
- 25.Messinger AI, Deterding RR, Szefler SJ. 2018. Bringing technology to day-to-day asthma management. Am J Respir Crit Care Med. 198(3):291–292. [DOI] [PubMed] [Google Scholar]
- 26.Moulton SL, Mulligan J, Santoro MA, Bui K, Grudic GZ, MacLeod D. 2017. Validation of a noninvasive monitor to continuously trend individual responses to hypovolemia. J Trauma Acute Care Surg. 83(1 Suppl 1):S104–S111. [DOI] [PubMed] [Google Scholar]
- 27.Fairchild KD, Lake DE, Kattwinkel J, Moorman JR, Bateman DA, Grieve PG, Isler JR, Sahni R. 2017. Vital signs and their cross-correlation in sepsis and nec: A study of 1,065 very-low-birth-weight infants in two nicus. Pediatr Res. 81(2):315–321. [DOI] [PMC free article] [PubMed] [Google Scholar]
- 28.Convertino VA, Grudic G, Mulligan J, Moulton S. 2013. Estimation of individual-specific progression to impending cardiovascular instability using arterial waveforms. Journal of Applied Physiology. 115(8):1196–1202. [DOI] [PubMed] [Google Scholar]
Associated Data
This section collects any data citations, data availability statements, or supplementary materials included in this article.