

Key Points
Automated machine learning approach to identify vaccine-induced immune signatures.
Analysis of multidimensional clinical data collected across multiple cohorts.
Increasing predictive performance of models by using heterogenous clinical data.
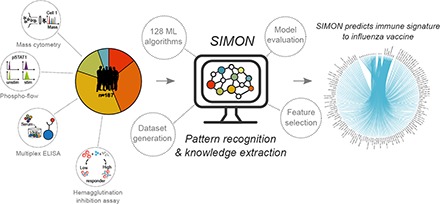
Visual Abstract
Abstract
Machine learning holds considerable promise for understanding complex biological processes such as vaccine responses. Capturing interindividual variability is essential to increase the statistical power necessary for building more accurate predictive models. However, available approaches have difficulty coping with incomplete datasets which is often the case when combining studies. Additionally, there are hundreds of algorithms available and no simple way to find the optimal one. In this study, we developed Sequential Iterative Modeling “OverNight” (SIMON), an automated machine learning system that compares results from 128 different algorithms and is particularly suitable for datasets containing many missing values. We applied SIMON to data from five clinical studies of seasonal influenza vaccination. The results reveal previously unrecognized CD4+ and CD8+ T cell subsets strongly associated with a robust Ab response to influenza Ags. These results demonstrate that SIMON can greatly speed up the choice of analysis modalities. Hence, it is a highly useful approach for data-driven hypothesis generation from disparate clinical datasets. Our strategy could be used to gain biological insight from ever-expanding heterogeneous datasets that are publicly available.
Introduction
The immune system comprises multiple cell types that work together to develop an effective response to a given pathogen. However, which of these myriad cell types are important in a particular response is not well understood. The increasingly common systems immunology approach measures gene expression and different cells and molecules in the immune system during an infection or vaccination and uses computational methods to discern which components are most important (1–6). These studies have the practical goal of determining what makes one vaccine formulation better than another or how individuals vary. In addition, it may suggest a mechanistic understanding of how an effective immune response is achieved. To accomplish this, an accurate modeling of the complex processes that lead to a successful outcome is crucial.
Over the past few years, many systems studies of influenza vaccination responses in human beings have been analyzed computationally, but the results have not been consistent (2, 3, 7–10). One reason for these inconsistent results is the relatively small sample sizes. Another is that studies focus on only one biological aspect; for example, molecular correlates of protection by using transcriptome data (11). However, a more robust approach to understanding how a vaccine works would involve analyzing multiple parameters from many individuals across different populations to more accurately capture biological variability. Furthermore, this would increase the statistical power, ultimately leading to the generation of classification and regression models with more robust performance metrics. Although the number of studies and the amount of data are expanding dramatically, analyzing diverse samples across clinical studies remains challenging (12). This is particularly true for data from flow and mass cytometry, in which the number of markers analyzed can vary tremendously (13).
In this study, we develop an approach that optimizes a machine learning workflow through a Sequential Iterative Modeling “OverNight” (SIMON). SIMON is specifically tailored for clinical data containing inconsistent features with many missing values. SIMON uses multiset intersections to successfully feed such data into an automated machine learning process with minimal sample losses. Our approach runs hundreds of different machine learning algorithms to find the ones that fit any given data distribution, and this maximizes predictive accuracy and other performance measurements. We used SIMON to analyze data from the Stanford Human Immune Monitoring Center (HIMC) collected from five separate clinical studies of seasonal influenza vaccination, obtained over 8 years, with various platforms and expanding parameters. This enabled a systems-level identification of features that correlate with protective immunity to influenza. In the resulting models, we identified several previously unknown immune cell subsets that correlated with a successful influenza vaccination outcome, as defined by Ab responses. The impact of our findings is 2-fold. First, the study offers a new tool that can increase the accuracy of predictions from heterogeneous biological datasets. Second, it provides new targets for the development of the next generation of influenza vaccines.
Materials and Methods
Subjects, sample, and data collection
All clinical studies were approved by the Stanford Institutional Review Board and performed in accordance with guidelines on human cell research. Peripheral blood samples were obtained at the Clinical and Translational Research Unit at Stanford University after written informed consent/assent was obtained from participants. Samples were processed and cryopreserved by the Stanford HIMC BioBank according to the standard operating protocols (14). All materials and data were analyzed anonymously.
In this study, we used data from 187 healthy donors who were enrolled in influenza vaccine studies at the Stanford-LPCH Vaccine Program from 2007 to 2014. This included the following studies: SLVP015 (NCT01827462, accessible at http://www.clinicaltrials.gov, and National Institute of Allergy and Infectious Diseases ImmPort accession number SDY212, accessible at http://www.immport.org, data analysis described in Ref. 15), SLVP017 (NCT02133781, NCT03020498, and NCT03020537), SLVP018 (NCT01987349, NCT03022396, NCT03022422, NCT03022435, and NCT3023176, data analysis published in Ref. 16), SLVP021 (NCT02141581), SLVP028 (NCT03088904), and SLVP029 (NCT03028974). Individuals were selected for this study based on the following criteria: 1) age range from 8 to 40 y; 2) received inactivated influenza vaccine (Fluzone, i.m.); 3) only data from the first visit (some donors came in consecutive years); 4) hemagglutination inhibition assay (HAI) titer measured; and 5) information about gender and age available. Exclusion/inclusion criteria, samples that were acquired with timepoints, and analyses performed are described in the study record details at Web site repository for clinical studies (http://www.ClinicalTrials.gov) using provided identifiers (IDs). All the protocols for sample analysis such as immunophenotyping and determination of signaling responses to stimulation using flow or mass cytometry, HAI titer determination, and determination of cytokines/chemokines in samples using Luminex assay are available online (14). Additionally, protocol for immunophenotyping using mass cytometry was published in Leipold and Maecker (17). Phosphoflow assay using flow cytometry (for studies SLVP15, SLVP18, and SLVP21 from 2007 to 2011), was described in (15, 16) or using mass cytometry (for study SLVP21 in 2013) in (18). Luminex assay was described in (15, 16). The HAI assay was performed on sera from day 0 to day 28 using a well-established method (19) and was described before (2, 15).
All data used were analyzed and processed at the HIMC, as previously described (20), and uploaded to the Stanford Data Miner (21). Briefly, data from both Luminex assays were normalized at the plate level to mitigate batch and plate effects. The two median fluorescence intensity values for each sample for each analyte were averaged and then log-base 2 transformed. The Z-scores ([value – mean]/SD) were computed, with means and SDs computed for each analyte for each plate. Thus, units of measurement were Zlog2 for serum Luminex. For phospho-flow data acquired on flow cytometer, a fold change value was computed as the stimulated readout divided by the unstimulated readout (e.g., 90th percentile of median fluorescence intensity of CD4+ pSTAT5 IFN-α stimulated/90th percentile of CD4+ pSTAT5 unstimulated cells), whereas for data acquired using mass cytometry, a fold change was calculated by subtracting the arcsinh (intensity) between stimulated and unstimulated (arsinh stim – arcsing unstim). For immunophenotyping using mass cytometer units of measurement were percentage of parent population.
Aggregation of data and generation of feature subsets
The data from Stanford influenza datasets were obtained from HIMC Stanford Data Miner (21). Downloaded csv files were automatically imported to the MySQL database to facilitate further analysis, as described (A. Tomic, I. Tomic, C.L. Dekker, H.T. Maecker, and M.M. Davis, manuscript posted on bioRxiv). Briefly, datasets were merged using shared variables, such as donor ID, study ID, gender, age, race, donor visit ID, visit year, experimental data (connected to donor visit ID), assay, name, and value of the measured analyte. The vaccine outcome was calculated using Ab titers evaluated by HAI. High responders were determined as individuals who have HAI Ab titer for all vaccine strains ≥40 and geometric mean (GeoMean) HAI fold change ≥4. The fold change is calculated as follows: (GeoMean HAI Ab titer for all vaccine strains on day 28)/(GeoMean HAI Ab titer for all vaccine strains on day 0). To facilitate analysis, vaccine outcome was expressed as a binary value: high responders were given a value of 1, whereas low responders a value of 0.
To deal with missing values, in the first step of SIMON, we implemented a novel algorithm, mulset, that allows for faster generation of datasets with all possible combinations of features and donors across initial dataset. To efficiently compute shared features and quickly find similarities between donors, mulset algorithm generated a unique feature ID for each donor. Then, intersection between the IDs was used to identify shared variables. The identified, shared variables are then converted to unique shared features IDs using hash function. Finally, data were exported from the database according to the shared features. In total, mulset generated 45 different datasets. To generate reasonable number of datasets, we removed datasets with low numbers of donors and features (<5 features and <15 donors). However, this threshold is arbitrary and can be set higher, with maximum threshold of 40 donors per dataset. Datasets with <40 donors will be removed in the next step of the SIMON analysis (all datasets with <10 donors in the test set are removed). After applying that restriction, 11 datasets were deleted, and final analysis was performed on 34 datasets.
Overview of SIMON
To identify baseline immune predictors that can discriminate between high and low responders following influenza vaccination, we applied SIMON. SIMON allows for dataset generation, feature subset selection, classification, evaluation of the classification performance, and determination of feature importance in the selected models. The SIMON was implemented in R programming language (22). First in SIMON, we automated the process of dataset generation using mulset algorithm as described above. Next, each dataset was partitioned into 75% training and 25% test set, with balanced class distribution of high and low responders using the function createDataPartition from the Caret package (23). Briefly, the dataset is split into groups based on percentiles, and sampling is done randomly within these subgroups in an attempt to balance the class distributions (23). To prevent evaluation of small test sets that would lead to misleading performance parameters, datasets with <10 donors in test sets were discarded. The threshold was determined based on the evaluation of the performance measures of the models built, where smaller size of test sets gave misleading higher performance of the models. Next, the model training using 128 machine learning algorithms suitable for classification training (Supplemental Table I) was initiated for each train dataset. Test sets were held out for evaluation of model performance on unseen datasets. This step was crucial to prevent overfitting. All algorithms were processed in an automated way through the Caret library (23). Each model was evaluated using 10-fold cross-validation (24) repeated three times. Additionally, performance of each model was evaluated on the test set that was held out before model training by calculating performance from a confusion matrix using available R package (25). Furthermore, contribution of each feature to the trained model was evaluated and variable importance score is calculated as described (23). All prediction metrics and performance variables are stored in the MySQL database for the final exploratory analysis. Detailed description of the overall processes is as follows.
Model training and performance evaluation.
Each model was evaluated by calculating performance measures using the confusion matrix. Confusion matrix, or contingency table, is used to evaluate the performance of a classification model on a set of data for which the true values are known. The confusion matrix has four categories (Table I). True positives (TP) are cases in which the classification model predicted them to be high responders, and indeed, those cases were high responders, whereas true negatives (TN) correspond to cases correctly labeled as low responders. Finally, false negatives (FN) and false positives (FP) refer to low responders or high responders that were incorrectly labeled. From a confusion matrix, to evaluate classification models, we calculated following performance measures. Accuracy, a measure of how often the classifier is correct, was calculated as (TP + TN)/(total number of observations). Specificity, the proportion of actual negative cases (low responders) that were correctly identified was calculated as TN/(FP + TN), whereas sensitivity (also known as recall or TP rate), the proportion of actual positive cases (high responders) correctly labeled, was calculated as TP/(TP + FN). To summarize the performance of classification models over all possible thresholds, we generated the receiver operating characteristic curve by plotting the sensitivity (y-axis) and the FP rate (the proportion of low responders misclassified as high responders), which was calculated as 1 − specificity (x-axis). Finally, we calculated the area under the receiver operating characteristic curve (AUROC) using an R package (25) and used this measure to summarize the performance of the models. AUROC has values between 0 and 1, and higher values indicate better performance. A value of 0.5 indicates a random classifier, and this was used as a cutoff to remove classifiers that could not distinguish between high and low responders better than by random chance. In this study, 10-fold cross-validation was applied three times, the AUROC was calculated for each repeated iteration, and the average AUROC (and other measures) are reported as an overall quantitative estimate of classification performance. Additionally, before model training, the same seed for random number generator was applied (set.seed 1234). This resulted in the uniformity in which, for each model, same resamples were used for performance evaluation. From this, we compared models and evaluated which model was performing better in terms of AUROC values by comparing performance of the resampling distributions using functions described in the Caret (23).
Table I. An example confusion matrix for a binary classifier.
| Actual | |||
|---|---|---|---|
| Positive (high responder) | Negative (low responder) | ||
| Predicted | Positive (high responder) | TP | FN |
| Negative (low responder) | FP | TN | |
Independent evaluation of the trained model.
The performance of each model was additionally evaluated on the test set that was held out before training the model (25% of the dataset). The performance on the test set was evaluated exactly as described for the train set above. A confusion matrix was built and all the performance measures, including the AUROC, were computed as for the train set. Test AUROC was used to select models, in addition to train AUROC.
Variable importance score.
Contribution of each feature to the model (i.e., variable importance score) was calculated using the Caret library (23). Briefly, evaluation of the variable importance was calculated directly from the model specific metrics, and the variable importance scores were scaled to have a maximum value of 100. Because in SIMON we used many different algorithms, the contribution of each feature to the model was estimated using the methods appropriate for each algorithm, as described in R packages (see reference list for the Supplemental Table I).
Feature selection using Boruta algorithm
To evaluate the all-relevant features for the selected top-performing models built on datasets 13 and 36, we used an R package Boruta (26). Boruta algorithm performs as a wrapper algorithm around Random Forest (26). The method is suitable for selection of all-relevant features, and this is accomplished by comparing original features’ importance with importance achievable at random (estimated using permuted copies of the original features, called shadow features). In each iteration, Boruta removes irrelevant features and evaluates the performance of the model. Finally, analysis is finished either when all features are confirmed or rejected or when Boruta reaches a specified limit of runs. Boruta was performed using the following parameters: maximal number of importance source runs, maxRuns at 1000, and pValue confidence level 0.05; also, a multiple comparisons adjustment using Bonferroni method was applied (mcAdj set to TRUE), feature importance was obtained using Random Ferns (function getImpFerns), and, to ensure reproducibility of the results, we set the seed for the random number generator (set.seed 1337). Tentative features were also included returned in the Boruta results (withTentative argument was set to TRUE).
Peptide stimulation and intracellular cytokine staining using mass cytometry
Thawed PBMC were rested in X-VIVO 15 medium (Lonza) supplemented with 10% FCS and human serum AB (Sigma-Aldrich) for 2 d at 107 cells/ml in a 24-well plate following “RESTORE” protocol (27, 28). For stimulation assay, 5 × 10⁶ PBMC were seeded in 96-well V-bottom plates (106 PBMC per well) and stimulated overnight (12–16 h) with the influenza overlapping peptide pool. Influenza peptide pool contained 483 peptides (20 mers with 11 aa overlap; Sigma-Aldrich) spanning the entire influenza proteome from the influenza strain A/California/07/2009 (dissolved in DMSO at 20 mg/ml, working concentration 0.2 μg/ml per peptide) and 24 peptides with HLA-A*0201 specificity (9–10 mers; Sigma-Aldrich) generated against influenza proteins (hemagglutinin, nucleocapsid protein, matrix protein 1, nonstructural protein 1 and 2) from the influenza strain A/California/07/2009 using prediction software NetCTL-1.2 (29) (dissolved in water or PBS/DMSO at 20 mg/ml, working concentration 2 μg/ml/peptide) (Supplemental Table II). In both assays, an unstimulated sample was prepared in which only medium without peptides containing 0.5% DMSO was added. Protein transport inhibitor mixture (eBioscience/Thermo Fisher Scientific) and Ab against CD107a were added at the beginning of the assay. After peptide stimulations, PBMC were washed with the CyFACS buffer (PBS supplemented with 2% BSA, 2 mM EDTA, and 0.1% sodium azide) and stained with surface Ab mixture (Supplemental Table III), then filtered through 0.1-μm spin filter with 20 μl/sample of Fc block (Thermo Fisher Scientific) for 30 min at 4°C. After washing with CyFACS buffer, cells were incubated for 5 min at room temperature (RT) in 1 × PBS (Lonza) with 1:1000 diluted cisplatin (Fluidigm). Cells were then incubated for 1 h at RT (or left at 4°C overnight) in the iridium-intercalator solution in fixation and permeabilization buffer (BD Cytofix/Cytoperm; BD Biosciences). After washing with 1× permeabilization buffer (BD Perm/Wash; BD Biosciences), cells were stained for 30 min at RT with intracellular Ab mixture diluted in 1× permeabilization buffer (Supplemental Table III). Cells were fixed with BD Cytofix/Cytoperm and left overnight until analysis or immediately used for mass cytometry. Immediately before starting the analysis, cells were washed in CyFACS buffer, then PBS, and finally with Milli-Q water. Prior to data acquisition, cells were resuspended in Milli-Q water containing 1:10 diluted normalization beads (EQ Four Element Calibration Beads; Fluidigm) to the concentration of <8 × 10⁵ cells/ml to achieve an acquisition rate of 400 events per s on the CyTOF Helios mass cytometer (Fluidigm). In each sample, 1–1.5 million cells were acquired. After acquisition, data were normalized with the reference EQ passport P13H2302 (30), and further data analysis was performed using FlowJo v10.
Statistical analysis
All the statistical parameters (sample size, statistical tests, and statistical significance) are reported in the figures and figure legends. Significance of differences in frequencies of the immune cell subsets between high and low responders in the datasets was calculated using the significance analysis of microarrays (SAM) (31) at false discovery rate (FDR) <1%. Mass cytometry data between two groups after peptide stimulation were analyzed using the one-way ANOVA Kruskal–Wallis test followed by Dunn multiple comparison test, whereas paired samples within groups were compared with two-tailed Wilcoxon matched-pairs signed rank test. Additionally, pairwise t test with the Benjamini–Hochberg (B-H) correction for multiple testing adjustment with 0.95 confidence level was used to evaluate changes in the cell frequencies after vaccination within groups. Pearson correlation coefficient was used to evaluate the correlations between features from the top-performing models. The Corrplot package in R was used to calculate correlation coefficients, statistics, and visualization of the correlation matrix (32). The p values were adjusted for multiple comparisons by using the B-H correction (33). Statistical analyses were performed with GraphPad PRISM 7.04 (Graph Pad Software) or in R, and p > 0.05 was considered nonsignificant.
Code and data availability
The source code of the mulset algorithm is available from https://github.com/LogIN-/mulset. The mulset is available as an R package in CRAN, a repository of open-source software. The source code, installation instructions, and data from the SIMON analysis are available from https://github.com/LogIN-/simon-manuscript. Raw data from the initial dataset used in SIMON analysis are available from a research data repository Zenodo (https://zenodo.org/record/2578166#.XHWDibh7lPY) (34). All models generated by SIMON are available at the Zenodo (https://zenodo.org/record/2580416#.XHiItLh7lPY) (35). Mass cytometry fcs files related to Fig. 4 are also available at the Zenodo (https://zenodo.org/record/1328286) (36). The results from SIMON exploratory analysis are available online at http://www.fluprint.com.
FIGURE 4.

SIMON identifies cellular signature associated with the successful generation of influenza immunity after vaccination. (A) Features with variable importance score above 50 from the model built on dataset 13 are shown. (B) Raw data confirmed by SAM analysis to be significantly changed in the donors from dataset 13 (n = 61 from which high responders = 17 and low responders = 44), indicating frequency of cells (as a percentage of the parent population). (C) Representative plot showing TNF-α intracellular staining of CD161+ CD4+ T cells in the unstimulated (−) or influenza peptide pool (+)–stimulated PBMC from high responder obtained before vaccination. Graph on the right shows the frequency of TNF-α+ CD161+ CD4+ T cells from high responders (red circles, n = 7) and low responders (gray circles, n = 7) in the samples before vaccination. Individual donors are connected with lines. (D) Violin plots show distribution of frequency of CD161+ CD4+ T cells and CXCR5+ CD8+ T with Tc2 and Tc17 phenotype in the PBMC samples derived from high (red, n = 7) and low responders (gray, n = 7) analyzed before vaccination (−) and on day 28 after vaccination (+). (E) Variable importance score of features selected in the model built on dataset 36 with score above 50. (F) Significant immune cell subsets selected by SAM analysis shown as raw data corresponding to donors from dataset 36 (n = 40 from which high responders = 12 and low responders = 28), indicating frequency of cells (as percentage of parent population). (G) Representative plot showing IL-17A intracellular staining of EM CD8+ T cells in the unstimulated (−) or influenza peptide pool–stimulated (+) PBMC from high responders, obtained after vaccination. The graph on the right shows the frequency of IL-17A+ EM CD8+ T cells from high (red circles, n = 7) and low (gray circles, n = 7) responders in the samples after vaccination. (H) Violin plots show distribution of frequency of CD4+ and CD8+ T cells, with indicated phenotypes analyzed in the PBMC samples derived from high (red, n = 7) and low responders (gray, n = 7) before (−) and on day 28 after (+) vaccination. Graphs shown in (C), (D), (G), and (H) represent combined data from seven independent experiments. Violin plots show distribution of individuals. These are represented by red circles for high responders and gray circles for low responders. The line indicates the median. Statistical analysis between high and low responders was performed with one-way ANOVA Kruskal–Wallis test followed by Dunn multiple comparison test. Analysis within groups before and after vaccination was calculated using two-tailed Wilcoxon matched-pairs signed rank test. Significance in SAM analysis was considered at FDR <0.01. *p < 0.05, **p < 0.01. ns, nonsignificant.
Results
Preprocessing of data collected across different clinical studies
To test robustness of our approach, we used data from the Stanford HIMC. This data included 187 nominally healthy individuals between 8 and 40 y of age undergoing an annual influenza vaccination recruited over eight consecutive seasons, from 2007 to 2014, and five clinical studies (Fig. 1A). Blood samples were acquired before vaccination and on day 28 after vaccination. Over 3800 parameters were measured at baseline. This included 102 blood-derived immune cell subsets analyzed by mass cytometry (Supplemental Fig. 1, Supplemental Table IV). It also included the signaling capacity of over 30 immune cells subsets stimulated with seven conditions, which were evaluated by measuring the phosphorylation of nine proteins (Supplemental Table V). Additionally, up to 50 serum analytes were evaluated using Luminex bead arrays (Supplemental Table VI). On day 28 after vaccination, the serum titer of hemagglutinin-specific Abs against all vaccine strains was determined using the HAI, which is the best-defined correlate of influenza immunity induced by this vaccine (37). The HAI Ab titers were calculated as the fold change between the HAI titer at day 28 relative to the baseline titer. High and low responders were determined using metrics defined by the US Centers for Disease Control and Prevention to evaluate influenza vaccine efficacy: seroconversion and seroprotection (38). Individuals were considered to be high responders if they had a protective HAI Ab titer to all vaccine strains (HAI Ab titer ≥40) and if they seroconverted (GeoMean HAI titer ≥4).
FIGURE 1.

Study design. (A) One hundred eighty-seven healthy donors (average age 22 y, range 8–40 y of age) were recruited across eight consecutive influenza seasons. Data acquired at the baseline (day 0) included phenotypical and functional state (phosphorylated proteins) of immune cells analyzed using flow or mass cytometry and serum analysis using Luminex assay. Individuals were labeled as high or low responders, depending on the HAI Ab titers determined on day 28 after vaccination. (B) HAI Ab responses to influenza vaccine strains in high (H, red) and low (L, gray) responders across years. Numbers below x-axis indicate the number of donors in each group. HAI responses are shown as GeoMean titer (GMT) calculated as a fold change between day 0 and day 28 after vaccination for all vaccine strains. Violin plots show distribution of individuals. The line shows the median. Seroconversion is defined as 4-fold increase in HAI titer for all vaccine strains (denoted by a gray line).
Out of 187 analyzed donors, 64 were identified as high responders and 123 as low responders (Fig. 1B). Overall, there were no major differences in the age, gender, or study year between the high and low responders (Supplemental Fig. 2). The only exception was that a higher proportion of adolescents were high responders, which is in line with published data (39) (Supplemental Fig. 2B).
Dealing with missing values using intersection function
A major problem when using data across clinical studies and years is the lack of overlap between the features measured. Indeed, even though the data comes from a single facility, in many years there was an increase in the number of parameters measured, especially in the transition from FACS analysis (12–14 parameters) to mass cytometry (25–34 parameters). Because all assays were not performed across all studies and years (Supplemental Fig. 3), the percentage of missing values in the initial dataset was 93.2% (Supplemental Fig. 4). Such high data sparsity, which is commonly encountered in the clinical data, does not allow for straightforward statistical analysis. Therefore, we had to reduce the number of missing values. Researchers and data scientists deal with missing values either by deletion or by imputation of missing data (40). However, analysis of the missing data distribution revealed that when all studies were combined, the dataset had missing values in every column and every row, and many of the columns and rows had sparsity of 90% (Supplemental Table VII). Therefore, if we deleted either rows or columns, this would result in data with zero subjects. This approach was unsuitable. Additionally, effective imputation was strongly limited by the small number of cases that could be used as prior knowledge. Overall, we concluded that the high number of columns and rows with missing values made it impossible to use the whole dataset for further analysis.
Because this could be a very useful dataset for predictive modeling of influenza vaccine responses, we explored alternative ways to reduce the number of missing values. To ensure that interpretation of the initial dataset was preserved and so as not to introduce bias, we selected feature subsets from the original dataset without transformation by identification of the overlap (i.e., intersection) between multiple donors. We hypothesized that by using intersection, we could identify features shared across donors. Such a process could generate feature subsets that span an entire initial dataset. Additionally, it was expected that reducing the number of features would improve the performance of the model, such as was shown for random initial subset selection (41).
In the first step of SIMON, we implemented an algorithm, mulset, to identify features shared across donors and generate datasets containing all possible combinations of features and donors across the entire initial dataset. The proof-of-principle how mulset algorithm works and dataset generated are shown in the Fig. 2. The mulset was inspired by an approach commonly used in computer science to accelerate detection of duplicated records across large databases (42). By using the intersect function, we identified shared features between donors. These were converted to a unique shared feature ID using the hash function. This process allowed the rapid identification of donors with shared features and the generation of datasets that can be used in further analysis (Fig. 2A, 2B). The mulset algorithm calculated overlapping features between all donors, resulting in 34 datasets with different numbers of donors and features (Fig. 2C, Supplemental Table VIII). After applying the mulset algorithm, the dimensionality of the data were significantly reduced, because all generated datasets had a maximum of 300 shared features. This step was essential to avoid dealing with the datasets that suffer from “the curse of dimensionality” (43), that is, with increasing dimensionality (the number of features analyzed) we would need more donors to achieve significance. Eleven of the generated datasets had a higher number of donors than features, with a maximum number of 143 donors that shared 49 features (Fig. 2C, Supplemental Table VIII, dataset 8). Such datasets have a higher statistical power for building more accurate machine learning models.
FIGURE 2.

Automated feature subset generation using multiset intersect function. (A) Proof-of-principle showing how a multiset intersect function works on a hypothetical dataset with only four features and four donors. Missing values are indicated by white circles. Missing values are present is such a way that removal of either donors or features would result in no data for analysis. Using a multiset intersect function, the mulset algorithm, identified shared feature sets between donors. First, for each donor, the algorithm determined the unique feature ID. Second, using the intersect function, it identified shared features, which were then converted to shared features ID using hash functions. Finally, the mulset algorithm searched the database and identified donors with shared feature sets. (B) In this hypothetical example, the mulset would generate 10 distinct datasets with distinct feature and donor numbers, as indicated. (C) The mulset algorithm generated 34 datasets from the initial dataset with indicated distribution of donors (black bars) and features (red bars).
Overall, the first step in the SIMON produced more restricted datasets with higher data quality and reduced the number of features, making it possible to continue the data analysis.
Automating the machine learning process and feature selection
The next step, following data preprocessing, was to apply machine learning algorithms to extract patterns and knowledge from each of the 34 datasets. To select relevant features, we based our approach on the method for feature selection proposed by Kohavi and John (44). In the original approach, termed wrapper, feature subsets were selected using two families of algorithms: the decision trees and the naive Bayes (44). In this study, we build upon this approach by adding ensemble algorithms [of which Random Forest was previously shown to be suitable for feature selection (26)] and other dimensionality-reduction algorithms, such as discriminant analysis. It is widely recognized that a best algorithm for all datasets does not exist (45). Currently, choosing an appropriate algorithm is done through a trial-and-error approach, with only a few algorithms tested. To identify optimal algorithms more quickly and efficiently across a broad spectrum of possibilities, we implemented an automated machine learning process in SIMON.
SIMON is described briefly in Fig. 3. The feature subset selection was performed by testing multiple algorithms without any prior knowledge and user-defined parameters on each of the 34 datasets in a sequential and iterative manner. First, each dataset was split into 75% training and 25% test sets, preserving balanced distribution of high and low responders, using the Caret package (23, 46) as described in the Materials and Methods. The training set was used for model training and feature selection. The accuracy of the feature selection was determined using a10-fold cross-validation, which was shown to out-perform other resampling techniques for model selection (24). The test set was used for evaluating model performance on independent data not used in the model training. In general, it is most efficient to train the model on the entire dataset. However, in our case, it was important to have an independent test set to evaluate and then compare performance of the many models we expected to obtain. Additionally, evaluating model performance using only cross-validation is not sufficient to conclude that model can be applied to other datasets. There could be a problem with overfitting, such as when a model does not generalize well to unseen data. Second, a fully automated process of model training using 128 machine learning algorithms was done initially on the training set and repeated for each dataset. Supplemental Table I provides a list of all machine learning classification algorithms used. Each model was evaluated by calculating the performance parameters using the confusion matrix on the training and test sets. A confusion matrix calculates FP and FN, as well as TP and TN. This allows for more detailed analysis than accuracy, which only gives information about the proportion of correct classifications, and therefore can lead to misleading results (47). In SIMON, for each model, we calculated the proportion of actual positive cases that were correctly identified (i.e., sensitivity) and the proportion of correctly identified actual negative cases (i.e., specificity). All performance parameters were saved in the MySQL database. Finally, to compare the models and discover which performed best, we calculated an AUROC. This is a widely used measure of quality for the classification of models, especially in biology (48). A random classifier that cannot distinguish between two groups has AUROC of 0.5, whereas AUROC for a perfect classifier that separates two groups without any overlap = 1.0 (49). Therefore, the training and test AUROC are reported throughout the text, and models are compared using that metric of performance.
FIGURE 3.

Automated feature selection and machine learning process integrated in SIMON. Before building a model, raw data were processed (cleaned, corrected, normalized, etc.) using extract-transform-load (ETL) operations, and the database was built. In the second step, new features were created from the existing data, GeoMean titer of the HAI response was calculated, and individuals were labeled as high or low responders. Third, datasets were generated using multiset intersection function. Each dataset was then used for model training in a fully automated machine learning process, implemented in SIMON. Briefly, before training started, each dataset was partitioned into training and test sets, which were excluded from the model-building phase. Finally, in the exploratory analysis, each model was evaluated based on its performance, and features were selected based on the importance score.
To test the feasibility of SIMON, we ran more than 2400 machine learning analyses on 34 datasets. SIMON built models for 19 datasets, with an average of 54 models built per dataset (Supplemental Table IX). None of the 128 machine learning algorithms tested were able to build a model for 15 of the datasets. This indicates that those have poor data quality and distributions. Therefore, they were discarded from further analysis. With the remaining 19 datasets, models were built with the training AUROC values ranging from a minimum of 0.08 to a maximum of 0.92 (Supplemental Table IX). Overall, the automated machine learning process improved the performance of the models in all 19 datasets, with a gain of performance ranging from 30 to 91% (Supplemental Table IX). This indicates that SIMON facilitates the identification of optimal algorithms, which ultimately increases the performance of models.
Performance estimation and model selection
Before model comparison, other performance parameters were calculated, in addition to AUROC, and were used to filter out poorly performing models with the goal of facilitating further exploratory analysis. To remove random classifiers, all models with AUROC ≤0.5 on both training and test sets were discarded. Furthermore, all models in which specificity and sensitivity of both training and test sets were <0.5 (i.e., models with higher proportion of FP and FN values) were also removed. This restriction discarded models in which the classifier achieved high performance, as indicated by a high AUROC, at the cost of a high FP or FN rate (50, 51). After applying these filters, many models were removed, decreasing the average number of models per dataset to three (Supplemental Table X). Additionally, eight datasets were discarded. This filtering step was essential to remove models which would otherwise be falsely evaluated as high performing, such as those built using dataset 205, for which a high AUROC of 0.92 was obtained at the expense of low specificity (0.06) (Supplemental Table IX).
To compare models within one dataset and discover which performs best, the random number seed was set before training with each algorithm. This ensured that each algorithm trained the model on the same data partitions and repeats. Further, it allowed for comparison of models using AUROC. In general, AUROC values between 0.9 and 1 are considered excellent, values 0.8–0.9 are considered good, 0.7–0.8 are considered fair, and values between 0.6 and 0.7 are considered as having poor discriminative ability (52). In SIMON, models trained on six datasets were built with fair discriminative ability (max. train AUROC between 0.7 and 0.8) (Supplemental Table X). To avoid overfitting, we additionally evaluated the performance of each model on the test set, which was not used for building the model. In this case, models trained on the three datasets were built with a fair discriminative ability (Supplemental Table XI, datasets 5, 13, and 171). One dataset (Supplemental Table XI, dataset 36) was built with a good discriminative ability (max. test AUROC 0.86), which could be generalized to an independent set. It should be noted that maximum AUROC values did not necessarily come from the same model (e.g., maximum train AUROC might come from model 1, whereas maximum test AUROC from model 2). To account for that, we add another filter to remove all models with poor discriminative ability, that is, all models in which the train and test AUROC were <0.7. By applying this restriction, we were left with only two datasets (datasets 13 and 36). These were used for further analysis and feature selection. The model built on dataset 36, with the shrinkage discriminant analysis, out-performed the other four models as evaluated by comparison of train AUROC (Supplemental Fig. 5A, Supplemental Table XII). A model was built with train AUROC of 0.78, and it performed well on an independent test set (test AUROC 0.86). The model built on dataset 13 with the Naive Bayes performed better than the other model built for the same dataset (train AUROC 0.75, test AUROC 0.7) (Supplemental Fig. 5B, Supplemental Table XIII).
Overall, SIMON facilitated exploratory analysis and discovery of models with good discriminative performance by integrating the filtering steps and evaluating comprehensive model performance.
Identification of all-relevant cellular predictors using SIMON
After selection of the best-performing models, we focused on feature selection. Our goal was to use SIMON to identify all-relevant features to deepen our knowledge about the process that drives Ab generation in response to influenza vaccination. To solve this problem, classifiers were used in SIMON to rank features based on their contribution to the model. Features were ranked depending on the variable importance score calculated for each model (23). The score ranges from 0 to 100. Features with variable importance score of 0 are not important for the classification model and can be removed from training the model.
First, we focused on the model built on dataset 13. In the dataset 13, 61 individuals were analyzed and 76 parameters were measured. Raw data from the dataset 13 are available as Supplemental Table XIV. Out of 61 donors, 17 were identified as high responders and 44 as low responders. Overall, there were no major differences in age distribution and gender (Supplemental Table XV). Out of 76 features, 64 had measurable variable importance score, and 15 features had variable importance score above 50 (Fig. 4A, Supplemental Table XVI). The top-ranked feature that highly contributed to this model was CD4+ T cells with the CD127−CD25hi phenotype [described as regulatory T cells (Tregs) (53)] that expressed CD161 and CD45RA markers (Supplemental Table XVI, rank 1). The frequency of Tregs with CD161−CD45RA+ phenotype was shown to be significantly greater among the high responders (Fig. 4B, FDR <0.01). To further explain features that contributed to this model, we performed correlation analysis. Correlation analysis revealed that Tregs with CD161−CD45RA+ phenotype had a significant positive correlation with the top-ranked feature, CD161+CD45RA+ Tregs (Pearson r = 0.54, p < 0.0001 after multiple comparison adjustment using the B-H correction) (Supplemental Fig. 6). Additionally, CD161+CD45RA+ Tregs had a weak, but significant, positive correlation with CD161+ CD4+ T cells (Pearson r = 0.08, p = 0.001 after multiple comparison adjustment using the B-H correction), which had high variable importance score (Supplemental Table XVI, rank 9). Such correlation indicated that these subsets might describe similar family of CD4+ T cells contributing to the generation of Ab responses after influenza vaccination. Indeed, a recent study suggests that expression of CD161 marks a distinct family of human T cells with a distinct lineage and with innate-like capabilities (54).
To experimentally validate results from this model, we analyzed the phenotype and functionality of immune cells before and after vaccination in the independent samples from 14 individuals (7 high and 7 low responders). Individuals were age- and sex-matched (Supplemental Table XVII). We found that after stimulation with the influenza peptides, CD161+ CD4+ T cells from high, but not low, responders produced TNF-α in the samples prior to vaccination (Fig. 4C). This indicated that CD161+ CD4+ T cells from high responders had a pool of pre-existing influenza-specific T cells. Additionally, after vaccination, the frequency of CD161+ CD4+ T cells with a CCR6+ CXCR3− (Th17) phenotype in high responders increased significantly (Fig. 4D).
The second most important feature in this model was CXCR5+ CD8+ T cells (also known as follicular cytotoxic T cells) (55–57) with a CCR6+ CXCR3− (Tc17) phenotype (Supplemental Table XVI, rank 2). Frequencies of CXCR5+ CD8+ T cells with Tc17 were significantly increased among the high responders (Fig. 4B, FDR <0.01). Additionally, frequencies of CXCR5+ CD8+ T cells with a CCR6−CXCR3− (Tc2) phenotype were also increased in the same group (Fig. 4B, FDR <0.01). CXCR5+ CD8+ T cells with Tc2 phenotype were also identified as important in this model (Supplemental Table XVI, rank 7) and had a significant positive correlation with Tc17 CXCR5+ CD8+ T cells (Pearson r = 0.66, p < 0.0001 after multiple comparison adjustment using the B-H correction) (Supplemental Fig. 6). However, analysis of the experimental data showed no significant participation of CXCR5+ CD8+ T cells in vaccine-induced responses, even though in a few of the high responders there was an increase of CXCR5+ CD8+ T cells with a Tc2 and Tc17 phenotype (Fig. 4D).
The results obtained in this model were confirmed using an R package, Boruta, that implements a novel feature selection algorithm for identifying all relevant features (26). CD127−CD25hi CD4+ T cells with the CD161 expression and CXCR5+ CD8+ T cells with Tc2 or Tc17 phenotype were identified as important (p < 0.05, after multiple comparison adjustment using the Bonferroni method), confirming findings obtained by SIMON (Supplemental Fig. 7A).
Second, we explored the features selected in the better performing model built on dataset 36. The raw data from the 40 donors and 103 features analyzed in the dataset 36 are provided as the Supplemental Table XVIII. In total, dataset 36 was composed of 40 donors, of which 12 were high responders and 28 low responders. No major differences were observed in the characteristics of the donors in both groups (Supplemental Table XIX). Out of 103 features, 88 had measurable variable importance scores ranging from 5 to 100 (Supplemental Table XX). Of those, 17 features had a variable importance score above 50 (Fig. 4E), indicating a strong contribution for this classification model. Interestingly, the effector memory (EM) CD4+ T cells, previously reported to correlate with Ab responses to influenza vaccine (58), were ranked in fifth place in our model. Moreover, B cells with memory phenotype, including a subset of IgD+ CD27+ memory B cells identified in previous studies (3, 8, 59), contributed to our model (Fig. 4E). Obtaining results supported by other studies gave us confidence in further analysis of our classification model. Importantly, the top four features identified have not previously been implicated as playing a major role in Ab responses to influenza vaccination, or indeed any Ab response. These included CD8+ T cells with expression of CD27 or CD85j markers and CD8+ T cells with varying degree of expression of CCR7 and CD45RA markers, described as naive, effector or terminally differentiated effector (TEMRA), and memory subsets (60). Analysis of the data particularly indicated that effector/TEMRA CD8+ T cells increased significantly among high responders (Fig. 4F, FDR < 0.01). In contrast, low responders had significantly higher frequency of early CD27+/CD28+ CD8+ T cells and naive CD8+ T cells (Fig. 4F, FDR < 0.01). Moreover, the effector/TEMRA CD8+ T cells were confirmed to contribute to this model by Boruta (p < 0.05, after multiple comparison adjustment using the Bonferroni method) (Supplemental Fig. 7B).
The top four features that contributed the most to this model were CD8+ T cells in early or late effector or memory states, indicating they might all be contributing to the influenza response through the same underlying mechanism. Indeed, correlation analysis showed that the top-ranked subset, CD27+ CD8+ T cells, had a significant correlation coefficient with other subsets (naive CD8+ T cells r = 0.80, CD28+ CD8+ T cells r = 0.85, CD85j+ CD8+ T cells r = −0.69, effector/TEMRA CD8+ T cells r = −0.61, and EM CD8+ T cells r = −0.71, p < 0.0001 after multiple comparison adjustment using the B-H correction) (Supplemental Fig. 8). Additionally, a specific subset of CD8+ T cells expressing NK cell–related receptor CD85j was identified as the TEMRA subset (61), whereas the expression of CD27 or CD28 was indicative of the subsets of T cells with a naive or early differentiation phenotype (62).
In the analysis of the independent samples, EM CD8+ T cells from high responders produced IL-17A after influenza peptide stimulation, demonstrating that this population contained influenza-specific T cells (Fig. 4G). Furthermore, the frequency of EM CD8+ T cells with a Tc17 phenotype was significantly increased only in high responders after vaccination (Fig. 4H). Additionally, the frequency of EM CD4+ T cells with Th17 phenotype was also increased in the same group of high responders after vaccination (Fig. 4H).
In summary, SIMON allowed us to identify both known and novel immune cell subsets that correlate with a robust Ab response to seasonal influenza vaccines. Particularly surprising was the number of different CD8+ T cell subsets, which are not typically thought of as playing any role in promoting robust Ab responses. We confirmed that IL-17A–producing EM CD8+ T cells, which contained a pool of pre-existing influenza T cells, were elevated in the high versus low responders with independent samples.
Discussion
In this study, we developed a novel computational approach, SIMON, for the analysis of heterogenous data collected across years and from heterogenous datasets. SIMON increases the overall accuracy of predictive models by using an automated machine learning process and feature selection. Using the results obtained by SIMON, we identified previously unrecognized CD4+ and CD8+ T cell subsets associated with robust Ab responses to seasonal influenza vaccines.
The accuracy of the machine learning models presented in this work was improved in two stages. First, to interrogate the entire dataset across different clinical studies, we integrated into SIMON an algorithm, mulset, which generates datasets using multiset intersections. This is particularly suitable for data with many missing values. In our case, because of the high sparsity of initial dataset, this step was essential for the further analysis. In general, clinical datasets are often faced with the same problem, namely, that many features are measured on a small number of donors. Because of the rapid advance of immune monitoring technology, many more parameters in our studies were measured in the later years than earlier. The same situation might arise when combining data collected in different facilities. An alternative approach might be the imputation of the missing values, but this would likely introduce bias. Moreover, the major limitation of effective imputation is the number of cases that could be used as prior knowledge. The sparsity of our initial dataset was too high for effective imputation. By using intersections, SIMON selects feature subsets by preserving the interpretation of the initial dataset and without introduction of a bias. Overall, an automated feature intersection process increases statistical power by accounting for variability among different individuals. Potentially, it could be applied across clinical studies. Additionally, by reducing the number of features, this process avoids working with dataset that might suffer from the curse of dimensionality, which ultimately improves the performance of models. This will be particularly important for the application of SIMON on larger publicly available datasets such as those stored in Gene Expression Omnibus repository (63) or ImmPort (64).
Second, finding the machine learning algorithm most suitable for specific data distribution allows for a better understanding of the data and provides much higher accuracy. The current state-of-the-art in building predictive models is to test several machine learning algorithms to find the optimal one. However, a single algorithm that fits all datasets does not exist. If an algorithm performs well on a certain dataset, it does not necessarily translate well to another dataset (even if it pertains to a closely related problem) (45). The overall accuracy of the predictive models depends on rigorous algorithm selection. With so many machine learning algorithms available, choosing the optimal one is a time-consuming task, often performed in a limited way (only dozens of algorithms are tested). Recent work has shown that automated machine learning can identify optimal algorithms more quickly and efficiently (65–67). Open competitions and crowdsourcing (e.g., http://www.kaggle.com), in which many groups contribute machine learning algorithms to build models for the same datasets, increase the accuracy and predictive performance of the models (68). By developing an automated machine learning process in SIMON, we can quickly identify the most appropriate machine learning algorithm (of the 128 tested) for any given dataset. Additionally, SIMON offers an alternative perspective on the application of algorithms that might never be used because of lack of expertise or knowledge necessary for their implementation. These features of SIMON also allow biologists with domain knowledge but who are not computationally adept to find the most effective tools with which to analyze their data.
In this study, we demonstrate the utility of SIMON and its automated machine learning processes to discover the principal features that correlate with high versus low influenza vaccine responders. We found it to be essential for identifying the best-performing models and extracting the most important features that contribute to those models. Performance of each model built in SIMON was automatically evaluated on both training and left-out test sets using well-known measures, such as AUROC, specificity, and sensitivity. This ensured that the model was not overfitted and that it could generalize to unseen data. Automating the entire process for model selection will be essential for future application of SIMON to bigger clinical datasets in which we would expect even greater number of models built. To optimize such high-throughput analysis application of strict filtering steps is necessary to avoid “cherry-picking” of the models. Here, both models were selected by stringent restrictions in the exploratory analysis and were built with AUROC scores between 0.7 and 0.9. Other models were discarded because exploration and characterization of features in those models would lead to identification of misleading results (FP and FN values). Because the goal of the study was to identify features that discriminate between high and low responders in a high-throughput manner, these models were built using the algorithms without any user-defined parameters. Therefore, each model could be fine-tuned, and its predictive performance might be increased. This could be of interest for researchers interested in building predictive models to identify features for use in diagnostic tests. In the future, we plan to improve SIMON by implementing an automated tuning process for each model.
This study demonstrated the advantage of SIMON over the conventional approach, in which one machine learning program is chosen by successfully identifying the immune signature driving influenza immunity. Some of our findings, such as the importance of EM CD4+ T cells and subsets of memory B cells, had been identified in previous studies (2, 8, 9), serving to validate our approach. Additionally, SIMON has identified previously unappreciated T cell subsets that discriminate between high and low responders. It is well known that T cells, in contrast to Abs produced by cells of B lineage, have the ability to provide durable and cross-protective immunity by targeting internal conserved viral epitopes (69, 70). Therefore, the CD4+ and CD8+ T cell subsets identified in this study could be useful targets for the development of broadly protective influenza vaccines. Influenza-specific CD4+ T cells have already been shown to be important for the generation of influenza immunity (71, 72). This was confirmed in the current study by showing that high responders had a pre-existing pool of influenza-specific CD4+ T cells expressing CD161. Additionally, we found that CD8+ T cells with an effector/TEMRA, EM and Tc17 phenotype and CXCR5 expression correlated with improved vaccine responses. These subsets are particularly interesting candidates and it will be of considerable interest to understand how they contribute to more robust Ab responses. CXCR5+ CD8+ T cells are enriched in the B cell follicles of germinal centers (56, 73), and they can promote B cell survival and Ab generation (57). CD8+ T cells with a Tc17 phenotype have been detected in the lungs of mice challenged with influenza A virus (74). Using independent samples from donors who were not included in the building and testing of our model, we found that CD8+ T cells from high responders contained influenza-specific cells with the ability to produce IL-17A in response to peptide stimulation. In a mouse model, IL-17A has been shown to be important for the generation of the Ab responses necessary to clear an influenza virus infection (75). This apparent role of IL-17A in the modulation of Ab responses and proper functioning of germinal centers has only recently been described (76). Interestingly, CD161+ CD45RA+ Tregs, the other subset we identified, have also been described as memory cells with the ability to produce IL-17A (77). Therefore, both cell types may provide IL-17A. To facilitate further exploration of immune cell subsets identified in the SIMON, we have created a Web site with freely available analysis summary (http://www.fluprint.com). Our Web site offers a valuable resource for other researchers to get insight about immune cell subsets and their participation in the generation of influenza immunity.
In this article, we demonstrate that a combination of systems biology tools, advances in the field of machine learning, and experimental investigation provides a new and more efficient way to gain biological insight from complex datasets, despite high sparsity.
Supplementary Material
Acknowledgments
We thank all individuals who participated in the research studies. Special acknowledgment goes to Dr. Purvesh Khatri for critical reading of the manuscript. We appreciate helpful discussions and support from all members of the Davis and Y. Chien laboratories, specifically Elsa Sola, Allison Nau, Lisa Wagar, and Asbjorn Christophersen for help with mass cytometry and input from Paula Romer. We also thank all staff members from the HIMC (Michael D. Leipold) for data analysis, management, and helpful discussions and HIMC Biobank (Rohit Gupta and Janine Bodea Sung) for sample processing and storage, Stanford-LPCH Vaccine Program (Alison Holzer) for management of clinical studies, and the Stanford FACS facility for all the support.
This work was supported by the European Union’s Horizon 2020 research and innovation program under the Marie Sklodowska-Curie grant (FluPRINT, Project 796636) (to A.T.) and by National Institutes of Health grants (U19 AI090019 and U19 AI057229) and the Howard Hughes Medical Institute (to M.M.D.).
The data presented in this article have been submitted to Zenodo (https://zenodo.org/record/2578166#.XHWDibh7lPY) and the algorithm has been submitted to the Comprehensive R Archive Network (https://cran.r-project.org/web/packages/mulset/index.html).
The online version of this article contains supplemental material.
- AUROC
- area under the receiver operating characteristic curve
- B-H
- Benjamini–Hochberg
- EM
- effector memory
- FDR
- false discovery rate
- FN
- false negative
- FP
- false positive
- GeoMean
- geometric mean
- HAI
- hemagglutination inhibition assay
- HIMC
- Human Immune Monitoring Center
- ID
- identifier
- RT
- room temperature
- SAM
- significance analysis of microarray
- SIMON
- Sequential Iterative Modeling “OverNight”
- TEMRA
- terminally differentiated effector
- TN
- true negative
- TP
- true positive
- Treg
- regulatory T cell.
Disclosures
The authors have no financial conflicts of interest.
References
- 1.Mooney M., McWeeney S., Canderan G., Sékaly R. P. 2013. A systems framework for vaccine design. Curr. Opin. Immunol. 25: 551–555. [DOI] [PMC free article] [PubMed] [Google Scholar]
- 2.Furman D., Jojic V., Kidd B., Shen-Orr S., Price J., Jarrell J., Tse T., Huang H., Lund P., Maecker H. T., et al. 2013. Apoptosis and other immune biomarkers predict influenza vaccine responsiveness. [Published erratum appears in 2013 Mol. Syst. Biol. 9: 680.]; [Published erratum appears in 2014 Mol. Syst. Biol. 10: 750.] Mol. Syst. Biol. 9: 659. [DOI] [PMC free article] [PubMed] [Google Scholar]
- 3.Nakaya H. I., Wrammert J., Lee E. K., Racioppi L., Marie-Kunze S., Haining W. N., Means A. R., Kasturi S. P., Khan N., Li G. M., et al. 2011. Systems biology of vaccination for seasonal influenza in humans. Nat. Immunol. 12: 786–795. [DOI] [PMC free article] [PubMed] [Google Scholar]
- 4.Pulendran B. 2014. Systems vaccinology: probing humanity’s diverse immune systems with vaccines. Proc. Natl. Acad. Sci. USA 111: 12300–12306. [DOI] [PMC free article] [PubMed] [Google Scholar]
- 5.Bernstein A., Pulendran B., Rappuoli R. 2011. Systems vaccinomics: the road ahead for vaccinology. OMICS 15: 529–531. [DOI] [PMC free article] [PubMed] [Google Scholar]
- 6.Poland G. A., Ovsyannikova I. G., Jacobson R. M., Smith D. I. 2007. Heterogeneity in vaccine immune response: the role of immunogenetics and the emerging field of vaccinomics. Clin. Pharmacol. Ther. 82: 653–664. [DOI] [PubMed] [Google Scholar]
- 7.Furman D., Hejblum B. P., Simon N., Jojic V., Dekker C. L., Thiébaut R., Tibshirani R. J., Davis M. M. 2014. Systems analysis of sex differences reveals an immunosuppressive role for testosterone in the response to influenza vaccination. Proc. Natl. Acad. Sci. USA 111: 869–874. [DOI] [PMC free article] [PubMed] [Google Scholar]
- 8.Tsang J. S., Schwartzberg P. L., Kotliarov Y., Biancotto A., Xie Z., Germain R. N., Wang E., Olnes M. J., Narayanan M., Golding H., et al. CHI Consortium 2014. Global analyses of human immune variation reveal baseline predictors of postvaccination responses. [Published erratum appears in 2014 Cell 158: 226.] Cell 157: 499–513. [DOI] [PMC free article] [PubMed] [Google Scholar]
- 9.Nakaya H. I., Hagan T., Duraisingham S. S., Lee E. K., Kwissa M., Rouphael N., Frasca D., Gersten M., Mehta A. K., Gaujoux R., et al. 2015. Systems analysis of immunity to influenza vaccination across multiple years and in diverse populations reveals shared molecular signatures. Immunity 43: 1186–1198. [DOI] [PMC free article] [PubMed] [Google Scholar]
- 10.HIPC-CHI Signatures Project Team; . HIPC-I Consortium 2017. Multicohort analysis reveals baseline transcriptional predictors of influenza vaccination responses. Sci. Immunol. 2. [DOI] [PMC free article] [PubMed] [Google Scholar]
- 11.Hagan T., Nakaya H. I., Subramaniam S., Pulendran B. 2015. Systems vaccinology: enabling rational vaccine design with systems biological approaches. Vaccine 33: 5294–5301. [DOI] [PMC free article] [PubMed] [Google Scholar]
- 12.Gomez-Cabrero D., Abugessaisa I., Maier D., Teschendorff A., Merkenschlager M., Gisel A., Ballestar E., Bongcam-Rudloff E., Conesa A., Tegnér J. 2014. Data integration in the era of omics: current and future challenges. BMC Syst. Biol. 8(Suppl. 2): I1. [DOI] [PMC free article] [PubMed] [Google Scholar]
- 13.Zalocusky K. A., Kan M. J., Hu Z., Dunn P., Thomson E., Wiser J., Bhattacharya S., Butte A. J. 2018. The 10,000 immunomes Project: building a resource for human immunology. [Published erratum appears in 2018 Cell Rep. 25: 513–522.e3.] Cell Rep. 25: 1995. [DOI] [PMC free article] [PubMed] [Google Scholar]
- 14.The Human Immune Monitoring Center 2018. Standard protocols of the human immune monitoring center. Available at: https://iti.stanford.edu/himc/protocols.html. Accessed: June 6, 2019.
- 15.Furman D., Jojic V., Sharma S., Shen-Orr S. S., Angel C. J., Onengut-Gumuscu S., Kidd B. A., Maecker H. T., Concannon P., Dekker C. L., et al. 2015. Cytomegalovirus infection enhances the immune response to influenza. Sci. Transl. Med. 7: 281ra43. [DOI] [PMC free article] [PubMed] [Google Scholar]
- 16.Brodin P., Jojic V., Gao T., Bhattacharya S., Angel C. J., Furman D., Shen-Orr S., Dekker C. L., Swan G. E., Butte A. J., et al. 2015. Variation in the human immune system is largely driven by non-heritable influences. Cell 160: 37–47. [DOI] [PMC free article] [PubMed] [Google Scholar]
- 17.Leipold M. D., Maecker H. T. 2015. Phenotyping of live human PBMC using CyTOF™ mass cytometry. Bio Protoc. 5. [DOI] [PMC free article] [PubMed] [Google Scholar]
- 18.Fernandez R., Maecker H. 2015. Cytokine-stimulated phosphoflow of PBMC using CyTOF mass cytometry. Bio Protoc. 5. [PMC free article] [PubMed] [Google Scholar]
- 19.Hirst G. K. 1942. The quantitative determination of influenza virus and antibodies by means of red cell agglutination. J. Exp. Med. 75: 49–64. [DOI] [PMC free article] [PubMed] [Google Scholar]
- 20.Whiting C. C., Siebert J., Newman A. M., Du H. W., Alizadeh A. A., Goronzy J., Weyand C. M., Krishnan E., Fathman C. G., Maecker H. T. 2015. Large-Scale and comprehensive immune profiling and functional analysis of normal human aging. PLoS One 10: e0133627. [DOI] [PMC free article] [PubMed] [Google Scholar]
- 21.Siebert J. C., Munsil W., Rosenberg-Hasson Y., Davis M. M., Maecker H. T. 2012. The Stanford Data Miner: a novel approach for integrating and exploring heterogeneous immunological data. J. Transl. Med. 10: 62. [DOI] [PMC free article] [PubMed] [Google Scholar]
- 22.R Development Core Team 2013. R: A Language and Environment for Statistical Computing. R Foundation for Statistical Computing, Vienna, Austria. [Google Scholar]
- 23.Kuhn, M., Contributions from J. Wing, S. Weston, A. Williams, C. Keefer, A. Engelhardt, T. Cooper, Z. Mayer, B. Kenkel, M. Benesty, et al; the R Core Team. 2018. caret: Classification and Regression Training. 6.0-80 ed. R package. caret: Classification and Regression Training.
- 24.Kohavi R. 1995. A study of cross-validation and bootstrap for accuracy estimation and model selection. In Proceedings of the 14th International Joint Conference on Artificial Intelligence Vol. 2, Morgan Kaufmann Publishers Inc., San Francisco, CA, USA, p. 1137–1143. [Google Scholar]
- 25.Robin X., Turck N., Hainard A., Tiberti N., Lisacek F., Sanchez J. C., Müller M. 2011. pROC: an open-source package for R and S+ to analyze and compare ROC curves. BMC Bioinformatics 12: 77. [DOI] [PMC free article] [PubMed] [Google Scholar]
- 26.Kursa M. B., Rudnicki W. R. 2010. Feature selection with the Boruta package. J. Stat. Softw. 36: 1–13. [Google Scholar]
- 27.Wegner J., Hackenberg S., Scholz C. J., Chuvpilo S., Tyrsin D., Matskevich A. A., Grigoleit G. U., Stevanović S., Hünig T. 2015. High-density preculture of PBMCs restores defective sensitivity of circulating CD8 T cells to virus- and tumor-derived antigens. Blood 126: 185–194. [DOI] [PubMed] [Google Scholar]
- 28.Römer P. S., Berr S., Avota E., Na S. Y., Battaglia M., ten Berge I., Einsele H., Hünig T. 2011. Preculture of PBMCs at high cell density increases sensitivity of T-cell responses, revealing cytokine release by CD28 superagonist TGN1412. Blood 118: 6772–6782. [DOI] [PubMed] [Google Scholar]
- 29.Larsen M. V., Lundegaard C., Lamberth K., Buus S., Lund O., Nielsen M. 2007. Large-scale validation of methods for cytotoxic T-lymphocyte epitope prediction. BMC Bioinformatics 8: 424. [DOI] [PMC free article] [PubMed] [Google Scholar]
- 30.Finck R., Simonds E. F., Jager A., Krishnaswamy S., Sachs K., Fantl W., Pe’er D., Nolan G. P., Bendall S. C. 2013. Normalization of mass cytometry data with bead standards. Cytometry A 83: 483–494. [DOI] [PMC free article] [PubMed] [Google Scholar]
- 31.Tusher V. G., Tibshirani R., Chu G. 2001. Significance analysis of microarrays applied to the ionizing radiation response. Proc. Natl. Acad. Sci. USA 98: 5116–5121. [DOI] [PMC free article] [PubMed] [Google Scholar]
- 32.Wei T., Simko V. 2017. R package “corrplot”: Visualization of a Correlation Matrix. Version 0.84 ed.
- 33.Benjamini Y., Hochberg Y. 1995. Controlling the false discovery rate - a practical and powerful approach to multiple testing. J. R. Stat. Soc. Ser. B 57: 289–300. [Google Scholar]
- 34.Tomic, A., and I. Tomic. 2019. Initial dataset used in SIMON, an automated machine learning approach. Zenodo. Available at: https://zenodo.org/record/2578166. DOI: 10.5281/zenodo.2578166 [Google Scholar]
- 35.Tomic A., Tomic I. 2019. Models generated by SIMON. Available at: https://zenodo.org/record/2580416.
- 36.Tomic, A. 2018. Mass cytometry files related to Figure 4 in A. Tomic et al. Zenodo. Available at: https://zenodo.org/record/1328286. DOI: 10.5281/zenodo.1328286 [Google Scholar]
- 37.Centers for Disease Control Prevention 2013. Prevention and control of seasonal influenza with vaccines. Recommendations of the advisory committee on immunization practices–United States, 2013-2014. [Published erratum appears in 2013 MMWR Recomm. Rep. 62: 906.] MMWR Recomm. Rep. 62: 1–43. [PubMed] [Google Scholar]
- 38.Grohskopf L. A., Sokolow L. Z., Broder K. R., Walter E. B., Bresee J. S., Fry A. M., Jernigan D. B. 2017. Prevention and control of seasonal influenza with vaccines: recommendations of the advisory committee on immunization practices-United States, 2017-18 influenza season. Am. J. Transplant. 17: 2970–2982. [Google Scholar]
- 39.Jackson M. L., Chung J. R., Jackson L. A., Phillips C. H., Benoit J., Monto A. S., Martin E. T., Belongia E. A., McLean H. Q., Gaglani M., et al. 2017. Influenza vaccine effectiveness in the United States during the 2015-2016 season. N. Engl. J. Med. 377: 534–543. [DOI] [PMC free article] [PubMed] [Google Scholar]
- 40.Aittokallio T. 2010. Dealing with missing values in large-scale studies: microarray data imputation and beyond. Briefings Bioinf. 11: 253–264. [DOI] [PubMed] [Google Scholar]
- 41.Aha D. W., Bankert R. L. 1996. A comparative evaluation of sequential feature selection algorithms. In Learning from Data. Lecture Notes in Statistics. Fisher D., Lenz H. J., eds. Springer, New York, p. 199–206. [Google Scholar]
- 42.Wang J., Liu W., Kumar S., Chang S. 2015. Learning to hash for indexing big data - a survey. Proc. IEEE 104: 34–57. [Google Scholar]
- 43.Bellman R. E. 1957. Dynamic Programming. Princeton University Press, Princeton, New Jersey. [Google Scholar]
- 44.Kohavi R., John G. H. 1997. Wrappers for feature subset selection. Artif. Intell. 97: 273–324. [Google Scholar]
- 45.Wolpert D. H., Macready W. G. 1997. No free lunch theorems for optimization. IEEE Trans. Evol. Comput. 1: 67–82. [Google Scholar]
- 46.Kuhn M. 2008. Building predictive models in R using the caret package. J. Stat. Softw. 28: 1–26.27774042 [Google Scholar]
- 47.Stehman S. V. 1997. Selecting and interpreting measures of thematic classification accuracy. Remote Sens. Environ. 62: 77–89. [Google Scholar]
- 48.Sonego P., Kocsor A., Pongor S. 2008. ROC analysis: applications to the classification of biological sequences and 3D structures. Briefings Bioinf. 9: 198–209. [DOI] [PubMed] [Google Scholar]
- 49.Fawcett T. 2006. An introduction to ROC analysis. Pattern Recogn. Lett. 27: 861–874. [Google Scholar]
- 50.Hand D. J., Anagnostopoulos C. 2013. When is the area under the receiver operating characteristic curve an appropriate measure of classifier performance? Pattern Recogn. Lett. 34: 492–495. [Google Scholar]
- 51.Hand D. J. 2009. Measuring classifier performance: a coherent alternative to the area under the ROC curve. Mach. Learn. 77: 103–123. [Google Scholar]
- 52.Lüdemann L., Grieger W., Wurm R., Wust P., Zimmer C. 2006. Glioma assessment using quantitative blood volume maps generated by T1-weighted dynamic contrast-enhanced magnetic resonance imaging: a receiver operating characteristic study. Acta Radiol. 47: 303–310. [DOI] [PubMed] [Google Scholar]
- 53.Liu W., Putnam A. L., Xu-Yu Z., Szot G. L., Lee M. R., Zhu S., Gottlieb P. A., Kapranov P., Gingeras T. R., Fazekas de St Groth B., et al. 2006. CD127 expression inversely correlates with FoxP3 and suppressive function of human CD4+ T reg cells. J. Exp. Med. 203: 1701–1711. [DOI] [PMC free article] [PubMed] [Google Scholar]
- 54.Fergusson J. R., Smith K. E., Fleming V. M., Rajoriya N., Newell E. W., Simmons R., Marchi E., Björkander S., Kang Y. H., Swadling L., et al. 2014. CD161 defines a transcriptional and functional phenotype across distinct human T cell lineages. Cell Rep. 9: 1075–1088. [DOI] [PMC free article] [PubMed] [Google Scholar]
- 55.He R., Hou S., Liu C., Zhang A., Bai Q., Han M., Yang Y., Wei G., Shen T., Yang X., et al. 2016. Follicular CXCR5- expressing CD8(+) T cells curtail chronic viral infection. [Published erratum appears in 2016 Nature 540: 470.] Nature 537: 412–428. [DOI] [PubMed] [Google Scholar]
- 56.Leong Y. A., Chen Y., Ong H. S., Wu D., Man K., Deleage C., Minnich M., Meckiff B. J., Wei Y., Hou Z., et al. 2016. CXCR5(+) follicular cytotoxic T cells control viral infection in B cell follicles. Nat. Immunol. 17: 1187–1196. [DOI] [PubMed] [Google Scholar]
- 57.Quigley M. F., Gonzalez V. D., Granath A., Andersson J., Sandberg J. K. 2007. CXCR5+ CCR7- CD8 T cells are early effector memory cells that infiltrate tonsil B cell follicles. Eur. J. Immunol. 37: 3352–3362. [DOI] [PubMed] [Google Scholar]
- 58.Wilkinson T. M., Li C. K., Chui C. S., Huang A. K., Perkins M., Liebner J. C., Lambkin-Williams R., Gilbert A., Oxford J., Nicholas B., et al. 2012. Preexisting influenza-specific CD4+ T cells correlate with disease protection against influenza challenge in humans. Nat. Med. 18: 274–280. [DOI] [PubMed] [Google Scholar]
- 59.Sobolev O., Binda E., O’Farrell S., Lorenc A., Pradines J., Huang Y., Duffner J., Schulz R., Cason J., Zambon M., et al. 2016. Adjuvanted influenza-H1N1 vaccination reveals lymphoid signatures of age-dependent early responses and of clinical adverse events. [Published erratum appears in 2016 Nat. Immunol. 17: 469.] Nat. Immunol. 17: 204–213. [DOI] [PMC free article] [PubMed] [Google Scholar]
- 60.Sallusto F., Lenig D., Förster R., Lipp M., Lanzavecchia A. 1999. Two subsets of memory T lymphocytes with distinct homing potentials and effector functions. Nature 401: 708–712. [DOI] [PubMed] [Google Scholar]
- 61.Gustafson C. E., Qi Q., Hutter-Saunders J., Gupta S., Jadhav R., Newell E., Maecker H., Weyand C. M., Goronzy J. J. 2017. Immune checkpoint function of CD85j in CD8 T cell differentiation and aging. Front. Immunol. 8: 692. [DOI] [PMC free article] [PubMed] [Google Scholar]
- 62.Appay V., Dunbar P. R., Callan M., Klenerman P., Gillespie G. M., Papagno L., Ogg G. S., King A., Lechner F., Spina C. A., et al. 2002. Memory CD8+ T cells vary in differentiation phenotype in different persistent virus infections. Nat. Med. 8: 379–385. [DOI] [PubMed] [Google Scholar]
- 63.Edgar R., Domrachev M., Lash A. E. 2002. Gene Expression Omnibus: NCBI gene expression and hybridization array data repository. Nucleic Acids Res. 30: 207–210. [DOI] [PMC free article] [PubMed] [Google Scholar]
- 64.Bhattacharya S., Dunn P., Thomas C. G., Smith B., Schaefer H., Chen J., Hu Z., Zalocusky K. A., Shankar R. D., Shen-Orr S. S., et al. 2018. ImmPort, toward repurposing of open access immunological assay data for translational and clinical research. Sci. Data 5: 180015. [DOI] [PMC free article] [PubMed] [Google Scholar]
- 65.Pedregosa F., Varoquaux G., Gramfort A., Michel V., Thirion B., Grisel O., Blondel M., Prettenhofer P., Weiss R., Dubourg V., et al. 2011. Scikit-learn: machine learning in Python. J. Mach. Learn. Res. 12: 2825–2830. [Google Scholar]
- 66.Kotthoff L., Thornton C., Hoos H. H., Hutter F., Leyton-Brown K. 2016. Auto-WEKA 2.0: automatic model selection and hyperparameter optimization in WEKA. J. Mach. Learn. Res. 17: 1–5. [Google Scholar]
- 67.Olson R. S., Urbanowicz R. J., Andrews P. C., Lavender N. A., Kidd L. C., Moore J. H. 2016. Automating biomedical data science through tree-based pipeline optimization. In Applications of Evolutionary Computation:19th European Conference, EvoApplications 2016, March 30–April 1 Springer International Publishing, p. 123–137. [Google Scholar]
- 68.Baldassano S. N., Brinkmann B. H., Ung H., Blevins T., Conrad E. C., Leyde K., Cook M. J., Khambhati A. N., Wagenaar J. B., Worrell G. A., Litt B. 2017. Crowdsourcing seizure detection: algorithm development and validation on human implanted device recordings. Brain 140: 1680–1691. [DOI] [PMC free article] [PubMed] [Google Scholar]
- 69.Hayward A. C., Wang L., Goonetilleke N., Fragaszy E. B., Bermingham A., Copas A., Dukes O., Millett E. R., Nazareth I., Nguyen-Van-Tam J. S., et al. Flu Watch Group 2015. Natural T cell-mediated protection against seasonal and pandemic influenza. Results of the flu watch cohort study. Am. J. Respir. Crit. Care Med. 191: 1422–1431. [DOI] [PMC free article] [PubMed] [Google Scholar]
- 70.van de Sandt C. E., Hillaire M. L., Geelhoed-Mieras M. M., Osterhaus A. D., Fouchier R. A., Rimmelzwaan G. F. 2015. Human influenza a virus-specific CD8+ T-cell response is long-lived. J. Infect. Dis. 212: 81–85. [DOI] [PMC free article] [PubMed] [Google Scholar]
- 71.Bentebibel S. E., Lopez S., Obermoser G., Schmitt N., Mueller C., Harrod C., Flano E., Mejias A., Albrecht R. A., Blankenship D., et al. 2013. Induction of ICOS+CXCR3+CXCR5+ TH cells correlates with antibody responses to influenza vaccination. Sci. Transl. Med. 5: 176ra32. [DOI] [PMC free article] [PubMed] [Google Scholar]
- 72.Trieu M. C., Zhou F., Lartey S., Jul-Larsen Å., Mjaaland S., Sridhar S., Cox R. J. 2017. Long-term maintenance of the influenza-specific cross-reactive memory CD4+ T-cell responses following repeated annual influenza vaccination. J. Infect. Dis. 215: 740–749. [DOI] [PubMed] [Google Scholar]
- 73.Im S. J., Hashimoto M., Gerner M. Y., Lee J., Kissick H. T., Burger M. C., Shan Q., Hale J. S., Lee J., Nasti T. H., et al. 2016. Defining CD8+ T cells that provide the proliferative burst after PD-1 therapy. Nature 537: 417–421. [DOI] [PMC free article] [PubMed] [Google Scholar]
- 74.Hamada H., Garcia-Hernandez M. L., Reome J. B., Misra S. K., Strutt T. M., McKinstry K. K., Cooper A. M., Swain S. L., Dutton R. W. 2009. Tc17, a unique subset of CD8 T cells that can protect against lethal influenza challenge. J. Immunol. 182: 3469–3481. [DOI] [PMC free article] [PubMed] [Google Scholar]
- 75.Wang X., Ma K., Chen M., Ko K. H., Zheng B. J., Lu L. 2016. IL-17A promotes pulmonary B-1a cell differentiation via induction of blimp-1 expression during influenza virus infection. PLoS Pathog. 12: e1005367. [DOI] [PMC free article] [PubMed] [Google Scholar]
- 76.Ferretti E., Ponzoni M., Doglioni C., Pistoia V. 2016. IL-17 superfamily cytokines modulate normal germinal center B cell migration. J. Leukoc. Biol. 100: 913–918. [DOI] [PubMed] [Google Scholar]
- 77.Ayyoub M., Deknuydt F., Raimbaud I., Dousset C., Leveque L., Bioley G., Valmori D. 2009. Human memory FOXP3+ Tregs secrete IL-17 ex vivo and constitutively express the T(H)17 lineage-specific transcription factor RORgamma t. Proc. Natl. Acad. Sci. USA 106: 8635–8640. [DOI] [PMC free article] [PubMed] [Google Scholar]
Associated Data
This section collects any data citations, data availability statements, or supplementary materials included in this article.
Supplementary Materials
Data Availability Statement
The source code of the mulset algorithm is available from https://github.com/LogIN-/mulset. The mulset is available as an R package in CRAN, a repository of open-source software. The source code, installation instructions, and data from the SIMON analysis are available from https://github.com/LogIN-/simon-manuscript. Raw data from the initial dataset used in SIMON analysis are available from a research data repository Zenodo (https://zenodo.org/record/2578166#.XHWDibh7lPY) (34). All models generated by SIMON are available at the Zenodo (https://zenodo.org/record/2580416#.XHiItLh7lPY) (35). Mass cytometry fcs files related to Fig. 4 are also available at the Zenodo (https://zenodo.org/record/1328286) (36). The results from SIMON exploratory analysis are available online at http://www.fluprint.com.
FIGURE 4.
SIMON identifies cellular signature associated with the successful generation of influenza immunity after vaccination. (A) Features with variable importance score above 50 from the model built on dataset 13 are shown. (B) Raw data confirmed by SAM analysis to be significantly changed in the donors from dataset 13 (n = 61 from which high responders = 17 and low responders = 44), indicating frequency of cells (as a percentage of the parent population). (C) Representative plot showing TNF-α intracellular staining of CD161+ CD4+ T cells in the unstimulated (−) or influenza peptide pool (+)–stimulated PBMC from high responder obtained before vaccination. Graph on the right shows the frequency of TNF-α+ CD161+ CD4+ T cells from high responders (red circles, n = 7) and low responders (gray circles, n = 7) in the samples before vaccination. Individual donors are connected with lines. (D) Violin plots show distribution of frequency of CD161+ CD4+ T cells and CXCR5+ CD8+ T with Tc2 and Tc17 phenotype in the PBMC samples derived from high (red, n = 7) and low responders (gray, n = 7) analyzed before vaccination (−) and on day 28 after vaccination (+). (E) Variable importance score of features selected in the model built on dataset 36 with score above 50. (F) Significant immune cell subsets selected by SAM analysis shown as raw data corresponding to donors from dataset 36 (n = 40 from which high responders = 12 and low responders = 28), indicating frequency of cells (as percentage of parent population). (G) Representative plot showing IL-17A intracellular staining of EM CD8+ T cells in the unstimulated (−) or influenza peptide pool–stimulated (+) PBMC from high responders, obtained after vaccination. The graph on the right shows the frequency of IL-17A+ EM CD8+ T cells from high (red circles, n = 7) and low (gray circles, n = 7) responders in the samples after vaccination. (H) Violin plots show distribution of frequency of CD4+ and CD8+ T cells, with indicated phenotypes analyzed in the PBMC samples derived from high (red, n = 7) and low responders (gray, n = 7) before (−) and on day 28 after (+) vaccination. Graphs shown in (C), (D), (G), and (H) represent combined data from seven independent experiments. Violin plots show distribution of individuals. These are represented by red circles for high responders and gray circles for low responders. The line indicates the median. Statistical analysis between high and low responders was performed with one-way ANOVA Kruskal–Wallis test followed by Dunn multiple comparison test. Analysis within groups before and after vaccination was calculated using two-tailed Wilcoxon matched-pairs signed rank test. Significance in SAM analysis was considered at FDR <0.01. *p < 0.05, **p < 0.01. ns, nonsignificant.