Abstract
In follicular lymphoma, studies addressing the prognostic value of microenvironment-related immunohistochemical markers and tumor cell-related genetic markers have yielded conflicting results, precluding implementation in practice. Therefore, the Lunenburg Lymphoma Biomarker Consortium performed a validation study evaluating published markers. To maximize sensitivity, an end of spectrum design was applied for 122 uniformly immunochemotherapy-treated follicular lymphoma patients retrieved from international trials and registries. The criteria were: early failure, progression or lymphoma-related death <2 years versus long remission, response duration of >5 years. Immunohistochemical staining for T cells and macrophages was performed on tissue microarrays from initial biopsies and scored with a validated computer-assisted protocol. Shallow whole-genome and deep targeted sequencing was performed on the same samples. The 96/122 cases with complete molecular and immunohistochemical data were included in the analysis. EZH2 wild-type (P=0.006), gain of chromosome 18 (P=0.002), low percentages of CD8+ cells (P=0.011) and CD163+ areas (P=0.038) were associated with early failure. No significant differences in other markers were observed, thereby refuting previous claims of their prognostic significance. Using an optimized study design, this Lunenburg Lymphoma Biomarker Consortium study substantiates wild-type EZH2 status, gain of chromosome 18, low percentages of CD8+ cells and CD163+ area as predictors of early failure to immunochemotherapy in follicular lymphoma treated with rituximab, cyclophosphamide, doxorubicin, vincristine, and prednisone (R-CHOP [-like]), while refuting the prognostic impact of various other markers.
Introduction
The disease course of follicular lymphoma (FL) is characterized by multiple relapses with variable remission durations, which tend to get shorter after each line of treatment.1–7 Approximately 15% of patients die within the first few years, largely due to histological transformation or refractory disease. In contrast, the majority of patients show prolonged survival without relapse and a substantial number of patients never require treatment. Currently, clinical factors captured in the Follicular Lymphoma International Prognostic Index (FLIPI)8,9 and the adjusted FLIPI210 are the primary prognostic tools utilized to predict disease progression. FLIPI is based on easily available clinical data designed to offer an accurate yet simple prognostic index. However, the biological behavior of FL is likely determined by a more complex interaction between tumor genetics, microenvironment and patient characteristics.
Several gene expression profiling studies have underlined the major influence of characteristics of the nonmalignant tumor microenvironment on prognosis in FL.11,12 However, evaluation by immunohistochemistry (IHC) of T-cell and macrophage populations for their prognostic translational impact have produced valuable yet conflicting results.13–25 Contradictory results are likely caused by multiple factors, including variable patient selection, heterogeneity of treatments across cohorts,25 insufficient statistical power due to underrepresentation of poor outcome patients, technical issues in IHC staining and inter-observer variability in scoring. Previous IHC-based validation studies of microenvironment cell populations by the Lunenburg Lymphoma Biomarker Consortium (LLBC), in both diffuse large B-cell Lymphoma (DLBCL) and FL, have highlighted the poor reproducibility of manual scoring even by experienced pathologists, and advocated computer-assisted scoring as being the more reliable technique.26,27
Recently, the mutational spectrum of FL tumor cells and their prognostic value have been reported.28–30 Most notably, Pastore et al. demonstrated the value of combining mutation status with clinical FLIPI and performance status to improve upon the prognostic value of FLIPI alone (45–55%) to 64–72% for M7-FLIPI, with a comparable negative prognostic value.31 This method may also be valuable for very high-risk FL cohorts, as reported by the same group.32
The objective of the study herein by the LLBC consortium was to critically assess, in a homogeneously treated patient cohort, whether the previously implicated microenvironmental and molecular markers of the tumor have clinically relevant prognostic value. We hypothesized that the microenvironmental and molecular markers would be most prominent when we compared tissue samples of patients with an extremely poor prognosis (i.e., progression or death within 2 years, a well-established criterion for poor prognosis in FL)33 with those with a very favorable prognosis (a response to first-line treatment lasting >5 years). The LLBC gene panel incorporated the molecular markers which were frequently mutated, and were at that time published, as well as markers that were rarely mutated such as FAS and MYD88,28–30 since with our study design we hypothesized the ability to also reveal the prognostic value of rare mutations.
To avoid interlaboratory technical variations and interpretation, all assays were uniformly processed in a single laboratory and IHC was scored using computer-assisted technology based on a previous LLBC FL validation study,27 and molecular analysis was performed using established next-generation sequencing (NGS) procedures for mutation and copy number analyses.
Methods
Patient selection for an end of spectrum design
Tumor specimens of patients with FL, histologic grades 1, 2 and 3A were retrieved from the randomized Lymphoma Study Association (LYSA) FL2000 study,4,6 the German Low-Grade Lymphoma Study Group (GLSG) GLSG2000 study,3 and the St Bartholomew’s Hospital Registry, London, UK. The patients required treatment and the inclusion criteria in the trials were comparable. All patients were treated with R-CHOP or R-CHOP-like regimens, with or without interferon-α (IFN) maintenance for 2 years. Patients were selected upon the following criteria for an end of spectrum design: (1) early failure (EF), defined as no remission or progression, or lymphoma-related death within 2 years after start of first-line treatment, or (2) long remission (LR), defined as a complete or partial remission lasting >5 years after starting first-line treatment. Patients that fell in between these criteria were not included in this study. The availability of complete clinical information at diagnosis, follow-up data until relapse, progression or at least 5 years post-treatment if the patient was still in remission, and availability of formalin-fixed paraffin-embedded (FFPE) diagnostic biopsy samples were prerequisites for inclusion. Detailed clinical information on demographic parameters, staging procedures, treatment regimens and outcome were collected by the involved data centers (LYSA, GLSG and St Bartholomew’s Hospital).
Microenvironment analysis on tissue microarrays using immunohistochemistry and automated image analysis scoring
Tissue microarrays (TMAs) were constructed centrally according to LLBC validated protocols27 at the Department of Pathology, Würzburg, Germany, from the biopsy part identified by the pathologist (AR), using duplicate cores of 1mm diameter. Three μm slides were stained for CD3, CD4, CD8, CD68, CD163, FOXP3, PD1, and P53 (Online Supplementary Table S1) according to standard procedures at the Bartholomew’s Pathology Research Laboratory, London, UK.
A computerized system with automated scanning microscope and computerized image analysis (Ariol SL-8, Leica Microsystems, Wetzlar, Germany) was used for scoring as described in the LLBC validation study.27 Macrophages and all T-cell populations were scored for the whole core, and in the intrafollicular and interfollicular areas separately, as described by Wahlin et al.22 Color and shape class defined positive and negative nucleated cells (T-cell classes), or positive and negative areas (macrophage classes).16 Cores with less than 50% scorable core surface (non-representative areas or tissue artifacts) were excluded and average scores of duplicates were used when available.
Using the Ariol software algorithm, CD3, CD4, CD8, PD1, FOXP3 and p53 positive nucleated cells were scored as the percentage of all nucleated cells. For CD68 and CD163 the positive area versus the whole area was scored to accommodate the large size and long cytoplasmic extensions of macrophages as an optimal determination of cell numbers. The typical perifollicular infiltration pattern of FOXP3 was scored manually by 3 observers,27 and was considered positive if at least 2 out of the 3 pathologists (DdJ, AR and MC) identified and counted at least one rim of densely packed positive cells at the periphery of a follicle.14 All histopathological assessments were carried out without insight into the patient’s clinical data and outcome.
Gene mutation and copy number analysis using NGS
DNA was extracted from FFPE cores with a QIAamp DNA FFPE Tissue Kit (QIAGEN, Hilden, Germany) and quantified using a Qubit 2.0 Fluorometer (Thermo Fisher Scientific, Carlsbad, CA, USA). 250ng DNA from each patient sample was sheared on a Covaris S2 (Covaris Inc., Woburn, MA, USA), with settings adjusted to DNA from FFPE tissue.34 NGS libraries were prepared using KAPA Library Preparation kits (KAPA Biosystems, Inc., Wilmington, MA, USA). In short, uniquely 8-bp indexed adapters (Roche NimbleGen, Madison, WI, USA.) were ligated to the FFPE-extracted DNA, followed by size selection of fragments in the range of 150 to 400bp.
One aliquot of this library was subjected to shallow whole-genome sequencing (WGS) for genome-wide copy number analysis,34 and another aliquot was subjected to hybrid capture target enrichment (Roche NimbleGen, Madison, WI, USA) for mutation analysis. Eight libraries were equimolarly pooled per capture. The hybrid capture panel covers 122 exons (~50.000 base pairs) of 11 frequently mutated genes (KMT2D, CREBBP, MEF2B, EZH2, EP300, BCL2, FAS, TNFRSF14, CARD11, TNFAIP3 and MYD88) in the FL-LLBC-NGS target enrichment panel (Follicular Lunenburg Lymphoma Biomarker Consortium NGS-panel, Online Supplementary Table S2). All libraries were sequenced on a HiSeq 2000 (Illumina, San Diego, CA, USA); 50bp single-end for shallow WGS and 125bp paired-end for mutation analysis. All sequence lanes were multiplexed with up to 24 barcoded sample libraries.
Shallow WGS data was analyzed using the Bioconductor package QDNAseq (v1.5.1).34 For gene mutation analysis, variant calling was performed by VarScan 2 (v2.3.7)35 using very strict criteria, which excluded any synonymous mutations, any intronic mutations with predicted low impact and all germline variants reported in the Single Nucleotide Polymorphism database (dbSNP build142). For prognostic analysis, only non-silent mutations (missense, nonsense, in-frame or frame-shift insertions and deletions) were included.
For detailed laboratory data analysis procedures see the Online Supplementary Methods section.
Ethical Committee statement
The study and protocols to obtain human archival tissues and patient data were approved by the local ethical committee of the VU University Medical Center, Amsterdam (FWA00017598) for all collaborating centers and comply with the Code for Proper Secondary Use of Human Tissue in The Netherlands.
Statistics
Univariate and multivariate analyses were used to evaluate the distribution of the biomarkers for the 2 cohorts. For microenvironment analysis, biomarkers were included in the analysis using the scoring categories as defined above, and the average of the biomarker score from 2 cores was used in the analysis. For mutation analysis, the genes were included in the analysis as mutated or wild-type. To correct for multiple comparisons, the Benjamini-Hochberg method was used, and P-values of less than 0.05 were considered significant. Patient characteristics were summarized with descriptive statistics. The Fisher’s exact test was used to test for association between pairs of categorical variables, and univariate and multivariable logistic regression was used for the binary outcome of cohorts. Odds ratios (OR) and 95% confidence intervals (CI) were reported. The Wilcoxon rank-sum test was used to assess a location shift in the distribution of continuous variables between 2 groups. In a secondary analysis, optimal cut points for 8 continuous markers were determined using recursive partitioning models for a binary outcome. To evaluate agreement among the 3 pathologists for the FOXP3 patterns the free-marginal κ statistics of Brennan and Prediger are reported with a bootstrap confidence CI.36,37 Analyses were performed using SAS Software version 9.3 (SAS Institute Inc., Cary, NC, USA; 2005) and R version 3.3.0 (R Core Team, Vienna, Austria; 2016).38
Results
Patient selection and immunohistochemical biomarker assessment
A total of 122 patients fulfilled the selection criteria and had biopsy material available that met the input requirements for both IHC and gene mutation analysis (EF, n=49 and LR, n=73). In 105 cases a complete set of IHC markers was available (Online Supplementary Table S3). For NGS analysis, DNA of sufficient quality and with sufficient NGS read depth could be retrieved for 111 cases, resulting in the complete molecular data for gene mutation analysis and copy number profiles.
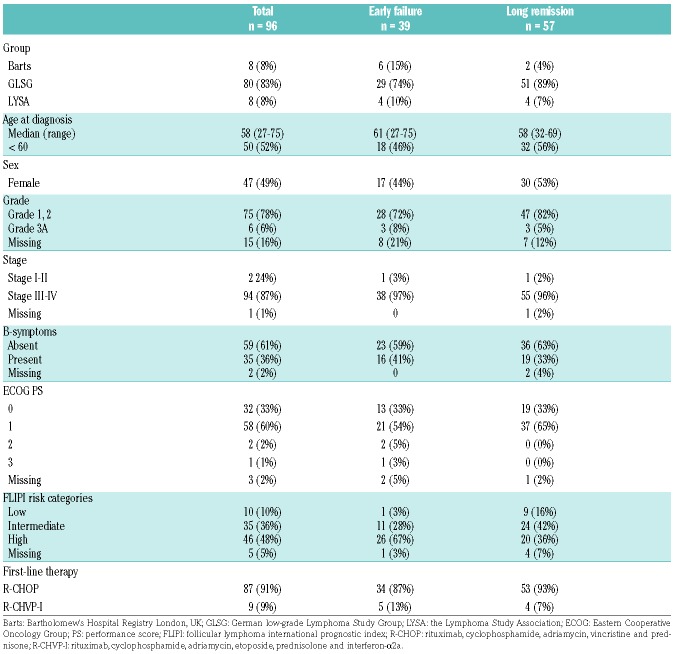
For 96 of the 122 cases (79%) both IHC and molecular data could be generated that met our quality criteria and was included for downstream analysis. Table 1 shows the clinical characteristics of the 96 patients (Online Supplementary Table S4 provides the characteristics for all 122 patients, with marginal statistical differences for prognostic subgroup representation). The FLIPI high-risk category was overrepresented in the EF cohort (P=0.009), underpinning the validity of the selection criteria for this end of spectrum design.
Table 1.
Clinical characteristics of patients with all immunohistochemical and molecular markers available.
Impact of microenvironment T-cell and macrophage cell populations by cohort
The distribution of IHC markers per end of spectrum prognostic subgroup analyzed in the whole core is shown in Figure 1 and the Online Supplementary Table S5 (Online Supplementary Table S6 shows the distribution of IHC markers of the 105 cases). Statistically significant differences were found in the median percentage of CD8+ nucleated cells (median EF vs. LR is 7.9% vs. 8.6%, P=0.011) and CD163+ macrophages area (median EF vs. LR is 3.6% vs. 5.2%, P=0.038). In logistic regression analyses, the estimated OR for CD8+ cells are 3.9 (95% CI: [1.5–12.1], P=0.01) for a decrease of 10% CD8+ cells. For the CD163+ area the odds are 2.0 (95% CI: [1.1–4.4], P=0.04) for a decrease of 10% CD163+ area (Online Supplementary Table S7). Adjusting for other IHC markers without the FLIPI score in a multivariable model, only the CD8+ T cells retained significance (OR=4.5, 95% CI: [1.1–21.2] P=0.04), however, with the FLIPI score included they no longer reached significance. No significant differences were found for the other markers (CD3, CD4, CD68, CD163, PD1, FOXP3 and p53) between the two cohorts (Online Supplementary Table S7).
Figure 1.
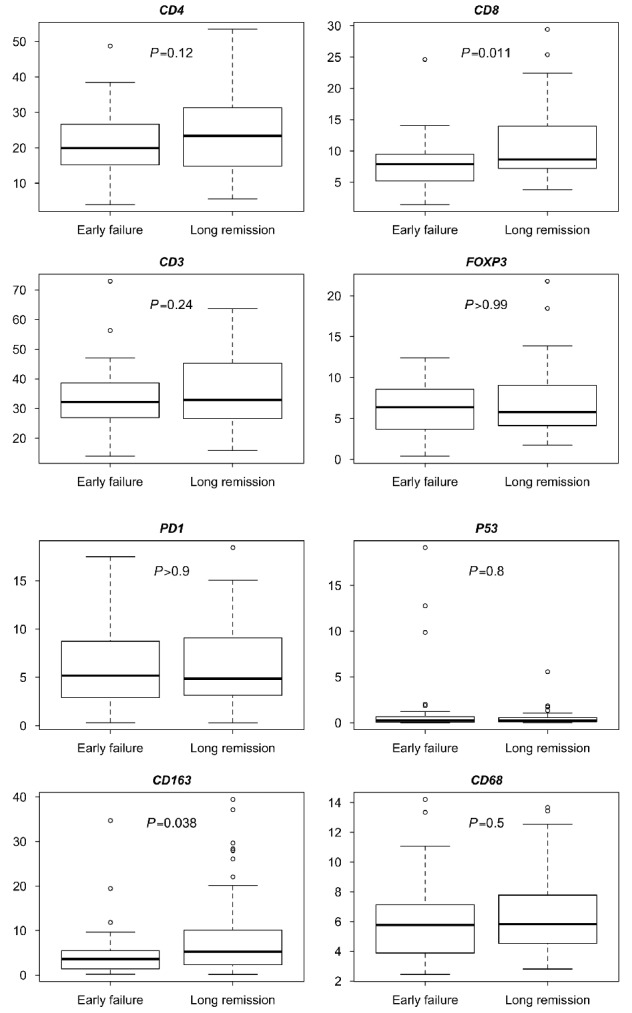
Boxplots per immuunhistochemical marker. For CD4, CD8, CD3, FOXP3, PD1 and P53 they show the percentage of positive nucleated cells of all nucleated cells, and for CD163 and CD68 they show the percentage of positive cell area of the total cell area. Early failure n=39, long remission n=57.
Since CD163 was binary scored as positive or negative, a high overall score for the 2 prognostic subgroups might be caused by a higher cell density and/or by larger individual cells. Visual assessment by two pathologists (DdJ, MC) was performed and confirmed that the higher percentage of positive areas was due to higher cell density. A secondary analysis using recursive partitioning was performed to evaluate markers that could separate the 2 prognostic sub groups and to determine the optimal cut points for the identified markers for the whole core. The optimal cut points were 12.6% and 6.3% for CD8+ and CD163+, respectively. The percentage of patients with low levels of both CD8+ T cells and CD163+ area (defined as lower than the optimal cut points) was 79% (95% CI 64 – 91%) vs. 39% (95% CI 16 – 52%) for EF (n=39) vs. LR (n=57) (P<0.001). Similarly, results were obtained if the upper quartiles were used instead of the optimal cut points (12.2% (n=39) vs. 8.4% (n=57) for EF [79% (95% CI: 64 – 91%)] vs. LR [46% (95% CI: 32 – 59%)], P=0.001).
Impact of spatial distribution and perifollicular pattern of FOXP3 by prognostic subgroup
The spatial distribution of T-cell populations and macrophages has been claimed to be of greater influence on prognosis than the overall numbers of infiltrating cells and therefore intrafollicular and interfollicular populations were assessed separately.14–17,19,22,39 However, in this series, we could not validate this claim for most T-cell or macrophage classes. Except in the univariate analysis of the interfollicular population, differences in CD8+ cells and CD163+ area were significant; CD8+ cells with an OR 3.6 (95% CI: [1.2–6.4], P=0.03) and CD163+ area 1.9 (95% CI: [1.1–3.6], P=0.03). Only CD8+ interfollicular populations have a minor influence in multivariate analysis excluding the FLIPI score (OR 3.7, 95% CI [1.2–15.5], P<0.01) (Online Supplementary Tables S8 and S9).
The perifollicular pattern of FOXP3+ T cells was scored manually by 3 pathologists (DdJ, AR, BS). Agreement between pathologists reached levels similar to the validation study (Brennan-Prediger estimate of 0.78 and 0.83 for cores 1 and 2 in the study herein versus 0.85 for the validation study).29 The perifollicular pattern did not differ significantly (P=0.46) between the 2 prognostic subgroups, 10/39 (26%) in the EF subgroup and 11/57 (19%) in the LR subgroup (Online Supplementary Table S10).
Frequency distribution of chromosomal copy numbers and gene mutations in FL
Shallow WGS resulted in high quality genome-wide copy number aberration (CNA) plots for all cases. The most common aberrations, detected in at least 10% of patients, included complete or partial gains of chromosomes 1q, 2, 7, 8, 12 and 18 and losses of 1p, 6q and 10q (Figure 2 and Online Supplementary Table S11). The landscape of CNAs showed notable enrichment of FL-related genes, including focal losses of TNFRSF14 (1p36.32), TNFAIP3 (6p23.3) and FAS and PTEN (10q23.31) and focal gains that harbor FL-related oncogenes, like BCL11A and REL (2p16.1).
Figure 2.
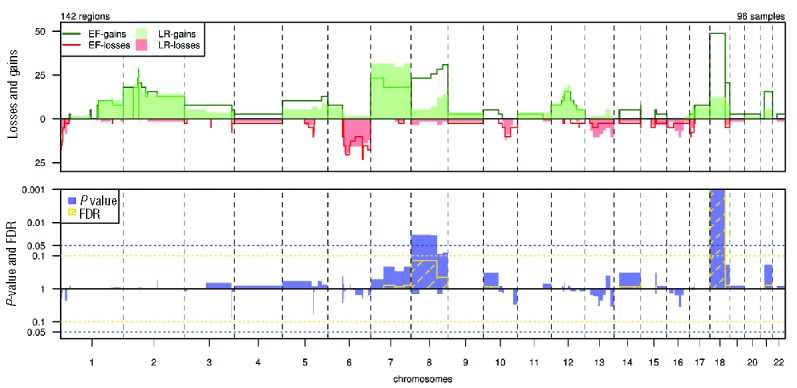
Distribution and significance of copy number gains and losses by subgroup. Top panel: Percentages of gains (top; green) and losses (bottom; red) in early failure (EF, n=39) and long remission (LR, n=57) per chromosomal region. X-axis: chromosomal regions, ordered by genomic coordinates of chromosomes 1 to 22. Y-axis: percentage of cases showing CNAs. Vertical dotted lines: boundaries between chromosomes. Bottom panel: statistical significance of differences in frequencies of gains (top) and losses (bottom) between cohorts. X-axis: chromosomal regions, ordered by genomic coordinates of chromosomes 1 to 22. Y-axis: P-value (blue) and false discovery rate (FDR; yellow). Horizontal dotted lines show the threshold of significance for P (0.05) and FDR (0.1), based on a Wilcoxon rank-sum test with 10 000 permutations.
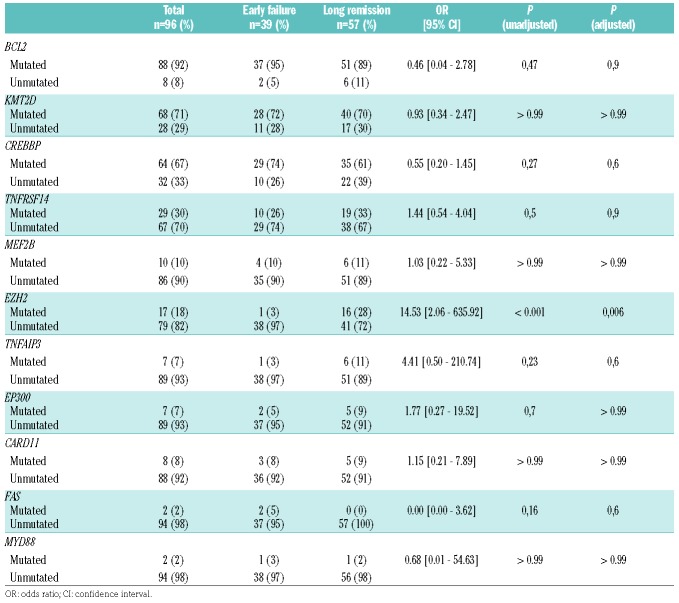
Genes included in the FL-LLBC-NGS target enrichment panel showed non-synonymous mutations in at least 2 FL cases (Figure 3 and Online Supplementary Table S12). BCL2, a known target for aberrant somatic hypermutation (aSHM) in FL, was most frequently mutated (88/96, 92%) with 0 to 78 mutations per case. Chromatin modifying genes KMT2D (71%) and CREBBP (67%) were mutated with high frequency, and epigenetic modifiers EZH2 (18%), MEF2B (10%), EP300 (7%) at lower rates with non-silent mutations in 1–4 of these chromatin modifying genes in 90% of FL patients, consistent with the critical role of epigenetic deregulation in the majority of FL. No patterns of co-occurrence or mutual exclusivity were observed. Non-silent mutations were found in TNFRSF14 (30%), TNFAIP3 (7%), CARD11 (8%), FAS (2%) and MYD88 (2%) (Table 2, Online Supplementary Table S13 shows the distribution of mutations of the 111 cases).
Figure 3.
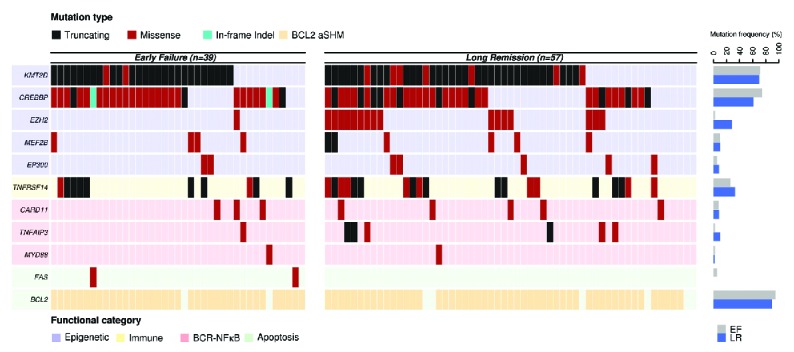
Distribution of mutations in 11 genes by subgroup. Each column represents an individual case. Genes are clustered based on functional category and mutations are color-coded based on effect prediction. Mutation frequencies for each gene by cohort are shown in the bar graph on the right. EF: early failure; LR: long remission.
Table 2.
Distribution of gene mutation status by cohort (n=96).
Impact of chromosomal copy numbers and gene mutations by prognostic subgroup
The distribution of CNAs and gene mutations by prognostic subgroup are shown in Figures 2 and 3. Statistically significant differences after multiple testing correction were only found for gain of chromosomal region 18p11.32–q21.33 (gain EF vs. LR 49% vs. 12%, P<0.001), with an estimated OR in logistic regression analysis of 0.15 (95% CI: [0.05–0.44]) and for EZH2 mutation status (unmutated EF vs. LR 90% vs. 72%, P<0.001) (Table 2). The odds ratio for unmutated EZH2 was 14.53 (95% CI:[2.06–635.92]). No significant impact was found for various markers, previously implicated as (borderline) prognostic such as CREBBP (OR 0.55, 95% CI [0.20–1.45], P=0.6), EP300 (OR 1.77, 95% CI [0.27–19.52], P>0.99), CARD11 (OR 1.15, 95% CI [0.21–7.89], P>0.99) and MEF2B (OR 1.03, 95% CI [0.22–5.33], P>0.99).
Integrated modeling of immunohistochemical and molecular analysis of the prognostic subgroups
Correlation analysis was performed for molecular and IHC markers, showing significant correlation between mutated CREBBP status and higher level infiltrates of PD1 positive T cells (P<0.005), but not with CD4 and CD8 positive T cells (Figure 4A). TNFRSF14 mutation status showed significant correlation with lower CD4 and CD8 positive T-cell infiltrates (P=0.037 and P=0.030) (Figure 4B). Microenvironmental populations were not significantly differentially distributed for other molecular markers, including EZH2 (data not shown).
Figure 4.
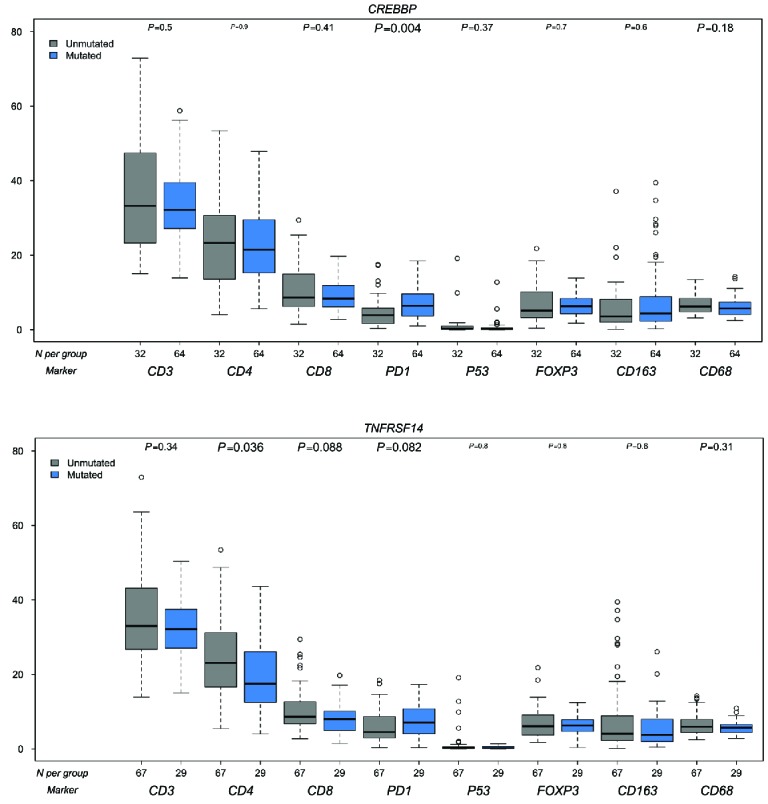
Correlation molecular markers and IHC markers. A: CREBBP B: TNFRSF14. Blue bars are mutated, gray bars are wild-type. On the X-axis the number of cases per IHC marker, on the Y-axis the percentages of positive cells or area.
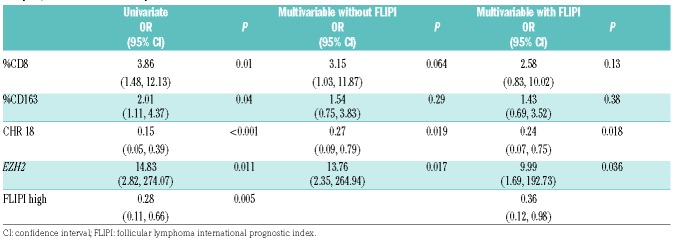
In a multivariable model combining the 4 markers, CD8, CD163, gain chromosome 18 and EZH2 mutation, that are statistically significant in the univariate analysis, only the gain of chromosome 18 (OR 0.27 (95% CI: [0.09,0.79], P=0.019)) and EZH2 (OR 13.76 (95% CI: [2.53,264.94], P=0.017)) retained significance. After incorporating the FLIPI score into the model, gain of chromosome 18 (P=0.018) and EZH2 (P=0.036) (Table 3) retained significance.
Table 3.
Odds ratio (OR) (95% Cl) for a 10% change in the immunohistochemical markers and absent or present molecular markers in univariate analysis, and multivariate analysis without and with the FLIPI.
Discussion
This LLBC study is, as far as we know, the first to comprehensively explore the combined prognostic impact of microenvironment T-cell and macrophage infiltration and tumor genetics of FL patients with extremely poor outcome (EF) versus those with a prolonged remission (LR). We show poor outcome to be characterized by a lower number of CD8+ T cells, a smaller CD163+ macrophage area (indicative of fewer macrophages), wild-type EZH2 and a copy number gain of chromosome 18. These observations, in part, confirm previous studies. The gain of chromosome 18, despite its statistically strong prognostic value, has not been reported previously. Equally important, cellular densities of various other cell populations, such as PD1+ T follicular helper (TFH) cells and FOXP3+ T regulatory (Treg) cells, previously claimed to predict clinical outcome, were not confirmed in our study.16,22,24,39–41
This study was specifically designed to verify the impact of previously published IHC and molecular markers in FL in the rituximab-chemotherapy era. Therefore, we implemented a dedicated study design to reduce noise such that all cases were retrieved from clinical trials and registries which guaranteed complete clinical information at presentation and detailed treatment information. This allowed us to make a homogeneously treated patient selection, with subgroups at the extreme ends of the prognostic spectrum, the EF and the LR subgroups. By balancing inclusion of the rare EF subgroup, we maximized the sensitivity to observe clinically relevant differences in the microenvironment and mutations, while allowing an overall relatively small patient cohort. To reduce inter-observer variability, the validated quantitative computerized IHC scoring method of the TMA was implemented, which has previously been shown to be more reproducible than any semi-quantitative method.27
For microenvironment populations, our results regarding the CD163+ area validate those of Kridel et al., showing that a higher CD163+ pixel count or CD163+ area are independent predictors of prolonged progression-free survival (PFS) in patients treated with R-CHOP (P=0.011–0.030), while the CD68+ macrophages population did not have a significant impact by pixel count or area.42 Previous reports provided conflicting data for CD68+ macrophages, suggesting correlation with either adverse17,39,43,44 or favorable outcome.45 Differences in scoring methods and variations in treatment characteristics may explain these discrepancies.
This LLBC study also showed that a lower percentage of CD8+ cytotoxic T cells in the whole TMA core and interfollicular areas was associated with EF after treatment with rituximab-chemotherapy. This confirms findings in several series using computerized scoring or flow cytometry of cell suspensions, both in the rituximab era and pre-rituximab era.15,22,46 However, inconsistent results were obtained in studies using manual scoring,14,18,47 corroborating the need for a reliable scoring method of CD8+ T cells.
None of the other T-cell markers, including CD3, CD4, PD1 and FOXP3 demonstrated a significant prognostic impact. Debates mostly focus on PD1+ cells, FOXP3+ cells and perifollicular patterns of FOXP3 positive T cells, with conflicting results being published. However, the positive prognostic value of PD1+ cells was seen in studies in which only some of the patients received rituximab,16,22 whereas in studies in which the majority of patients were treated with rituximab-chemotherapy, either no effect or a negative effect was reported.39,41
Frequencies of mutations and distribution of alterations in hotspots and functional domains of the tested genes are largely in line with those previously reported.28,31,48–50 Almost all FLs are reported to have mutations in 1 or more histone-modifying gene, such as KMT2D (reported as 76–89%), CREBBP (reported as 33–68%), MEF2B (reported as 15%), EP300 (reported as 9–15%) and EZH2 (reported as 7–26%).49 Histone-modifying genes exert their function largely indirectly via co-activation of various transcription factors, and as such their specific role in B-cell oncogenesis and immunological functions is difficult to predict.51 Gene expression analysis has suggested that mutated CREBBP may downregulate major histocompatibility complex (MHC) class II genes, resulting in impaired T-cell activation and possibly lower T-cell levels in tumor samples.49 This hypothesis could not be supported in the study herein, which showed no association of CREBBP mutation status and total numbers of T cells or specific subsets, apart from an association of CREBBP mutated status with higher numbers of PD1 positive T cells. It should be noted, however, that the differences, albeit statistically significant, take place in a very narrow dynamic range. KMT2D, which was mutated in 70% of both EF and LR cases, showed a strong correlation to both CD8 and CD163 with high levels of both markers in wild-type cases. KMT2D is known to decrease apoptosis and increase B-cell proliferation both directly and indirectly in germinal center B cells.52 Conditional mouse models indicate a role in plasma cell and germinal center differentiation.53 Regulatory alterations, impacting on immunological interactions with T cells or macrophages have not been described, however. In line with this, it is less remarkable that the mutation status of TNFRSF14, a protein that is directly involved in immune response regulation, does correlate with CD4+ and CD8+ T-cell infiltration in tumor samples.
By shallow WGS, copy number profiles of all tumors were studied in both prognostic groups. Of all previously published numerical alterations in FL, only gain of chromosome 18 stood out as an independent prognostic marker. Our results confirm EZH2 as a strong prognostic marker in FL, with wild-type gene status associated with poor disease outcome (EF),31,32 but other markers, such as EP300 and TNFRSF14, which have been implicated to have a significant, though minor, impact on prognosis, were not substantiated in our study.31,54 This is likely due to selection bias and relative underrepresentation of poor prognosis patients in previous series for which our study design was specifically optimized. This LLBC study design precludes integration of a complete multifactorial prognostic model such as the M7-FLIPI index, however, the prognostic trend of EZH2 as reported by Pastore et al. follows the same direction as in our study, where statistical significance is reached and lack of significance of 4 other markers is confirmed.
The pertinent question is whether these findings on the prognostic value of microenvironment populations and genomic alterations can be translated to application in daily clinical practice. The mutations in EZH2 are largely clustered in codon Y646 (Online Supplementary Figure S1) and are therefore technically very easily amenable to simple polymerase chain reaction (PCR) techniques,55 while chromosomal gains can be monitored using fluorescence in situ hybridization (FISH) or NGS.56,57 This signifies that EZH2 mutation status and chromosome 18 gain have a high potential for clinical implementation, in contrast to the microenvironment population markers CD8 and CD163. With current techniques, even if optimized, the absolute quantitative differences are too small between these 2 extreme cohorts to become a powerful and clinically useful tool for the scores around the cut point. At best the prediction of the extremes can be used for this purpose.
In conclusion, the literature with regard to IHC prognostic markers in FL has produced highly conflicting results, and concerning mutation analysis, only very limited data are currently available on prognostic impact. By making use of a specialized study design and a homogeneously rituximab-chemotherapy treated group of patients, we can now confirm that lower percentages of CD8+ T cells, CD163+ M2 macrophage areas, EZH2 wild-type status and gain of chromosome 18 in the initial tumor biopsy specimen predict a poor prognosis in FL for this treatment cohort. Of equal importance, in the study herein we could not substantiate the previously reported claims on the prognostic impact of the other most commonly mutated genes, such as TNFRSF14 and EP300, of T-cell populations and classes of macrophages, as well as a perifollicular distribution of FOXP3+ T cells for patients treated with R-CHOP (-like).14,16,18,22,24,31,39–41,54 Moreover, the study herein provides further insight into the relationship between gene mutation status and the most relevant microenvironmental populations in FL.
Supplementary Material
Acknowledgments
The authors would like to thank Daoud Sie for his advice and providing genomics and compute infrastructure
Footnotes
Check the online version for the most updated information on this article, online supplements, and information on authorship & disclosures: www.haematologica.org/content/102/8/1413
Contributors
The Lunenburg Lymphoma Biomarker Consortium (LLBC) is a collaboration of 10 international lymphoma research groups, each represented by a clinical investigator and one or more hematopathologists and supported by a team of statisticians. Foundation of the LLBC was made possible with a grant from the Van Vlissingen Lymphoma Foundation. EORTC Lymphoma group: Daphne de Jong, John Raemaekers. HOVON Lymphoma group: Daphne de Jong, Marie-José Kersten, Anton Hagenbeek. LYSA: Philippe Gaulard, Gilles Salles, Luc Xerri. British Columbia Cancer Agency: Randy D. Gascoyne, Laurie Sehn. ECOG: Randy D. Gascoyne. GLSG: Andreas Rosenwald, Wolfram Klapper, Michael Pfreundschuh, Wolfgang Hiddemann, Eva Hoster. NLG: Birgitta Sander, Eva Kimby. Barts Cancer Institute: Andrew J. Clear, Maria Calaminici, John Gribben. Leeds Registry: Andrew Jack Stanford: Yasodha Natkunam, Ranjana Advani. Dana-Farber Cancer Institute, Boston, USA: Edie Weller, Robert Redd.
Funding
This study was supported by unrestricted grants from: Genentech/Roche, GlaxoSmithKline, Pfizer Pharma, Teva, Pharmaceuticals/Cephalon and Millenium Pharmaceuticals Inc, Celgene.
References
- 1.Swenson WT, Wooldridge JE, Lynch CF, Forman-Hoffman VL, Chrischilles E, Link BK. Improved survival of follicular lymphoma patients in the United States. J Clin Oncol. 2005;23(22):5019–5026. [DOI] [PubMed] [Google Scholar]
- 2.Marcus R, Imrie K, Belch A, et al. CVP chemotherapy plus rituximab compared with CVP as first-line treatment for advanced follicular lymphoma. Blood. 2005;105(4):1417–1423. [DOI] [PubMed] [Google Scholar]
- 3.Hiddemann W, Kneba M, Dreyling M, et al. Frontline therapy with rituximab added to the combination of cyclophosphamide, doxorubicin, vincristine, and prednisone (CHOP) significantly improves the outcome for patients with advanced-stage follicular lymphoma compared with therapy with CHOP alone: results of a prospective randomized study of the German Low-Grade Lymphoma Study Group. Blood. 2005;106(12):3725–3732. [DOI] [PubMed] [Google Scholar]
- 4.Salles G, Mounier N, de Guibert S, et al. Rituximab combined with chemotherapy and interferon in follicular lymphoma patients: results of the GELA-GOELAMS FL2000 study. Blood. 2008;112(13):4824–4831. [DOI] [PubMed] [Google Scholar]
- 5.Salles G, Seymour JF, Offner F, et al. Rituximab maintenance for 2 years in patients with high tumour burden follicular lymphoma responding to rituximab plus chemotherapy (PRIMA): a phase 3, randomised controlled trial. Lancet. 2011;377(9759):42–51. [DOI] [PubMed] [Google Scholar]
- 6.Bachy E, Houot R, Morschhauser F, et al. Long-term follow up of the FL2000 study comparing CHVP-interferon to CHVP-interferon plus rituximab in follicular lymphoma. Haematologica. 2013;98(7):1107–1114. [DOI] [PMC free article] [PubMed] [Google Scholar]
- 7.Freedman A. Follicular lymphoma: 2011 update on diagnosis and management. Am J Hematol. 2011;86(9):768–775. [DOI] [PubMed] [Google Scholar]
- 8.Solal-Celigny P, Roy P, Colombat P, et al. Follicular lymphoma international prognostic index. Blood. 2004;104(5):1258–1265. [DOI] [PubMed] [Google Scholar]
- 9.Montoto S, Lopez-Guillermo A, Altes A, et al. Predictive value of Follicular Lymphoma International Prognostic Index (FLIPI) in patients with follicular lymphoma at first progression. Ann Oncol. 2004;15(10):1484–1489. [DOI] [PubMed] [Google Scholar]
- 10.Federico M, Bellei M, Marcheselli L, et al. Follicular lymphoma international prognostic index 2: a new prognostic index for follicular lymphoma developed by the international follicular lymphoma prognostic factor project. J Clin Oncol. 2009;27(27):4555–4562. [DOI] [PubMed] [Google Scholar]
- 11.Dave SS, Wright G, Tan B, et al. Prediction of survival in follicular lymphoma based on molecular features of tumor-infiltrating immune cells. N Engl J Med. 2004;351(21):2159–2169. [DOI] [PubMed] [Google Scholar]
- 12.Glas AM, Kersten MJ, Delahaye LJ, et al. Gene expression profiling in follicular lymphoma to assess clinical aggressiveness and to guide the choice of treatment. Blood. 2005;105(1):301–307. [DOI] [PubMed] [Google Scholar]
- 13.Ott G, Katzenberger T, Lohr A, et al. Cytomorphologic, immunohistochemical, and cytogenetic profiles of follicular lymphoma: 2 types of follicular lymphoma grade 3. Blood. 2002;99(10):3806–3812. [DOI] [PubMed] [Google Scholar]
- 14.Lee AM, Clear AJ, Calaminici M, et al. Number of CD4+ cells and location of fork-head box protein P3-positive cells in diagnostic follicular lymphoma tissue microarrays correlates with outcome. J Clin Oncol. 2006;24(31):5052–5059. [DOI] [PubMed] [Google Scholar]
- 15.Alvaro T, Lejeune M, Camacho FI, et al. The presence of STAT1-positive tumor-associated macrophages and their relation to outcome in patients with follicular lymphoma. Haematologica. 2006;91(12):1605–1612. [PubMed] [Google Scholar]
- 16.Carreras J, Lopez-Guillermo A, Fox BC, et al. High numbers of tumor-infiltrating FOXP3-positive regulatory T cells are associated with improved overall survival in follicular lymphoma. Blood. 2006;108(9): 2957–2964. [DOI] [PubMed] [Google Scholar]
- 17.Canioni D, Salles G, Mounier N, et al. High numbers of tumor-associated macrophages have an adverse prognostic value that can be circumvented by rituximab in patients with follicular lymphoma enrolled onto the GELA-GOELAMS FL-2000 trial. J Clin Oncol. 2008;26(3):440–446. [DOI] [PubMed] [Google Scholar]
- 18.Glas AM, Knoops L, Delahaye L, et al. Gene-expression and immunohistochemical study of specific T-cell subsets and accessory cell types in the transformation and prognosis of follicular lymphoma. J Clin Oncol. 2007;25(4):390–398. [DOI] [PubMed] [Google Scholar]
- 19.Carreras J, Lopez-Guillermo A, Roncador G, et al. High numbers of tumor-infiltrating programmed cell death 1-positive regulatory lymphocytes are associated with improved overall survival in follicular lymphoma. J Clin Oncol. 2009;27(9):1470–1476. [DOI] [PubMed] [Google Scholar]
- 20.Clear AJ, Lee AM, Calaminici M, et al. Increased angiogenic sprouting in poor prognosis FL is associated with elevated numbers of CD163+ macrophages within the immediate sprouting microenvironment. Blood. 2010;115(24):5053–5056. [DOI] [PMC free article] [PubMed] [Google Scholar]
- 21.Klapper W, Hoster E, Rolver L, et al. Tumor sclerosis but not cell proliferation or malignancy grade is a prognostic marker in advanced-stage follicular lymphoma: the German Low Grade Lymphoma Study Group. J Clin Oncol. 2007;25(22):3330–3336. [DOI] [PubMed] [Google Scholar]
- 22.Wahlin BE, Aggarwal M, Montes-Moreno S, et al. A unifying microenvironment model in follicular lymphoma: outcome is predicted by programmed death-1–positive, regulatory, cytotoxic, and helper T cells and macrophages. Clin Cancer Res. 2010;16(2):637–650. [DOI] [PubMed] [Google Scholar]
- 23.Wahlin BE, Sundstrom C, Holte H, et al. T cells in tumors and blood predict outcome in follicular lymphoma treated with rituximab. Clin Cancer Res. 2011;17(12):4136–4144. [DOI] [PubMed] [Google Scholar]
- 24.Farinha P, Al-Tourah A, Gill K, Klasa R, Connors JM, Gascoyne RD. The architectural pattern of FOXP3-positive T cells in follicular lymphoma is an independent predictor of survival and histologic transformation. Blood. 2010;115(2):289–295. [DOI] [PubMed] [Google Scholar]
- 25.de Jong D, Koster A, Hagenbeek A, et al. Impact of the tumor microenvironment on prognosis in follicular lymphoma is dependent on specific treatment protocols. Haematologica. 2009;94(1):70–77. [DOI] [PMC free article] [PubMed] [Google Scholar]
- 26.de Jong D, Rosenwald A, Chhanabhai M, et al. Immunohistochemical prognostic markers in diffuse large B-cell lymphoma: validation of tissue microarray as a prerequisite for broad clinical applications–a study from the Lunenburg Lymphoma Biomarker Consortium. J Clin Oncol. 2007;25(7):805–812. [DOI] [PubMed] [Google Scholar]
- 27.Sander B, de Jong D, Rosenwald A, et al. The reliability of immunohistochemical analysis of the tumor microenvironment in follicular lymphoma: a validation study from the Lunenburg Lymphoma Biomarker Consortium. Haematologica. 2014;99(4): 715–725. [DOI] [PMC free article] [PubMed] [Google Scholar]
- 28.Pasqualucci L, Khiabanian H, Fangazio M, et al. Genetics of follicular lymphoma transformation. Cell Rep. 2014;6(1):130–140. [DOI] [PMC free article] [PubMed] [Google Scholar]
- 29.Okosun J, Bodor C, Wang J, et al. Integrated genomic analysis identifies recurrent mutations and evolution patterns driving the initiation and progression of follicular lym phoma. Nat Genet. 2014;46(2):176–181. [DOI] [PMC free article] [PubMed] [Google Scholar]
- 30.Green MR, Gentles AJ, Nair RV, et al. Hierarchy in somatic mutations arising during genomic evolution and progression of follicular lymphoma. Blood. 2013;121(9): 1604–1611. [DOI] [PMC free article] [PubMed] [Google Scholar]
- 31.Pastore A, Jurinovic V, Kridel R, et al. Integration of gene mutations in risk prognostication for patients receiving first-line immunochemotherapy for follicular lymphoma: a retrospective analysis of a prospective clinical trial and validation in a population-based registry. Lancet Oncol. 2015;16(9):1111–1122. [DOI] [PubMed] [Google Scholar]
- 32.Jurinovic V, Kridel R, Staiger AM, et al. Clinicogenetic risk models predict early progression of follicular lymphoma after first-line immunochemotherapy. Blood. 2016;128(8):1112–1120. [DOI] [PMC free article] [PubMed] [Google Scholar]
- 33.Casulo C, Byrtek M, Dawson KL, et al. Early Relapse of Follicular Lymphoma After Rituximab Plus Cyclophosphamide, Doxorubicin, Vincristine, and Prednisone Defines Patients at High Risk for Death: An Analysis From the National LymphoCare Study. J Clin Oncol. 2015;33(23):2516–2522. [DOI] [PMC free article] [PubMed] [Google Scholar]
- 34.Scheinin I, Sie D, Bengtsson H, et al. DNA copy number analysis of fresh and formalin-fixed specimens by shallow whole-genome sequencing with identification and exclusion of problematic regions in the genome assembly. Genome Res. 2014;24(12):2022–2032. [DOI] [PMC free article] [PubMed] [Google Scholar]
- 35.Koboldt DC, Zhang Q, Larson DE, et al. VarScan 2: somatic mutation and copy number alteration discovery in cancer by exome sequencing. Genome research. 2012;22(3):568–576. [DOI] [PMC free article] [PubMed] [Google Scholar]
- 36.Brennan RL, Prediger DJ. Coefficient kappa - some uses, misuses, and alternatives. Educ Psychol Meas. 1981;41(3):687–699. [Google Scholar]
- 37.Mackay A, Weigelt B, Grigoriadis A, et al. Microarray-based class discovery for molecular classification of breast cancer: analysis of interobserver agreement. J Natl Cancer Inst. 2011;103(8):662–673. [DOI] [PMC free article] [PubMed] [Google Scholar]
- 38.R Core Team R. A language and environment for statistical computing. R Foundation for Statistical Computering, Vienna, Austria 2013 [cited; Available from: http://www.R-project.org. Last accessed December 2016. [Google Scholar]
- 39.Richendollar BG, Pohlman B, Elson P, Hsi ED. Follicular programmed death 1-positive lymphocytes in the tumor microenvironment are an independent prognostic factor in follicular lymphoma. Hum Pathol. 2011;42(4):552–557. [DOI] [PubMed] [Google Scholar]
- 40.Koch K, Hoster E, Unterhalt M, et al. The composition of the microenvironment in follicular lymphoma is associated with the stage of the disease. Hum Pathol. 2012;43(12):2274–2281. [DOI] [PubMed] [Google Scholar]
- 41.Takahashi H, Tomita N, Sakata S, et al. Prognostic significance of programmed cell death-1-positive cells in follicular lymphoma patients may alter in the rituximab era. Eur J Haematol. 2013;90(4):286–290. [DOI] [PubMed] [Google Scholar]
- 42.Kridel R, Xerri L, Gelas-Dore B, et al. The prognostic impact of CD163-positive macrophages in follicular lymphoma: a study from the BC Cancer Agency and the Lymphoma Study Association. Clin Cancer Res. 2015;21(15):3428–3435. [DOI] [PubMed] [Google Scholar]
- 43.Coiffier B, Li W, Henitz ED, et al. Prespecified candidate biomarkers identify follicular lymphoma patients who achieved longer progression-free survival with bortezomib-rituximab versus rituximab. Clin Cancer Res. 2013;19(9):2551–2561. [DOI] [PubMed] [Google Scholar]
- 44.Farinha P, Masoudi H, Skinnider BF, et al. Analysis of multiple biomarkers shows that lymphoma-associated macrophage (LAM) content is an independent predictor of survival in follicular lymphoma (FL). Blood. 2005;106(6):2169–2174. [DOI] [PubMed] [Google Scholar]
- 45.Taskinen M, Karjalainen-Lindsberg ML, Nyman H, Eerola LM, Leppa S. A high tumor-associated macrophage content predicts favorable outcome in follicular lymphoma patients treated with rituximab and cyclophosphamide-doxorubicin-vincristine-prednisone. Clin Cancer Res. 2007;13(19):5784–5789. [DOI] [PubMed] [Google Scholar]
- 46.Wahlin BE, Sander B, Christensson B, et al. Entourage: the immune microenvironment following follicular lymphoma. Blood Cancer J. 2012;2(1):e52. [DOI] [PMC free article] [PubMed] [Google Scholar]
- 47.Saifi M, Maran A, Raynaud P, et al. High ratio of interfollicular CD8/FOXP3-positive regulatory T cells is associated with a high FLIPI index and poor overall survival in follicular lymphoma. Exp Ther Med. 2010;1(6):933–938. [DOI] [PMC free article] [PubMed] [Google Scholar]
- 48.Morin RD, Mendez-Lago M, Mungall AJ, et al. Frequent mutation of histone-modifying genes in non-Hodgkin lymphoma. Nature. 2011;476(7360):298–303. [DOI] [PMC free article] [PubMed] [Google Scholar]
- 49.Green MR, Kihira S, Liu CL, et al. Mutations in early follicular lymphoma progenitors are associated with suppressed antigen presentation. Proc Natl Acad Sci USA. 2015;112(10):E1116–1125. [DOI] [PMC free article] [PubMed] [Google Scholar]
- 50.Morin RD, Johnson NA, Severson TM, et al. Somatic mutations altering EZH2 (Tyr641) in follicular and diffuse large B-cell lymphomas of germinal-center origin. Nat Genet. 2010;42(2):181–185. [DOI] [PMC free article] [PubMed] [Google Scholar]
- 51.Jiang Y, Hatzi K, Shaknovich R. Mechanisms of epigenetic deregulation in lymphoid neoplasms. Blood. 2013; 121(21):4271–4279. [DOI] [PMC free article] [PubMed] [Google Scholar]
- 52.Zhang J, Dominguez-Sola D, Hussein S, et al. Disruption of KMT2D perturbs germinal center B cell development and promotes lymphomagenesis. Nat Med. 2015; 21(10):1190–1198. [DOI] [PMC free article] [PubMed] [Google Scholar]
- 53.Ortega-Molina A, Boss IW, Canela A, et al. The histone lysine methyltransferase KMT2D sustains a gene expression program that represses B cell lymphoma development. Nat Med. 2015;21(10):1199–1208. [DOI] [PMC free article] [PubMed] [Google Scholar]
- 54.Cheung KJ, Johnson NA, Affleck JG, et al. Acquired TNFRSF14 mutations in follicular lymphoma are associated with worse prognosis. Cancer Res. 2010;70(22):9166–9174. [DOI] [PubMed] [Google Scholar]
- 55.Bodor C, Grossmann V, Popov N, et al. EZH2 mutations are frequent and represent an early event in follicular lymphoma. Blood. 2013;122(18):3165–3168. [DOI] [PMC free article] [PubMed] [Google Scholar]
- 56.Macintyre G, Ylstra B, Brenton JD. Sequencing structural variants in cancer for precision therapeutics. Trends Genet. 2016; 32(9):530–542. [DOI] [PubMed] [Google Scholar]
- 57.Hastings RJ, Bown N, Tibiletti MG, et al. Guidelines for cytogenetic investigations in tumours. Eur J Hum Genet. 2016;24(1):6–13. [DOI] [PMC free article] [PubMed] [Google Scholar]
Associated Data
This section collects any data citations, data availability statements, or supplementary materials included in this article.


