Abstract
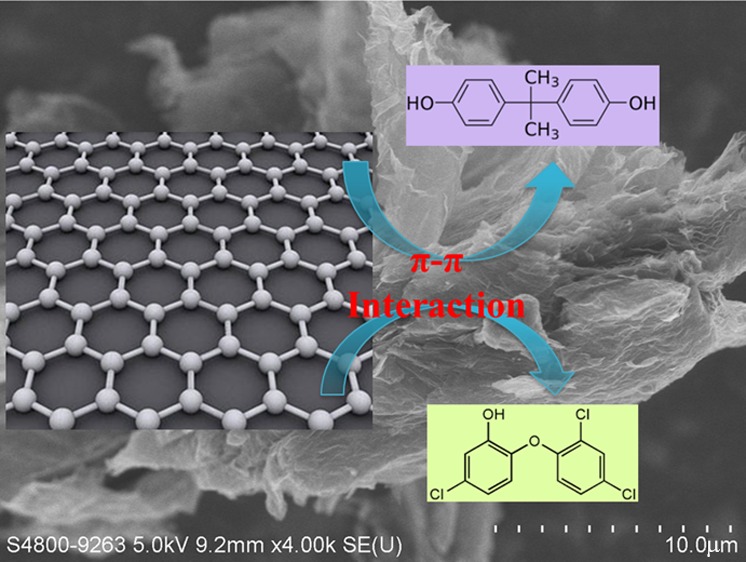
The sorption behavior of bisphenol A (BPA) and triclosan (TCS) on graphene was investigated and compared with that on activated carbon. The kinetic studies showed that BPA sorption on graphene or activated carbon reached equilibrium within 240 min, whereas TCS sorption on these two materials achieved equilibrium in 60 and 120 min. The maximum sorption capacity (qm) of BPA on graphene or activated carbon reached approximately 2.0 × 10³ μg/g, which indicated that graphene was not superior to traditional activated carbon for BPA removal. By contrast, the strong partitioning ability of TCS on graphene suggested the potential use of graphene materials to remove TCS from wastewater. Although the pH change from 4.0 to 7.0 did not greatly affect BPA or TCS sorption, the sorption decreased dramatically when the pH was increased from 7.0 to 9.0. This phenomenon should be attributed to the establishment of electrostatic repulsion between anionic BPA (or TCS) molecules and the graphene (or activated carbon) surface under higher pH conditions. The increase of ion (NaCl and CaCl2) concentrations may lead to substantial increase of BPA sorption on graphene or activated carbon due to the salting-out effect. By contrast, ion concentrations had no significant effect on TCS sorption because of the dominant hydrophobic interaction.
Introduction
Endocrine-disrupting chemicals (EDCs) and pharmaceuticals and personal care products (PPCPs) are two kinds of compounds which have gained global attention because of their broad occurrence in aquatic environments and ability to cause potential harm to humans. EDCs are chemical substances that cause malfunctions in the endocrine system of humans and animals, thus, affecting certain functions of the cells.1 Among them, bisphenol A (BPA) attracts broad attention because of its wide use as a monomer in the production of polycarbonates, epoxy resins, and other plastics.2 It was reported that BPA has been widely detected in wastewater, groundwater, surface water, and even drinking water.3−5 PPCPs are another group of emerging contaminants with growing attention in recent years because of their long-term potential risks to drinking water safety and aquatic organisms. Triclosan (TCS) is among the most frequently detected PPCPs. It has been used in a large variety of consumer products, including detergents, shampoos, toothpastes, body washes, deodorants, lotions, and dish washing liquids,6 which is released in large amounts into wastewater treatment plants and then into surface water.7 TCS is reported to be highly toxic to algae and blocks the enzyme-carrying proteins of aquatic organisms.8,9 In addition, TCS has the potential to be transformed into dioxin and EDCs in wastewater and drinking water systems.10
Graphene is a one-atom-thick planar sheet of sp2-bonded carbon atoms that are densely packed in a honeycomb crystal lattice. Since its first isolation in 2004,11 graphene has attracted broad attention and has become a novel star material in recent years. Owing to its large surface area,12 extraordinary electronic and mechanical properties,13 excellent mobility of charge carriers,14 and good thermal conductivity,15 graphene has been applied in many fields such as adsorbents,2,16,17 supercapacitors,18 solar cells,19 photocatalysis,20,21 and sensors.22 The promising application in future and the development of synthesis techniques have led to large-scale production of graphene materials. It was reported that the global market for graphene-based materials was approximately $67 million in 2015 and will reach $675 million in 2020 at an annual growth rate of 58.7%.
A number of studies have shown the excellent adsorption capability of graphene-based materials in the removal of pollutants. It was reported that graphene-based materials (functionalized graphene) showed high adsorption capacity toward heavy metal ions (such as Cu2+, Pb2+, Cd2+, Ni2+, and Cr6+).23−25 Furthermore, the removal of dyes26−28 from wastewater using graphene was also widely studied based on the hydrophobic properties of this material. Compared with other carbonaceous materials, the advantage of graphene is the selective adsorption ability to aromatic compounds with benzene rings through strong π–π interaction.2,29 The π–π bonding occurs between C=C double bonds or benzene rings of adsorbed organic molecules and benzene rings on graphene surface via π–π coupling. Thus, the application of graphene to remove aromatic compounds from wastewater is expected to be promising.
The goals of this study were to compare the different sorption mechanisms of BPA and TCS on graphene and activated carbon. The sorption kinetics and isotherms were first studied to determine their equilibrium time and maximum sorption capacities. Furthermore, the effects of pH and cations (Na+ and Ca2+) on BPA and TCS sorption by graphene and activated carbon were assessed to explore their potential interaction mechanisms. The designed experiments were expected to show the potential efficiency of graphene materials in the removal of BPA and TCS from water matrix.
Results and Discussion
Sorption Kinetics
The solute uptake rate controls the residence time of adsorbate uptake at the solid–solution interface and is therefore important for understanding the adsorption kinetics of adsorbates in general. The adsorption kinetics of BPA on graphene and activated carbon (Figure 1a) indicated that the adsorption process reached equilibrium within 240 min. By contrast, Figure 1b showed that TCS sorption on graphene and activated carbon achieved equilibrium in 60 and 120 min, respectively. The rapid sorption on graphene is an advantage for the potential use of graphene materials to remove BPA and TCS from wastewater. To better understand the adsorption kinetics, two commonly used kinetic models, the pseudo-first-order (eq 1) and pseudo-second-order equations (eq 2),30,31 were used to fit the kinetic data
| 1 |
| 2 |
where qe (μg/g) and qt (μg/g) are the amounts of BPA or TCS adsorbed per unit mass of the adsorbents (graphene or activated carbon) at equilibrium and at any time (t), respectively. The k1 and k2 are the rate constants of the pseudo-first-order and pseudo-second-order models, respectively. The rate constants of the kinetic models along with the regression coefficients (R2) are listed in Table 1.
Figure 1.
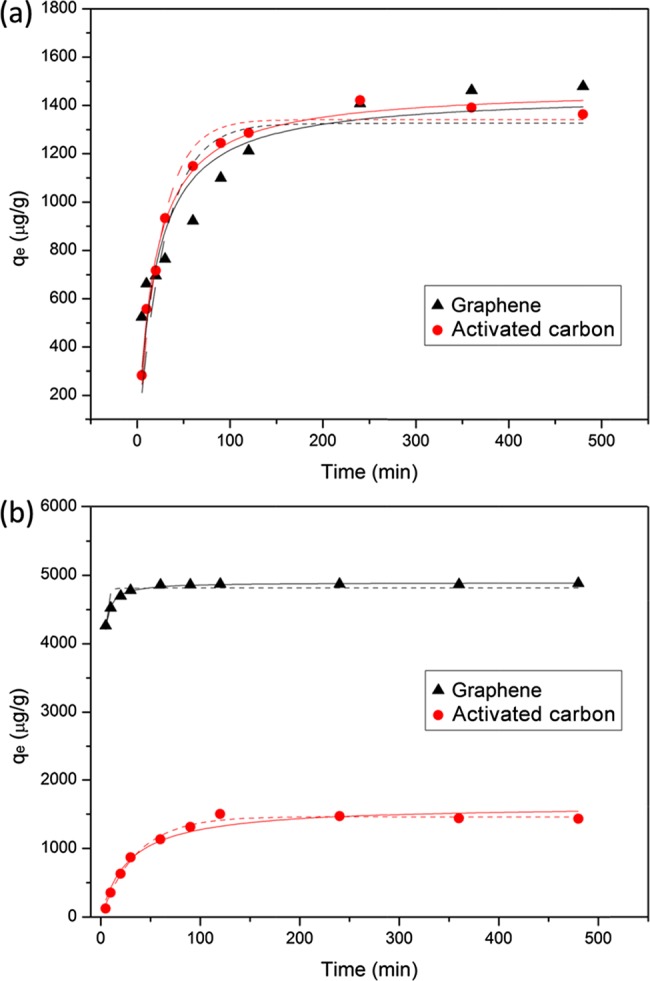
BPA (a) and TCS (b) sorption kinetics (test condition: 100 mg/L sorbent with 500 μg/L sorbate initial concentration) on graphene or activated carbon. The data were fitted with the pseudo-first-order (dash lines) or second-order kinetic equations (solid lines).
Table 1. Constants of Pseudo-First-Order and Pseudo-Second-Order for the Sorption of BPA and TCS by Graphene or Activated Carbona.
| pseudo-first-order |
pseudo-second-order |
||||
|---|---|---|---|---|---|
| sorbent | sorbate | k1 (min–1) | R2 | k2 (g/μg·min) | R2 |
| GR | BPA | 0.0345 | 0.682 | 0.000035 | 0.849 |
| TCS | 0.414 | 0.763 | 0.00027 | 0.993 | |
| AC | BPA | 0.0404 | 0.971 | 0.000037 | 0.990 |
| TCS | 0.0277 | 0.991 | 0.000021 | 0.962 | |
GR represents graphene and AC means activated carbon.
For BPA and TCS sorption kinetics on graphene, the regression coefficient R2 value for the pseudo-second-order model was much higher than that of the pseudo-first-order model. It indicated that the pseudo-second-order kinetic model described the sorption of BPA and TCS on graphene better than the pseudo-first-order model. This result implies that the rate-limiting step is chemical adsorption involving electronic forces through sharing or exchange of electrons between the adsorbent and ionized species as a function of electron donor or acceptor, respectively, regardless of equilibrium concentrations.32 The same result about BPA sorption on graphene was also reported by Xu et al.2 However, our results showed that the k2 value for BPA sorption on graphene was around 2.1 g/mg·h, which was much higher than that reported by Xu et al.2 (i.e., 0.033 g/mg·h). The difference may be attributed to the different initial concentrations used in these two studies. Because the same graphene concentration was applied, the relatively lower initial concentration used in our study may lead to a faster sorption rate. For BPA and TCS sorption kinetics on activated carbon, the data were fitted well by both pseudo-first-order and pseudo-second-order models. When comparing the sorption kinetics between graphene and activated carbon, it is found that graphene showed a higher sorption rate (k1 and k2) toward TCS than activated carbon. However, the sorption rates of BPA on graphene and activated carbon were generally the same.
Sorption Isotherms
Sorption isotherms of BPA and TCS on graphene or activated carbon are shown in Figure 2. Two commonly used isotherm models, the Langmuir and Freundlich equations33,34 (eqs 3 and 4), were adopted to describe the experimental data with the obtained constants summarized in Table 2
| 3 |
| 4 |
where qe (μg/g) is the amount of the adsorbate on the surface of the adsorbent at equilibrium, Ce (μg/L) is the equilibrium concentration of the adsorbate in solution (μg/g), qm (μg/L) is the maximum sorption capacity, KL (L/μg) is the Langmuir adsorption constant, KF [(μg/g) (μg/L)−n] is the Freundlich adsorption constant, which indicates the adsorption capacity, and n represents the measure of the nonlinearity involved.
Figure 2.
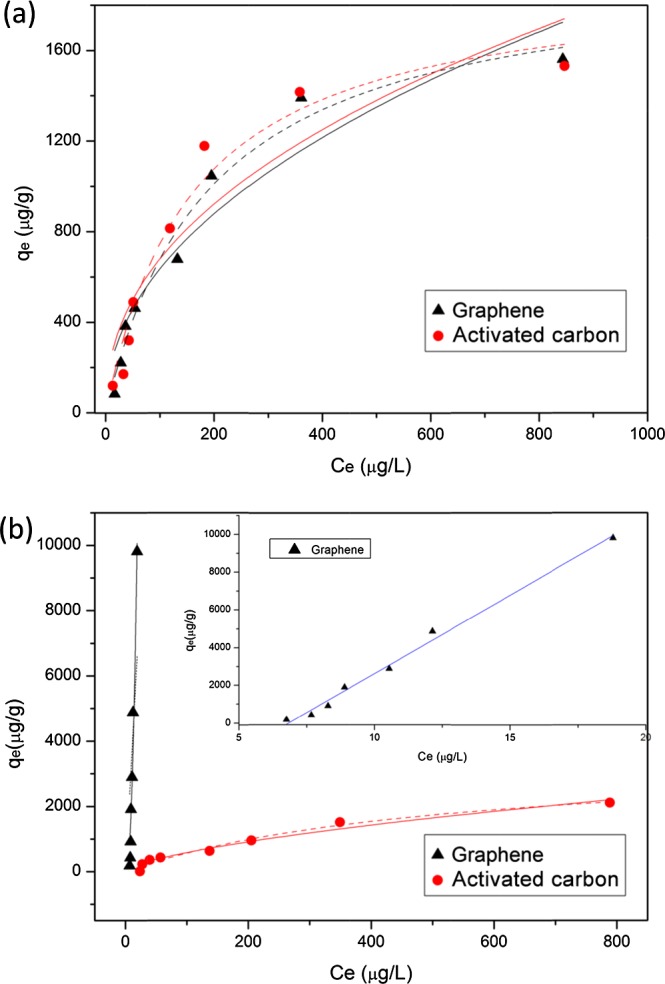
BPA (a) and TCS (b) sorption isotherms (test condition: 100 mg/L sorbent with 4 h adsorption time) on graphene or activated carbon. The solid and dashed lines represent the fitted Langmuir and Freundlich isotherms, respectively.
Table 2. Constants of Langmuir and Freundlich Equations for the Sorption of BPA and TCS by Graphene or Activated Carbona.
| Langmuir
constants |
Freundlich constants |
||||||
|---|---|---|---|---|---|---|---|
| sorbent | sorbate | KL (L/μg) | qm (μg/g) | R2 | KF [(μg/g) (μg/L)−n] | n | R2 |
| GR | BPA | 0.0052 | 2.0 × 10³ | 0.976 | 73.41 | 2.17 | 0.907 |
| TCS | 3.3 × 10⁻⁶ | 1.1 × 10⁸ | 0.542 | 11.60 | 0.43 | 0.944 | |
| AC | BPA | 0.0014 | 1.9 × 10³ | 0.962 | 89.44 | 2.27 | 0.846 |
| TCS | 4.4 × 10⁻⁴ | 3.5 × 10³ | 0.979 | 30.36 | 1.56 | 0.965 | |
GR represents graphene and AC means activated carbon.
The sorption of BPA on graphene or activated carbon was fitted better with the Langmuir equation than the Freundlich equation, according to the coefficient of determination (R2) in Table 2. Such findings may indicate that the sorption of BPA on these two sorbents is similar to a monolayer coverage behavior based on the assumption of Langmuir model. The maximum adsorption capacities (qm) of BPA on graphene and activated carbon are 2.0 × 10³ and 1.9 × 10³ μg/g, respectively. The results suggest that graphene has no superior sorption capacity toward BPA, and the activated carbon was still a cost-effective sorbent for BPA removal from wastewater. However, the same qm value does not imply the same mechanism. Indeed, the sorption of BPA on graphene should be dominated by the π–π interaction, whereas the sorption on activated carbon is possibly governed by the hydrogen bonding, hydrophobic interaction, and π–π interaction.
The sorption of TCS on graphene was fitted better with the Freundlich equation than the Langmuir equation, whereas the sorption on activated carbon was fitted well with both the Langmuir and Freundlich equations (Table 2). Behera et al.6 also reported that the sorption of TCS was fitted well with both of the two commonly used equations even under 1 order of magnitude higher initial TCS concentrations than that in the current study. Compared with activated carbon, graphene showed a higher sorption affinity toward TCS, based on the sorption amount at the same initial concentration. To better understand the sorption behavior of TCS, a linear equation was used to fit the sorption data and revealed a better result (R2 > 99%) than the Freundlich equation (inset of Figure 2b). This result indicates that a partition-like behavior of TCS may occur on graphene in addition to the π–π interaction between benzene rings. The linear sorption behavior may be attributed to the use of relatively lower TCS initial concentration, which may indicate the high sorption capacity of TCS on graphene materials. Thus, the high sorption ability of graphene toward TCS promotes the potential use of graphene-based materials to remove TCS from wastewater.
pH Effects
The pH is usually a critical factor for pollutant sorption in water because of its ability to affect the surface charge of the sorbent and existing form of the sorbate. The effect of pH on the sorption of BPA and TCS on graphene or activated carbon is presented in Figure 3. As shown in Figure 3a, the pH ranging from 5.0 to 7.0 had no effect on sorption levels of BPA on graphene or activated carbon, as the pH changes (from 5.0 to 7.0) had no great effects on the dominant sorption mechanism (π–π interaction). However, the sorption levels slightly decreased when the pH increased from 7.0 to 9.0. Given that both graphene and activated carbon carry negative charges on the surface, the net charge of graphene and surface charge of activated carbon decreases with the increase of pH values owing to surface deprotonation. In addition, BPA exists in its neutral form (or molecular form) under pH < 8 but begins to deprotonate to a negatively charged form at around pH 8. Thus, a repulsive electrostatic interaction may be established between bisphenolate anion and negatively charged surface of graphene (or activated carbon) as pH was increased above 7.0. This physical interaction would lead to a reduction in BPA sorption capacity on graphene or activated carbon, which was shown in our study (Figure 3a). Although it was proposed that higher pH values would increase π donor ability of the adsorbate and enhance the π–π interaction,35 our results suggested that the pH effect on the π–π interaction was limited when compared to the electrostatic interaction.
Figure 3.
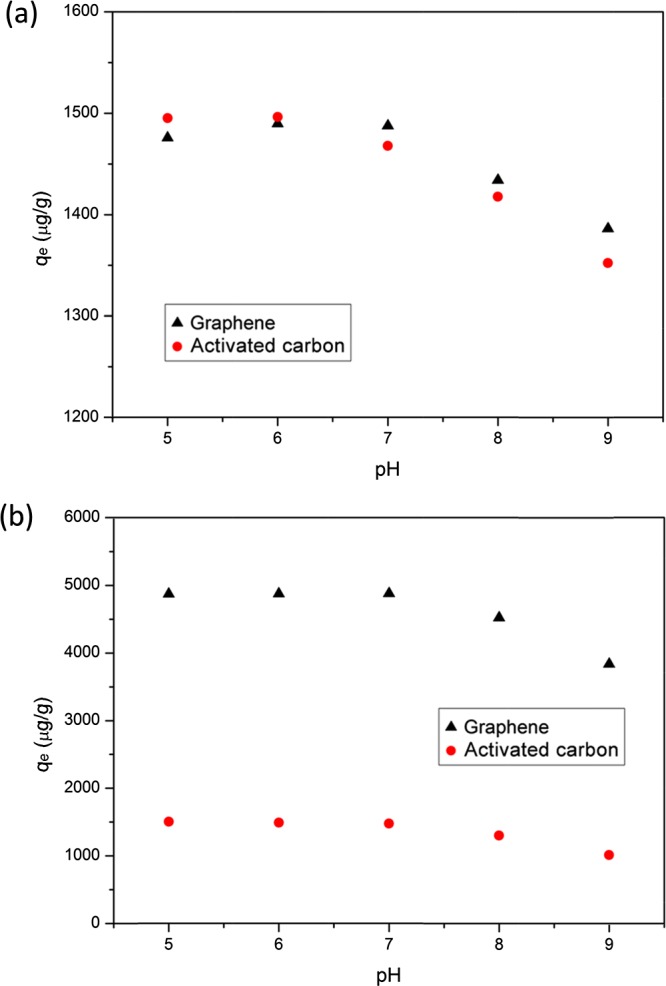
Effects of pH on the sorption of BPA (a) and TCS (b) (test condition: 100 mg/L sorbent with 500 μg/L sorbate initial concentration and 4 h sorption time) on graphene or activated carbon.
The sorption capacities of TCS on graphene or activated carbon had little change at pH 5.0–7.0, but they decreased when pH was increased from 7.0 to 9.0. Such observations resembled the results of BPA sorption on graphene or activated carbon. Since the main driving forces for TCS sorption on graphene or activated carbon were π–π interactions, hydrogen bonding, and hydrophobic interaction, our results suggest that the pH had limited effects on such mechanisms within the pH range used in this study. The decrease of TCS sorption from 7.0 to 9.0 should also be attributed to the electrostatic repulsions between TCS anions and surface of graphene or activated carbon established at higher pH (7.0–9.0).
Ionic Effects
In addition to pH, ionic strength and cation types are usually critical factors affecting the sorption processes. In Figure 4a, the sorption capacities (qe) of BPA on graphene and activated carbon increased from 1750 to 2500 mg/g and from 2250 to 4750 mg/g, respectively, when the NaCl and CaCl2 concentrations increased from 0.001 to 0.1 M. On the basis of previous theories, the ions may affect the sorption of BPA on graphene from three aspects: (1) the increase of ion concentration can enhance the aggregation of graphene materials to form a compact structure (squeezing-out effect), thus reducing the BPA sorption because of the decrease of sorption sites on the surface; (2) the increase of ionic strength can compress the double layer on the surface of graphene and then increase the BPA sorption level because of the electrostatic screening effect; and (3) the ion concentration increase can facilitate the salting-out effect, which enhances the BPA sorption level.
Figure 4.
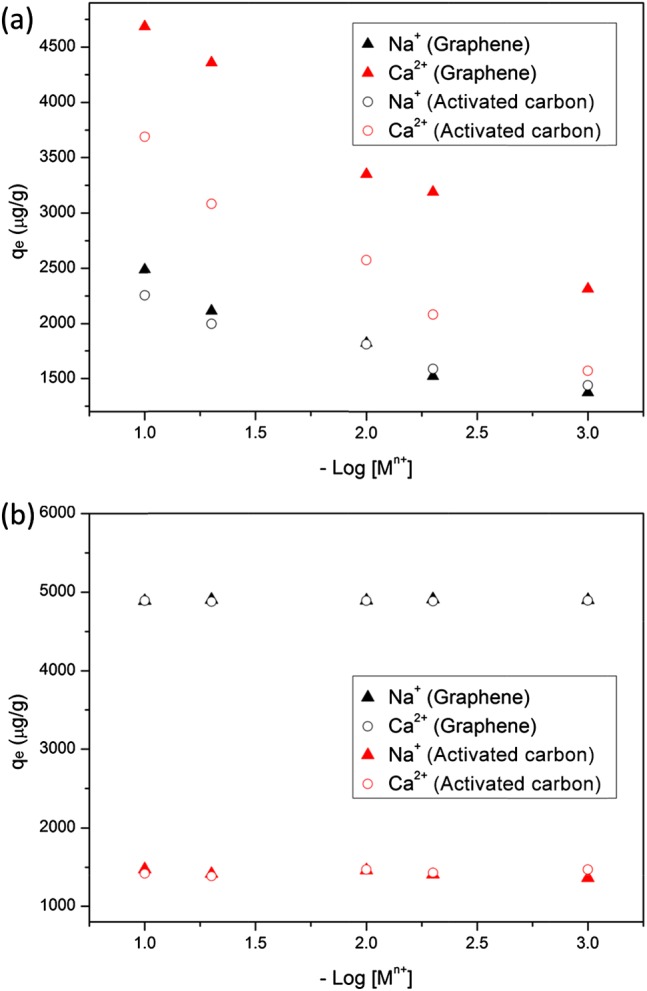
Effects of Na+ and Ca2+ concentrations on sorption behavior of (a) BPA and (b) TCS (test condition: 100 mg/L sorbent with 500 μg/L sorbate initial concentration, 4 h adsorption time) on graphene or activated carbon.
Since the graphene used in this study was reduced greatly with long-time thermal treatment and a relatively low concentration (0.1 g/L) was used, the squeezing-out effect may have little effect on the BPA sorption process. The pH used in the experiments for studying the ion effect was controlled at 7.0, at which BPA mostly exists in its neutral form. Therefore, ionic strength would have limited effects on the BPA sorption as the electrostatic interaction possessed very low percentage in the sorption mechanisms. On the other hand, the increase of ionic strength can promote the hydrophobic interaction, which may induce the increase of BPA sorption on graphene. Finally, the salting-out effect should play a dominant role in the enhancement of BPA sorption level because of the poor solubility of BPA in water. The increase of ion concentration can facilitate the attachment of BPA molecules on the surface of graphene as a high ionic concentration will reduce the solubility of BPA. A similar result was also reported by Xu et al.,2 showing a substantial increase of the BPA sorption level on graphene when NaCl concentration was increased from 0 to 0.1 M. The other phenomenon warranting attention is the stronger effects of CaCl2 than NaCl on the BPA sorption on graphene. One reason may be attributed to the higher ionic strength of CaCl2 than NaCl at the same mole, which may greatly enhance the hydrophobic interaction and salting-out effect. The other reason may be the adsorption of Ca2+ on the negatively charged functional groups on the graphene surface, which then transforms the surface charge to be positive. The positive-charged surface may increase the sorption of BPA anions (small amount at pH 7) by the electrostatic attraction. For the activated carbon, sorption levels of BPA were also elevated with the increase of NaCl and CaCl2 concentrations. Similar to the two mechanisms on graphene (electrostatic screening effect and salting-out effect), the dominant effect for the increase of BPA sorption on activated carbon will be the salting-out effect of BPA because of the limited effect of electrostatic interaction.
Figure 4b showed that the increase of NaCl and CaCl2 concentrations had no significant effect on TCS sorption on graphene or activated carbon. From the view of mechanisms, the ions may affect the sorption process by the squeezing-out effect (for graphene only), electrostatic screening effect, and salting-out effect. However, as the log Kow of TCS (4.76) is much higher than that of BPA (3.32), the hydrophobic interaction between TCS and graphene (or activated carbon) is much stronger than BPA. The sorption of TCS on graphene or activated carbon was generally controlled by the hydrophobic and π–π interactions. Thus, the ions may have limited effects on sorption because of the strong hydrophobic and π–π interactions and weak electrostatic interaction. Similar results were also reported by Behera et al.,6 showing that NaCl concentration (0.001–0.1 M) had no effect on the TCS sorption level on activated carbon.
Conclusions
The sorption behavior of BPA and TCS on graphene was studied in comparison with that on activated carbon under different conditions. The sorption kinetics demonstrated that the sorption of BPA and TCS on graphene or activated carbon reached equilibrium within several hours. The kinetic data were fitted better with the pseudo-second-order model for graphene, while fitting well with both the pseudo-first-order and pseudo-second-order models for activated carbon. The sorption isotherm showed that the maximum sorption capacities (qm) of BPA on graphene or activated carbon were almost the same. However, the linear sorption behavior indicated that TCS could be subjected to stronger sorption on graphene than on activated carbon. In addition, the sorption level was not affected by pH changes in the range of 4.0–7.0 but was substantially decreased when pH ranged from 7.0 to 9.0. A repulsive electrostatic interaction established between BPA (or TCS) anions and negatively charged surface of graphene (or activated carbon) at pH above 7.0 would be the main reason for the decrease of the sorption amount. Finally, the increase of ion (NaCl and CaCl2) concentrations led to a solid increase of BPA sorption on graphene or activated carbon because of the salting-out effect. However, the ions did not affect the sorption of TCS on the two sorbents because of the strong hydrophobic and π–π interactions which are generally not influenced by ion concentrations.
Materials and Methods
Materials
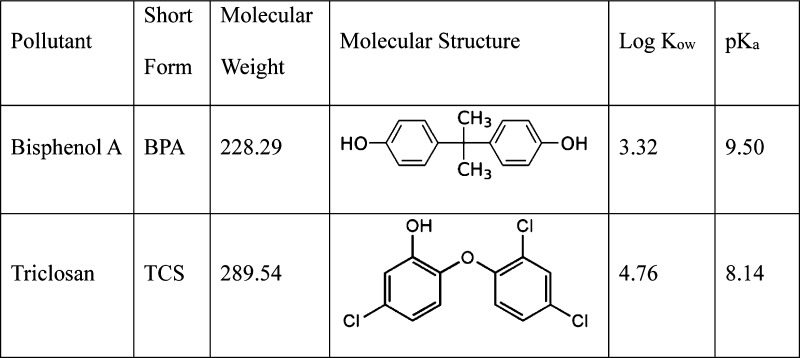
Reference standards of BPA and TCS were purchased from Sigma-Aldrich Co. (St. Louis, MO). The physical properties of BPA and TCS are summarized in Table 3. Sodium chloride, calcium chloride, and ammonium acetate (NH4Ac) were purchased from BDH Ltd. (Poole, Dorset, UK). Liquid chromatography–mass spectrometry-grade acetonitrile (ACN) and methanol were purchased from Fisher Scientific (Pittsburgh, PA). Activated carbon and formic acid (FA) were purchased from Sigma-Aldrich Co. (St. Louis, MO). The Hummer’s method was used to synthesize graphene oxide (GO) from graphite powder.20,36 The dried GO was first added into a quartz boat and put into a tubular furnace. An N2 flow (50 mL/min) was then introduced to remove air for 2 h. The temperature was increased to 250 °C within 90 min and was maintained for 30 min to transform GO to graphene.
Table 3. Physicochemical Properties of BPA and TCS.
Characterization of Sorbents
The average particle size (d50) of graphene was around 1377.5 ± 140.8 nm, which was measured by a particle size analyzer (Coulter Multisizer II, Beckman Coulter, Fullerton, CA). The surface area of graphene was measured to be 212.56 m2/g by using a surface area analyzer (Coulter SA 3100, Beckman Coulter, Fullerton, CA). The zeta-potential of graphene at pH = 7.0 ± 0.2 was around −19.98 eV by a zeta-potential analyzer (Coulter DELSA 440SX, Beckman Coulter, Fullerton, CA). The X-ray diffraction pattern of graphene was recorded by an X-ray powder diffractometer (D8 ADVANCE, Bruker, Germany) (Figure S1). The morphology of graphene was examined by scanning electron microscopy (SEM) (Hitachi S-4800 FEG SEM, Tokyo, Japan) (Figure S2) and transmission electron microscopy (TEM) (Philips Tecnai G220 S-TWIN, Amsterdam, The Netherlands) (Figure S3).
Sorption Experiments
All sorption experiments were conducted in 10 mL polypropylene centrifuge tubes containing 1 mg of graphene (or activated carbon) and 10 mL of solution with varying BPA or TCS concentrations. The tubes were shaken at 150 rpm and kept at 25 °C for appropriate time. BPA and TCS were dissolved in methanol as stock solutions (500 mg/L) because of their low solubility in water. In the batch tests, the stock solutions were diluted with water to reach the designed concentrations. In the kinetic experiments, the initial concentrations of BPA and TCS were controlled at 500 μg/L (pH = 6.8 ± 0.2), and the concentrations of BPA and TCS in liquid phase were determined at different time intervals from 5 to 480 min. The sorption isotherm experiments were conducted with BPA or TCS concentration from 25 to 1000 μg/L (pH = 6.7 ± 0.3). The initial concentrations of BPA and TCS during the studies of pH and ionic effects were set at 500 μg/L. The pH values were adjusted by 0.1 M HCl and 0.1 M NaOH solutions to the desired value, ranging from 5.0 to 9.0. Experimental ionic concentrations (0.001–0.1 M) were controlled by adding 1 M stock solutions of NaCl(aq) and CaCl2(aq). After sorption, each sample was centrifuged before the suspension was filtrated through a 0.2 μm membrane filter (Maidstone, UK). All of the experiments were conducted in three replicates, and the average values are reported here.
BPA and TCS Determination
BPA and TCS concentrations were determined by Waters Acquity ultraperformance liquid chromatography (UPLC) equipped with a 50 × 2.1 mm Waters BEH C18 column (1.7 μm particle size) and tandem quadrupole mass spectrometers (Milford, MA). The mobile phases for BPA determination consisted of water (A) and ACN with 1 mM NH4Ac (B). The mobile phase flow rate was 0.4 mL/min, and the following gradient was used: 80% B ramped to 100% B in 1.5 min, kept for 2 min retention, followed by a change back to 80% B in 2 min. For TCS, the mobile phases consisting of 0.01% FA in methanol/water (95/5) (A) and 0.01% FA in water/methanol (95/5) (B) were employed. At a flow rate of 0.4 mL/min, the mobile-phase gradient was ramped from 5 to 95% (A) in 6.2 min, then to 100% (A) in 0.8 min, and finally ramped down to initial conditions in 8 min. Both desolvation and cone gas were nitrogen gas and set at 600 and 50 L/h, respectively. The desolvation and source temperatures were set at 400 and 120 °C, respectively. Argon was selected as the collision gas, and the pressure in the collision room was controlled at 3.0 × 10⁻³ mbar. The capillary voltage used was 0.5 kV, whereas the dwell time was set to 0.1 s. Multiple-reaction-monitoring modes were used, and the data collection was monitored by MassLynx 4.1 software. The mass parameters used for BPA and TCS quantifications were summarized in Table 4.
Table 4. Optimized UPLC/MS/MS Parameters for BPA and TCS.
| pollutant | parent ion (m/z) | daughter ion (m/z) | electrospray ionization | cone voltage (V) | collision energy (eV) | dwell time (s) |
|---|---|---|---|---|---|---|
| BPA | 227.1 | 212.1 | 45 | 18 | 0.1 | |
| TCS | 286.7 | 34.8 | 20 | 20 | 0.1 |
Acknowledgments
This research was supported by the Collaborative Research Fund (project no. C7044-14G) of Hong Kong SAR, the National Natural Science Foundation of China (project no. 41503087), and the Research Fund Program of Guangdong Provincial Key Laboratory of Environmental Pollution Control and Remediation Technology.
Supporting Information Available
The Supporting Information is available free of charge on the ACS Publications website at DOI: 10.1021/acsomega.7b00616.
X-ray diffraction pattern of GO and graphene; SEM image of graphene; TEM image of graphene; adsorption–desorption isotherm of graphene; and Barrett–Joyner–Halenda pore distribution of graphene (PDF)
The authors declare no competing financial interest.
Supplementary Material
References
- Katsigiannis A.; Noutsopoulos C.; Mantziaras J.; Gioldasi M. Removal of emerging pollutants through granular activated carbon. Chem. Eng. J. 2015, 280, 49–57. 10.1016/j.cej.2015.05.109. [DOI] [Google Scholar]
- Xu J.; Wang L.; Zhu Y. Decontamination of bisphenol A from aqueous solution by graphene adsorption. Langmuir 2012, 28, 8418–8425. 10.1021/la301476p. [DOI] [PubMed] [Google Scholar]
- Lee S.; Liao C.; Song G.-J.; Ra K.; Kannan K.; Moon H.-B. Emission of bisphenol analogues including bisphenol A and bisphenol F from wastewater treatment plants in Korea. Chemosphere 2015, 119, 1000–1006. 10.1016/j.chemosphere.2014.09.011. [DOI] [PubMed] [Google Scholar]
- Careghini A.; Mastorgio A. F.; Saponaro S.; Sezenna E. Bisphenol A, nonylphenols, benzophenones, and benzotriazoles in soils, groundwater, surface water, sediments, and food: a review. Environ. Sci. Pollut. Res. 2015, 22, 5711–5741. 10.1007/s11356-014-3974-5. [DOI] [PMC free article] [PubMed] [Google Scholar]
- Lane R. F.; Adams C. D.; Randtke S. J.; Carter R. E. Chlorination and chloramination of bisphenol A, bisphenol F, and bisphenol A diglycidyl ether in drinking water. Water Res. 2015, 79, 68–78. 10.1016/j.watres.2015.04.014. [DOI] [PubMed] [Google Scholar]
- Behera S. K.; Oh S.-Y.; Park H.-S. Sorption of triclosan onto activated carbon, kaolinite and montmorillonite: Effects of pH, ionic strength, and humic acid. J. Hazard. Mater. 2010, 179, 684–691. 10.1016/j.jhazmat.2010.03.056. [DOI] [PubMed] [Google Scholar]
- Fiss E. M.; Rule K. L.; Vikesland P. J. Formation of chloroform and other chlorinated byproducts by chlorination of triclosan-containing antibacterial products. Environ. Sci. Technol. 2007, 41, 2387–2394. 10.1021/es062227l. [DOI] [PubMed] [Google Scholar]
- Levy C. W.; Roujeinikova A.; Sedelnikova S.; Baker P. J.; Stuitje A. R.; Slabas A. R.; Rice D. W.; Rafferty J. B. Molecular basis of triclosan activity. Nature 1999, 398, 383–384. 10.1038/18803. [DOI] [PubMed] [Google Scholar]
- de García S. A. O.; Pinto G. P.; García-Encina P. A.; Irusta-Mata R. Ecotoxicity and environmental risk assessment of pharmaceuticals and personal care products in aquatic environments and wastewater treatment plants. Ecotoxicology 2014, 23, 1517–1533. 10.1007/s10646-014-1293-8. [DOI] [PubMed] [Google Scholar]
- Buth J. M.; Steen P. O.; Sueper C.; Blumentritt D.; Vikesland P. J.; Arnold W. A.; McNeill K. Dioxin photoproducts of triclosan and its chlorinated derivatives in sediment cores. Environ. Sci. Technol. 2010, 44, 4545–4551. 10.1021/es1001105. [DOI] [PubMed] [Google Scholar]
- Novoselov K. S.; Geim A. K.; Morozov S. V.; Jiang D.; Zhang Y.; Dubonos S. V.; Grigorieva I. V.; Firsov A. A. Electric field effect in atomically thin carbon films. Science 2004, 306, 666–669. 10.1126/science.1102896. [DOI] [PubMed] [Google Scholar]
- Meyer J. C.; Geim A. K.; Katsnelson M. I.; Novoselov K. S.; Booth T. J.; Roth S. The structure of suspended graphene sheets. Nature 2007, 446, 60–63. 10.1038/nature05545. [DOI] [PubMed] [Google Scholar]
- Lee C.; Wei X.; Kysar J. W.; Hone J. Measurement of the elastic properties and intrinsic strength of monolayer graphene. Science 2008, 321, 385–388. 10.1126/science.1157996. [DOI] [PubMed] [Google Scholar]
- Latil S.; Henrard L. Charge carriers in few-layer graphene films. Phys. Rev. Lett. 2006, 97, 036803. 10.1103/physrevlett.97.036803. [DOI] [PubMed] [Google Scholar]
- Balandin A. A.; Ghosh S.; Bao W.; Calizo I.; Teweldebrhan D.; Miao F.; Lau C. N. Superior thermal conductivity of single-layer graphene. Nano Lett. 2008, 8, 902–907. 10.1021/nl0731872. [DOI] [PubMed] [Google Scholar]
- Boateng L. K.; Heo J.; Flora J. R. V.; Park Y.-G.; Yoon Y. Molecular level simulation of the adsorption of bisphenol A and 17α-ethinyl estradiol onto carbon nanomaterials. Sep. Purif. Technol. 2013, 116, 471–478. 10.1016/j.seppur.2013.06.028. [DOI] [Google Scholar]
- Liu L.; Feng T.; Wang C.; Wu Q.; Wang Z. Magnetic three-dimensional graphene nanoparticles for the preconcentration of endocrine-disrupting phenols. Microchim. Acta 2014, 181, 1249–1255. 10.1007/s00604-014-1234-5. [DOI] [Google Scholar]
- Stoller M. D.; Park S.; Zhu Y.; An J.; Ruoff R. S. Graphene-based ultracapacitors. Nano Lett. 2008, 8, 3498–3502. 10.1021/nl802558y. [DOI] [PubMed] [Google Scholar]
- Wang X.; Zhi L.; Müllen K. Transparent, conductive graphene electrodes for dye-sensitized solar cells. Nano Lett. 2008, 8, 323–327. 10.1021/nl072838r. [DOI] [PubMed] [Google Scholar]
- Peng W.; Li X. Synthesis of a sulfur-graphene composite as an enhanced metal-free photocatalyst. Nano Res. 2013, 6, 286–292. 10.1007/s12274-013-0306-x. [DOI] [Google Scholar]
- Peng W.-C.; Wang X.; Li X.-Y. The synergetic effect of MoS2 and graphene on Ag3PO4 for its ultra-enhanced photocatalytic activity in phenol degradation under visible light. Nanoscale 2014, 6, 8311–8317. 10.1039/c4nr01654h. [DOI] [PubMed] [Google Scholar]
- Ang P. K.; Chen W.; Wee A. T. S.; Loh K. P. Solution-gated epitaxial graphene as pH sensor. J. Am. Chem. Soc. 2008, 130, 14392–14393. 10.1021/ja805090z. [DOI] [PubMed] [Google Scholar]
- Deng X.; Lu L.; Li H.; Luo F. The adsorption properties of Pb(II) and Cd(II) on functionalized graphene prepared by electrolysis method. J. Hazard. Mater. 2010, 183, 923–930. 10.1016/j.jhazmat.2010.07.117. [DOI] [PubMed] [Google Scholar]
- Zhu J.; Wei S.; Gu H.; Rapole S. B.; Wang Q.; Luo Z.; Haldolaarachchige N.; Young D. P.; Guo Z. One-pot synthesis of magnetic graphene nanocomposites decorated with Core@Double-shell nanoparticles for fast chromium removal. Environ. Sci. Technol. 2012, 46, 977–985. 10.1021/es2014133. [DOI] [PubMed] [Google Scholar]
- Tan P.; Sun J.; Hu Y.; Fang Z.; Bi Q.; Chen Y.; Cheng J. Adsorption of Cu2+, Cd2+ and Ni2+ from aqueous single metal solutions on graphene oxide membranes. J. Hazard. Mater. 2015, 297, 251–260. 10.1016/j.jhazmat.2015.04.068. [DOI] [PubMed] [Google Scholar]
- Ramesha G. K.; Kumara A. V.; Muralidhara H. B.; Sampath S. Graphene and graphene oxide as effective adsorbents toward anionic and cationic dyes. J. Colloid Interface Sci. 2011, 361, 270–277. 10.1016/j.jcis.2011.05.050. [DOI] [PubMed] [Google Scholar]
- Liu T.; Li Y.; Du Q.; Sun J.; Jiao Y.; Yang G.; Wang Z.; Xia Y.; Zhang W.; Wang K.; Zhu H.; Wu D. Adsorption of methylene blue from aqueous solution by graphene. Colloids Surf., B 2012, 90, 197–203. 10.1016/j.colsurfb.2011.10.019. [DOI] [PubMed] [Google Scholar]
- Moradi O.; Gupta V. K.; Agarwal S.; Tyagi I.; Asif M.; Makhlouf A. S. H.; Sadegh H.; Shahryari-ghoshekandi R. Characteristics and electrical conductivity of graphene and graphene oxide for adsorption of cationic dyes from liquids: Kinetic and thermodynamic study. J. Ind. Eng. Chem. 2015, 28, 294–301. 10.1016/j.jiec.2015.03.005. [DOI] [Google Scholar]
- Cai X.; Tan S.; Lin M.; Xie A.; Mai W.; Zhang X.; Lin Z.; Wu T.; Liu Y. Synergistic antibacterial brilliant blue/reduced graphene oxide/quaternary phosphonium salt composite with excellent water solubility and specific targeting capability. Langmuir 2011, 27, 7828–7835. 10.1021/la201499s. [DOI] [PubMed] [Google Scholar]
- Ho Y. S.; McKay G. Pseudo-second order model for sorption processes. Process Biochem. 1999, 34, 451–465. 10.1016/s0032-9592(98)00112-5. [DOI] [Google Scholar]
- Chiou M. S.; Li H. Y. Adsorption behavior of reactive dye in aqueous solution on chemical cross-linked chitosan beads. Chemosphere 2003, 50, 1095–1105. 10.1016/s0045-6535(02)00636-7. [DOI] [PubMed] [Google Scholar]
- Jung C.; Park J.; Lim K. H.; Park S.; Heo J.; Her N.; Oh J.; Yun S.; Yoon Y. Adsorption of selected endocrine disrupting compounds and pharmaceuticals on activated biochars. J. Hazard. Mater. 2013, 263, 702–710. 10.1016/j.jhazmat.2013.10.033. [DOI] [PubMed] [Google Scholar]
- Freundlich H.Colloid & Capillary Chemistry; E.P. Dutton & Company; (translated from German by Hatfield H.S.): New York, 1922; p 838. [Google Scholar]
- Langmuir I. The adsorption of gases on plane surfaces of glass, mica and platinum. J. Am. Chem. Soc. 1918, 40, 1361–1403. 10.1021/ja02242a004. [DOI] [Google Scholar]
- Chen J.; Chen W.; Zhu D. Adsorption of nonionic aromatic compounds to single-walled carbon nanotubes: Effects of aqueous solution chemistry. Environ. Sci. Technol. 2008, 42, 7225–7230. 10.1021/es801412j. [DOI] [PubMed] [Google Scholar]
- Hummers W. S. Jr.; Offeman R. E. Preparation of graphitic oxide. J. Am. Chem. Soc. 1958, 80, 1339. 10.1021/ja01539a017. [DOI] [Google Scholar]
Associated Data
This section collects any data citations, data availability statements, or supplementary materials included in this article.


