Abstract
Bovine and human insulin have similar primary structures. In this article, the region of the insulin A-chain of bovine and human insulin where the amino acid composition is different was studied. Bovine insulin fragment (BIF) and human insulin fragment (HIF) were synthesized in solid-phase peptide synthesis. The effects of pH, temperature, urea, ionic strength, and stirring on the formation of fibrils were studied using a fractional factorial resolution III experimental design. Fibrillation was monitored by fluorescence and infrared spectroscopy and optical microscopy. Both fragments formed fibrils at pH 1.6 and a temperature of 60 °C. The lag time and apparent aggregation growth rate constant were determined using a two-parameter kinetic model. It was found that the bovine insulin fragment has a shorter lag time than the human insulin one, whereas the exponential phase rate was faster for HIF than for BIF. An increase in β-sheets content with time was observed in both fragments. The increase in β-sheets was preceded by an initial decrease in α-helices followed by an intermediate increase during the transition from the lag phase to elongation phase. Temperature and ionic strength are among the most important experimental factors during the lag phase, whereas ionic strength is replaced by pH during the elongation phase for both the fragments. Congo red binding confirmed the presence of ringlike oligomer structures rich in antiparallel β-sheets, which tend to form fibrils rich in parallel β-sheets.
Introduction
Protein aggregation is a major problem found in the bioprocessing industry. Aggregation can occur at any step, from production to purification and packing.1 Protein therapeutics might lose their biological activity and cause problems during treatment if they aggregate. Proteins can form aggregates both in their native and denatured state. They can aggregate either during the lyophilization step or during their long-term storage. Aggregation also happens during the unfolding/refolding reaction in the production of recombinant proteins.
Protein aggregation in vivo is associated with disease. Formation of amyloid fibrils is the manifestation of various amyloidogenic diseases like Alzheimer’s, neurofibrillary tangle, neurodegeneration, Parkinson’s, etc. A total of 36 proteins/peptides has been identified to form amyloid fibrils in vivo till 2016.2 Amyloid fibrils are β-sheet rich linear aggregates formed from circular oligomers. X-ray diffraction of amyloid fibrils shows a cross β diffraction pattern, which is a trademark of intermolecular β-sheet structures.3−6 This intermolecular β-sheet structure is easily identified by Fourier transform infrared spectroscopy (FTIR). It has been recently proved that oligomers are the elemental blocks to build a fibril.7,8 The propensity to form amyloid fibrils seems to be correlated with the hydrophobicity of proteins.9 In spite of their association with disease, amyloid aggregates can also be used as scaffolds, as peptide hormones storage and natural adhesives.10
Although amyloid fibrils are mostly related to disease causing proteins, it was also reported that if appropriate incubation conditions were provided even a nonpathogenic protein can form a fibrillar structure.11 Fibrils can also be synthesized in vitro by subjecting the protein to favorable destabilizing conditions.12,13 For example, hen lysozyme incubated at pH 2.0 and 37 °C forms fibrils.14
Insulin aggregates at acidic pH and high temperature.15 Insulin is a highly conserved hormone exhibiting minor differences in the amino acid sequence from species to species. For instance, Ala replaces Thr at position 8, Val replaces Ile at position 10, and Ala replaces Thr at position 30 in bovine and human insulins, respectively.16 Our previous studies showed that the aggregation kinetics (both lag times and rate constants) is very different for bovine and human insulin.17 Moreover, dynamic light scattering and FTIR experiments showed that both insulins seem to follow different aggregation pathways as shown by different populations of aggregate sizes and different secondary structure changes. Still, mature fibrils were practically identical. Previously, it was demonstrated that the B chain fragment LVEALYL plays a key role in aggregation.18 A recent review shows that different insulin analogs show different aggregation pathways.19 In an attempt to identify the causes for those differences in the aggregation kinetics, we decided to study fragments of the insulin A-chain containing the sequence where bovine and human insulins are different.16 Insulin A-chain is a 21-residue peptide, in which only the amino acids at positions 8 and 10 differ for bovine and human insulins.20 Bovine insulin has alanine and valine at positions 8 and 10, whereas human insulin has threonine and isoleucine. We selected the sequences ASVCSLYQLENK3 (bovine insulin fragment (BIF)) and TSICSLYQLENK3 (human insulin fragment (HIF)) for the bovine and human fragments, respectively. Bold letters identify the amino acids that are different in both fragments. A lysine tail was added to each fragment to increase its solubility.21
To study the effects of temperature, urea, ionic strength, pH, and stirring on the fibrillation process, a screening experimental design was chosen. The factors were chosen based on the following criteria. Temperature affects protein folding and therefore the formation of the nuclei. Urea, a known chaotropic, was chosen to study the effect of water structure on fibril formation. Ionic strength and pH affect coulombic interactions among the side chains of amino acids, which affects fibrillation. Interfaces (solid/liquid or gas/liquid) induce protein aggregation. Air was incorporated into samples by stirring to study the effect of gas/liquid interfaces on fibrillation. The evolution of the aggregation process with time was monitored using a thioflavin T (ThT) fluorescence assay. Secondary structure changes were monitored using attenuated total reflection (ATR)-FTIR spectroscopy. The presence of Congo red stained fibrils22 was confirmed by light microscopy.
pH, temperature, urea, ionic strength and stirring were chosen as factors for the experimental design. A two-level fractional factorial design FF0508 of resolution III as shown in Table 1 consisting of five factors at two levels each with a total of 8 runs was chosen. Each main effect in this design was confounded with one or more two-factor interactions. The lower and higher levels chosen for the factors are shown in Table 2.
Table 1. Experimental Design FF0508.
| run | pH | temp. (°C) | urea (M) | ionic (M) | stirring |
|---|---|---|---|---|---|
| 1 | – | – | – | – | + |
| 2 | – | – | + | + | – |
| 3 | – | + | – | + | – |
| 4 | – | + | + | – | + |
| 5 | + | – | – | + | + |
| 6 | + | – | + | – | – |
| 7 | + | + | – | – | – |
| 8 | + | + | + | + | + |
Table 2. Experimental Factors with Lower and Higher levels.
| factor | – | + |
|---|---|---|
| pH | 1.6 | 5 |
| temperature (°C) | 25 | 60 |
| urea (M) | 0 | 1 |
| ionic strength (M) | 0.02 | 1 |
| stirring | off | on |
Results and Discussion
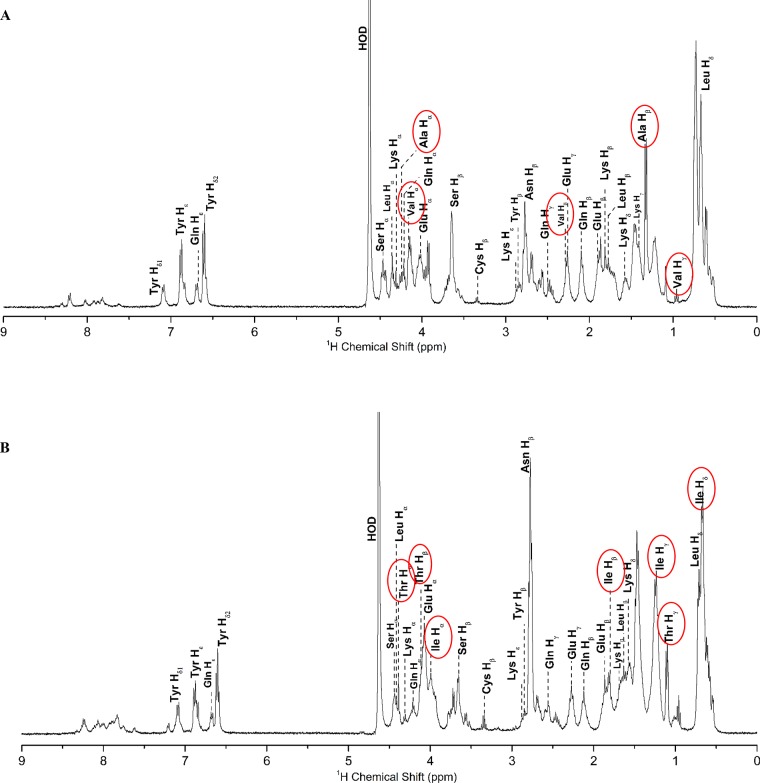
The amino acid composition of both BIF and HIF was determined using 1H NMR spectroscopy. 1H resonance assignments for each amino acid were done based on its corresponding proton chemical shifts. All of the data related to proton chemical shifts were obtained from the Biological Magnetic Resonance Data Bank.23Figure 1A,B shows the full 1H NMR spectra for BIF and HIF, respectively, with their corresponding amino acid resonance assignments for various protons. Both spectra look similar with a few minor differences in the peaks at the backbone and the sidechain regions. Figure 1A has peaks at 4.25, 1.35, 4.17, and 2.28 ppm, which correspond to Ala Hα, Ala Hβ, Val Hα, and Val Hβ and seen only in BIF. Similarly, Figure 1B has peaks at 4.38, 4.11, 3.99, and 1.78 ppm, which correspond to Thr Hα, Thr Hβ, Ile Hα, and Ile Hβ, respectively, and seen in only HIF. Peaks assigned to rest of the amino acids are same in both the fragments (Tables S1 and S2).
Figure 1.
(A) 1H NMR spectrum of the peptide fragments in their native state at 25 °C. Full 1H NMR spectrum of BIF highlighting the chemical shifts corresponding to alanine and valine. (B) 1H NMR spectrum of the peptide fragments in their native state at 25 °C. Full 1H NMR spectrum of HIF highlighting the chemical shifts corresponding to threonine and isoleucine.
The purity and mass of both peptide fragments were calculated from the liquid chromatography–mass spectrometry (LC–MS) data obtained using a quadrupole time-of-flight (Q-TOF) LC–MS system. Figures S11 and S12 show the relative abundance and mass for native BIF and HIF, respectively. The purity of the samples was calculated based on the relative abundance of each fraction. BIF full intact peptide (one to three lysines at the tail) has a purity of 72%. The major impurity found in both peptides is a fluorenylmethyloxycarbonyl chloride (Fmoc) group (mass of 164 Da) due to an inefficient final deprotection step. Fmoc-attached peptide (impurity) is ∼28% in BIF, whereas it is ∼66% in HIF (53% Fmoc full peptide plus 13% Fmoc with no Thr). Since the peptides were used without further purification, it is important to determine the composition of the fibrils obtained in the experiment using LC–MS to estimate the effect of the impurity on fibrillation. Four samples, one with high β-sheet content (pH 1.6, 60 °C, 1 M urea, 0.02 M NaCl) and the other with low β-sheet content (pH 5, 25 °C, 1 M urea, 0.02 M NaCl) for both BIF and HIF, were chosen for this analysis. Aggregates formed at pH 5 and 25 °C in both the fragments consist of 93% Fmoc (BIF)- and 100% HIF-attached peptide in abundance, as shown in Figures S13B and S14B, whereas at pH 1.6 and 60 °C, fibrils in BIF consist of equal amounts of native and Fmoc-attached peptide, but HIF fibrils are made of 74% Fmoc HIF, 22% truncated Fmoc HIF, and only 4% HIF (Figures S13A and S14A). Finally, both BIF and HIF at pH 1.6 and 60 °C show deamidation of Asn to Asp, but this is not observed at pH 5 and 25 °C. Deamidation is favored by low pH and high temperature. It is not clear if deamidation occurred before, during or after the formation of the aggregates. Deamidation may occur by acid/base catalysis as well as by intramolecular nucleophilic catalysis.
One commonly used mechanism to explain fibril formation consists of three phases: (1) nucleation/lag, (2) elongation/exponential growth, and (3) equilibrium/precipitation.24 The process begins with a lag phase where there is no significant change in the soluble peptide concentration. Nuclei/oligomer structures are formed by partly denatured peptides.25,26 The lag phase is followed by an elongation or the exponential growth phase where the size of the fibrils increases by addition of preformed oligomer structures to protofilaments.27,28 Finally, it reaches an equilibrium/precipitation phase where most of the soluble peptide have been converted into fibrils. The process of fibril formation was studied using ThT fluorescence assay, and the changes in the secondary structure were simultaneously determined using ATR-FTIR. ThT bound to amyloid-like fibrils shows a strong fluorescent signal.29 ThT dye does not bind to either soluble peptides or to amorphous aggregates.30 ThT-induced spectral changes for various amyloidogenic proteins are qualitatively identical irrespective of the primary structure, this feature is important when comparing two slightly different peptides (Table 1 and 2).31
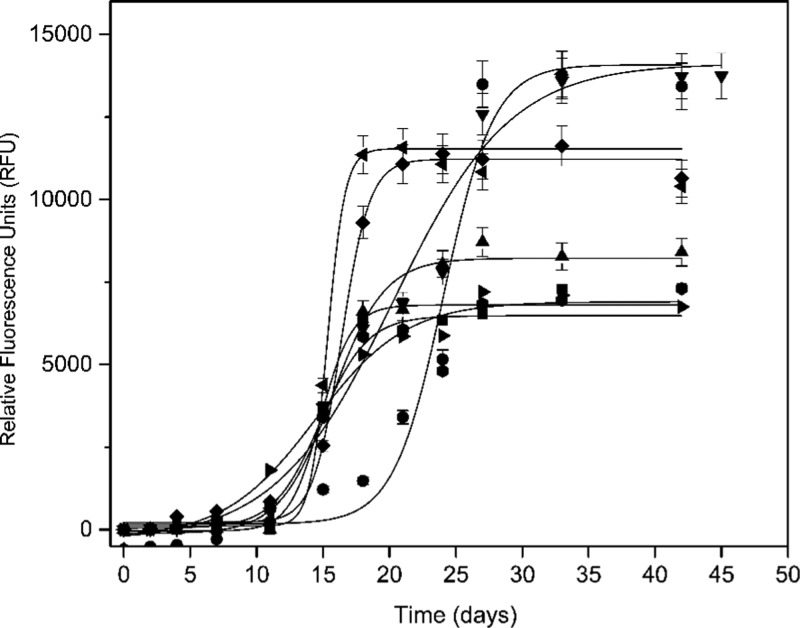
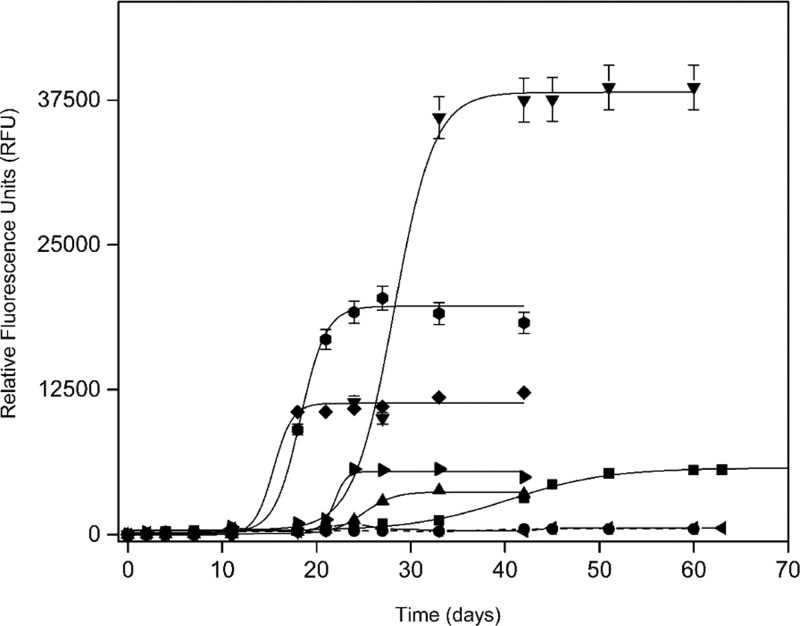
Figures 2 and 3 show relative fluorescence versus time at all experimental conditions for BIF and HIF, respectively. Representative error bars are included in both figures. Most curves show a characteristic sigmoidal shape consisting of three regions: a lag phase, an exponential phase, and an equilibrium phase. Therefore, the kinetics of fibril formation can be characterized by a lag time (tlag) and an apparent aggregation growth rate constant (Kapp). The obtained sigmoidal curves for each run were curve fitted using nonlinear curve fit in Origin Pro data analysis software to determine tlag and Kapp by32
| 1 |
where y is the fluorescence intensity for the normalized data, x is the time in days, x0 is the time at 50% fluorescence intensity, and dx is the time constant. From eq 1 the lag time (tlag) and apparent aggregation growth rate constant (Kapp) can be calculated using tlag = (x0 – 2dx) and Kapp = 1/dx. The calculated lag time (tlag) and apparent aggregation growth rate constants (Kapp) for both BIF and HIF are shown in Table 3. All of the runs for BIF formed fibrils, whereas two of the eight runs for HIF (pH 1.6, 25 °C, 1 M urea, 1 M NaCl; pH 5, 25 °C, 1 M urea, 0.02 M NaCl) are still in the lag phase after 8 weeks. This finding suggests that HIF does not form nuclei at room temperature in the presence of urea irrespective of the other conditions. In contrast, HIF at room temperature in the absence of urea (pH 1.6, 25 °C, 0 M urea, 0.02 M NaCl; pH 5, 25 °C, 0 M urea, 1 M NaCl) forms fibrils.
Figure 2.
ThT fluorescence plots showing the fibril formation process with time for BIF at pH 1.6, 25 °C, 0 M urea, 0.02 M NaCl (−■−); pH 1.6, 25 °C, 1 M urea, 1 M NaCl (−●−); pH 1.6, 60 °C, 0 M urea, 1 M NaCl (−▲−); pH 1.6, 60 °C, 1 M urea, 0.02 M NaCl (−▼−); pH 5, 25 °C, 0 M urea, 1 M NaCl (−⧫−); pH 5, 25 °C, 1 M urea, 0.02 M NaCl (−◀−); pH 5, 60 °C, 0 M urea, 0.02 M NaCl (−▶−); pH 5, 60 °C, 1 M urea, 1 M NaCl (−⬢−).
Figure 3.
ThT fluorescence plots showing the fibril formation process with time for HIF at pH 1.6, 25 °C, 0 M urea, 0.02 M NaCl (−■−); pH 1.6, 25 °C, 1 M urea, 1 M NaCl (−●−); pH 1.6, 60 °C, 0 M urea, 1 M NaCl (−▲−); pH 1.6, 60 °C, 1 M urea, 0.02 M NaCl (−▼−); pH 5, 25°C, 0 M urea, 1 M NaCl (−⧫−); pH 5, 25 °C, 1 M urea, 0.02 M NaCl (−◀−); pH 5, 60 °C, 0 M urea, 0.02 M NaCl (−▶−); pH 5, 60 °C 1 M urea, 1 M NaCl (−⬢−).
Table 3. Lag Times (tlag) and Apparent Aggregation Growth Rate Constants (Kapp) Calculated for Both BIF and HIF.
| bovine |
human |
|||
|---|---|---|---|---|
| run # | tlag (days) | Kapp (day–1) | tlag (days) | Kapp (day–1) |
| 1 | 12 ± 1 | 0.85 ± 0.37 | 30 ± 2 | 0.18 ± 0.02 |
| 2 | 16 ± 1 | 0.53 ± 0.16 | ||
| 3 | 12 ± 1 | 0.51 ± 0.10 | 22 ± 1 | 0.62 ± 0.07 |
| 4 | 11 ± 2 | 0.22 ± 0.05 | 24 ± 2 | 0.47 ± 0.16 |
| 5 | 14 ± 1 | 0.94 ± 0.13 | 13 ± 2 | 0.99 ± 0.63 |
| 6 | 14 ± 2 | 1.51 ± 0.15 | ||
| 7 | 7 ± 1 | 0.29 ± 0.04 | 20 ± 1 | 0.70 ± 0.17 |
| 8 | 11 ± 2 | 0.57 ± 0.22 | 15 ± 1 | 0.73 ± 0.18 |
BIF has shorter lag times than HIF under all incubation conditions. The lag times are shorter at higher temperatures under all conditions for both BIF and HIF. This dependence on temperature was also observed in native bovine and human insulins.17 Though the lag times are shorter for BIF than HIF (at the same conditions), the rate of aggregation is faster for HIF than BIF except for run #1 (Table 1). The lag time is the shortest for BIF at pH 5, 60 °C, no urea, 0.02 M NaCl (7 ± 1 days) and it is the longest for BIF at pH 1.6, 25 °C, 1 M urea, 1 M NaCl (16 ± 1 days). For HIF, lag time is the shortest at pH 5, 25 °C, 0 M urea, 1 M NaCl (13 ± 2 days), whereas it is the longest at pH 1.6, 25 °C, 0 M urea, 0.02 M NaCl (30 ± 2 days). At 1 M urea and 0.02 M NaCl, samples at the lowest pH and highest temperature (BIF and HIF at pH 1.6, 60 °C) have a shorter lag time than samples at the highest pH and lowest temperature (BIF and HIF at pH 5, 25 °C).
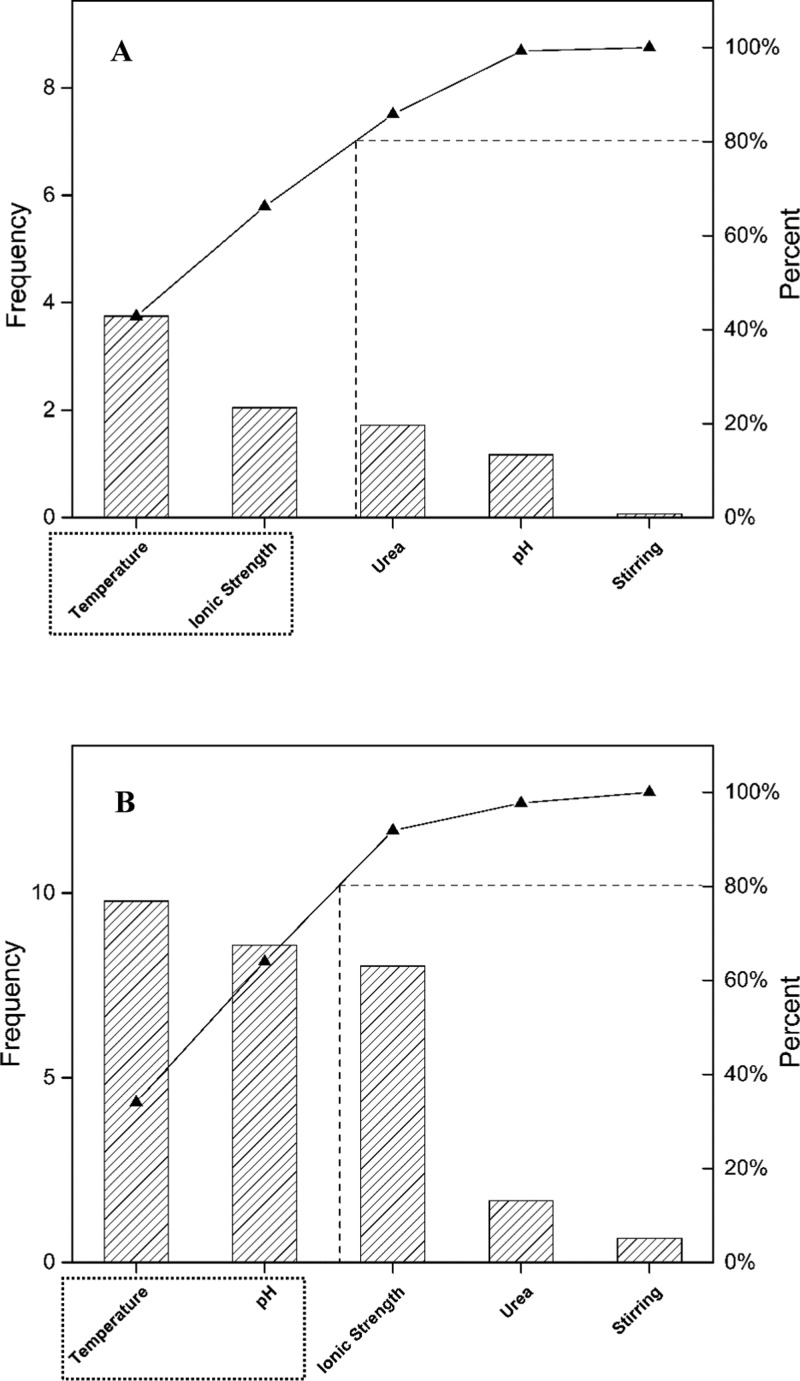
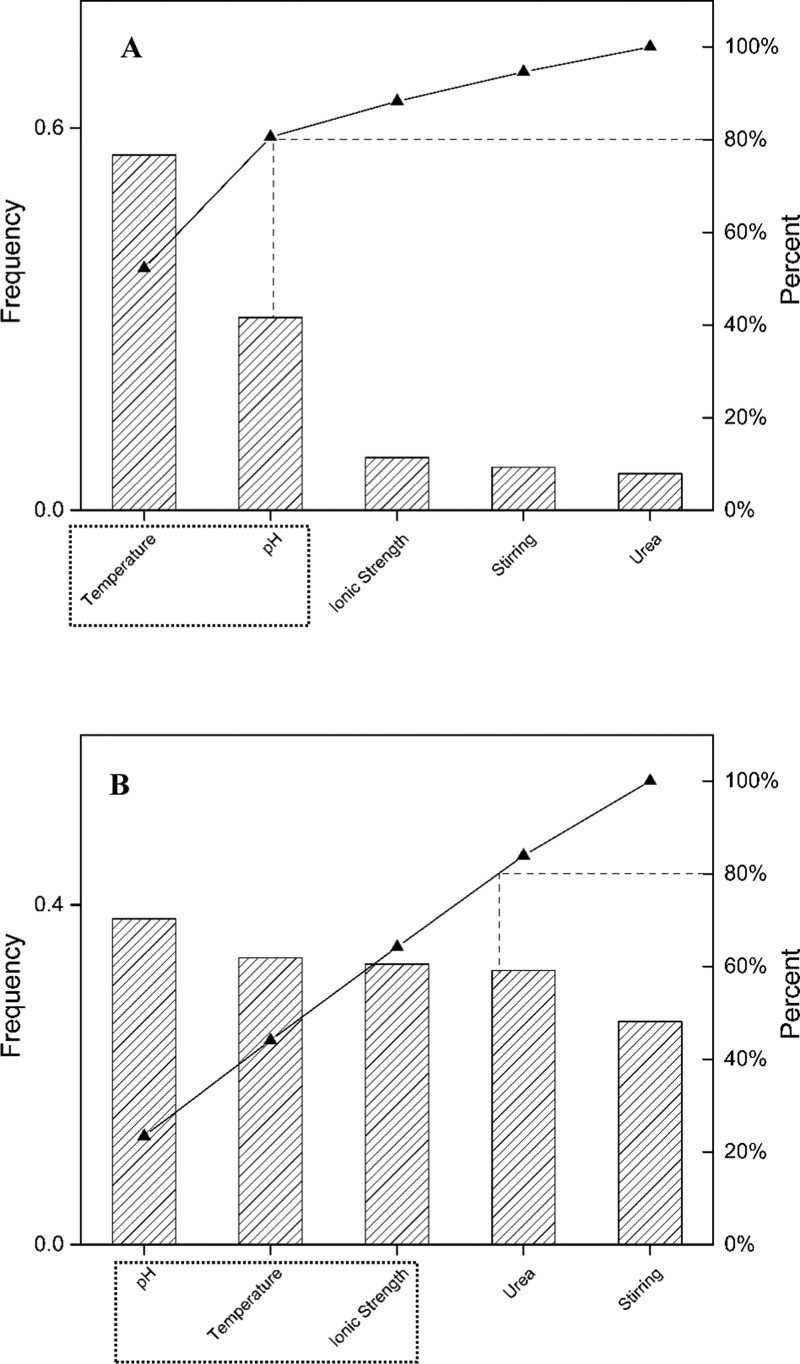
Pareto charts using tlag or Kapp as an outcome are shown in Figures 4 and 5, respectively. The important factors using each outcome were identified using the Pareto principle.33 The important factors during lag phase are temperature, ionic strength, and urea for BIF, whereas for HIF, temperature, pH, and ionic strength are significant. Although all of the factors seem to be important during the elongation phase for HIF, temperature and pH are the most important ones, which is also true for BIF. The pH is of importance during elongation phase as it affects the interactions among the side chains of amino acids leading to the formation of fibrils. The presence of gas/liquid interfaces has a negligible effect on fibrillation.
Figure 4.
Pareto charts showing the effects of various factors based on tlag as an outcome from the experimental design FF0508 for (A) BIF and (B) HIF. Prominent factors are highlighted using the dotted line.
Figure 5.
Pareto charts showing the effects of various factors based on Kapp as an outcome from the experimental design FF0508 for (A) BIF and (B) HIF. Prominent factors are highlighted using the dotted line.
Exposure of hydrophobic surfaces to water plays an important role in the formation of fibrils.34 Hydrophobicity of each amino acid residue can be assigned from the native structure according to the hydrophobicity scales of Kyte and Doolittle in the UCSF Chimera package.35,36 The native peptide structures were generated using a web server PEP-FOLD3.37 The structures shown in Figure 6A,B correspond to BIF and HIF. Models were visualized using the UCSF Chimera package.36 The residues in each peptide are shown in various colors according to their hydrophobicity. Colors range from blue for the most hydrophilic to white (neutral) to orange for the most hydrophobic. BIF has alanine and valine, which are replaced by threonine and isoleucine in HIF at their respective positions. Comparing the hydrophobicity indexes, alanine (47), valine (79), and isoleucine (99) are very hydrophobic amino acids at both acidic and basic pHs compared to threonine, which is a neutral amino acid (13).38 The presence of an extra hydrophobic residue for BIF over HIF could be the reason for shorter lag times observed with BIF. However, BIF shows a slower growth rate than HIF. This suggests that the nuclei of both peptides are structurally different.
Figure 6.
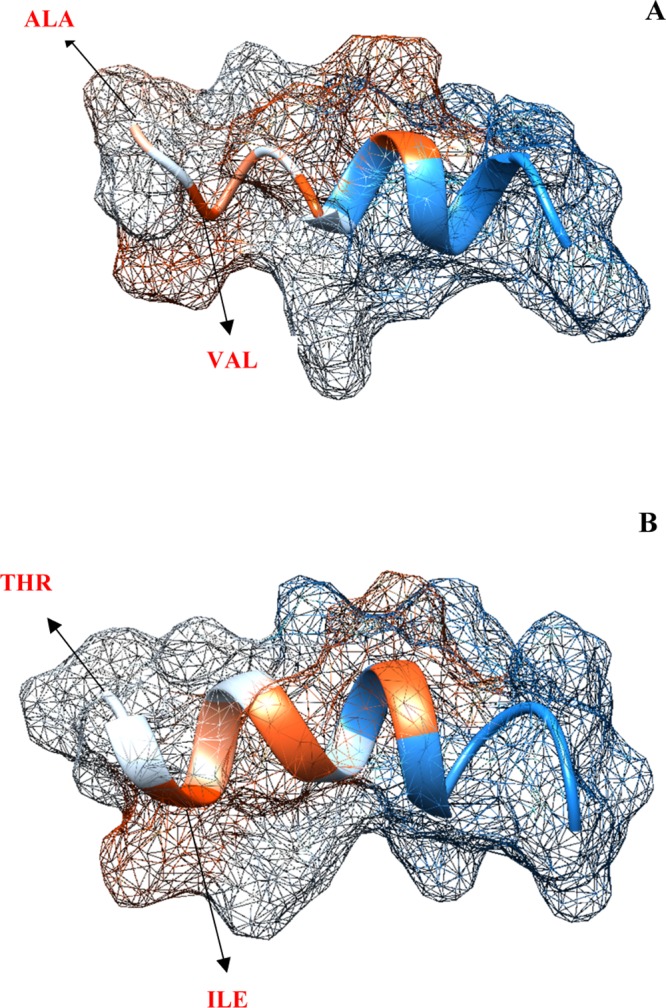
Model peptide fragments visualized using UCSF chimera package with variations in colors according to their hydrophobicity (blue: most hydrophilic, white: neutral, orange: most hydrophobic). (A) BIF has alanine and valine, which are both hydrophobic and (B) HIF has threonine which is neutral and isoleucine which is hydrophobic.
The formation of intermolecular β-sheet secondary structure is one criterion used to label an aggregate as an “amyloid fibril”.22 The changes in the secondary structure of peptides can be followed by FTIR.39 Moreover, ATR-FTIR plays a prominent role in differentiating the oligomers (antiparallel β-sheets) from fibrils (parallel β-sheets).40 Therefore, IR spectroscopy is an alternative method to complex techniques like X-ray diffraction.41 Second-derivative analysis of the spectra allows the determination of protein secondary structure.42 The number of peaks from the deconvolved spectra should be chosen carefully. It is necessary to confirm that the maximum frequency of the curve-fit peaks corresponds to the maxima evident in the raw data to ensure that the peak is assigned to its specific secondary structure.43 The precision of the calculated peak areas from the second-derivative spectra largely depends on the baseline chosen while fitting.39 Origin Pro peak fit analysis has various baseline modes for this purpose.
The relevant region in the spectra is the amide I region (1600–1700 cm–1), which is caused by the carbonyl group stretching vibrations from the peptide backbone.44 Each structural conformation has a unique C=O vibration dependent on its hydrogen bonding pattern.45 One major limitation with the spectra is that the amide I peak has a maximum at ∼1650 cm–1 that coincides with the water maximum absorption at ∼1643 cm–1. The water background needs to be carefully subtracted from the spectra. The use of an ATR attachment avoids this problem and allows data collection with minimal use of sample.46 A flat baseline obtained between 2200 and 1800 cm–1 is often considered a standard to confirm proper water subtraction.47 Absorption of the side chains also causes spectral deviation during the analysis. Carbonyl group vibrations for asparagine and glutamine occur at around 1678 and 1670 cm–1, which can affect the spectra.48 Urea also has an absorption peak in the amide I region, which can be deceptive.49 Hence, during the background subtraction for the samples in the presence of urea, 20 μL of 1 M urea was added to the blank to subtract the undesired peaks.
FTIR analysis of the native peptide fragments shows an α-helix content of 52.6 and 53.9% for BIF and HIF, respectively, whereas the rest of the structure is random coils (Figures S1 and S2). The calculated secondary structures for both peptides predicted by PEP-FOLD3 are 42.9 and 64.3% α-helix for both BIF and HIF (the rest being random coils). The secondary structure is calculated using DSSP, a hydrogen bond estimation based algorithm by the secondary structure server.50 PSIPRED and Porter 4.0 protein servers also confirmed that both the peptides consist of α-helices and random coils.51 Comparing the experimental and theoretical values of α-helix content, BIF has ∼82% Q3 accuracy, whereas HIF has ∼81% Q3 accuracy, which are acceptable.52
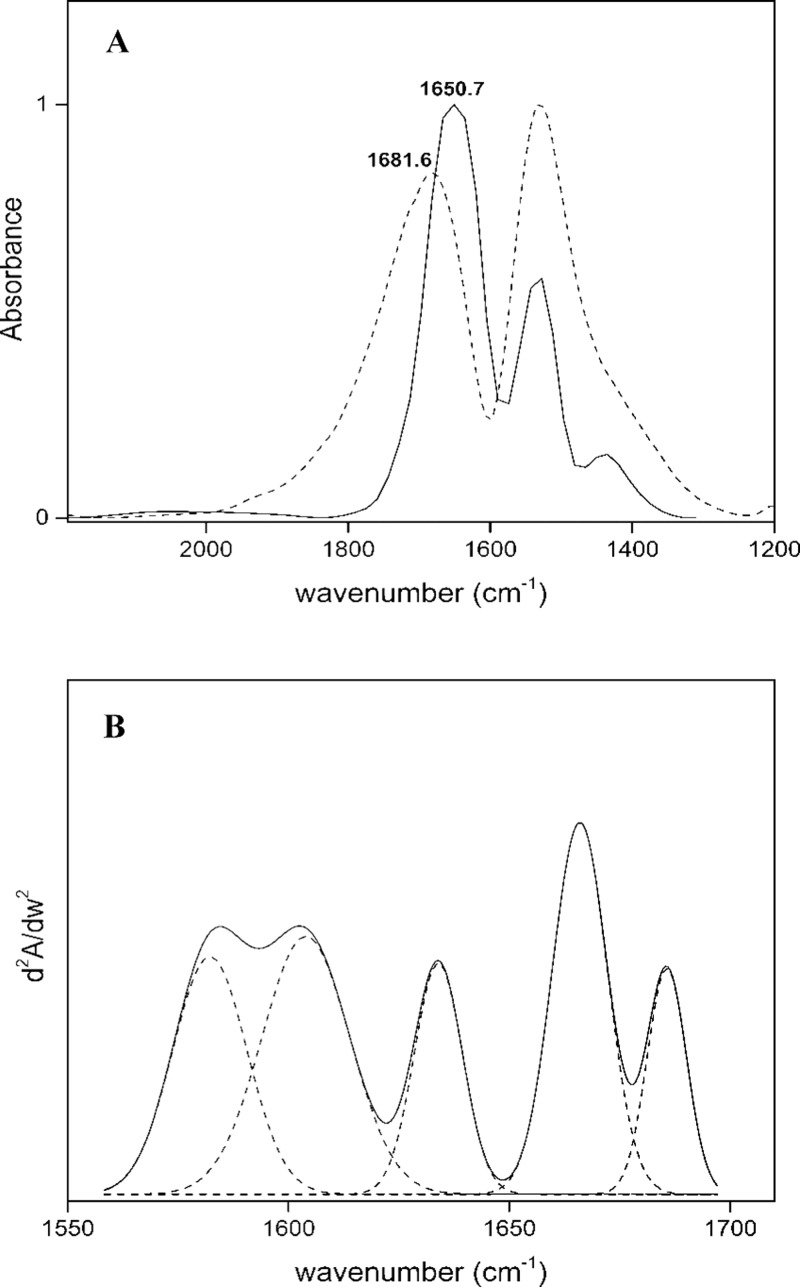
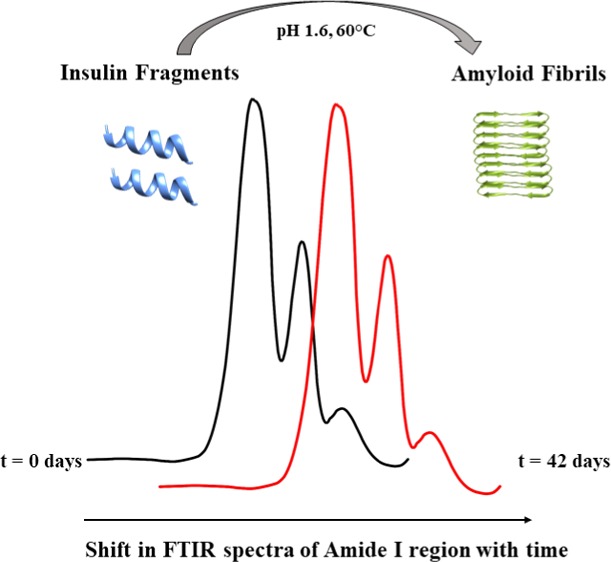
Figure 7A shows the FTIR spectra of BIF at pH 1.6, 60 °C, 1 M urea, and 0.02 M NaCl collected during weeks 1 and 6. At time 0, the amide I peak is centered at 1650 cm–1, but after 42 days the peak shifted to 1681 cm–1. This net band shift corresponds to an α-helix to β-sheet transition with time.53 By curve fitting the deconvoluted spectra, the amount of each secondary structure was determined, as shown in Figure 7B, which corresponds to BIF at the above conditions during week 1. The integration of each curve-fitted peak yields the total secondary structure content. At the end of week 1 (Figure 7B), three peaks are found around 1635, 1663, and 1689 cm–1. The bands around 1635 and 1689 cm–1 correspond to β-sheets/random coil and turns/antiparallel β-sheets, respectively, whereas the peak around 1663 cm–1 can be assigned to α-helix. At the end of week 6, four peaks around 1620, 1651, 1674, and 1681 cm–1 are found. The peak at 1635 cm–1 during week 1 vanishes with time, and the presence of a peak around 1620 cm–1 during week 6 corresponds to an increase in β-sheet content. Researchers previously reported that the fibrils show a new β band at ∼1620 cm–1 as opposed to the native FTIR β band at ∼1635 cm–1.54 The peaks at 1620 and 1651 cm–1 can be assigned to extended β-sheets and α-helix, whereas the other two peaks correspond to β-turns/antiparallel β-sheets. Similar analysis was also conducted on HIF, and the secondary structure content was determined (Figure S3A,B). HIF peaks were located around same wavenumbers as that of BIF (Table S3).
Figure 7.
(A) FTIR spectra for BIF at pH 1.6, 60 °C, 1 M urea, 0.02 M NaCl collected at t = 0 day (−) and t = 42 days (--) showing the shift in the amide I region. (B) Second-derivative spectra for BIF at pH 1.6, 60 °C, 1 M urea, 0.02 M NaCl collected at the end of week 1 (−) and its curve-fitted peaks.
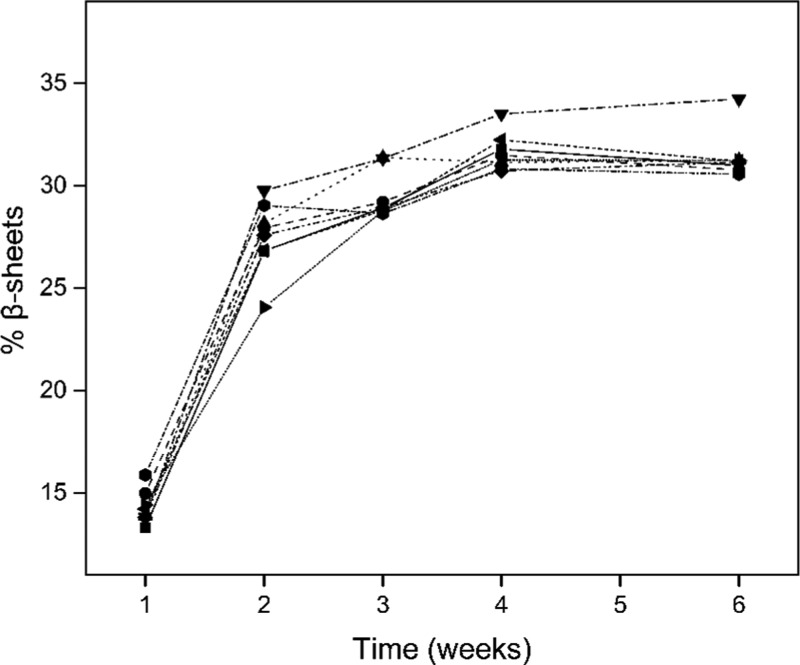
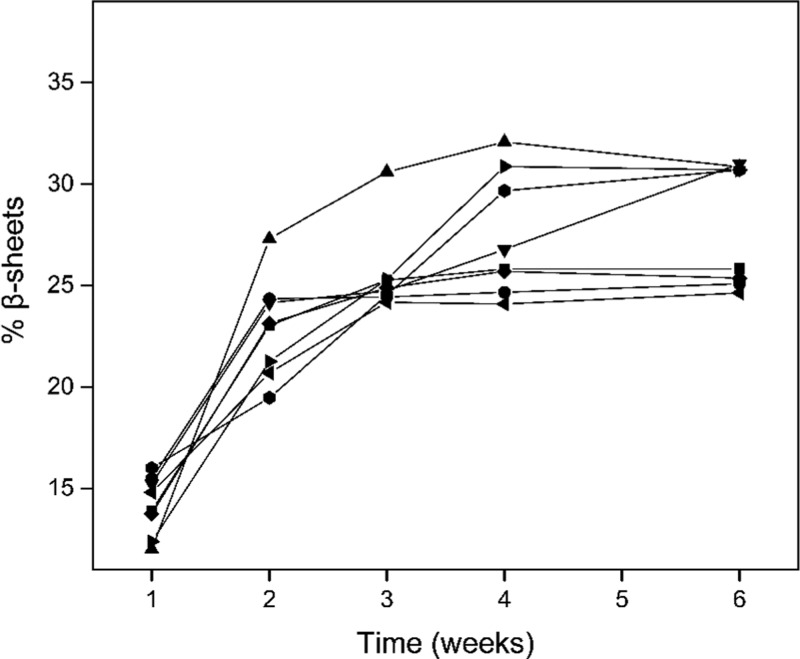
Figures 8 and 9 show plots for the change in the intermolecular β-sheet content with time for both BIF and HIF, respectively. All of the runs show an increase in the percentage of β-sheets with time. All BIF samples have a higher percentage of β-sheets than HIF when incubated at the same conditions. The highest percentage of β-sheets was found in BIF (34%) and HIF (31%) at pH 1.6, 60 °C, 1 M urea, 0.02 M NaCl. HIF at 60 °C for all runs has a higher percentage when compared to the one at 25 °C. As it is evident from the plots, most of the increase in β-sheets occurred in the first 2 weeks of the experiment for BIF and in the first 3 weeks for HIF. A comparison with ThT data shows that the β-sheet increase occurs mostly during the lag times (12 days for BIF and 21 days for HIF). Thus, the progression of lag phase to the elongation phase in both the fragments can be assigned to the increase in the number of β-sheets and their extension to form fibril.
Figure 8.
Evolution of the intermolecular β-sheets (%) with time (weeks) for BIF at pH 1.6, 25 °C, 0 M urea, 0.02 M NaCl (−■−); pH 1.6, 25 °C, 1 M urea, 1 M NaCl (--●--); pH 1.6, 60 °C, 0 M urea, 1 M NaCl (▲); pH 1.6, 60 °C, 1 M urea, 0.02 M NaCl (-·-▼-·-); pH 5, 25 °C, 0 M urea, 1 M NaCl (-··⧫-··); pH 5, 25 °C, 1 M urea, 0.02 M NaCl (----◀----); pH 5, 60 °C, 0 M urea, 0.02 M NaCl (▶); pH 5, 60 °C, 1 M urea, 1 M NaCl (⬢).
Figure 9.
Evolution of the intermolecular β-sheets (%) with time (weeks) for HIF at pH 1.6, 25 °C, 0 M urea, 0.02 M NaCl (−■−); pH 1.6, 25 °C, 1 M urea, 1 M NaCl (−●−); pH 1.6, 60 °C, 0 M urea, 1 M NaCl (−▲−); pH 1.6, 60 °C, 1 M urea, 0.02 M NaCl (−▼−); pH 5, 25 °C, 0 M urea, 1 M NaCl (−⧫−); pH 5, 25 °C, 1 M urea, 0.02 M NaCl (−◀−); pH 5, 60 °C, 0 M urea, 0.02 M NaCl (−▶−); pH 5, 60 °C, 1 M urea, 1 M NaCl (−⬢−).
The samples HIF at pH 1.6, 25 °C, 1 M urea, 1 M NaCl and at pH 5, 25 °C, 1 M urea, 0.02 M NaCl are still in the lag phase at the end of the experiment, they have β-sheet contents of 25.1 and 24.6%, respectively. There is no specific criterion as to how much of β-sheet percentage qualifies to be an amyloid fibril. According to ThT data, HIF at pH 5, 25 °C, 0 M urea, 1 M NaCl forms fibrils, whereas HIF at pH 1.6, 25 °C, 1 M urea, 1 M NaCl and at pH 5, 25 °C, 1 M urea, 0.02 M NaCl do not; despite the fact that both peptides reach an almost identical percentage of β-sheets. Although there is an increase in the β-sheet content with time for the rest of the runs, these two runs have a constant β-sheet content. These results are consistent with the ThT data (Figure 3).
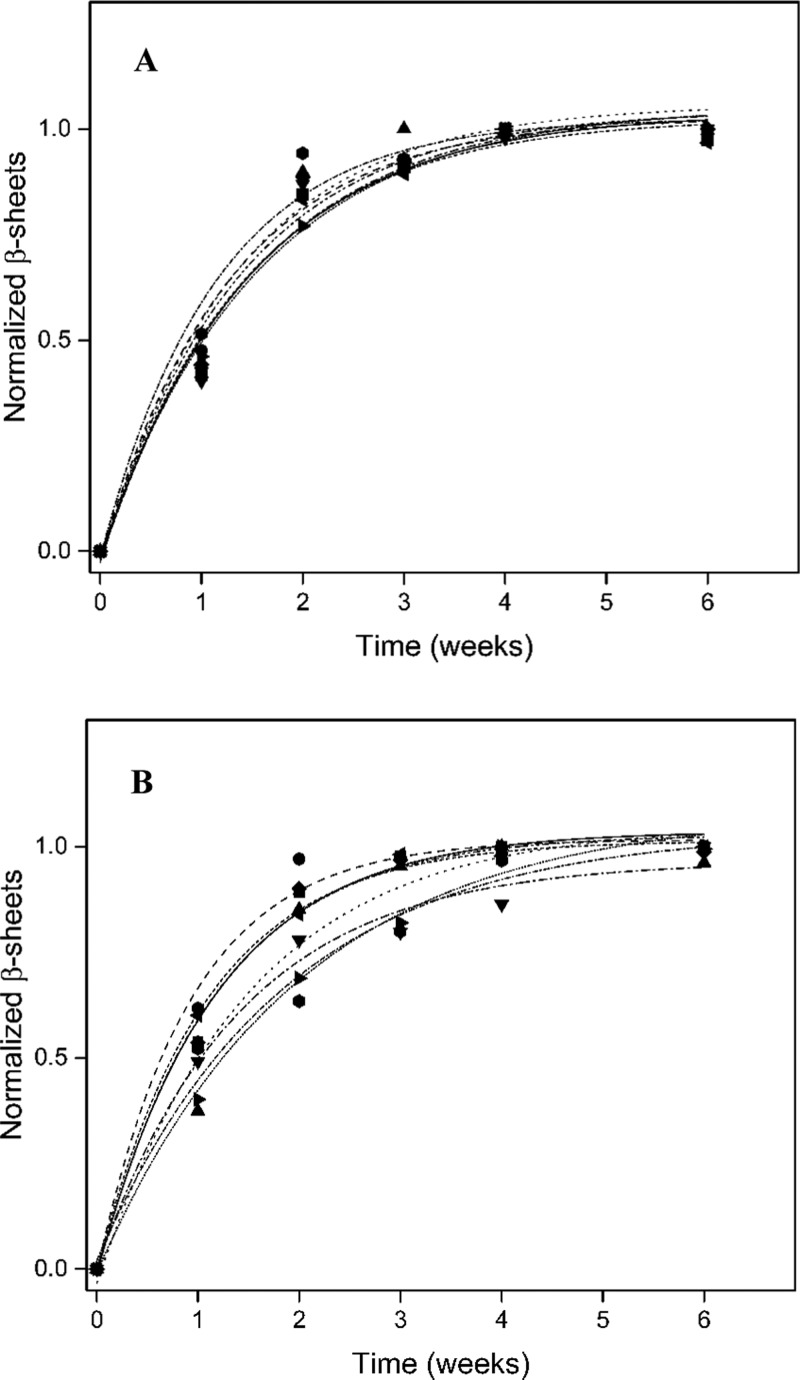
The data shown in Figures 8 and 9 were normalized and fitted with
| 2 |
where y is the normalized β-sheet percentage, t is the time in weeks, and Kβ is the rate of increase in β-sheets. Figure 10A,B shows the curve-fitted β-sheet plots for BIF and HIF, respectively. All of the fitted curves have an R2 value of at least 97%. The Kβ values calculated for BIF and HIF are shown in Table 4. Kβ values for BIF are similar for all of the runs, but the Kβ values for HIF are larger at 60 °C than at 25 °C. At 25 °C, the rate of increase in β-sheets was higher in BIF than HIF, whereas at 60 °C, the rates were similar. The Kβ value decreased with an increase in both urea and NaCl concentrations irrespective of other conditions. Using Kβ as an outcome, Pareto analysis was conducted to determine the important factors (Figure S10). Temperature and pH are the most significant factors for HIF, which is also true for the lag and elongation phases from ThT data (Figures 4B and 5B). Ionic strength and urea are the most important factors for BIF. This is also true for BIF during lag phase, but during the elongation phase, temperature and pH are more important.
Figure 10.
Curve-fitted plots for the evolution of the intermolecular β-sheets (%) with time (weeks) for (A) BIF and (B) HBF at pH 1.6, 25 °C, 0 M urea, 0.02 M NaCl (−■−); pH 1.6, 25 °C, 1 M urea, 1 M NaCl (--●--); pH 1.6, 60 °C, 0 M urea, 1 M NaCl (▲); pH 1.6, 60 °C, 1 M urea, 0.02 M NaCl (-·-▼-·-); pH 5, 25 °C, 0 M urea, 1 M NaCl (-··⧫-··); pH 5, 25 °C, 1 M urea, 0.02 M NaCl (----◀----) pH 5, 60 °C, 0 M urea, 0.02 M NaCl (▶); pH 5, 60 °C, 1 M urea, 1 M NaCl (⬢).
Table 4. Rate of Increase in β-Sheets (Kβ) Calculated for Both BIF and HIF.
| bovine | human | |
|---|---|---|
| run # | Kβ (week–1) | Kβ (week–1) |
| 1 | 0.50 ± 0.08 | 0.43 ± 0.05 |
| 2 | 0.46 ± 0.07 | 0.34 ± 0.06 |
| 3 | 0.47 ± 0.09 | 0.51 ± 0.11 |
| 4 | 0.51 ± 0.09 | 0.49 ± 0.06 |
| 5 | 0.48 ± 0.08 | 0.42 ± 0.06 |
| 6 | 0.49 ± 0.07 | 0.40 ± 0.02 |
| 7 | 0.52 ± 0.04 | 0.60 ± 0.05 |
| 8 | 0.42 ± 0.08 | 0.58 ± 0.07 |
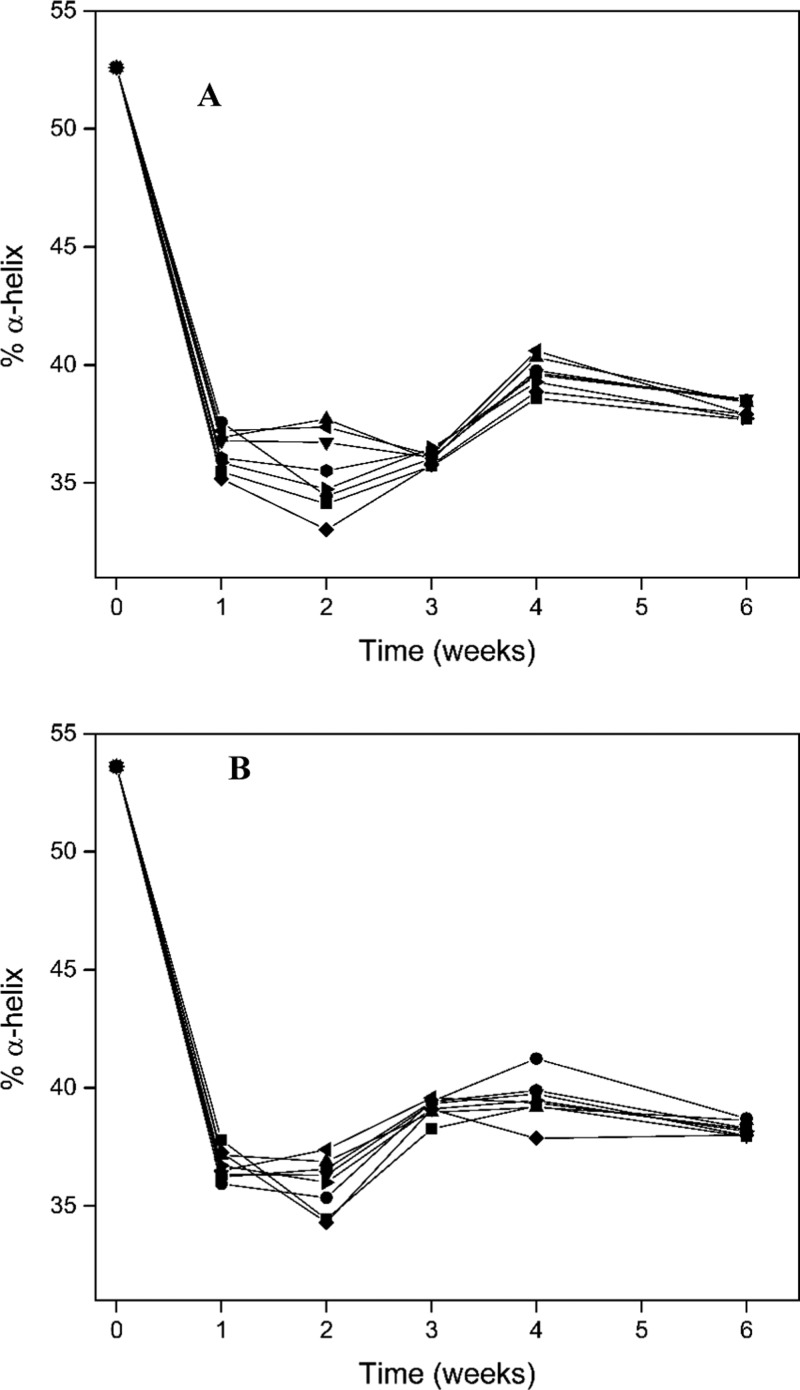
Figure 11A,B shows a plot of percentage change in the α-helix content with time for BIF and HIF, respectively, for all runs. Both fragments show a decrease in α-helices with time. Though there is consistent decrease in the α-helix content in both fragments during the lag phase, a slight increase in α-helices can be seen during the transition from lag phase to elongation phase. Formation of α-helical rich intermediates was also reported previously in the fibrillation of α-synuclein.55,56
Figure 11.
α-Helix percentage changes for (A) BIF and (B) HIF at pH 1.6, 25 °C, 0 M urea, 0.02 M NaCl (−■−); pH 1.6, 25 °C, 1 M urea, 1 M NaCl (−●−); pH 1.6, 60 °C, 0 M urea, 1 M NaCl (−▲−); pH 1.6, 60 °C, 1 M urea, 0.02 M NaCl (−▼−); pH 5, 25 °C, 0 M urea, 1 M NaCl (−⧫−); pH 5, 25 °C, 1 M urea, 0.02 M NaCl (−◀−); pH 5, 60 °C, 0 M urea, 0.02 M NaCl (−▶−); pH 5 60 °C, 1 M urea, 1 M NaCl (−⬢−).
FTIR analysis was also used to distinguish oligomers from fibrils. Oligomers are rich in antiparallel β-sheets (1695–1680 cm–1), whereas fibrils are rich in parallel β-sheets (1635–1620 cm–1).40 We calculated the β-index i.e., the ratio of (% of turns + antiparallel β-sheets) to % of parallel β-sheets using a similar protocol as previously mentioned.57 The β-index as a function of time was plotted for both the fragments, as shown in Figure S17. Its value decreases with increasing time, which shows that samples rich in antiparallel β-sheets (oligomers) convert to parallel β-sheet rich fibrils. That transition from antiparallel to parallel β-sheets confirms that oligomers are the base unit of fibrillation.
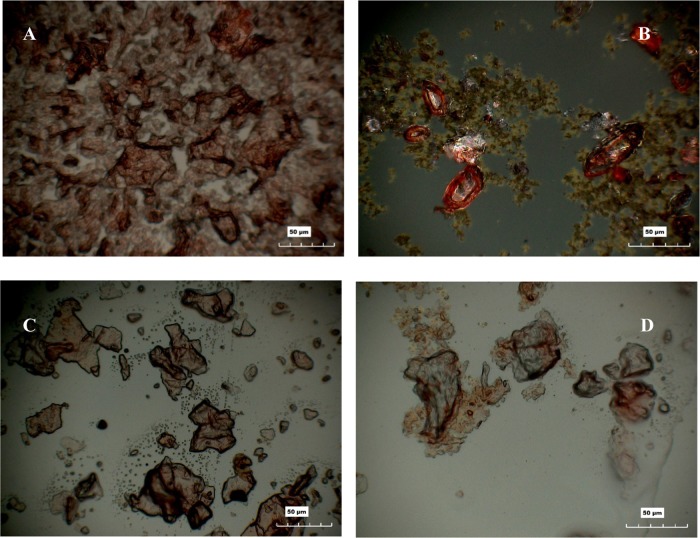
The presence of fibrils was further confirmed using optical microscope. A recent NMR study shows that Congo red binding is specific to fibrils.58 The combination of ThT and Congo red assays minimizes confounding because they are independent assays.59 Micrographs shown in Figure 12 contain irregular proteinaceous deposits when stained with Congo red. These micrographs demonstrate the amyloid properties for BIF and HIF at pH 1.6, 60 °C, 1 M urea, 0.02 M salt (Figure 12A,B) and pH 5, 60 °C, 0 M urea, 0.02 M salt (Figure 12C,D), respectively. At pH 1.6, BIF forms amyloid plaques (Figure 12A), whereas HIF forms distinct annular amyloid aggregates (Figure 12B).60 The maximum fluorescence intensity (Figures S1 and S2) represents the maximum aggregation growth. This is higher in HIF compared to BIF at pH 1.6, which explains the morphological differences. Similarly, it is the same at pH 5 for both fragments showing aggregates of similar morphology.
Figure 12.
Micrographs showing the presence of fibrils for (A) BIF at pH 1.6, 60 °C, 1 M urea, 0.02 M NaCl, (B) HIF at pH 1.6, 60 °C, 1 M urea, 0.02 M NaCl, (C) BIF at pH 5, 60 °C, 0 M urea, 0.02 M NaCl, and (D) HIF at pH 5, 60 °C, 0 M urea, 0.02 M NaCl.
Conclusions
Two peptide fragments of insulin A-chain with subtle differences in their primary structure were synthesized, and their fibrillation propensity was studied using fluorescence and infrared spectroscopy. We found that the bovine insulin fragments have a shorter lag time in comparison with the human insulin ones, but for most samples, the exponential phase rate was faster for HIF than for BIF. Fibrillation kinetics, which is dependent on pH and temperature, may have been affected by the presence of an Fmoc-attached peptide. An increase in β-sheets content with time was observed in both fragments. The increase in β-sheets was preceded by an initial decrease in α-helices followed by an intermediate increase during the transition from the lag phase to elongation phase. The conversion of oligomer structures rich in antiparallel β-sheets to fibrils rich in parallel β-sheets is a characteristic of amyloid. The observed α-helix to β-sheet transition as well as the micrographs obtained using Congo red staining confirmed the formation of ringlike oligomer structures rich in antiparallel β-sheets, which then form fibrils rich in parallel β-sheets.
Experimental Section
Materials
All Fmoc amino acids, Wang resin and (2-(1H-benzotriazol-1-yl)-1,1,3,3-tetramethyluronium hexafluorophosphate) (HBTU) were purchased from CSBIO Co. ThT was purchased from Acros Organics. Piperidine, dimethylformamide (DMF), trifluoroacetic acid (TFA), N,N-diisopropylethylamine (DIPEA), and deuterium oxide; 99.9 atom % deuterium (D) were purchased from Sigma-Aldrich. All other solvents were purchased from Fischer Scientific.
Peptide Synthesis
The peptides BIF and HIF were synthesized in a CSBio 336 peptide synthesizer using Fmoc technique in solid-phase peptide synthesis.61 Wang resin (0.5 mmol/g) was used as a solid support matrix for this purpose, and the synthesis was carried out from the C- to the N-terminus.62 One millimole per synthesis of each Fmoc amino acid was used. Deprotection of Fmoc group was done using 20% piperidine in DMF. HBTU combined with DIPEA was used as an activator to facilitate the coupling of amino acids. The complete synthesis took approximately 18 h. The product from the reaction vessel was suspended in dichloromethane, and the peptide was cleaved from the swollen resin using 95% TFA. The cleaved peptide was then resuspended in cold diethyl ether and centrifuged twice using RC-3B refrigerated centrifuge (Sorvall Instruments) at 4650g, −5 °C for 30 min. The obtained pellet was dissolved in 10 mM acetic acid and lyophilized to obtain the final peptide fragment.
NMR Spectroscopy
The amino acid composition of the peptides was confirmed using liquid state one-dimensional 1H NMR spectroscopy. Samples for the analysis were prepared by dissolving 10 mg of the peptide in 750 μL D2O (99.9% deuterium). Spectra were obtained using a Bruker 400 MHz spectrometer equipped with a BBO probe. 1H NMR data were obtained with a sweep width of 3997.8 MHz, 0.256 s acquisition time, 16 scans, and a 2 s recycle delay.
Mass Spectrometry
To determine the purity and the mass of the peptides, LC–MS data were acquired on an Agilent 6520 Q-TOF LC–MS system. Lyophilized peptides were suspended in 0.1% formic acid in water to obtain a final concentration of 1 mg/mL. Five microliter of the sample was loaded on an Agilent Technologies 43 mm C18 Chip column. Agilent Technologies 1200 Series Quaternary high-performance liquid chromatograph was used. LC gradient: initial conditions 3% B (A: 0.1% formic acid in water; B: 99.9% acetonitrile, 0.1% formic acid), gradient to 80% B over 9 min, hold at 80% B for 3 min, ramp back to (0.5 min) and hold at (2.5 min) initial conditions. An Agilent Technologies 6520A Accurate Mass Q-TOF MS with integrated Chip Cube source was used to collect data. Data across a total of 15 min of elution were collected. MS data were collected between 295 and 2500 m/z, and MS/MS data were collected between 70 and 2500 m/z at 2 spectra/s. Peptides with counts >2000 were picked for MS/MS.
LC–MS for the fibrils was obtained using an LTQ Orbitrap XL mass spectrometer. Samples were precipitated using ice-cold acetone. The pellet was recovered by centrifugation (16 000g) and washed twice with 80% acetone (in water). The pellet was dried and resuspended in 100 μL of urea buffer (6 M urea, 2 M thiourea, 0.1 M ammonium bicarbonate). No particulates were observed, suggesting fibrils were completely dissolved in the buffer.
In Vitro Fibrillation
Samples were prepared with a peptide concentration of 10 mg/mL. A total of 16 samples, eight for each fragment varying the experimental conditions were made. All of the samples were prepared in 0.22 μm filtered phosphate buffer at their respective pH (1.6 and 5). Urea and sodium chloride with two different concentrations were added. Samples were incubated with ThT at two different temperatures (25 and 60 °C) under stirring and no stirring conditions. The evolution of the fibrillation process with time was followed by fluorescence assay, and the changes in secondary structure were studied using FTIR. The water used for the preparation of buffers was purified to a resistivity of 17.5 MΩ cm.
ThT Fluorescence Assay
ThT assay was done using a NanoDrop 3300 Fluorospectrometer (Thermo Fisher Scientific) using white light as the excitation source (460–650 nm). The emission wavelength was set to 482 nm. Free dye has an excitation wavelength of 385 nm and an emission wavelength of 445 nm. A stock solution for the ThT assay was prepared by adding 0.8 mg of ThT dye to 50 mL of 0.22 μm filtered phosphate buffer (pH 7) and stored at 4 °C in a dark place to prevent quenching. ThT solution (0.05 mM) was added to each sample at the beginning of incubation. A ThT solution with only the buffer was used as a blank for the assay. Fluorescence for each sample was recorded every 3 days. Increase in viscosity or the appearance of gel/precipitate with time upon visual inspection is a characteristic of the ThT assay.22 All of the reported fluorescence readings were an average of five replicates.
FTIR Analysis
Analysis was carried out with a Nicolet 6700 FTIR spectrometer from Thermoscientific equipped with a KBr beam-splitter and a DTGC detector cooled by liquid nitrogen. A smart performer attenuated total reflectance sampling accessory with a germanium (Ge) crystal was used. Interferograms were obtained for each sample at a resolution of 16 cm–1, and 256 scans were collected for each run to obtain a good signal-to-noise ratio.
Congo Red Staining
Congo red dye was used to stain and obtain the micrographs of the fibrils. A stock solution was prepared by adding 7 mg of Congo red to 1 mL of 0.22 μm filtered water. Samples containing fibrils were first centrifuged using a microcentrifuge at 9450g and then washed thoroughly with water. The pellet was then resuspended in 1 mL of water, and 5 μL of Congo red solution was added and incubated at 25 °C for 1 h. After obtaining a red precipitate, the sample was centrifuged again. The pellet was washed twice with water to remove the unattached dye. The fibrils were then resuspended in a small amount of water. Congo red stained fibrils (30 μL) were placed on a microscopic slide and air-dried. Micrographs were obtained at 1000× using Hirox KH-8700 digital microscope.
Acknowledgments
The work done on this project was funded in part by the National Science Foundation (CBET 0933468).
Glossary
Abbreviations
- BIF
bovine insulin fragment
- HIF
human insulin fragment
- ThT
thioflavin T
- FTIR
Fourier transform infrared
- NMR
nuclear magnetic resonance
- DMF
dimethylformamide
- TFA
trifluoroacetic acid
- DIPEA
N,N-diisopropylethylamine
- Fmoc
fluorenylmethyloxycarbonyl chloride
- HBTU
(2-(1H-benzotriazol-1-yl)-1,1,3,3-tetramethyluronium hexafluorophosphate)
Supporting Information Available
The Supporting Information is available free of charge on the ACS Publications website at DOI: 10.1021/acsomega.8b00500.
1H NMR chemical shifts; FTIR spectra for both the native fragments; micrographs obtained for both the fragments at all incubation conditions and LC–MS spectrum for both BIF and HIF (PDF)
The authors declare no competing financial interest.
Supplementary Material
References
- Cromwell M. E. M.; Hilario E.; Jacobson F. Protein Aggregation and Bioprocessing. AAPS J. 2006, 8, E572–E579. 10.1208/aapsj080366. [DOI] [PMC free article] [PubMed] [Google Scholar]
- Sipe J. D.; Benson M. D.; Buxbaum J. N.; Ikeda S.; Merlini G.; Saraiva M. J. M.; Westermark P. Amyloid Fibril Proteins and Amyloidosis: Chemical Identification and Clinical Classification International Society of Amyloidosis 2016 Nomenclature Guidelines. Amyloid 2016, 23, 209–213. 10.1080/13506129.2016.1257986. [DOI] [PubMed] [Google Scholar]
- de Groot N. S.; Sabate R.; Ventura S. Amyloids in Bacterial Inclusion Bodies. Trends Biochem. Sci. 2009, 34, 408–416. 10.1016/j.tibs.2009.03.009. [DOI] [PubMed] [Google Scholar]
- Selivanova O. M.; Suvorina M. Y.; Dovidchenko N. V.; Eliseeva I. A.; Surin A. K.; Finkelstein A. V.; Schmatchenko V. V.; Galzitskaya O. V. How to Determine the Size of Folding Nuclei of Protofibrils from the Concentration Dependence of the Rate and Lag-Time of Aggregation. II. Experimental Application for Insulin and LysPro Insulin: Aggregation Morphology, Kinetics, and Sizes of Nuclei. J. Phys. Chem. B 2014, 118, 1198–1206. 10.1021/jp4083568. [DOI] [PubMed] [Google Scholar]
- Dovidchenko N. V.; Glyakina A. V.; Selivanova O. M.; Grigorashvili E. I.; Suvorina M. Y.; Dzhus U. F.; Mikhailina A. O.; Shiliaev N. G.; Marchenkov V. V.; Surin A. K.; Galzitskaya O. V. One of the Possible Mechanisms of Amyloid Fibrils Formation Based on the Sizes of Primary and Secondary Folding Nuclei of Aβ40 and Aβ42. J. Struct. Biol. 2016, 194, 404–414. 10.1016/j.jsb.2016.03.020. [DOI] [PubMed] [Google Scholar]
- Galzitskaya O. V.; Galushko E. I.; Selivanova O. M. Studies of the Process of Amyloid Formation by Aβ Peptide. Biochemistry 2018, 83, S62–S80. 10.1134/S0006297918140079. [DOI] [PubMed] [Google Scholar]
- Selivanova O. M.; Glyakina A. V.; Gorbunova E. Y.; Mustaeva L. G.; Suvorina M. Y.; Grigorashvili E. I.; Nikulin A. D.; Dovidchenko N. V.; Rekstina V. V.; Kalebina T. S.; Surin A. K.; Galzitskaya O. V. Structural Model of Amyloid Fibrils for Amyloidogenic Peptide from Bgl2p–glucantransferase of S. cerevisiae Cell Wall and Its Modifying Analog. New Morphology of Amyloid Fibrils. Biochim. Biophys. Acta, Proteins Proteomics 2016, 1864, 1489–1499. 10.1016/j.bbapap.2016.08.002. [DOI] [PubMed] [Google Scholar]
- Selivanova O. M.; Surin A. K.; Ryzhykau Y. L.; Glyakina A. V.; Suvorina M. Y.; Kuklin A. I.; Rogachevsky V. V.; Galzitskaya O. V. To Be Fibrils or to Be Nanofilms? Oligomers Are Building Blocks for Fibril and Nanofilm Formation of Fragments of Aβ Peptide. Langmuir 2018, 34, 2332–2343. 10.1021/acs.langmuir.7b03393. [DOI] [PubMed] [Google Scholar]
- McBride S. A.; Sanford S. P.; Lopez J. M.; Hirsa A. H. Shear-Induced Amyloid Fibrillization: The Role of Inertia. Soft Matter 2016, 12, 3461–3467. 10.1039/C5SM02916C. [DOI] [PubMed] [Google Scholar]
- Maji S. K.; Perrin M. H.; Sawaya M. R.; Jessberger S.; Vadodaria K.; Rissman R. A.; Singru P. S.; Nilsson K. P. R.; Simon R.; Schubert D.; Eisenberg D.; Rivier J.; Sawchenko P.; Vale W.; Riek R. Functional Amyloids as Natural Storage of Peptide Hormones in Pituitary Secretory Granules. Science 2009, 325, 328–332. 10.1126/science.1173155. [DOI] [PMC free article] [PubMed] [Google Scholar]
- Fändrich M.; Fletcher M. A.; Dobson C. M. Amyloid Fibrils from Muscle Myoglobin. Nature 2001, 410, 165–166. 10.1038/35065514. [DOI] [PubMed] [Google Scholar]
- Bermudez O.; Forciniti D. Aggregation and Denaturation of Antibodies: A Capillary Electrophoresis, Dynamic Light Scattering, and Aqueous Two-Phase Partitioning Study. J. Chromatogr. B: Anal. Technol. Biomed. Life Sci. 2004, 807, 17–24. 10.1016/j.jchromb.2004.01.029. [DOI] [PubMed] [Google Scholar]
- Png G. M.; Falconer R. J.; Abbott D. Tracking Aggregation and Fibrillation of Globular Proteins Using Terahertz and Far-Infrared Spectroscopies. IEEE Trans. Terahertz Sci. Technol. 2016, 6, 45–53. 10.1109/TTHZ.2015.2505900. [DOI] [Google Scholar]
- Krebs M. R.; Wilkins D. K.; Chung E. W.; Pitkeathly M. C.; Chamberlain A. K.; Zurdo J.; Robinson C. V.; Dobson C. M. Formation and Seeding of Amyloid Fibrils from Wild-Type Hen Lysozyme and a Peptide Fragment from the β-Domain. J. Mol. Biol. 2000, 300, 541–549. 10.1006/jmbi.2000.3862. [DOI] [PubMed] [Google Scholar]
- Liu R.; He M.; Su R.; Yu Y.; Qi W.; He Z. Insulin Amyloid Fibrillation Studied by Terahertz Spectroscopy and Other Biophysical Methods. Biochem. Biophys. Res. Commun. 2010, 391, 862–867. 10.1016/j.bbrc.2009.11.153. [DOI] [PubMed] [Google Scholar]
- McBride S. A.; Tilger C. F.; Sanford S. P.; Tessier P. M.; Hirsa A. H. Comparison of Human and Bovine Insulin Amyloidogenesis under Uniform Shear. J. Phys. Chem. B 2015, 119, 10426–10433. 10.1021/acs.jpcb.5b04488. [DOI] [PubMed] [Google Scholar]
- Morales P. B.Kinetics of Human and Bovine Insulin Amyloid Fibril Formation in the Presence of Solid/Liquid Interfaces. Masters Theses. 7193, Missouri University of Science and Technology, 2013; pp 1–148. [Google Scholar]
- Ivanova M. I.; Sievers S. A.; Sawaya M. R.; Wall J. S.; Eisenberg D. Molecular Basis for Insulin Fibril Assembly. Proc. Natl. Acad. Sci. U.S.A. 2009, 106, 18990–18995. 10.1073/pnas.0910080106. [DOI] [PMC free article] [PubMed] [Google Scholar]
- Selivanova O.; Suvorina M.; Surin A.; Dovidchenko N.; Galzitskaya O. Insulin and Lispro Insulin: What Is Common and Different in Their Behavior?. Curr. Protein Pept. Sci. 2016, 18, 57–64. 10.2174/1389203717666160526122421. [DOI] [PubMed] [Google Scholar]
- Babenko V.; Piejko M.; Wójcik S.; Mak P.; Dzwolak W. Vortex-Induced Amyloid Superstructures of Insulin and Its Component A and B Chains. Langmuir 2013, 29, 5271–5278. 10.1021/la400612w. [DOI] [PubMed] [Google Scholar]
- Frommeyer M.; Steinbüchel A. Increased Lysine Content Is the Main Characteristic of the Soluble Form of the Polyamide Cyanophycin Synthesized by Recombinant Escherichia coli. Appl. Environ. Microbiol. 2013, 79, 4474–4483. 10.1128/AEM.00986-13. [DOI] [PMC free article] [PubMed] [Google Scholar]
- Nilsson M. R. Techniques to Study Amyloid Fibril Formation in Vitro. Methods 2004, 34, 151–160. 10.1016/j.ymeth.2004.03.012. [DOI] [PubMed] [Google Scholar]
- Ulrich E. L.; Akutsu H.; Doreleijers J. F.; Harano Y.; Ioannidis Y. E.; Lin J.; Livny M.; Mading S.; Maziuk D.; Miller Z.; Nakatani E.; Schulte C. F.; Tolmie D. E.; Wenger R. K.; Yao H.; Markley J. L. BioMagResBank. Nucleic Acids Res. 2008, 36, D402–D408. 10.1093/nar/gkm957. [DOI] [PMC free article] [PubMed] [Google Scholar]
- Lee C.-C.; Nayak A.; Sethuraman A.; Belfort G.; McRae G. J. A Three-Stage Kinetic Model of Amyloid Fibrillation. Biophys. J. 2007, 92, 3448–3458. 10.1529/biophysj.106.098608. [DOI] [PMC free article] [PubMed] [Google Scholar]
- Selivanova O. M.; Surin A. K.; Marchenkov V. V.; Dzhus U. F.; Grigorashvili E. I.; Suvorina M. Y.; Glyakina A. V.; Dovidchenko N. V.; Galzitskaya O. V. The Mechanism Underlying Amyloid Polymorphism Is Opened for Alzheimer’s Disease Amyloid-β Peptide. J. Alzheimer’s Dis. 2016, 54, 821–830. 10.3233/JAD-160405. [DOI] [PubMed] [Google Scholar]
- Galzitskaya O. V.; Selivanova O. M. Rosetta Stone for Amyloid Fibrils: The Key Role of Ring-Like Oligomers in Amyloidogenesis. J. Alzheimer’s Dis. 2017, 59, 785–795. 10.3233/JAD-170230. [DOI] [PubMed] [Google Scholar]
- Jiménez J. L.; Nettleton E. J.; Bouchard M.; Robinson C. V.; Dobson C. M.; Saibil H. R. The Protofilament Structure of Insulin Amyloid Fibrils. Proc. Natl. Acad. Sci. U.S.A. 2002, 99, 9196–9201. 10.1073/pnas.142459399. [DOI] [PMC free article] [PubMed] [Google Scholar]
- Dovidchenko N. V.; Finkelstein A. V.; Galzitskaya O. V. How to Determine the Size of Folding Nuclei of Protofibrils from the Concentration Dependence of the Rate and Lag-Time of Aggregation. I. Modeling the Amyloid Protofibril Formation. J. Phys. Chem. B 2014, 118, 1189–1197. 10.1021/jp4083294. [DOI] [PubMed] [Google Scholar]
- Naiki H.; Higuchi K.; Hosokawa M.; Takeda T. Fluorometric Determination of Amyloid Fibrils in Vitro Using the Fluorescent Dye, Thioflavin T1. Anal. Biochem. 1989, 177, 244–249. 10.1016/0003-2697(89)90046-8. [DOI] [PubMed] [Google Scholar]
- Maskevich A. A.; Stsiapura V. I.; Kuzmitsky V. A.; Kuznetsova I. M.; Povarova O. I.; Uversky V. N.; Turoverov K. K. Spectral Properties of Thioflavin T in Solvents with Different Dielectric Properties and in a Fibril-Incorporated Form. J. Proteome Res. 2007, 6, 1392–1401. 10.1021/pr0605567. [DOI] [PubMed] [Google Scholar]
- LeVine H. Thioflavine T Interaction with Amyloid β-Sheet Structures. Amyloid 1995, 2, 1–6. 10.3109/13506129509031881. [DOI] [Google Scholar]
- Seifert E. OriginPro 9.1: Scientific Data Analysis and Graphing Software—Software Review. J. Chem. Inf. Model. 2014, 54, 1552. 10.1021/ci500161d. [DOI] [PubMed] [Google Scholar]
- Fotopoulos C.; Kafetzopoulos D.; Gotzamani K. Critical Factors for Effective Implementation of the HACCP System: A Pareto Analysis. Br. Food J. 2011, 113, 578–597. 10.1108/00070701111131700. [DOI] [Google Scholar]
- Münch C.; Bertolotti A. Exposure of Hydrophobic Surfaces Initiates Aggregation of Diverse ALS-Causing Superoxide Dismutase-1 Mutants. J. Mol. Biol. 2010, 399, 512–525. 10.1016/j.jmb.2010.04.019. [DOI] [PMC free article] [PubMed] [Google Scholar]
- Kyte J.; Doolittle R. F. A Simple Method for Displaying the Hydropathic Character of a Protein. J. Mol. Biol. 1982, 157, 105–132. 10.1016/0022-2836(82)90515-0. [DOI] [PubMed] [Google Scholar]
- Pettersen E. F.; Goddard T. D.; Huang C. C.; Couch G. S.; Greenblatt D. M.; Meng E. C.; Ferrin T. E. UCSF Chimera—A Visualization System for Exploratory Research and Analysis. J. Comput. Chem. 2004, 25, 1605–1612. 10.1002/jcc.20084. [DOI] [PubMed] [Google Scholar]
- Lamiable A.; Thévenet P.; Rey J.; Vavrusa M.; Derreumaux P.; Tufféry P. PEP-FOLD3: Faster de Novo Structure Prediction for Linear Peptides in Solution and in Complex. Nucleic Acids Res. 2016, 44, W449–W454. 10.1093/nar/gkw329. [DOI] [PMC free article] [PubMed] [Google Scholar]
- Sereda T. J.; Mant C. T.; Sönnichsen F. D.; Hodges R. S. Reversed-Phase Chromatography of Synthetic Amphipathic Alpha-Helical Peptides as a Model for Ligand/Receptor Interactions. Effect of Changing Hydrophobic Environment on the Relative Hydrophilicity/Hydrophobicity of Amino Acid Side-Chains. J. Chromatogr. A 1994, 676, 139–153. 10.1016/0021-9673(94)00371-8. [DOI] [PubMed] [Google Scholar]
- Dong A.; Huang P.; Caughey W. S. Protein Secondary Structures in Water from Second-Derivative Amide I Infrared Spectra. Biochemistry 1990, 29, 3303–3308. 10.1021/bi00465a022. [DOI] [PubMed] [Google Scholar]
- Sarroukh R.; Goormaghtigh E.; Ruysschaert J. M.; Raussens V. ATR-FTIR: A “Rejuvenated” Tool to Investigate Amyloid Proteins. Biochim. Biophys. Acta, Biomembr. 2013, 1828, 2328–2338. 10.1016/j.bbamem.2013.04.012. [DOI] [PubMed] [Google Scholar]
- Moran S. D.; Zanni M. T. How to Get Insight into Amyloid Structure and Formation from Infrared Spectroscopy. J. Phys. Chem. Lett. 2014, 5, 1984–1993. 10.1021/jz500794d. [DOI] [PMC free article] [PubMed] [Google Scholar]
- Yang W.-J.; Griffiths P. R.; Byler D. M.; Susi H. Protein Conformation by Infrared Spectroscopy: Resolution Enhancement by Fourier Self-Deconvolution. Appl. Spectrosc. 1985, 39, 282–287. 10.1366/0003702854248917. [DOI] [Google Scholar]
- Byler D. M.; Susi H. Examination of the Secondary Structure of Proteins by Deconvolved FTIR Spectra. Biopolymers 1986, 25, 469–487. 10.1002/bip.360250307. [DOI] [PubMed] [Google Scholar]
- Susi H.; Timasheff S. N.; Stevens L. Infrared Spectra and Protein Conformations in Aqueous Solutions I. The Amide I Band In H2O And D2O Solutions. J. Biol. Chem. 1967, 242, 5460–5466. [PubMed] [Google Scholar]
- Kong J.; Yu S. Fourier Transform Infrared Spectroscopic Analysis of Protein Secondary Structures. Acta Biochim. Biophys. Sin. 2007, 39, 549–559. 10.1111/j.1745-7270.2007.00320.x. [DOI] [PubMed] [Google Scholar]
- Goldberg M. E.; Chaffotte A. F. Undistorted Structural Analysis of Soluble Proteins by Attenuated Total Reflectance Infrared Spectroscopy. Protein Sci. 2005, 14, 2781–2792. 10.1110/ps.051678205. [DOI] [PMC free article] [PubMed] [Google Scholar]
- Dong A. C.; Huang P.; Caughey W. S. Redox-Dependent Changes in Beta-Extended Chain and Turn Structures of Cytochrome c in Water Solution Determined by Second Derivative Amide I Infrared Spectra. Biochemistry 1992, 31, 182–189. 10.1021/bi00116a027. [DOI] [PubMed] [Google Scholar]
- Venyaminov S. Y.; Kalnin N. N. Quantitative IR spectrophotometry of peptide compounds in water (H2O) solutions. I. Spectral parameters of amino acid residue absorption bands. Biopolymers 1990, 30, 1243–1257. 10.1002/bip.360301309. [DOI] [PubMed] [Google Scholar]
- Speare J. O.; Rush T. S. IR Spectra of Cytochrome c Denatured with Deuterated Guanidine Hydrochloride Show Increase in β Sheet. Biopolymers 2003, 72, 193–204. 10.1002/bip.10337. [DOI] [PubMed] [Google Scholar]
- Klose D. P.; Wallace B. A.; Janes R. W. 2Struc: The Secondary Structure Server. Bioinformatics 2010, 26, 2624–2625. 10.1093/bioinformatics/btq480. [DOI] [PMC free article] [PubMed] [Google Scholar]
- Buchan D. W. A.; Minneci F.; Nugent T. C. O.; Bryson K.; Jones D. T. Scalable Web Services for the PSIPRED Protein Analysis Workbench. Nucleic Acids Res. 2013, 41, W349–W357. 10.1093/nar/gkt381. [DOI] [PMC free article] [PubMed] [Google Scholar]
- Wang S.; Peng J.; Ma J.; Xu J. Protein Secondary Structure Prediction Using Deep Convolutional Neural Fields. Sci. Rep. 2016, 6, 18962 10.1038/srep18962. [DOI] [PMC free article] [PubMed] [Google Scholar]
- Dzwolak W.; Muraki T.; Kato M.; Taniguchi Y. Chain-Length Dependence of α-Helix to β-Sheet Transition in Polylysine: Model of Protein Aggregation Studied by Temperature-Tuned FTIR Spectroscopy. Biopolymers 2004, 73, 463–469. 10.1002/bip.10582. [DOI] [PubMed] [Google Scholar]
- Shivu B.; Seshadri S.; Li J.; Oberg K. A.; Uversky V. N.; Fink A. L. Distinct β-Sheet Structure in Protein Aggregates Determined by ATR-FTIR Spectroscopy. Biochemistry 2013, 52, 5176–5183. 10.1021/bi400625v. [DOI] [PubMed] [Google Scholar]
- Juszczyk P.; Kolodziejczyk A. S.; Grzonka Z. FTIR Spectroscopic Studies on Aggregation Process of the β-Amyloid 11–28 Fragment and Its Variants. J. Pept. Sci. 2009, 15, 23–29. 10.1002/psc.1085. [DOI] [PubMed] [Google Scholar]
- Ghosh D.; Singh P. K.; Sahay S.; Jha N. N.; Jacob R. S.; Sen S.; Kumar A.; Riek R.; Maji S. K. Structure Based Aggregation Studies Reveal the Presence of Helix-Rich Intermediate during α-Synuclein Aggregation. Sci. Rep. 2015, 5, 9228 10.1038/srep09228. [DOI] [PMC free article] [PubMed] [Google Scholar]
- Ruysschaert J.-M.; Raussens V.. ATR-FTIR Analysis of Amyloid Proteins. In Peptide Self-Assembly; Nilsson B., Doran T., Eds.; Methods in Molecular Biology; Humana Press: New York, 2018; Vol. 1777, pp 69–81. [DOI] [PubMed] [Google Scholar]
- Gowda C.; Zandomeneghi G.; Zimmermann H.; Schütz A. K.; Böckmann A.; Ernst M.; Meier B. H. The Conformation of the Congo-Red Ligand Bound to Amyloid Fibrils HET-s(218–289): A Solid-State NMR Study. J. Biomol. NMR 2017, 69, 207–213. 10.1007/s10858-017-0148-z. [DOI] [PubMed] [Google Scholar]
- Girych M.; Gorbenko G.; Maliyov I.; Trusova V.; Mizuguchi C.; Saito H.; Kinnunen P. Combined Thioflavin T-Congo Red Fluorescence Assay for Amyloid Fibril Detection. Methods Appl. Fluoresc. 2016, 4, 034010 10.1088/2050-6120/4/3/034010. [DOI] [PubMed] [Google Scholar]
- Clement C. G.; Truong L. D. An Evaluation of Congo Red Fluorescence for the Diagnosis of Amyloidosis. Hum. Pathol. 2014, 45, 1766–1772. 10.1016/j.humpath.2014.04.016. [DOI] [PubMed] [Google Scholar]
- Mitchell A. R. Bruce Merrifield and Solid-Phase Peptide Synthesis: A Historical Assessment. Biopolymers 2008, 90, 175–184. 10.1002/bip.20925. [DOI] [PubMed] [Google Scholar]
- Wang S.-S. P-Alkoxybenzyl Alkohol Resin and p-Alkoxybenzylcarbonhydrazide Resin for Solid Phase Synthesis of Protected Peptide Fragments. J. Am. Chem. Soc. 1972, 21, 1328–1333. 10.1021/ja00785a052. [DOI] [PubMed] [Google Scholar]
Associated Data
This section collects any data citations, data availability statements, or supplementary materials included in this article.


